Palaeoproteomic analysis of pleistocene cave hyenas from east Asia
←
→
Page content transcription
If your browser does not render page correctly, please read the page content below
www.nature.com/scientificreports
OPEN Palaeoproteomic analysis
of Pleistocene cave hyenas
from east Asia
Huiyun Rao1,2,3*, Yimin Yang4, Jinyi Liu1,2*, Michael V. Westbury5, Chi Zhang1,2 &
Qingfeng Shao6
The spotted hyena (Crocuta crocuta) is the only extant species of the genus Crocuta, which
once occupied a much wider range during the Pliocene and Pleistocene. However, its origin and
evolutionary history is somewhat contentious due to discordances between morphological, nuclear,
and mitochondrial data. Due to the limited molecular data from east Asian Crocuta, also known as
cave hyena, and the difficulty of extracting ancient DNA from this area, here we present proteomic
analysis of cave hyenas from three locations in northern China. This marks the first proteomic data
generated from cave hyenas, adding new molecular data to the east Asian populations. Phylogenetic
analysis based on these protein sequences reveals two different groups of cave hyenas in east
Asia, one of which could not be distinguished from modern spotted hyenas from northern Africa,
tentatively the result of previously suggested gene flow between these lineages. With developments
of instrumentation and analytical methods, proteomics holds promising potential for molecular
phylogenetic reconstructions of ancient fauna previously thought to be unreachable using ancient
DNA.
Hyenas are feliform carnivoran mammals belonging to the family Hyaenidae, and originated in Early Miocene
Eurasia (around 23–16 Ma). They reached the peak of their diversity during the Late Miocene (about 12–6 Ma),
with approximately 100 fossil species found over Eurasia, Africa and North America1,2. However, since then, the
distribution and diversity of hyenas have dramatically declined, with only four extant species remaining in Africa
and southwest Asia (spotted hyena (Crocuta crocuta), striped hyena (Hyaena hyaena), brown hyena (Parahyena
brunnea), and aardwolf (Proteles cristatus))3. The species that has gained the most systematic and evolutionary
interest is the spotted hyena (Crocuta crocuta)4,5.
Although spotted hyenas are currently restricted to sub-Saharan Africa, this genus once inhabited almost
the entire Eurasian continent during the Pliocene and Pleistocene, and comprised a variety of species, such as
Crocuta dietrichi, C. eturono, C. honanensis, and the so-called Eurasian cave hyenas (which is further split into
Asian and European lineages)1,2,6. As Eurasian cave hyenas are morphologically similar to extant spotted hyenas
(C. crocuta), their taxonomic classifications have met contention. Cave hyenas have been considered either as a
separate species from African spotted hyenas (C. ultima and C. spelaea) or as subspecies (C. crocuta ultima and C.
crocuta spelaea)1,7. Furthermore, a recent study on the fossil hyena remains recovered from Geographical Society
Cave in eastern Russia proposed the existence of two chronosubspecies, i.e. C. ultima ultima from the Middle
Pleistocene of China and C. u. ussurica from the Late Pleistocene of the Russian Far East and C hina8. Moreover,
the exact origins and evolutionary history of Crocuta have met with debate. Based on morphological analysis, it
is unclear whether they originated in Africa or Asia and how they spread throughout Africa, Europe and A sia9.
Ancient DNA has recently been applied to cave hyena subfossils to provide molecular insights in an attempt
to resolve the issues mentioned above (Fig. 1). Several publications based on mitochondrial DNA revealed that
1
Key Laboratory of Vertebrate Evolution and Human Origins, Institute of Vertebrate Paleontology and
Paleoanthropology, Chinese Academy of Sciences, Beijing 100044, China. 2CAS Center for Excellence in Life
and Paleoenvironment, Beijing 100044, China. 3State Key Laboratory of Palaeobiology and Stratigraphy,
Nanjing Institute of Geology and Palaeontology, Chinese Academy of Sciences, Nanjing 210008,
China. 4Department of Archaeology and Anthropology, University of Chinese Academy of Sciences, Beijing 100049,
China. 5Section for Evolutionary Genomics, The GLOBE Institute, University of Copenhagen, Øster Farimagsgade
5–7, 1353 København K, Denmark. 6College of Geographical Science, Nanjing Normal University, Nanjing 210023,
China. *email: raohuiyun@ivpp.ac.cn; liujinyi@ivpp.ac.cn
Scientific Reports | (2020) 10:16674 | https://doi.org/10.1038/s41598-020-73542-x 1
Vol.:(0123456789)www.nature.com/scientificreports/
Figure 1. The phylogenetic relationships of modern spotted hyenas and cave hyenas based on different aDNA
datasets: (a) short mitochondrial DNA fragments (366 bp of cyt b sequences)10,11, (b) complete mitochondrial
genomes12, and (c) nuclear g enomes12. All the analyzed samples from Africa were modern spotted hyenas and
all the analyzed samples from Eurasia were Late Pleistocene cave hyenas. The figure was generated using Adobe
Illustrator CC 2015 (https://www.adobe.com/cn/products/illustrator.html).
western Eurasian cave hyenas are divided into two groups with one group intermingled with northern African
spotted hyenas, while east Asian cave hyenas form a basal diverging lineage10–12. As to the origin and evolutionary
history of spotted hyena fossils, Rohland et al.10 suggested three separate dispersal events out of Africa to Eurasia
between 3.5 and 0.35 Ma, while Sheng et al.11 proposed an Eurasian origin at a far more recent evolutionary
timescale (430–163 kya). These mitochondrial findings were later debunked by Westbury et al.12 who investigated
the relationships between African spotted hyenas and Eurasian cave hyenas using ancient nuclear genomes. The
nuclear genome results showed that spotted and cave hyenas form reciprocally monophyletic clades. When these
results were interpreted together with the fossil record, they suggested an African origin followed by a dispersal
into Eurasia shortly after 2.52 Ma. Moreover, they found evidence for several instances of bidirectional gene flow
between the modern African populations and European cave hyenas12. However, due to the requirement of a
putatively unadmixed comparative population in their analyses, it is unclear whether gene flow from Africa into
Asia also occurred. The obscure evolutionary history of Asian populations could be caused by the limited number
Scientific Reports | (2020) 10:16674 | https://doi.org/10.1038/s41598-020-73542-x 2
Vol:.(1234567890)www.nature.com/scientificreports/
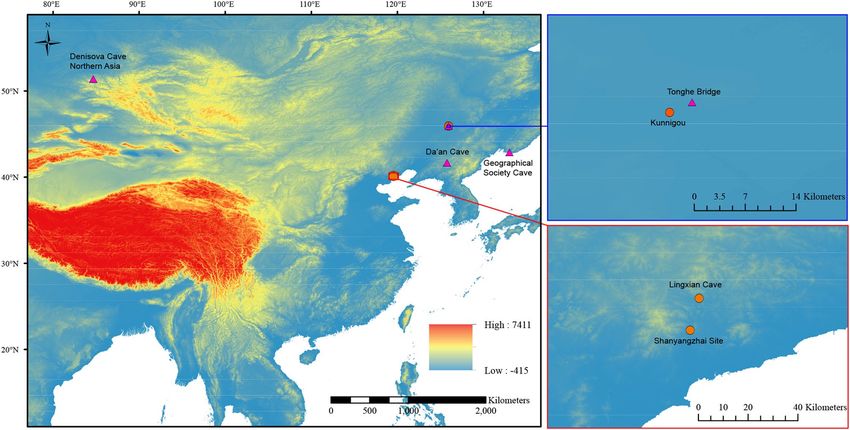
Figure 2. Geographical locations of cave hyenas with molecular data from Asia. The filled circles represent the
three localities in this study that successfully provided proteomic data. The filled triangles represent the localities
where genetic analyses have been successfully employed 10–12. Except Denisova Cave, located in northern Asia,
all the other localities are in east Asia. Both Tonghe Bridge and Kunnigou are located in Zhaodong County,
Heilongjiang Province. Both Lingxian Cave and Shanyangzhai Site are located in Qinhuangdao City, Hebei
Province. The map was generated using ArcMap v10.2 (https://www.esri.com/software/arcgis/arcgis-for-deskt
op) on the basis of SRTM data courtesy of the U.S. Geological Survey (https://landsat.usgs.gov).
of samples analyzed so far (Fig. 2). Therefore, the question of whether there actually was gene flow between the
Asian cave hyenas and other lineages is still unresolved. Furthermore, are there different lineages in east Asia,
similar to what was uncovered in the European cave hyenas? To resolve these uncertainties, more molecular data
is required from a wider sample set of east Asian individuals.
Recently, palaeoproteomic analyses have been successfully employed to resolve the phylogenetic relation-
ships between extinct and extant mammalian taxa13–17. Moreover, ancient proteins are more resistant to diagen-
esis and could preserve longer than aDNA allowing the molecular study of extinct species past the reach of
aDNA18,19. Collagen, which comprises the majority of the organic fraction of vertebrate bone and dentine, could
not only be detected in mammalian fossils as old as mid-Pliocene (3.5 Ma)20, but also be recovered from tropi-
cal and subtropical a reas13,16. Unlike bone/dentine which is an open system, enamel and eggshell have bigger
mineral crystals which entrap proteins and behave as a closed s ystem21. The degradation of these entrapped
proteins is rarely influenced by other factors except time and temperature, which makes it possible to generate
authentic proteins from warmer areas and from much older a ges22–24. Previous phylogenetic analysis based on
ancient protein sequences yielded highly congruent results with those based on aDNA, especially at high level
classifications13–15,25. Therefore, palaeoproteomic analyses have great potential to provide further molecular data
for phylogenetic reconstructions, especially when aDNA is not preserved.
Cave hyenas (C. ultima) survived in China from the Middle Pleistocene to the Early H olocene26. Dozens of
fossil sites containing this species have been discovered, providing a massive amount of material for r esearch27.
However, some localities are not favorable for aDNA preservation, for example, aDNA failed to be extracted from
samples of Lingxian Cave, Qinhuangdao City, Hebei Province, despite multiple a ttempts11. Here, we acquired, for
the first time, palaeoproteomic data from cave hyenas of three localities in northern China (including Lingxian
Cave). We performed phylogenetic analyses on the recovered protein sequences and provided further informa-
tion to the evolutionary history of east Asian cave hyena populations.
Studied localities and related samples
We collected four cave hyenas (two skulls and two mandibles with teeth) from three Pleistocene localities in
northern China (Fig. 2 and Table 1). The two skulls were sent for radiocarbon dating at Beta Analytic Test-
ing Laboratory. The sample from Kunnigou, Zhaodong County (coded as HZD) was AMS-dated greater than
43.5 kya (conventional radiocarbon age), but the sample from Shanyangzhai site (coded as SYZ) failed to be
AMS-dated. Through faunal comparison, the chronology of Shanyangzhai site was inferred as Middle and Late
Pleistocene28,29. The two mandibles with teeth (LXD-1 and LXD-2) were discovered from Lingxian Cave, which
is also in Qinhuangdao City, 15 km away from the Shanyangzhai site30. Samples from both bone and dentine were
taken from the mandibles and teeth respectively (abbreviated as LXD-1B, LXD-1D, LXD-2B, and LXD-2D). For
Scientific Reports | (2020) 10:16674 | https://doi.org/10.1038/s41598-020-73542-x 3
Vol.:(0123456789)www.nature.com/scientificreports/
Sample code Provenance Age Element Am/P IRSF N wt% C wt% C:N ratio α-value * Coverage (%)#
Kunnigou, Zhaodong County, Hei-
HZD > 43.5 kya ( AMS14C) Skull 0.14 3.59 3.37 10.53 3.64 0.75 95.7
longjiang Province
Shanyangzhai site, Qinhuangdao
SYZ Middle and Late Pleistocene Skull 0.03 5.30 0.52 5.10 11.37 0.19 89.8
City, Hebei Province
Lingxian Cave, Qinhuangdao City,
LXD-1B > 94.4 kya (U-series) Mandible 0.02 4.74 0.18 5.11 32.53 0.06
Hebei Province
Lingxian Cave, Qinhuangdao City,
LXD-1D > 94.4 kya (U-series) Tooth 0.02 4.76 0.13 3.86 33.93 n.d
Hebei Province
79.6
Lingxian Cave, Qinhuangdao City,
LXD-2B > 99.0 kya (U-series) Mandible 0.02 4.50 0.13 3.67 32.09 n.d
Hebei Province
Lingxian Cave, Qinhuangdao City,
LXD-2D > 99.0 kya (U-series) Tooth 0.02 4.83 0.26 4.32 19.72 n.d
Hebei Province
Table 1. The diagenetic parameters obtained by FTIR, elemental and ZooMS analyses and the coverage of
type I collagen. *The value (between 0.0 and 1.0) shows the level of undeamidated glutamine, with 0.0 being
totally deamidated and 1.0 being not deamidated at all. n.d. indicates that the α-value failed to be calculated
due to poor signal of the peptide in the PMF spectrum. # This value represents the coverage of type I collagen
when the raw datafiles were searched against the custom carnivorous type I collagen database. It is higher than
the coverages of COL1A1 and COL1A2 displayed in Table 2 because the signal peptides and propeptides were
removed and these regions rarely survived in our fossil samples.
both LXD-1 and LXD-2, three powdered samples were also drilled from the dentine for U-series dating using
MC-ICPMS31 at Nanjing Normal University which yielded dates of 94.6 ± 0.2, 89.8 ± 0.2 and 92.5 ± 0.2 kya for
LXD-1 and 99.2 ± 0.2, 99.0 ± 0.2 and 98.5 ± 0.2 kya for LXD-2. Given that the measured uranium was incorporated
into the dentine after their burial; the U-series dates must be regarded as minimum age estimates for the cor-
responding mandibles32. To make our expressions clearer, hereafter we regard all the specimens from Lingxian
Cave as one sample, and specific specimens like LXD-1B, LXD-1D, LXD-2B, and LXD-2D as its subsamples.
After mechanically cleaning the exterior surface, the samples were ground into powder and divided into two
aliquots, one used in the following analyses, and one to be stored as backup in the freezer at Key Laboratory of
Vertebrate Evolution and Human Origins, IVPP for possible further analyses.
Results and discussion
Prescreening of the collagen preservation. ATR-FTIR (Attenuated total reflectance-Fourier trans-
form infrared) analysis, elemental analysis, and ZooMS screening (Zooarchaeology by mass spectrometry)
were employed to assess the preservation of collagen in the samples from three sites. The results of diagenetic
parameters are displayed in Table 1. The infrared splitting factor (IRSF, defined in r eference33), and the amide
to phosphate ratio (Am/P, defined in r eference34), were calculated based on the ATR spectra (Supplementary
Figs. S9–14). The IRSF represents the crystalline structure of bones, and higher IRSF value indicates an increase
of crystal size and order, which is related to the degradation of bone p roteins33,34. After analyzing 195 bones
35
excavated from 32 sites, Smith et al. suggested that extremely degraded/burnt bone would have IRSF values
in excess of 4.0, which is in the case of samples from Shanyangzhai site (SYZ, hereafter represented as the SYZ
sample) and Lingxian Cave (i.e. LXD-1B, LXD-1D, LXD-2B, and LXD-2D subsamples, here after referred to
as the LXD sample). A lower IRSF value (3.59) of the sample from Kunnigou, Zhaodong County, Heilongjiang
Province (HZD, hereafter represented as the HZD sample), indicates better preservation of collagen. The Am/P
measures the relative content of collagen versus mineral apatite, and this parameter is confirmed to be positively
correlated with the organic material or nitrogen content in the whole bone or dentine samples34,36. Several pub-
lications have reported the Am/P values of modern bones ranging from 0.16 to 0.4236–38. Chowdhury et al.39 also
suggested that in combination with the position of the amide I peak, Am/P above 0.07 could be considered as an
indicator of successful extraction of soluble collagen with ammonium bicarbonate protocol in ZooMS screening.
In contrast to the HZD sample with a high Am/P value of 0.14, the SYZ sample had a low Am/P value of 0.03
while the LXD sample has an even lower average value of 0.02. The Am/P measurement validates the collagen
preservation of the three sites predicted by IRSF.
The nitrogen content (N wt%) and the carbon:nitrogen atomic ratio (C:N ratio) of the whole bone are regu-
larly used as indicators of collagen preservation before radiocarbon m easurements40. According to Brock et al.40,
the HZD sample has a N wt% above 3.0 and C:N ratio between 3.0 and 3.9, which suggests a probability of 100%
and 92% respectively to successfully extract sufficient collagen for radiocarbon dating, i.e. > 1% of collagen y ield41.
This sample was successfully AMS-dated. The SYZ and LXD samples present much lower N wt% and higher C:N
ratio, which was probably caused by the diagenesis effect in the following two mechanisms. Firstly, prolonged
diagenesis leaded to the loss of collagen and the change of the amino acid composition, which in turn reduced the
N wt% and increased the C:N ratio42. Moreover, the invasion of exogenous carbonate from groundwater or soil
water after burial increased C wt% in the whole bone43. Similarly based on the criteria generated by Brock et al.40,
the LXD sample has the worst collagen preservation, giving them little to no chance to be AMS-dated. The SYZ
sample has a low probability to extract sufficient collagen, and we were unable to radiocarbon date this sample.
ZooMS screening reveals differences in the collagen spectral quality between samples. Of all the samples
in the current study, the HZD and SYZ samples have higher quality of collagen spectra compared to the LXD
sample (Supplementary Figs. S15–17). Except for the LXD-1B subsample, the other three LXD subsamples
Scientific Reports | (2020) 10:16674 | https://doi.org/10.1038/s41598-020-73542-x 4
Vol:.(1234567890)www.nature.com/scientificreports/
Figure 3. Deamidation frequencies of the identified Pleistocene proteins used in cluster analysis for the (a)
SYZ, (b) HZD and (c) LXD sample. 0% indicates no deamidation and 100% indicates complete deamidation.
Black triangles represent contaminating proteins, and circles represent endogenous proteins, with their gene
names labelled beside. Note that some proteins have the same or close NQ observations and deamidation values,
their circles or triangles are overlapped. The figure was generated using RStudio v1.2.1335 (https://rstudio.com/
products/rstudio/).
rarely displayed effective peaks. Based on the definition in reference44, we calculated the deamidation extent
(represented as α-value) of a peptide biomarker at m/z 1105 to demonstrate the diagenetic alteration (P 1105,
GVQGPPGPAGPR-hydroxylated at position 6 (underlined), common biomarker in terrestrial m ammals45).
Except for three of the LXD subsamples, whose α-values failed to be calculated due to poor signal of the peptide
in the PMF spectrum, the results of the other three (sub)samples are presented in Table 1. The HZD sample has
a lower deamidation level than the SYZ and LXD samples, which also suggests its better collagen preservation.
Summarizing all the prescreening results, it could be inferred that the HZD sample is well preserved with
a good collagen signal. On the contrary, the SYZ and LXD samples (especially the LXD sample) have under-
gone more diagenetic alteration. However, there are still collagen signals with lower content. All the samples
were loaded on the LC–MS/MS analysis with two enzyme digestions to more accurately perform protein
identifications.
Proteome composition and the authenticity of recovered proteins. Combining analyses from
two enzymes (trypsin and elastase), we were able to generate high coverages of type I collagen sequences for the
SYZ sample (89.8%), the HZD sample (95.7%) and the LXD sample (79.6%) (Table 1). The comparable results
agree well with the collagen preservation estimated by the above prescreening analyses. It is noteworthy that a
good coverage of sequence was still recovered from the LXD sample even though it presented extensive diagen-
esis. This shows the high preservation potential of collagen for phylogenetic analysis.
In addition to type I collagen, other types of collagens and NCPs (non-collagenous proteins) were also
detected in these samples (Fig. 3, Supplementary Tables S1–3). The extent of deamidation has recently been
considered as a marker of diagenetic alteration and used to provide support for the authenticity of ancient
sequences46. Here we calculated the deamidation frequencies for each protein quantitatively, based on the sum
ion intensities of deamidated and undeamidated glutamine (Q)/asparagine (N) spectra. However, most of the
spectra containing glutamine and asparagine positions in these proteins were not abundant enough for quanti-
tative analysis. The deamidation frequencies could only be calculated for 26 proteins from the SYZ sample, 84
from the HZD sample and 27 from the LXD sample, among which the proteins suitable for cluster analysis (i.e.
with more than two glutamine or asparagine positions covered) were even fewer. With group number set as 2,
the cluster analysis results in a clear separation of endogenous and contaminating proteins (Fig. 3).
For the SYZ sample, only 12 proteins were chosen for cluster analysis. The first group of 7 proteins displays
a low deamidation value (6.0% ± 5.7), including known protein contaminants (6 human skin keratins) and 1
added digestive enzyme (elastase, i.e. chymotrypsin-like elastase family member 1 (CELA1)), which comprise the
exogenous protein group (Fig. 3a). In contrary, the other group of 5 proteins has obviously elevated deamidation
frequencies ranging between 63 and 100%, including 4 collagens (COL1A1, COL1A2, COL2A1, COL11A1) and 1
NCP (AHSG), which have been reported to survive over the Early Pleistocene in paleontological and archaeologi-
cal bone/dentine samples19,47. This group could be attributed as endogenous proteins. Among the other proteins
which have none or only few (≤ 2) of the glutamine/asparagine positions covered by PSMs (peptide-spectrum
matches), several proteins could be potentially considered as endogenous because of their endogeneity attribution
in another sample of this study (the HZD sample), previous palaeoproteomic p ublications15,48, and the complete
deamidation of the few glutamine/asparagine observations (COL3A1, COL4A3, COL4A4, COL5A1, COL5A2,
COL9A1, COL16A1, POSTN, SERPINF1, etc.). The proteome composition and deamidation range of the LXD
sample are similar to those of the SYZ sample (Fig. 3c).
For the HZD sample, the recovered proteome is more complex (Fig. 3b). The deamidation frequencies of
30 proteins were used in a cluster analysis. Except one protein (TRYP_PIG) with a low deamidation value
(11%) which is one of the two digestive enzymes added during the protein extraction procedure, the other 29
proteins comprise a group with elevated deamidation values ranging between 40 and 100%. Bone proteins with
Scientific Reports | (2020) 10:16674 | https://doi.org/10.1038/s41598-020-73542-x 5
Vol.:(0123456789)www.nature.com/scientificreports/
Proteins Score Coverage (%) Peptides Unique peptides PSM NQ count* Deamidation
SYZ
COL1A1 380.1 67 537 507 1915 36 0.97
COL1A2 322.88 60 347 343 991 31 0.94
AHSG 44.95 8 1 1 20 4 0.63
SERPINF1 41.46 9 2 2 5 1 1
HZD
COL1A1 403.2 73 657 618 3618 39 0.71
COL1A2 384.74 71 478 471 1940 42 0.58
AHSG 255.03 62 89 15 388 17 0.72
BGN 193.34 49 40 40 178 22 0.72
CHAD 204.81 53 42 4 197 23 0.45
CLEC3B 109.38 45 7 7 13 7 0.77
OMD 191.16 33 32 14 166 14 0.72
SERPINF1 252.16 53 68 11 232 11 0.59
SPARC 156.16 35 22 6 63 7 0.78
VTN 179.56 32 38 16 107 7 0.43
LXD
COL1A1 301.29 58 415 388 2745 30 0.97
COL1A2 280.94 53 257 255 1299 31 0.99
AHSG 106.94 20 11 11 107 7 0.68
SERPINF1 67.6 19 5 5 11 2 1
VTN 28.49 2 1 1 2 2 0.78
Table 2. The detailed information of the 10 proteins used to construct the phylogenetic datasets. *This value
represents the number of observed glutamines (Q) and asparagines (N) which have sufficient ion intensities for
the deamidation calculation.
different functions were detected in this group, including collagens (COL1A1, COL1A2, COL5A1, etc.), extra
cellular matrix proteins related to bone (CHAD, CLEC3B, MGP, OMD, VTN, etc.), calcium (AHSG, ASPN,
SPARC, etc.) and fibril (BGN, LUM, DCN, etc.), plasma protein (ALB), and intracellular protein (MYO1B).
Most of these proteins are common bone/dentine proteins previously reported in ancient bone proteomes, and
the elevated deamidation values confirm their endogeneity48,49. Similarly, some proteins excluded from cluster
analysis, such as COL2A1, COL3A1, OGN, PROC, SPP2, could also be interpreted as endogenous to the analyzed
bone sample15,49,50. The deamidation frequencies of COL1A1 and COL1A2 in the HZD sample were 71% and
58% respectively, which are significantly lower than those in the SYZ and LXD samples (over 90%) (Table 2). It
indicates a decline in protein preservation for the SYZ and LXD samples, which is consistent with their decreased
proteome complexity, dominated by type I collagen. This tendency has been reported previously14,19, which
confirms an endogenous origin of the identified proteins in our study.
However, other than type I collagen, these additional proteins identified here have not been commonly used
in phylogenetic analysis, partly because their sequence coverages are comparatively low compared to type I col-
lagen. To obtain more complete sequences, 10 endogenous proteins with a coverage of over 30% in any of the
three samples were chosen to generate the phylogenetic datasets (Table 2). Two datasets were constructed, one
including only type I collagen (see Method, Supplementary Fasta File S1), and the other including 8 additional
NCPs, i.e. AHSG, BGN, CHAD, CLEC3B, OMD, SERPINF1, SPARC and VTN (see Method, Supplementary
Fasta File S2). The protein sequence sources of the comparative datasets are displayed in Supplementary Table S4,
including accession numbers from Genbank/Uniprot and associated genome/proteome publications. It is notable
that only the protein sequences translated from high coverage genomes were included in these datasets, as those
translated from low coverage genomes (< 10x) were less reliable.
Phylogenetic reconstruction. Our genomic/proteomic datasets are the most extensive protein sequence
datasets available for Hyaenidae so far. Although type I collagen sequence for modern spotted hyena has once
been reported in reference48, a reanalysis of their raw data against our proteomic database, resulted in a concate-
nated sequence without any amino acid substitutions compared to the sequences of modern spotted hyenas from
northern Africa (see Supplementary information). However, the geographic location of this sample is unknown.
Thus, this proteomic sample was excluded in our phylogenetic analysis.
We built several phylogenetic trees using parsimony and Bayesian methods based on two datasets, which
result in largely concordant topologies within the Hyaenidae clade (Fig. 4, Supplementary Figs. S3 and S4). In
these trees, the Namibian individual forms a clade basal to the other modern and fossil spotted hyenas, where
the cave hyenas from China are divided into two clades. HZD and LXD form a monophyletic clade while SYZ
groups with modern spotted hyenas from northern Africa (Ghana and Somalia). The phylogenies based on
protein data are discordant with the results generated from nuclear g enomes12, where cave hyenas from Eurasia
and modern spotted hyenas from Africa form reciprocal monophyletic clades. The discordance between nuclear
Scientific Reports | (2020) 10:16674 | https://doi.org/10.1038/s41598-020-73542-x 6
Vol:.(1234567890)www.nature.com/scientificreports/
Figure 4. Time-scaled maximum clade credibility tree estimated using BEAST and a concatenated alignment
of 10 proteins from 8 extant and extinct taxa. Posterior Bayesian probabilities are indicated at nodes with a
probability of ≤ 1. Horizontal error bars at each node represent 95% highest posterior density intervals. The
figure was generated using FigTree v1.4.3 (https://tree.bio.ed.ac.uk/software/figtree/).
and mitochondrial phylogenies was interpreted as putative gene fl ow12, which could also fit the case of east Asia
here. The phylogenies constructed from both of our proteomic datasets indicate the Namibian individual as a
basal lineage, which agrees with the result of gene flow analysis, i.e. the Namibian individual contained the fewest
windows of gene flow from cave hyenas compared with other modern i ndividuals12. Moreover, considering the
amino acid substitutions in the Crocuta populations (see Supplementary Information), the Namibian individual
represented the ancestral type of amino acid (Isoleucine, i.e. I) at position 1449 (COL1A2, the position number
was derived from the dataset alignments) while all the other modern and fossil spotted hyenas displayed the
derived type (Valine, i.e. V), with high depth of PSM sequence coverage in the three fossil samples. Additional
phylogenetic analyses without this variable site (all the Hyaenidae individuals called as X at position 1449) result
in different topologies (see Supplementary Information, Supplementary Figs. S5 and S6), especially the placement
of the Namibian individual. It indicates the significant importance of this specific variable site for the gene flow
deduction in our study. However, it is noteworthy that the frequency distribution of different amino acid types (I,
V, possibly other types detected afterwards at position 1449) within Hyaenidae populations remains unclear yet
due to limited number of whole genomes available so far. With more samples analyzed in the future, the phyloge-
netic relationships between modern spotted hyenas and east Asian cave hyenas could be confirmed or modified.
The Bayesian analysis carried out in BEAST indicates that all the analyzed spotted hyenas, including modern
individuals from northern and southern Africa and fossils from east Asia, share the most recent common ancestor
(tMRCA) at ~ 2.77 Ma, which agrees well with the time estimated from nuclear genomes12. Furthermore, based
on the divergence time between the SYZ and the northern African individuals (Fig. 4), we suggested the puta-
tive gene flow could occur sometime before ~ 1.03 Ma (95% highest posterior density interval, 0.23–2.24 Ma).
Combining the genome data with the oldest Crocuta fossil records in Africa (Crocuta dietrichi, 3.63–3.85 Ma)51,
east Asia (Crocuta honanensis, ~ 2 Ma)6 and Europe (~ 0.9 Ma)52, recently Westbury et al.12 suggested a dispersal
Scientific Reports | (2020) 10:16674 | https://doi.org/10.1038/s41598-020-73542-x 7
Vol.:(0123456789)www.nature.com/scientificreports/
from Africa into Eurasia, most likely into Asia, and then followed by subsequent dispersal into Europe from
Asia. The estimated time of putative gene flow between northern African and east Asian populations coincides
with the dispersal from Asia into Europe. However, more evidence is needed to accurately determine whether
this gene flow had any further impact on the European cave hyenas.
Here in our study, we presented the first ancient protein sequences from cave hyenas, providing more molecu-
lar data from new localities and time bins in east Asia. Two different groups were found in the east Asian popula-
tions, partly verifying the two subspecies statement proposed by Baryshnikov based on morphological analyses8.
Even though both the SYZ and LXD cave hyenas were discovered in Qinhuangdao City, they belong to different
groups, which questions the geographic correspondence of cave hyenas. A similar phenomenon could also be
observed in the case of European cave hyenas where the cave hyenas could be separated into two groups without
any obvious temporal or geographic correspondence10–12. Endogenous proteins were successfully extracted from
the locality unfavorable for aDNA preservation (for example, Lingxian Cave), which demonstrates the poten-
tial of palaeoproteomic analysis in phylogenetic reconstructions when DNA cannot be recovered. It could be
employed to resolve more phylogenetic issues in the future, especially the placement of other species that went
extinct much earlier in time, such as Crocuta honanensis, and Pachycrocuta.
Conclusion
In conclusion, multiple approaches were applied to cave hyena samples from three localities in northern China.
Combining the prescreening and proteomic analyses, endogenous proteins have been identified, especially for the
HZD sample, which is well preserved and displays a complex bone proteome. Using the recovered collagen and
NCP sequences, phylogenetic reconstructions suggest a putative gene flow between northern African and east
Asian populations occurred sometime before ~ 1.03 Ma and that there may have been two different groups of east
Asian cave hyenas. Furthermore, our data provides new and fundamental reference data for future comparisons.
With the addition of more samples and more sources of data for phylogenetic reconstructions, we foresee that
the evolutionary history of cave hyenas will be revealed in the future.
Methods
ATR‑FTIR analysis. Attenuated total reflectance-Fourier transform infrared (ATR-FTIR) analysis was
employed to assess the preservation of collagen using a Nicolet 6700 (Thermo Scientific) FTIR spectrometer.
The ATR crystal of the spectrometer was pressed directly on the bone or dentine powder, without any additional
sample treatment. The background was collected before each analysis. Spectra were acquired over the range of
4000–525 cm−1 with a resolution of 4 cm−1 and 32 scans per spectrum. The software OMNIC v8.0 (https://www.
thermofisher.com/order/catalog/product/INQSOF018#/INQSOF018) was applied to analyze the data.
Elemental analysis. Approximately 1 mg of bone or dentine powder was weighed and packed into a tin
capsule for combustion. Carbon (C wt%) and nitrogen (N wt%) contents were measured by a CHNS-O Analyzer
(Flash 2000, Thermo Scientific).
Protein extraction and analysis. Protein extraction. The extraction procedure was modified from
r eferences53,54. In brief, approximately 200 mg of bone or dentine powder was demineralized in 0.6 M HCl.
After demineralization and centrifugation, the acid supernatant was removed. The acid-insoluble residue was
incubated in 200 μl 50 mM ammonium bicarbonate buffer at 65 ℃ for 3 h. After centrifugation, 100 μl of the
supernatant was digested with 3 μl of 0.5 μg μl−1 porcine trypsin (Promega) overnight at 37 °C. The other 100 μl
was dried and resuspended in 100 μl 10 mM Tris HCl solution (PH = 8), and digested with 4 μl of 1 μg μl−1
elastase (Worthington) overnight at 37 °C. Digestion was stopped by adding trifluoroacetic acid (TFA) to a final
concentration of 0.1%. Pierce C18 Pipette Tips (Thermo Scientific) were used for the desalting and elution of
peptides. A small aliquot of the trypsin digest was used for ZooMS screening. All the other trypsin and elastase
digests were dried up for the LC MS/MS analysis respectively. Multiple enzyme digests were used to increase the
overall sequence coverage of identified proteins.
ZooMS. 3 μl of trypsin digest and 3 μl of α-cyano-4-hydroxycinnamic acid matrix solution (1% in 50%
ACN/0.1% TFA (v/v/v)) were mixed together and then spotted in triplicate onto an MTP384 Bruker ground-
steel MALDI target plate. After drying, all the spots were analyzed using a Bruker Autoflex Speed MALDI-TOF/
TOF mass spectrometer (Bruker Daltonics) equipped with a 2000 Hz solid-state Smartbeam Nd:YAG UV laser
(355 nm, Azura Laser AG). Mass spectra were acquired over a range of m/z 600 to 3500. Each spectrum was
recorded from an accumulation of 20 laser scans, with each scan accumulated from 500 laser shots. A mixture
of peptides was used for external calibration (peptide calibration standard II [Bruker Daltonics]: bradykinin 1–7
([M + H]+, m/z 757.3992), angiotensin II ([M + H]+, m/z 1046.5418), angiotensin I ([M + H]+, m/z 1296.6848),
substance P ([M + H]+, m/z 1347.7354), bombesin ([M + H]+, m/z 1619.8223), renin substrate ([M + H]+, m/z
1758.9326), ACTH clip 1–17 ([M + H]+, m/z 2093.0862), ACTH clip 18–39 ([M + H]+, m/z 2465.1983), and
somatostatin 28 ([M + H]+, m/z 3147.4710)). After conversion of the raw files into text files using flexanalysis
3.4 (Bruker), the spectra were processed with the open-source cross-platform software mMass v5.5.0 (www.
mmass.org)55. MALDI-TOF–MS replicates (n = 3) were averaged for the same sample. Peaks were picked with a
S/N threshold of 3.5 and a relative intensity threshold of 0.5% after baseline suppression, smoothing and deiso-
toping were applied. The commonly used peptide markers (P-G)48,53 were manually inspected. In addition, the
deamidation extent (represented as α-value) of a peptide biomarker at m/z 1105 was calculated from a weighted
average of the three replicates of each sample. The details are descripted in reference44 and the code is available
as an R package from GitHub (https://github.com/bioarch-sjh/q2e).
Scientific Reports | (2020) 10:16674 | https://doi.org/10.1038/s41598-020-73542-x 8
Vol:.(1234567890)www.nature.com/scientificreports/
LC–MS/MS. The tandem mass spectrometry analysis was modified from reference56. In brief, the sample re-
dissolved in water was analyzed on an on-line Q Exactive mass spectrometer coupled to an EASY-nano-LC 1200
system (Thermo Fisher Scientific, MA, USA). 1.5 μL of peptide was loaded on a trap column (Thermo Fisher Sci-
entific Acclaim PepMap C18, 100 μm × 2 cm) and an analytical column (Acclaim PepMap C18, 75 μm × 15 cm).
The samples were separated with a 60 min linear gradient, from 5% B (B: 0.1% formic acid in ACN) to 35% B.
The column flow rate was set as 300 nL/min at 40 °C. The electrospray voltage of 2 kV versus the inlet of the mass
spectrometer was used. The mass spectrometer was run under data dependent acquisition mode, and automati-
cally switched between MS and MS/MS mode. The full scan range was set between 300 and 1800 m/z with a
resolution of 70,000, an AGC target of 3e6, a maximum injection time of 60 ms and a dynamic exclusion time
of 10 s. The MS/MS scan was performed at 17,500 resolution with an AGC target of 5e4, a maximum injection
time of 80 ms and a collision energy of 27.
Protein sequence analysis. MS/MS datafiles from the same locality, including trypsin and elastase digestions,
were merged and searched using PEAKS X (https://www.bioinfor.com/peaks-studio/) against a custom carnivo-
rous type I collagen database. The database was generated from Genbank, UniProt, and specific publications,
among which modern hyena sequences were either recovered from previous MS/MS analysis or predicted from
genomes12,48,57. To keep the uniformity of the collagen entries, the COL1A1 and COL1A2 sequences were con-
catenated and signal peptides and propeptides were removed as these regions rarely survive in fossils. Com-
mon contaminants (https://www.thegpm.org/crap/) were also included in the database search. PEAKS searches,
including Peptide de novo, PEAKS DB, and SPIDER, were performed with a fragment ion mass tolerance of
0.05 Da and a parent ion tolerance of 7 ppm, in addition to respective enzyme details (trypsin digestions set
to semiTrypsin and elastase digestions set to NONE). A maximum of two missed cleavages were permitted.
Searches allowed for up to six modifications per peptide, with oxidation (M), hydroxylation (P), hydroxyla-
tion (K), and deamidation (NQ) specified as variable modifications. False discovery rate (FDR) was set at 0.5%
and protein scores were filtered with − 10lgP ≥ 20 and ALC (%) ≥ 50 (de novo only). Each locality (represented
as HZD, SYZ, and LXD, Table 1) generated a potential consensus type I collagen sequence. The sequence was
added into the custom collagen database, and the original data were merged and re-analyzed using PEAKS X
against the new database to confirm the sequence coverage and substitutions. The authenticity of substitutions
was inspected manually based on the criteria established by Presslee et al.16 and Hendy et al.50, i.e. a minimum
of two peptide-spectrum matches (PSMs), the presence of both b and y ions, and the position of hydroxyproline
(for choosing between hydroxyproline-alanine and proline-serine). If it was uncertain to confirm the presence
of a possible substitution, the site was called as ‘X’ (missing sequence).
As no annotated complete genome of the Hyaenidae species was available online at the time, a homologous
proteome from domestic cat (Felis catus; GenBank assembly accession: GCA_000181335; number of protein
sequences = 32,891) was downloaded from Uniprot as a reference database to obtain the bone and dentine pro-
teomes of these Pleistocene samples. The raw data were run against the entire domestic cat proteome database
with the addition of a selected group of common bone and dentine proteins from Carnivora, especially the family
Hyaenidae, which were manually translated from published genomes12,57. Common contaminants were included
in the database as well. The parameters were set the same with those of the collagen database search in PEAKS
X. Protein matches were accepted with − 10lgP ≥ 20 and one unique peptide. PTM profile results could provide
a direct summary of the quantitative information (e.g. abundance of modified and unmodified forms cover-
ing the PTM sites). The deamidation frequencies of each identified protein were calculated based on summed
ion intensities of the (non)deamidated peptides to discriminate endogenous from contaminating proteins. For
each sample, the deamidation frequencies of proteins with more than two glutamine and/or asparagine posi-
tions covered by PSMs were imported into R Studio. Cluster analysis (R package Mclust) was applied to assign
group membership using the deamidation frequency d ata48. Group number was set to 2 and other parameters
remained as default settings.
Phylogenetic analysis. Two comparative datasets were constructed for phylogenetic analyses. Dataset 1
was built using consensus sequences for COL1A1 and COL1A2 obtained by MS/MS analysis of the cave hyenas
from three Pleistocene localities as well as the available type I collagen sequences of extant Feliformia species
from Genbank/Uniprot and associated genome/proteome publications (Supplementary Table S4). Ailuropoda
melanoleuca (giant panda) was set as an outgroup. Dataset 2 included the sequences of 8 endogenous NCPs
(non-collagenous proteins) as well as COL1A1 and COL1A2. The NCPs were included when their sequence cov-
erages were above 30% in at least one of the fossil samples (alpha-2-HS-glycoprotein [AHSG], biglycan [BGN],
chondroadherin [CHAD], tetranectin [CLEC3B], osteomodulin [OMD], pigment epithelium-derived factor
[SERPINF1], osteonectin [SPARC], and vitronectin [VTN]). This dataset comprised 9 entries: three mod-
ern spotted hyenas (Crocuta crocuta) from Africa, three cave hyenas from China, one striped hyena (Hyaena
hyaena), one brown hyena (Parahyena brunnea), and one domestic cat (Felis catus, as an outgroup). Referencing
database sources (with accession numbers) or associated genome publications are displayed in Supplementary
Table S4. The sequences were concatenated and the signal peptides and propeptides of COL1A1 and COL1A2
were removed. For dataset 1, COL1A1 ranged from position 1 to position 1057, and COL1A2 ranged from
1058 to 2098. For dataset 2, the ten proteins were concatenated in the following order: COL1A1 = 1–1057;
COL1A2 = 1058–2098; AHSG = 2099–2462; CHAD = 2463–2821; OMD = 2822–3237; SPARC = 3238–3540;
VTN = 3541–4012; BGN = 4013–4384; CLEC3B = 4385–4586; SERPINF1 = 4587–5003. Leucines (L) were con-
verted into isoleucines (I) as they are isobaric and cannot be discriminated by low energy tandem mass spec-
trometry.
Scientific Reports | (2020) 10:16674 | https://doi.org/10.1038/s41598-020-73542-x 9
Vol.:(0123456789)www.nature.com/scientificreports/
Sequence alignments were performed in MEGA X using the MUSCLE algorithm with default settings, and
then checked manually58. Dataset 1 comprised a total alignment length of 2,098 amino acid positions and data-
set 2 included 5,003 amino acid positions. Three methods were performed on the aligned datasets to verify
the phylogenetic results. Parsimony analysis was conducted through PAUP* version 4.0a (build 167)59, using
a heuristic search with 1000 bootstrap replicates, and generating a 50% majority rule consensus tree. Two sets
of phylogenetic analyses were performed in a Bayesian framework. We first ran PartitionFinder v.2.1.160–62 to
select the most appropriate partitioning schemes and substitution models for our datasets, which were used in
the further phylogenetic analysis. The first set of Bayesian phylogenetic analysis used MrBayes v.3.2.663. Two
Markov chain Monte Carlo (MCMC) runs were performed. Two million generations were run with sampling
every 1,000 generations. Convergence was checked based on the average standard deviation of split frequencies
and the log likelihood values (LnL). Effective sample sizes (ESS) were assessed in TRACER v.1.664. After a 40%
burn-in, all parameters provided an ESS value of greater than 200, showing sufficient sampling. Summarizing
the remaining samples, a 50% majority rule consensus tree was constructed with clade frequencies interpreted
as posterior probabilities.
The other set of Bayesian phylogenetic analysis was performed in BEAST v.2.6.265 to obtain a time calibrated
tree for the ten proteins used in dataset 2. For this analysis, Felis catus was excluded and only 8 Hyaenidae entries
were used. The partitioning schemes and substitution models referred to those used in MrBayes, but a WAG
model was used to replace VT model due to the absence of the VT model in B EAST265. Three ancient samples
were calibrated using their mean ages, that is, SYZ at 69 ka (the median age of the Late Pleistocene r ange28,29),
HZD at 43.5 ka and LXD at 99.2 ka. Moreover, we also enforced two node calibrations derived from previous
studies12,66–68. The root age was assigned to 11.2 ± 2.5 Ma (gamma distribution)12, and the Hyaena/Parahyaena
divergence date was assigned to 4.625 ± 0.4 Ma (normal distribution)66–68. As the samples are closely related
species (except Hyaena hyaena and Parahyaena brunnea which are two genera forming a sister clade of the focal
species), we assumed a strict molecular c lock69 and a coalescent model with constant population s ize70,71 in the
analysis. The clock rate was given a uniform (0,1) prior and population size was given a 1/X prior, which are
default settings in the program. The MCMC chain was run for 10 million generations and sampled every 100
generations. The first 20% of samples were discarded as burn-in and the remaining samples were used to sum-
marize the tree and parameter estimates. The convergence of the MCMC was examined using TRACER v.1.664
to make sure that the effective sample size (ESS) of each parameter was larger than 200 and two independent
runs produced consistent estimates. The maximum clade credibility (MCC) tree was summarized using TreeAn-
notator included in the BEAST2 program.
Data availability
The mass spectrometry proteomics data have been deposited to the ProteomeXchange Consortium via the
PRIDE partner repository with the dataset identifier PXD020530 and 10.6019/PXD020530. The authors declare
that all data supporting the findings of this study are available within the paper and its supplementary materials.
Received: 22 June 2020; Accepted: 14 September 2020
References
1. Werdelin, L. & Solounias, N. The Hyaenidae: taxonomy, systematics and evolution. Fossils Strata 30, 1–104 (1991).
2. Turner, A., Anton, M. & Werdelin, L. Taxonomy and evolutionary patterns in the fossil Hyaenidae of Europe. Geobios 41, 677–687
(2008).
3. Wilson, D. E. & Reeder, D. M. Mammal species of the world: a taxonomic and geographic reference (Washington & London Smith-
sonian Press, London, 1993).
4. Watts, H. E. & Holekamp, K. E. Hyena societies. Curr. Biol. 17, 657–660 (2007).
5. Kruuk, H. The Spotted Hyena: A Study of Predation and Social Behavior (University of Chicago Press, Chicago, 1972).
6. Qiu, Z., Deng, T. & Wang, B. Early Pleistocene Mammalian Fauna from Longdan, Dongxiang, Gansu, China. Palaeontol. Sin. New
Ser. C 27, 1–198 (2004).
7. Kazantseva, N. E., Smirnov, N. G., Markova, A., Kozharinov, A. V. & Simakova, A. N. Late Pleistocene distribution and diversity
of mammals in Northern Eurasia. Paleontol. Evol. 28, 5–114 (1995).
8. Baryshnikov, G. F. Late Pleistocene Hyena Crocuta ultima ussurica (Mammalia: Carnivora: Hyaenidae) from the paleolithic site
in geographical society cave in the Russian Far East. Proc. Zool. Inst. RAS 318, 197–225 (2014).
9. Qiu, Z., Huang, W. & Guo, Z. Hyaenidae of the Qingyang (K’ingyang) Hipparion fauna. Vertebrata Palasiatica 17, 200–221 (1979).
10. Rohland, N. et al. The population history of extant and extinct hyenas. Mol. Biol. Evol. 22, 2435–2443 (2005).
11. Sheng, G. et al. Pleistocene Chinese cave hyenas and the recent Eurasian history of the spotted hyena Crocuta crocuta. Mol. Ecol.
23, 522–533 (2014).
12. Westbury, M. V. et al. Hyena paleogenomes reveal a complex evolutionary history of cross-continental gene flow between spotted
and cave hyena. Sci. Adv. 6, eaay0456. https://doi.org/10.1126/sciadv.aay0456 (2020).
13. Welker, F. et al. Ancient proteins resolve the evolutionary history of Darwin/’s South American ungulates. Nature 522, 81–84
(2015).
14. Welker, F. et al. Middle Pleistocene protein sequences from the rhinoceros genus Stephanorhinus and the phylogeny of extant and
extinct Middle/Late Pleistocene Rhinocerotidae. PeerJ 5, e3033 (2017).
15. Chen, F. et al. A late Middle Pleistocene Denisovan mandible from the Tibetan Plateau. Nature 569, 409–412. https://doi.
org/10.1038/s41586-019-1139-x (2019).
16. Presslee, S. et al. Palaeoproteomics resolves sloth relationships. Nat. Ecol. Evolut. 3, 1121–1130. https://doi.org/10.1038/s4155
9-019-0909-z (2019).
17. Buckley, M. A molecular phylogeny of Plesiorycteropus reassigns the extinct mammalian order ‘Bibymalagasia’. PLoS ONE 8,
e59614 (2013).
18. Buckley, M. & Collins, M. J. Collagen survival and its use for species identification in Holocene-lower Pleistocene bone fragments
from British archaeological and paleontological sites. Antiqua 1, e1 (2011).
Scientific Reports | (2020) 10:16674 | https://doi.org/10.1038/s41598-020-73542-x 10
Vol:.(1234567890)www.nature.com/scientificreports/
19. Buckley, M. & Wadsworth, C. Proteome degradation in ancient bone; what ancient proteins can tell us. Palaeogeogr. Palaeoclimatol.
Palaeoecol. 416, 69–79. https://doi.org/10.1016/j.palaeo.2014.06.026 (2014).
20. Buckley, M., Lawless, C. & Rybczynski, N. Collagen sequence analysis of fossil camels, Camelops and c.f. Paracamelus, from the
Arctic and sub-Arctic of Plio-Pleistocene North America. J. Proteom. 194, 218–225. https://doi.org/10.1016/j.jprot.2018.11.014
(2019).
21. Penkman, K. E. H., Kaufman, D. S., Maddy, D. & Collins, M. J. Closed-system behaviour of the intra-crystalline fraction of amino
acids in mollusc shells. Quat. Geochronol. 3, 2–25. https://doi.org/10.1016/j.quageo.2007.07.001 (2008).
22. Welker, F. et al. Enamel proteome shows that Gigantopithecus was an early diverging pongine. Nature 576, 262–265. https://doi.
org/10.1038/s41586-019-1728-8 (2019).
23. Cappellini, E. et al. Early Pleistocene enamel proteome from Dmanisi resolves Stephanorhinus phylogeny. Nature 574, 103–107.
https://doi.org/10.1038/s41586-019-1555-y (2019).
24. Demarchi, B. et al. Protein sequences bound to mineral surfaces persist into deep time. Elife 5, e17092 (2016).
25. Westbury, M. et al. A mitogenomic timetree for Darwin’s enigmatic South American mammal Macrauchenia patachonica. Nat.
Commun. 8, 15951. https://doi.org/10.1038/ncomms15951 (2017).
26. Huang, W. Taxonomy of the Hyaenidae (Hyaena and Crocuta) of the Pleistocene in China. Vertebrata Palasiatica 27, 197–204
(1989).
27. Liu, J. Late Pleistocene mammal fossils from Miaofengshan, Beijing and discussion of Crocuta crocuta ultima. Longgupo Prehist.
Cult. 1, 128–139 (1999).
28. Niu, P., Zhang, Y. & Fa, L. Formation period and environment of speleothem in the Liujiang basin inferred from the Shanyangzhai
mammal fossils. Mar. Geol. Q. Geol. 23, 117–122 (2003).
29. Zhang, Y., Li, Y., Wang, W. & Gong, H. Middle Pleistocene mammalian fauna of Shanyangzhai cave in Qinhuangdao area, China
and its zoogeographical significance. Chin. Sci. Bull. 54, 3352–3356. https://doi.org/10.1007/s11434-009-0360-7 (2009).
30. Liu, J. et al. Mass mortality of a large population of the spotted hyenas (Crocuta ultima) at the Lingxiandong Cave, Qinhuangdao,
Hebei Province: a hyena communal den with its palaeoecological and taphonomical interpretation. Q. Sci. 35, 607–621 (2015).
31. Shao, Q.-F. et al. Interactive programs of MC-ICPMS data processing for 230Th/U geochronology. J. Q. Geochronol. 51, 43–52
(2019).
32. Grün, R., Eggins, S., Kinsley, L., Mosely, H. & Sambridge, M. Laser ablation U-series analysis of fossil bones and teeth. Palaeogeogr.
Palaeoclimatol. Palaeoecol. 416, 150–167 (2014).
33. Weiner, S. & Bar-Yosef, O. States of preservation of bones from prehistoric sites in the Near East: a survey. J. Archaeol. Sci. 17,
187–196 (1990).
34. Trueman, C. N. G., Behrensmeyer, A. K., Tuross, N. & Weiner, S. Mineralogical and compositional changes in bones exposed on
soil surfaces in Amboseli National Park, Kenya: diagenetic mechanisms and the role of sediment pore fluids. J. Archaeol. Sci. 31,
721–739 (2004).
35. Smith, C. I., Nielsen-Marsh, C. M., Jans, M. & Collins, M. J. Bone diagenesis in the European Holocene I: patterns and mechanisms.
J. Archaeol. Sci. 34, 1485–1493 (2007).
36. Lebon, M., Reiche, I., Gallet, X., Bellot-Gurlet, L. & Zazzo, A. Rapid quantification of bone collagen content by ATR-FTIR spec-
troscopy. Radiocarbon 58, 131–145 (2016).
37. van Doorn, N. L., Hollund, H. & Collins, M. J. A novel and non-destructive approach for ZooMS analysis: ammonium bicarbonate
buffer extraction. Archaeological and Anthropological Sciences 3, 281–289 (2011).
38. Hollund, H., Ariese, F., Fernandes, R., Jans, M. & Kars, H. Testing an alternative high-throughput tool for investigating bone
diagenesis: FTIR in attenuated total reflection (ATR) mode. Archaeometry 55, 507–532 (2013).
39. Pal Chowdhury, M. et al. Collagen deamidation in archaeological bone as an assessment for relative decay rates. Archaeometry 61,
1382–1398. https://doi.org/10.1111/arcm.12492 (2019).
40. Brock, F. et al. Reliability of nitrogen content (%N) and carbon: nitrogen atomic ratios (C:N) as indicators of collagen preservation
suitable for radiocarbon dating. Radiocarbon 54, 879–886 (2012).
41. Klinken, G. J. V. Bone collagen quality indicators for palaeodietary and radiocarbon measurements. J. Archaeol. Sci. 26, 687–695
(1999).
42. DeNiro, M. J. & Weiner, S. Chemical, enzymatic and spectroscopic characterization of “collagen” and other organic fractions from
prehistoric bones. Geochim. Cosmochim. Acta 52, 2197–2206. https://doi.org/10.1016/0016-7037(88)90122-6 (1988).
43. Wright, L. E. & Schwarcz, H. P. Infrared and isotopic evidence for diagenesis of bone apatite at Dos Pilas, Guatemala: palaeodietary
implications. J. Archaeol. Sci. 23, 933–944 (1996).
44. Wilson, J., van Doorn, N. L. & Collins, M. J. Assessing the extent of bone degradation using glutamine deamidation in collagen.
Anal. Chem. 84, 9041–9048 (2012).
45. Buckley, M. et al. Species identification of archaeological marine mammals using collagen fingerprinting. J. Archaeol. Sci. 41,
631–641. https://doi.org/10.1016/j.jas.2013.08.021 (2014).
46. Van Doorn, N. L., Wilson, J., Hollund, H., Soressi, M. & Collins, M. J. Site-specific deamidation of glutamine: a new marker of
bone collagen deterioration. Rapid Commun. Mass Spectrom. 26, 2319–2327 (2012).
47. Welker, F. Palaeoproteomics for human evolution studies. Quatern. Sci. Rev. 190, 137–147. https://doi.org/10.1016/j.quasc
irev.2018.04.033 (2018).
48. Welker, F. et al. Palaeoproteomic evidence identifies archaic hominins associated with the Châtelperronian at the Grotte du Renne.
Proc. Natl. Acad. Sci. 113, 11162–11167 (2016).
49. Cappellini, E. et al. Proteomic analysis of a pleistocene mammoth femur reveals more than one hundred ancient bone proteins. J.
Proteome Res. 11, 917–926 (2011).
50. Hendy, J. et al. A guide to ancient protein studies. Nat. Ecol. Evolut. 2, 791–799. https: //doi.org/10.1038/s41559 -018-0510-x (2018).
51. Werdelin, L. & Peigné, S. In Cenozoic Mammals of Africa (eds Werdelin, L. & Sanders, W. J.) 603–657 (University of California
Press, Berkeley, 2010).
52. Garcıa, N. & Arsuaga, J. L. Carnivores from the Early Pleistocene hominid-bearing Trinchera Dolina 6 (Sierra de Atapuerca, Spain).
J. Hum. Evol. 37, 415–430. https://doi.org/10.1006/jhev.1999.0325 (1999).
53. Buckley, M., Collins, M., Thomas-Oates, J. & Wilson, J. C. Species identification by analysis of bone collagen using matrix-
assisted laser desorption/ionisation time-of-flight mass spectrometry. Rapid Commun. Mass Spectrom. 23, 3843–3854. https://
doi.org/10.1002/rcm.4316 (2009).
54. Presslee, S. et al. The identification of archaeological eggshell using peptide markers. STAR Sci. Technol. Archaeol. Res. 4, 13–23.
https://doi.org/10.1080/20548923.2018.1424300 (2018).
55. Strohalm, M., Kavan, D., Novák, P., Volný, M. & Havlíček, V. mMass 3: a cross-platform software environment for precise analysis
of mass spectrometric data. Anal. Chem. 82, 4648–4651. https://doi.org/10.1021/ac100818g (2010).
56. Zhang, R. et al. Proteomic and metabolic elucidation of solar-powered biomanufacturing by bio-abiotic hybrid system. Chem 6,
234–249. https://doi.org/10.1016/j.chempr.2019.11.002 (2020).
57. Westbury, M. V. et al. Extended and continuous decline in effective population size results in low genomic diversity in the world’s
rarest Hyena species, the Brown Hyena. Mol. Biol. Evol. 35, 1225–1237. https://doi.org/10.1093/molbev/msy037 (2018).
58. Kumar, S., Stecher, G., Li, M., Knyaz, C. & Tamura, K. MEGA X: molecular evolutionary genetics analysis across computing
platforms. Mol. Biol. Evol. 35, 1547–1549. https://doi.org/10.1093/molbev/msy096 (2018).
Scientific Reports | (2020) 10:16674 | https://doi.org/10.1038/s41598-020-73542-x 11
Vol.:(0123456789)You can also read