Caution is warranted when using animal space-use and movement to infer behavioral states
←
→
Page content transcription
If your browser does not render page correctly, please read the page content below
Buderman et al. Movement Ecology       (2021) 9:30
https://doi.org/10.1186/s40462-021-00264-8

 RESEARCH                                                                                                                                          Open Access

Caution is warranted when using animal
space-use and movement to infer
behavioral states
Frances E. Buderman1* , Tess M. Gingery2, Duane R. Diefenbach3, Laura C. Gigliotti4, Danielle Begley-Miller5,
Marc M. McDill1, Bret D. Wallingford6, Christopher S. Rosenberry6 and Patrick J. Drohan1

  Abstract
  Background: Identifying the behavioral state for wild animals that can’t be directly observed is of growing interest
  to the ecological community. Advances in telemetry technology and statistical methodologies allow researchers to
  use space-use and movement metrics to infer the underlying, latent, behavioral state of an animal without direct
  observations. For example, researchers studying ungulate ecology have started using these methods to quantify
  behaviors related to mating strategies. However, little work has been done to determine if assumed behaviors
  inferred from movement and space-use patterns correspond to actual behaviors of individuals.
  Methods: Using a dataset with male and female white-tailed deer location data, we evaluated the ability of these
  two methods to correctly identify male-female interaction events (MFIEs). We identified MFIEs using the proximity
  of their locations in space as indicators of when mating could have occurred. We then tested the ability of
  utilization distributions (UDs) and hidden Markov models (HMMs) rendered with single sex location data to identify
  these events.
  Results: For white-tailed deer, male and female space-use and movement behavior did not vary consistently when
  with a potential mate. There was no evidence that a probability contour threshold based on UD volume applied to
  an individual’s UD could be used to identify MFIEs. Additionally, HMMs were unable to identify MFIEs, as single
  MFIEs were often split across multiple states and the primary state of each MFIE was not consistent across events.
  Conclusions: Caution is warranted when interpreting behavioral insights rendered from statistical models applied
  to location data, particularly when there is no form of validation data. For these models to detect latent behaviors,
  the individual needs to exhibit a consistently different type of space-use and movement when engaged in the
  behavior. Unvalidated assumptions about that relationship may lead to incorrect inference about mating strategies
  or other behaviors.
  Keywords: Breeding, Mate search strategy, Odocoileus virginianus, White-tailed deer, Hidden Markov models, Home-
  range, Utilization distribution, Brownian bridge, Behavioral state, State identification

* Correspondence: fbuderman@psu.edu
1
 Department of Ecosystem Science and Management, Pennsylvania State
University, University Park, PA 16802, USA
Full list of author information is available at the end of the article

                                       © The Author(s). 2021 Open Access This article is licensed under a Creative Commons Attribution 4.0 International License,
                                       which permits use, sharing, adaptation, distribution and reproduction in any medium or format, as long as you give
                                       appropriate credit to the original author(s) and the source, provide a link to the Creative Commons licence, and indicate if
                                       changes were made. The images or other third party material in this article are included in the article's Creative Commons
                                       licence, unless indicated otherwise in a credit line to the material. If material is not included in the article's Creative Commons
                                       licence and your intended use is not permitted by statutory regulation or exceeds the permitted use, you will need to obtain
                                       permission directly from the copyright holder. To view a copy of this licence, visit http://creativecommons.org/licenses/by/4.0/.
                                       The Creative Commons Public Domain Dedication waiver (http://creativecommons.org/publicdomain/zero/1.0/) applies to the
                                       data made available in this article, unless otherwise stated in a credit line to the data.
Buderman et al. Movement Ecology   (2021) 9:30                                                                   Page 2 of 12

Background                                                      physical traits of males are weakly correlated with repro-
Animal movement is a critical component of many indi-           ductive success [18, 36], suggesting mate search efforts
vidual- and population-level processes, such as space-use       are critical to successful reproduction and fitness [40].
(e.g., [46]), gene flow (e.g., [14]), disease dynamics (e.g.,   Several search strategies have been identified for each
[28]), range expansion (e.g., [7]), and population dynam-       sex using an individual’s search intensity (size or propor-
ics (e.g., [51]). Inference on animal movement is typically     tion of home range used during the mating season) and
obtained by monitoring time-indexed locations from              movement rate (m/hr) (e.g., [35, 60, 65]). Low movement
animal-borne sensors, and our ability to obtain precise         rates and small home ranges suggest a female sit-and-
estimates of these locations over a long period of time         wait strategy, which is in contrast to the female excur-
and at a fine-temporal scale has become logistically eas-       sion strategy, a potential form of female mate choice,
ier and more cost effective over time [13, 58, 62, 66].         where movement rates and home range sizes are greater
Along with a proliferation of datasets containing pos-          as females occasionally travel outside the home range
itional data on individual animals, researchers have de-        [16, 39, 60]. As scramble competitors, male white-tailed
veloped a wide variety of tools and statistical models to       deer movement strategies are influenced by the number
visualize, quantify, and predict animal movement and            and behavior of competing males and the probability of
space-use [37]. Some of these methods focus on a spe-           encountering a female [35, 65]. When there is a low
cific aspect of movement ecology, which is the identifica-      density of females and travel time between females is
tion of the underlying, latent, behavioral state of an          high, males should reduce their movement rates and
individual that results in variation in movement and            focus their activity in the portions of their home range
space-use quantities [29]. Behavioral state identification      that are in close proximity to females (resident strategy;
allows researchers to estimate when an individual was           [26, 65]). When travel time between females is low males
engaged in a behavior (e.g., resting, foraging, exploring,      may increase movements to increase encounters with fe-
transiting, excursions, dispersal) and variables that may       males (roving strategy; [65]).
contribute to the display of one behavior over another            At the discovery of a potential mate, male white-tailed
(e.g., [17, 23, 48, 49, 57, 67]).                               deer may engage in multiple behaviors to increase their
   Given the proliferation of methods for behavioral state      reproductive success. White-tailed deer form tending
identification, we foresee researchers using these              bonds where the male isolates with the female until the
methods to identify increasingly complex behavioral             end of estrus, during which time mating likely occurs
states that are important for understanding an animal’s         (tending; [1, 2, 32]), although the male may be displaced
ecology. For example, mating-related movement strat-            by another male. However, our knowledge of the behav-
egies are an important component of an individual’s life-       ior exhibited during tending bonds is limited to studies
time reproductive success and fitness [24], although            on captive deer [19]. In systems where estrus is not syn-
studies that link fitness directly to movement strategies       chronized and receptivity is difficult to predict, it may be
are rare [52]. Knowing the timing and location of mating        advantageous for males to engage in a roving strategy
events can indicate which search strategies are successful      [65]; in white-tailed deer it has been hypothesized that
and provides insight into the fitness trade-offs necessary      males may engage in roving behavior but revisit known
for reproductive success [26]. However, classifying be-         females to check their estrus status during rut (revisita-
havioral states using location data is difficult without        tion; [25]). Given the difficulty of making field observa-
supporting data about the resources (e.g., mates) that are      tions of mating-related behavior, there is interest in
related to movement behavior [33]. In addition, previous        using location-only data to infer behavior related to mat-
research has found that the current suite of methods for        ing strategies (e.g., sit-and-wait/resident, excursion,
identifying latent behavioral states may not match the          tending, revisitation).
true behavioral state [5]. The combination of rich                Due to logistical constraints, inference on mating
location-based datasets, accessible but complex statis-         movement behavior is often limited to data from a single
tical methods, and the absence of supporting data for           sex and/or the occurrence of a mating event is unknown
validation purposes can create the perfect storm for a          [59]. For example, revisited focal areas (identified using
mismatch between the desired inference and the limita-          the 30% probability contour from a utilization distribu-
tions of the data and statistical model.                        tion) from male-only location data have been hypothe-
   White-tailed deer are a model species to evaluate            sized to reflect areas that contain potentially receptive
methods for characterizing mating-related movement              females [25]. These males may be mirroring the space-
strategies because they are highly mobile and physically        use of resident females, whose home-ranges are typically
large enough to support global positioning system (GPS)         smaller than males, particularly during the mating sea-
collars that monitor movement over long periods of time         son [4, 34], but it is unknown if males interacted with fe-
and at a fine temporal scale. As scramble competitors,          males in those focal areas. From female-only location
Buderman et al. Movement Ecology   (2021) 9:30                                                               Page 3 of 12

data, female excursions outside of the home range (iden-      and BE were within the Ridge and Valley Physiographic
tified using the 95% isopleth from a utilization distribu-    province with topographic features that consisted of
tion) were inferred to increase encounters with males         long, parallel ridges and valleys along a northeast-
and mating success [39], which can be validated with es-      southwest axis, elevation ranging from 400 to 700 m
timates of conception date (e.g., [60]). When information     above sea level [15]. Predominately forested, dominant
is only obtained on a single sex, however, hypotheses         tree species were red and white oak (Quercus spp.), red
about mate interactions rely on strong assumptions            maple, black birch (Betula lenta), black gum (Nyssa syl-
about how space-use and movement characteristics rep-         vatica) and hickory (Carya spp.). The oak-hickory for-
resent mating behavior. We believe these strong assump-       ests contained an understory layer of ericaceous shrub
tions need to be validated before we can infer mating         species (Vaccinium spp., Gaylussacia spp., and Kalmia
behavior from movement characteristics of individuals         latifolia). White-tailed deer density on our study areas
alone.                                                        ranged from 4 to 10 deer/km2 [64].
   Using fine-scale, concurrent location data from both
sexes, we evaluated whether two commonly used move-
                                                              Animal capture and data collection
ment analyses, utilization distributions (UDs) and hidden
                                                              We captured deer using rocket nets and Clover traps
Markov models (HMMs), could be used to differentiate
                                                              from January to April, 2013–2016 [30]. We followed
mate-interaction from non-mate-interaction behavior in
                                                              protocols approved by The Pennsylvania State University
white-tailed deer. We were motivated to evaluate the
                                                              Institutional and Animal Care and Use Committee
ability of UDs to detect mate-interaction behavior be-
                                                              (Protocol No. 47054). We fitted deer with a GPS satellite
cause they have been used previously as a method for
                                                              collar (GPS Plus, Vectronic Aerospace, Berlin, Germany)
defining mate-search behavior using single-sex location
                                                              programmed to obtain a location every 1 h. All deer in
(e.g., [26, 39, 60]). While we have not seen HMMs used
                                                              this study were ≥ 2.5 years of age.
explicitly for the purpose of identifying mate-interaction
behavior, they are increasingly being used by ecologists
to determine behavioral movement states, which is likely      Data analyses
due to their accessibility to ecologists through R pack-      Identifying male-female interaction events
ages such as moveHMM [50] and momentuHMM [47].                We identified MFIEs using GPS locations from male and
For each method, we used the location of male-female          female deer within the same study area. During the rut,
interaction events (MFIEs) to determine if the observed       male deer tend a female for up to 72 h, during which
interactions fell within areas of consistent UD volumes       time mating likely occurs [19]. It is also possible that a
or within a consistent behavioral state. Consistency of ei-   male will find a female (or group of females) that has
ther method to detect MFIEs would be evidence that            not entered estrus and, instead of tending, will revisit
space-use or movement varied in a predictable way be-         areas where the female was located assess her receptivity
tween times when males or females were with or with-          [25]. Therefore, times when male and female deer are in
out a potential mate.                                         close proximity to one another can indicate probable
                                                              male-female interaction events. We also defined three
Methods                                                       breeding phases, during which time individuals may
Study area                                                    exhibit different behavior within the annual breeding
We monitored deer in four study areas in Pennsylvania,        season. For the northern study area, the breeding phases
United States, where seasons were characterized by cold       were defined as: October 18–November 7 (early),
winters (mean temperature − 4.4 °C) and humid sum-            November 8–November 28 (peak), and November 29–
mers (mean temperature 20.5 °C) [54]. Two study areas,        December 19 (late; [21]). For the southern study area,
Susquehannock North (SN) and Susquehannock South              the breeding phases were defined as: October 16–No-
(SS), were located in Susquehannock State Forest in Pot-      vember 5 (early), November 6–November 29 (peak), and
ter County. Our study area was contained within the           November 30–December 20 (late [21];). Analyzing
Appalachian Plateau physiographic region with plateaus        phases separately may provide us with additional insight
at approximately 800 m elevation interspersed with            into the ability of the two methods to detect potential
drainages dropping to 220 m [15]. The area was predom-        breeding events, however, there are also fewer locations
inately forested and dominant tree species were red           within each phase on which to make inference. In Penn-
maple (Acer rubrum), sugar maple (Acer saccharum),            sylvania, the early and peak rut seasons occur prior to
black cherry (Prunus serotina), and American beech            the start of rifle season but during archery season; how-
(Fagus grandifolia) [3]. Two additional study areas were      ever, hunter density is low during archery season com-
in Rothrock (RR) and Bald Eagle (BE) state forests. Lo-       pared to rifle season. In addition, harvest regulation
cated in Centre, Mifflin, and Huntingdon counties, RR         changes intended to increase the number of older males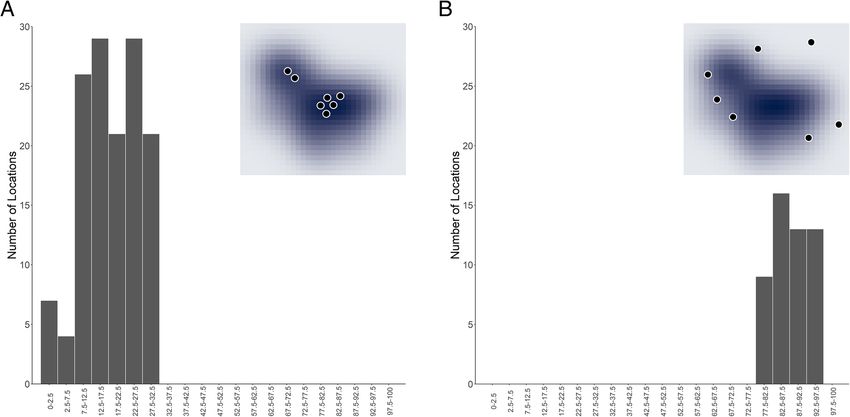
Buderman et al. Movement Ecology          (2021) 9:30                                                                                   Page 4 of 12

in the population did not result in changes to timing of                    movement trajectories. To determine similarity of move-
breeding or female productivity (embryos/female; [21]).                     ment trajectories, we used the DI function within the
  We used both a liberal and conservative approach to                       WildlifeDI R package [42] to calculate dynamic inter-
identifying MFIEs. There is little information on how                       action (DI) statistics for male-female pairs. This metric
white-tailed deer move during a potential mate-                             compares the similarity of two animals’ movement tra-
interaction because few studies monitor both males and                      jectories in relation to movement displacement (direc-
females; using both classification methods allowed us to                    tion and speed), where values near − 1 indicate opposing
capture potentially different mate-interaction behavior.                    movement displacement, values near 0 indicate random
For the liberal approach, we used the Prox function                         movement, and values near 1 indicate cohesive move-
within the WildlifeDI R package [42] to calculate the                       ment displacement [42, 43]. To obtain a conservative es-
distance between male-female pairs based on simultan-                       timate of MFIEs, we calculated the DI for each segment
eous locations. We defined MFIEs as events when a male                      of movement trajectory associated with the MFIEs iden-
and female deer were within an average of 100 m of each                     tified by the liberal method and retained those events
other for a minimum of 2 continuous locations (one                          with an average DI of greater than 0.5. A DI value of
hour). We are not aware of any data on the distance be-                     greater than 0.5 indicates that two deer are moving simi-
tween males and females during tending or the distance                      larly within regards to their direction and speed of
necessary for a male to assess estrus state of a female. If                 movement [43]. Therefore, the conservative set of MFIEs
the larger distances were non-mate-interactions and the                     were events when a male and female deer were within
analytic method performed well, we would see this in                        100 m, on average, of each other, for a minimum of 2
the results (i.e., at short distances the method worked                     continuous locations and exhibited cohesive movement.
well but not at large distances). For individual pairs with                 An example of a MFIE can be found in Fig. 1.
repeated interactions, we delineated mating events based
on more than 100 m between the individuals for longer                       Evaluating the UD approach for identifying MFIEs
than a two-hour period. Repeated interactions may indi-                     The Brownian bridge movement model (BBMM) is a
cate revisitation behavior, as opposed to tending; how-                     method for quantifying an individual’s UD, or the rela-
ever, we classify both as mate-interaction behavior.                        tive frequency of use across a given period of time, that
  For the conservative approach, we identified MFIEs                        accounts for temporal autocorrelation in sequential ob-
using a combination of proximity and similarity of                          servations and measurement error. Many methods exist

 Fig. 1 Example male-female interaction events (MFIE) where black points are pre-event locations and orange and purple points represent female
 and male locations, respectively, during the MFIE. The contours correspond to 95 and 50% probability contours of the utilization distribution (UD)
Buderman et al. Movement Ecology         (2021) 9:30                                                                                  Page 5 of 12

to fit a BBMM to data, and we present one method                           we fit a single BBMM to all locations within a breeding
which can be implemented in R using existing packages.                     phase (early, peak, and late). We then determined the
Previous studies have inferred mating-related behavior                     UD volume of each grid-cell, using the function getvolu-
from male-only data by hypothesizing that locations that                   meUD in the adehabitatHR package [11], that contained
occurred within an a priori probability contour repre-                     the coordinates of locations identified as MFIEs. If the
sented locations of potentially receptive breeding females                 MFIE locations had a UD volume that is consistently
(e.g., 30% in [25]), and from female-only data, when fe-                   less than some value for males (e.g., [25]) or greater than
males travelled outside of an a priori probability contour                 some value for females (e.g., [39, 60]), then we can say
(e.g., 95% in [39, 60]). Therefore, we assessed the UD ap-                 that the UD approach can determine mate-interaction
proach for both males and females and based inference                      events from single-sex location data. See Fig. 2 for ex-
on the standardized UD volume of each location in a                        pected results if MFIE locations were consistently found
MFIE. The standardized UD volumes are used to con-                         within a particular range of UD volumes.
struct probability contours by starting at the areas of
highest intensity use and then sequentially including                      Evaluating HMM for identifying MFIEs from single sex data
areas of less intensely used areas until the cumulative                    Hidden Markov Models (HMMs) have become a popu-
volume reaches some desired proportion of the total vol-                   lar movement model for describing movement charac-
ume; for example, a grid-cell with a UD volume of 30%                      teristics (speed and turning angle) that are assumed to
would be contained within probability contours greater                     arise from different behavioral states. To fit a HMM, we
than or equal to 30% but not in those less than 30%.                       first needed to obtain locations at regular intervals.
Typically, the 95% probability contour is used to define a                 Therefore, we used the fmove.bayes function from the
home-range of an animal [22].                                              ctmcmove package [31] to fit a continuous-time func-
  We used the BBMM package [55] and the function                           tional movement model [10] with a fixed measurement
brownian.bridge to estimate the parameters of the                          error (SD = 10 m) and a CAR1 process error covariance
BBMM. We fixed the measurement error to a standard                         matrix. We used this model to estimate locations on an
deviation of 10 m, based on field testing of the GPS col-                  hourly interval using 10,000 MCMC iterations; the pos-
lars, and estimated the BBMM over a regular grid with a                    terior mean of each location was used as the data in the
spatial resolution of 30 m. We fit the BBMM to each in-                    subsequent HMM analysis. We used the momentuHMM
dividual separately, in two ways; we fit a single BBMM                     package [47] to fit the HMMs and process the output.
to all locations within an annual breeding season, and                     Similar to the UD approach, we fit HMMs to both the

 Fig. 2 Expected results from the utilization distribution (UD) approach if it was able to consistently identify male-female interaction events
 (MFIEs). Subfigure A demonstrates the scenario in which MFIEs were in high-use areas (small UD volumes) and subfigure B is the scenario in
 which MFIEs were in low-use areas or outside of core areas (large UD volumes). The inset shows an example UD with locations in high-use (A)
 and low-use areas (B)
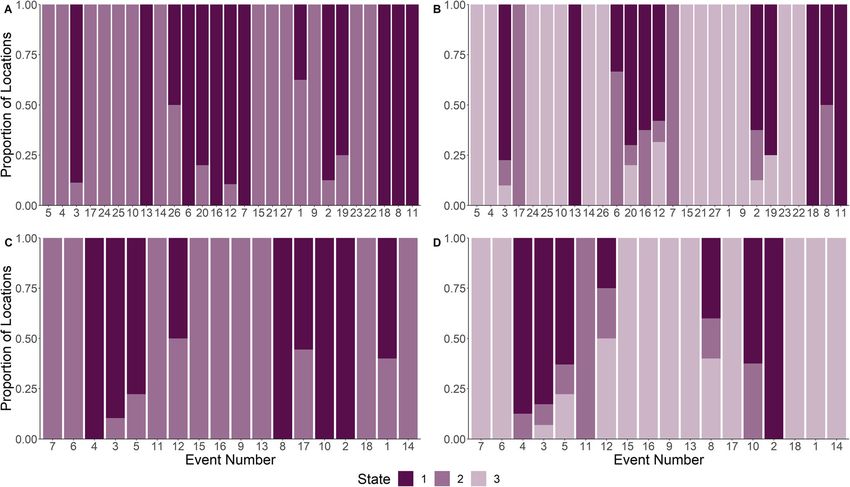
Buderman et al. Movement Ecology           (2021) 9:30                                                                                       Page 6 of 12

full set of breeding season movement paths and to                              HMM can determine mate-interaction events from
breeding-phase specific movement paths (the subset of                          single-sex location data. In Fig. 3 we show our expected
hourly locations that fell into each breeding phase). We                       results if the HMM approach was successful at identify-
also fit both two- and three-state HMMs; selecting the                         ing MFIE.
appropriate number of states for an HMM is notoriously
difficult as many model selection methods overestimate                         Results
the number of states [56]. We hypothesized that deer                           Using the liberal filter, we identified 27 MFIEs across
movement during the rut could be characterized by two                          5 males and 7 females where MFIEs averaged 7.9 h
states or by three states. The addition of a third state                       (minimum = 1 h, maximum = 78.9 h). Using the con-
would allow for more flexibility in categorizing the                           servative filter, we identified 18 MFIEs across 4 males
movement trajectory (e.g., foraging, resting, mate-                            and 5 females where MFIEs averaged 7.1 h (min = 1 h,
interaction as opposed to a subset of two behaviors).                          max = 27 h). A summary of each MFIE is in Add-
The HMM does not tell you what behavior the state cor-                         itional file 1 (Table A1–1 and A1–2). There was no
responds to; interpretation of the biological meaning of                       evidence that either a UD volume threshold a HMM
the resulting states and their parameters is up to the re-                     based on single-sex location data was able to identify
searcher. The HMMs were fit jointly, allowing the state                        MFIEs.
parameters to be shared among individuals; however,                               For locations identified as occurring during an
this method does assume that movement quantities dur-                          MFIE, the standardized UD volume spanned 2–91%
ing the states of interest arise from the same population-                     for males (Fig. 4A and B) and 1–97% for females
level distribution, which allows for little individual vari-                   (Fig. 4C and D). For males, the average UD for each
ation. Because data used in the HMM model is predicted                         MFIE (the UD values for the cells traversed by an in-
hourly, we used the start and end times of the MFIEs to                        dividual during a MFIE) ranged from 9.46–75.80%
denote MFIE locations in the continuous-time frame-                            and 10.98–75.80% using the liberal and conservative
work (such that all hourly locations between the start                         MFIE classification methods, respectively (Table A1–3
and end times of an MFIE were considered MFIE loca-                            and A1–4). For females, the average UD for each
tions). The momentuHMM package calculates the most                             MFIE ranged from 1.76–75.66% and 14.22–84.04%
likely state sequence using the Viterbi algorithm. If the                      using the liberal and conservative MFIE classification
MFIE locations were consistently categorized as belong-                        methods, respectively (Table A1–3 and A1–4). We
ing to one state over another, then we could say that the                      did not see a relationship between the performance of

 Fig. 3 Expected results from the hidden Markov model (HMM) approach if it was able to consistently identify male-female interaction events
 (MFIEs) for a 2-state (A) and a 3-state model (B). Ideally all locations in each event would be identified as a single, consistent state across events
 (the actual state label does not matter), but we would also expect that there may be some small proportion of locations within each event
 classified as another state
Buderman et al. Movement Ecology         (2021) 9:30                                                                                  Page 7 of 12

 Fig. 4 Histogram of the UD volume (the smallest probability density contour that would contain the location) associated with white-tailed deer
 locations occurring during a male-female interaction event (MFIE) within the annual breeding season. MFIEs were identified using a liberal and
 conservative identification method for males (A and B respectively) and females (C and D respectively). The UD volume for each point was
 calculated as arising from a utilization distribution over the annual breeding season. The shading represents the average distance between a male
 and female during the MFIE associated with each location

the method and either the average distance between a                       (Fig. 6, A2–3, and A2–5) or the duration of the MFIE
male and a female during a MFIE (Fig. 4) or the dur-                       (Fig. A2–2, A2–4, and A2–6).
ation of the MFIE (Fig. A2–1 in Additional file 2).
We also failed to detect a seasonal difference for ei-                     Discussion
ther sex in the ability of the UD to delineate MFIE in                     Variation in movement metrics while in the presence of
different breeding phases (Fig. 5).                                        an individual of the opposite sex was large both within
  Using male-only data, the HMM was unable to                              and among individuals; therefore, it is difficult for statis-
identify the MFIEs (Fig. 3). To visualize the results,                     tical models to infer from single-sex location data where
we calculated the proportion of locations within each                      and when an individual was engaged in a MFIE. Regard-
MFIE that were categorized as belonging to each                            less of MFIE classification scheme, sex, or breeding sea-
state. Single events were often split across multiple                      son, there was no evidence of a UD volume threshold
states, and the predominant state that each event was                      for locations identified as an MFIE. We observed that
categorized as was not consistent across events (Fig. 6                    some UD volumes contained more MFIEs locations than
and A2–2). The classification ability of the HMM did                       others, which could provide some support that UDs may
not improve when restricted to single breeding phases                      reflect mate interactions [25]; however, MFIEs were not
within a breeding season (Fig. A2–3, A2–4, A2–5,                           consistently restricted to a narrow range of UD volumes
and A2–6). There was also no relationship between                          and assuming MFIEs only occurred in these volumes
the performance of the method and either the average                       would ignore a significant portion of MFIEs. Defining a
distance between a male and a female during a MFIE                         MFIE as having occurred based on a UD volume thresh-
                                                                           old alone will likely incorrectly identify the number and
Buderman et al. Movement Ecology (2021) 9:30 Page 8 of 12 Fig. 5 Histogram of the UD volume associated with white-tailed deer locations occurring during a male-female interaction event for early, peak, and late phases of the annual breeding season. Male-female interaction events were identified using a liberal and conservative identification method for males (A and B respectively) and females (C and D respectively). The UD volume for each point was calculated as arising from a utilization distribution over each phase within the breeding season location of potential mate interactions. Therefore, re- volume. In addition to individual variation, female mat- searchers should be cautious when interpreting events ing strategies (sit-and-wait or excursions) are hypothe- that have been identified based solely on single-sex loca- sized to depend on population densities and sex ratios tion data. For example, previous studies using male-only [34]. When only female locations are available, using location data made inference about mate-searching be- auxiliary information, such as back-calculating the con- havior and assumed that areas of high use by males rep- ception date (e.g., [60]), is recommended to identify the resented the locations of females [25]. However, with no mating location and its relationship to the individual’s data on females, focal areas identified in a UD analysis typical space-use. could alternatively contain a resource that is important Hidden Markov models also were incapable of classify- for deer survival (e.g., cover, water, forage). During ing movements in the presence of the opposite sex as a MFIEs, male movement patterns were not consistently unique behavioral state. HMMs identify behavioral states restricted to a small probability contour (e.g., < 30%) by detecting a change in movement rate and direction which may be because females did not remain stationary (i.e., turning angle). Therefore, the inability of HMMs to throughout the rut. Although some males may exhibit correctly classify MFIE suggests that movement behavior stationary movement behaviors during a breeding sea- during mate-interaction is not consistently different son, labeling such movements as corresponding to an from other behavioral states (i.e., searching). As such, it interaction with a potential mate could not be supported is likely difficult to determine when an individual shifts by our analyses. their behavior from mate searching to mate interaction Presumed female mate-interaction events also were using location data alone. It is tempting to think that not detected using female-only location data and a UD HMMs can directly estimate behavioral modes; however, approach. Females used portions of their home range the HMM is estimating parameters of distributions, the during MFIEs that were associated with varying UD number of which is specified a priori by the researcher,
Buderman et al. Movement Ecology         (2021) 9:30                                                                                   Page 9 of 12

 Fig. 6 Proportions of male white-tailed deer locations identified as arising from two- (A and C) and three- state (B and D) HMMs during male-
 female interaction events (MFIEs) that were classified using the liberal event identification method (A and B respectively) and the conservative
 event identification method (C and D respectively) where HMMs were fit to telemetry data across the breeding season. Events are ordered from
 small to large average distance between a male and female during the MFIE

that give rise to the observed step lengths and turning                     behavior or space-use needs to be different than what
angles. It is the researcher who ascribes a behavioral in-                  the individual exhibits when not engaged in a MFIE dur-
terpretation to the estimated distribution. If the behavior                 ing the temporal period in question; different movement
does not result in a consistent and interpretable parti-                    strategies related to hunter avoidance could increase or
tioning of the movement path, then the HMM will not                         decrease the ability of these models to identify MFIE.
allow the researcher to make inference on the unob-                            We did not find support for using single-sex location
served behavioral state. In addition, if individuals are                    data and UDs or HMMs to identify when an individual
mirroring another individual’s movement behavior dur-                       is with a potential mate. To identify mating events using
ing the behavior of interest (e.g., attempted mating; [2]),                 fine-scale movement data, auxiliary data about the
then single-sex location data would not be consistently                     underlying behavioral states (e.g., conception date, in
identified as a distinct state even though the behavior is                  situ observations) or location of available resources (e.g.
occurring.                                                                  a mate) are needed. Increasing the sampling frequency
   The primary mortality risk factor for white-tailed deer                  of observations would be most beneficial when both
in our study area is hunting-induced mortality, which                       males and females are collared, because it would allow
varies in intensity in both time and space and across                       for greater certainty that a MFIE occurred. These events
sex- and age-classes. The three rut periods analyzed in                     could be used to provide direct inference on a MFIE, as
our study differ in the degree of hunting pressure ap-                      locations of a known behavioral state in a hidden
plied to the deer population, because the late rut-period                   Markov model, or they could be used in a supervised
overlaps with the rifle season and greater hunter dens-                     machine learning framework given a sufficient number
ities. However, we did not detect any change in the abil-                   of events (e.g., [9, 12, 27, 45, 53]). Animal-borne video
ity of either method to identify MFIE across the rut                        collars are also a promising avenue by which to obtain
periods. Deer have been observed adjusting their move-                      direct observations of the previously unobservable be-
ment behavior during hunting seasons (e.g., [38, 41, 61]),                  havior (e.g., [6, 44, 63]). More generally, if the goal is to
which could potentially alter the ability of these methods                  identify an unobserved behavioral state of interest, in-
to detect male-female interaction events. Integral to the                   creasing the sampling frequency of individual locations
ability of both methods to identify MFIE is that the                        would be ineffective if space-use and movement
Buderman et al. Movement Ecology   (2021) 9:30                                                                                    Page 10 of 12

quantities truly don’t vary with the state of interest. Al-    Abbreviations
though our study focused on identifying mating behavior        BBMM: Brownian bridge movement model; MFIE: Male-female interaction
                                                               event; HMM: Hidden Markov model; UD: Utilization distribution
in white-tailed deer, the results are relevant for any
study attempting to identify unobserved behavioral states
from space-use and movement data.                              Supplementary Information
                                                               The online version contains supplementary material available at https://doi.
                                                               org/10.1186/s40462-021-00264-8.

Conclusions                                                     Additional file 1. Summaries of MFIEs using liberal and conservative
Incorrectly assigning behaviors to movement patterns is         methods for identification and average UD volumes for each MFIE.
likely to lead to an incorrect understanding of the trade-      Additional file 2. PDF including a visual representation of an example
                                                                MFIE, expected results for the UD and HMM approach, and a summary of
offs associated with mating strategies. For example, an         each male-female interaction event.
explanatory hypothesis for drivers of space-use based on
single-sex location data may misidentify the trade-offs        Acknowledgements
an individual makes to visit such locations if mate inter-     Any use of trade, firm, or product names is for descriptive purposes only and
actions do not actually occur in those areas. Instead,         does not imply endorsement by the U.S. Government.
movements ascribed to interactions with potential mates
                                                               Authors’ contributions
simply may reflect trade-offs made to acquire other re-        FEB, TMG, DRD, LCG, and DB generated the idea of the paper. LCG identified
sources or reduce predation risk. In addition, some            the male-female interaction events, DB fit preliminary utilization distributions
methods assume that mating resources (e.g., females) are       to the data, and FEB performed the remaining and final versions of the ana-
                                                               lyses. DRD, MMM, and PJD secured funding for the data collection. BDW and
relatively stationary, which may fail to detect tending,       CSR provided field support. FEB and TMG wrote the manuscript and all au-
revisitation, or mating events between mobile individ-         thors reviewed, edited, and approved the manuscript.
uals. Models that incorporate independent data, such as
                                                               Funding
conception data [60], resource availability [33], molecu-
                                                               This work was supported by funding from the Pennsylvania Game
lar evaluations [20, 26], or in situ observations (via field   Commission and the Pennsylvania Department of Conservation and Natural
observations or video camera collars [8];), will reduce        Resources. F. E. Buderman was supported by the U. S. Department of
                                                               Agriculture National Institute of Food and Agriculture, Hatch project
the need for assumptions about underlying behavioral
                                                               1024904.
states that are currently inferred from location data.
   Our study demonstrates that although UDs and                Availability of data and materials
HMMs may be readily accessible statistical methods for         The datset supporting the conclusions of this article is archived in the Dryad
                                                               repository (https://doi.org/10.5061/dryad.mgqnk98zz).
ecologists to use to identify behavior, we did not find
that they were able to consistently identify male-female       Declarations
interactions among white-tailed deer during the breed-
                                                               Ethics approval and consent to participate
ing season. Our work highlights the importance of veri-
                                                               Not applicable.
fying the primary underlying assumptions made when
using these methods to identify any behavior, which is         Consent for publication
that space-use and movement differ in a consistent way         Not applicable.
during the behavior of interest and differences are re-
                                                               Competing interests
lated to that behavior. For example, male white-tailed         The authors declare that they have no competing interests.
deer engage in scramble-competition for mates, and this
strategy may produce too much variation in space-use           Author details
                                                               1
                                                                Department of Ecosystem Science and Management, Pennsylvania State
and movement during mate-interactions to be identifi-          University, University Park, PA 16802, USA. 2Pennsylvania Cooperative Fish
able using single-sex location data and UDs or HMMs.           and Wildlife Research Unit, Pennsylvania State University, University Park, PA
Differences in space-use and movement may be further           16802, USA. 3U. S. Geological Survey, Pennsylvania Cooperative Fish and
                                                               Wildlife Research Unit, Pennsylvania State University, University Park, PA
modified by individual variation landscape-level pro-          16802, USA. 4Department of Environmental Science, Policy, and
cesses, such as concentration of resources and hunting         Management, University of California Berkeley, Berkeley, CA 94720, USA.
                                                               5
intensity, which only increases the need to incorporate         Teatown Lake Reservation, Ossining, NY 10562, USA. 6Pennsylvania Game
                                                               Commission, Harrisburg, PA 17110, USA.
validation data if the objective is to identify behavioral
states. Therefore, ecologists should use caution when          Received: 12 January 2021 Accepted: 4 May 2021
interpreting spatial and movement patterns observed in
UDs and HMMs as being indicators of specific behav-            References
ioral modes and suggest that auxiliary data are necessary      1. Airst J, Lingle S. Courtship strategies of white-tailed deer and mule deer
to validate the behavioral-inference obtained from these           males when living in sympatry. Behaviour. 2019;156:307–30.
                                                               2. Airst JI, Lingle S. Male size and alternative mating tactics in white-tailed deer
two methods.                                                       and mule deer. J Mammal. 2020;101(5):1231–43. https://doi.org/10.1093/jma
                                                                   mmal/gyaa109.
Buderman et al. Movement Ecology (2021) 9:30 Page 11 of 12
3. Begley-Miller DR, Diefenbach DR, McDill ME, Drohan PJ, Rosenberry CS, Just 25. Foley AM, DeYoung RW, Hewitt DG, Hellickson MW, Gee KL, Wester DB,
Domoto EH. Soil chemistry, and not short-term (1–2 year) deer exclusion, et al. Purposeful wanderings: mate search strategies of male white-
explains understory plant occupancy in forests affected by acid deposition. tailed deer. J Mammal. 2015;96(2):279–86. https://doi.org/10.1093/jma
AoB Plants. 2019;11:plz044. mmal/gyv004.
4. Beier P, McCullough DR. Factors influencing white-tailed deer activity 26. Foley AM, Hewitt DG, DeYoung RW, Schnupp MJ, Hellickson MW, Lockwood
patterns and habitat use. Wildl Monogr. 1990;109:3–51. MA. Reproductive effort and success of males in scramble-competition
5. Bennison A, Bearhop S, Bodey TW, Votier SC, Grecian WJ, Wakefield ED, polygyny: evidence for trade-offs between foraging and mate search. J
et al. Search and foraging behaviors from movement data: a comparison of Anim Ecol. 2018;87(6):1600–14. https://doi.org/10.1111/1365-2656.12893.
methods. Ecol Evol. 2018;8(1):13–24. https://doi.org/10.1002/ece3.3593. 27. Grünewälder S, Broekhuis F, Macdonald DW, Wilson AM, McNutt JW, Shawe-
6. Beringer J, Millspaugh JJ, Sartwell J, Woeck R. Real-time video recording of Taylor J, et al. Movement activity based classification of animal behaviour
food selection by captive white-tailed deer. Wildl Soc Bull. 2004;32(3):648– with an application to data from cheetah (Acinonyx jubatus). PLoS One.
54. https://doi.org/10.2193/0091-7648(2004)0322.0.CO;2. 2012;7(11):e49120. https://doi.org/10.1371/journal.pone.0049120.
7. Bocedi G, Zurell D, Reineking B, Travis JM. Mechanistic modelling of animal 28. Gudelj I, White KAJ, Britton NF. The effects of spatial movement and group
dispersal offers new insights into range expansion dynamics across interactions on disease dynamics of social animals. Bull Math Biol. 2004;
fragmented landscapes. Ecography. 2014;37(12):1240–53. https://doi.org/1 66(1):91–108. https://doi.org/10.1016/S0092-8240(03)00075-2.
0.1111/ecog.01041. 29. Gurarie E, Bracis C, Delgado M, Meckley, TD, Kojola I. and Wagner CM. What
8. Brockman CJ, Collins WB, Welker JM, Spalinger DE, Dale BW. Determining kill is the animal doing? Tools for exploring behavioural structure in animal
rates of ungulate calves by brown bears using neck-mounted cameras. movements. J Anim Ecol. 2016;85:69–84. https://doi.org/10.1111/1365-2
Wildl Soc Bull. 2017;41(1):88–97. https://doi.org/10.1002/wsb.733. 656.12379.
9. Browning E, Bolton M, Owen E, Shoji A, Guilford T, Freeman R. Predicting 30. Hawkins RE, Martoglio LD, Montgomery GG. Cannon-netting deer. J Wildl
animal behaviour using deep learning: GPS data alone accurately predict Manag. 1968;32(1):191–5. https://doi.org/10.2307/3798258.
diving in seabirds. Methods Ecol Evol. 2018;9(3):681–92. https://doi.org/1 31. Hanks E. Ctmcmove: modeling animal movement with continuous-time
0.1111/2041-210X.12926. discrete-space Markov chains. R package version 1.2.8; 2017.
10. Buderman FE, Hooten MB, Ivan JS, Shenk TM. A functional model for 32. Hirth DH. Social behavior of white-tailed deer in relation to habitat. Wildl
characterizing long distance movement behavior. Methods Ecol Evol. 2016; Monogr. 1977;53:3–55.
7(3):264–73. https://doi.org/10.1111/2041-210X.12465. 33. Hebblewhite M, Haydon DT. Distinguishing technology from biology: a
11. Calenge C. The package “adehabitat” for the R software: a tool for the critical review of the use of GPS telemetry data in ecology. Philos
analysis of space and habitat use by animals. Ecol Model. 2006;197(3-4):516– Transact Royal Soc B Biol Sci. 2010;365(1550):2303–12. https://doi.org/1
9. https://doi.org/10.1016/j.ecolmodel.2006.03.017. 0.1098/rstb.2010.0087.
12. Carroll G, Slip D, Jonsen I, Harcourt R. Supervised accelerometry analysis can 34. Hölzenbein S, Schwede G. Activity and movements of female white-
identify prey capture by penguins at sea. J Exp Biol. 2014;217(24):4295–302. tailed deer during the rut. J Wildl Manag. 1989;53(1):219–23. https://doi.
https://doi.org/10.1242/jeb.113076. org/10.2307/3801337.
13. Cooke SJ, Hinch SG, Wikelski M, Andrews RD, Kuchel LJ, Wolcott TG, et al. 35. Isvaran K. Variation in male mating behaviour within ungulate populations:
Biotelemetry: a mechanistic approach to ecology. Trends Ecol Evol. 2004; patterns and processes. Curr Sci. 2005;89:1192–9.
19(6):334–43. https://doi.org/10.1016/j.tree.2004.04.003. 36. Jones PD, Strickland BK, Demarais S, DeYoung RW. Inconsistent association
14. Coulon A, Cosson JF, Angibault JM, Cargnelutti B, Galan M, Morellet N, et al. of male body mass with breeding success in captive white-tailed deer. J
Landscape connectivity influences gene flow in a roe deer population Mammal. 2011;92(3):527–33. https://doi.org/10.1644/10-MAMM-A-294.1.
inhabiting a fragmented landscape: an individual–based approach. Mol Ecol. 37. Joo R, Boone ME, Clay TA, Patrick SC, Clusella-Trullas S, Basille M. Navigating
2004;13(9):2841–50. https://doi.org/10.1111/j.1365-294X.2004.02253.x. through the r packages for movement. J Anim Ecol. 2020;89(1):248–67.
15. Cuff DJ, Young WJ, Muller EK, editors. The atlas of Pennsylvania. https://doi.org/10.1111/1365-2656.13116.
Philadelphia: Temple University Press; 1989. 38. Karns GR, Lancia RA, DePerno CS, Conner MC. Impact of hunting pressure
16. D’Angelo GJ, Comer CE, Kilgo JC, Drennan CD, Osborn DA, Miller KV. Daily on adult male white-tailed deer behavior. Proc Annu Confer Southeastern
movements of female white-tailed deer relative to parturition and breeding. Assoc Fish Wildlife Agen. 2012;66:120–5.
Proc Annu Confer Southeastern Assoc Fish Wildlife Agen. 2004;58:292–301. 39. Kolodzinski JJ, Tannenbaum LV, Muller LI, Osborn DA, Adams KA, Conner
17. DeRuiter SL, Langrock R, Skirbutas T, Goldbogen JA, Calambokidis J, MC, et al. Excursive behaviors by female white-tailed deer during estrus at
Friedlaender AS, et al. A multivariate mixed hidden Markov model for blue two mid-Atlantic sites. Am Midl Nat. 2010;163(2):366–73. https://doi.org/10.1
whale behaviour and responses to sound exposure. Ann Appl Stat. 2017;11: 674/0003-0031-163.2.366.
362–92. 40. Lane JE, Boutin S, Gunn MR, Coltman DW. Sexually selected behaviour: red
18. DeYoung RW, Demarais S, Honeycutt R, Gee KL, Gonzales RA. Social squirrel males search for reproductive success. J Anim Ecol. 2009;75:296–304.
dominance and male breeding success in captive white-tailed deer. Wildl 41. Little AR, Webb SL, Demarais S, Gee KL, Riffell SK, Gaskamp JA. Hunting
Soc Bull. 2006;34(1):131–6. https://doi.org/10.2193/0091-7648(2006)34[131: intensity alters movement behaviour of white-tailed deer. Basic Appl Ecol.
SDAMBS]2.0.CO;2. 2016;17(4):360–9. https://doi.org/10.1016/j.baae.2015.12.003.
19. DeYoung RW, Miller KV. White-tailed deer behavior. In: Hewitt DG, editor. 42. Long JA, Nelson TA, Webb SL, Gee KL. A critical examination of indices of
Biology and Management of White-tailed Deer. Boca Raton: CRC Press; dynamic interaction for wildlife telemetry studies. J Anim Ecol. 2014;83(5):
2011. p. 311–51. 1216–33. https://doi.org/10.1111/1365-2656.12198.
20. DeYoung RW, Demarais S, Gee KL, Honeycutt RL, Hellickson MW, Gonzales 43. Long JA, Nelson TA. Measuring dynamic interaction in movement data.
RA. Molecular evaluation of the white-tailed deer (Odocoileus virginianus) Trans GIS. 2013;17(1):62–77. https://doi.org/10.1111/j.1467-9671.2012.01353.x.
mating system. J Mammal. 2009;90(4):946–53. https://doi.org/10.1644/08-MA 44. Loyd KA, Hernandez SM, Carroll JP, Abernathy KJ, Marshall GJ. Quantifying
MM-A-227.1. free-roaming domestic cat predation using animal-borne video cameras.
21. Diefenbach DR, Alt GL, Wallingford BD, Rosenberry CS, Long ES. Effect of Biol Conserv. 2013;160:183–9. https://doi.org/10.1016/j.biocon.2013.01.008.
male age structure on reproduction in white-tailed deer. J Wildl Manag. 45. Martiskainen P, Järvinen M, Skön JP, Tiirikainen J, Kolehmainen M, Mononen
2019;83(6):1368–76. https://doi.org/10.1002/jwmg.21712. J. Cow behaviour pattern recognition using a three-dimensional
22. Fieberg J. Kernel density estimators of home range: smoothing and the accelerometer and support vector machines. Appl Anim Behav Sci. 2009;
autocorrelation red herring. Ecology. 2007;88(4):1059–66. https://doi.org/10.1 119(1-2):32–8. https://doi.org/10.1016/j.applanim.2009.03.005.
890/06-0930. 46. Merkle JA, Potts JR, Fortin D. Energy benefits and emergent space use
23. Franke A, Caelli T, Hudson RJ. Analysis of movements and behavior patterns of an empirically parameterized model of memory-based patch
of caribou (Rangifer tarandus) using hidden Markov models. Ecol selection. Oikos. 2017;126:185–95.
Model. 2004;173(2-3):259–70. https://doi.org/10.1016/j.ecolmodel.2 47. McClintock BT, Michelot T. momentuHMM: R package for generalized
003.06.004. hidden Markov models of animal movement. Methods Ecol Evol. 2018;9(6):
24. Freeman S, Herron JC. Evolutionary analysis. Upper Saddle River: Pearson 1518–30. https://doi.org/10.1111/2041-210X.12995.
Prentice Hall; 2007.Buderman et al. Movement Ecology (2021) 9:30 Page 12 of 12
48. McKellar AE, Langrock R, Walters JR, Kesler DC. Using mixed hidden Markov
models to examine behavioral states in a cooperatively breeding bird.
Behav Ecol. 2015;26(1):148–57. https://doi.org/10.1093/beheco/aru171.
49. Michelot T, Langrock R, Bestley S, Jonsen ID, Photopoulou T,
Patterson TA. Estimation and simulation of foraging trips in land-
based marine predators. Ecology. 2017;98(7):1932–44. https://doi.
org/10.1002/ecy.1880.
50. Michelot T, Langrock R, Patterson TA. moveHMM: an R package for the
statistical modelling of animal movement data using hidden Markov
models. Methods Ecol Evol. 2016;7(11):1308–15. https://doi.org/10.1111/2
041-210X.12578.
51. Morales JM, Moorcroft PR, Matthiopoulos J, Frair JL, Kie JG, Powell RA, et al.
Building the bridge between animal movement and population dynamics.
Philos Transact Royal Soc B Bio Sci. 2010;365(1550):2289–301. https://doi.
org/10.1098/rstb.2010.0082.
52. Nathan R, Getz WM, Revilla E, Holyoak M, Kadmon R, Saltz D, et al. A
movement ecology paradigm for unifying organismal movement research.
Proc Natl Acad Sci. 2008;105:19052–9.
53. Nathan R, Spiegel O, Fortmann-Roe S, Harel R, Wikelski M, Getz WM. Using
tri-axial acceleration data to identify behavioral modes of free-ranging
animals: general concepts and tools illustrated for griffon vultures. J Exp
Biol. 2012;215(6):986–96. https://doi.org/10.1242/jeb.058602.
54. Northeastern Regional Climate Center. (2018). Northeast climate: state &
regional analyses. http://www.nrcc.cornell.edu/regional/tables/tables.html.
55. Nielson RM, Sawyer H, McDonald TL. BBMM: Brownian bridge movement
model. R package version 3.0; 2013.
56. Pohle J, Langrock R, van Beest FM, Schmidt NM. Selecting the number of
States in Hidden Markov Models: pragmatic solutions illustrated using
animal movement. J Agric Biol Environ Stat. 2017;22(3):270–93.
57. Pomerleau C, Patterson TA, Luque S, Lesage V, Heide-Jørgensen MP, Dueck
LL, et al. Bowhead whale Balaena mysticetus diving and movement patterns
in the eastern Canadian Arctic: implications for foraging ecology. Endanger
Species Res. 2011;5:167–77.
58. Ropert-Coudert Y, Wilson RP. Trends and perspectives in animal-attached
remote sensing. Front Ecol Environ. 2005;3(8):437–44. https://doi.org/10.1
890/1540-9295(2005)003[0437:TAPIAR]2.0.CO;2.
59. Sawyer H, LeBeau CW, McDonald TL, Xu W, Middleton AD. All routes are
not created equal: an ungulate's choice of migration route can influence its
survival. J Appl Ecol. 2019;56:1860–9.
60. Sullivan JD, Ditchkoff SS, Collier BA, Ruth CR, Raglin JB. Breeding behavior of
female white-tailed deer relative to conception: evidence for female mate
choice. Ecol Evol. 2017;7(7):2395–402. https://doi.org/10.1002/ece3.2845.
61. Sullivan JD, Ditchkoff SS, Collier BA, Ruth CR, Raglin JB. Recognizing the
danger zone: response of female white-tailed to discrete hunting events.
Wildl Biol. 2018;1:wlb.00455.
62. Taylor P, Crewe T, Mackenzie S, Lepage D, Aubry Y, Crysler Z, et al. The
Motus wildlife tracking system: a collaborative research network to enhance
the understanding of wildlife movement. Avian Conserv Ecol. 2017;12:8.
63. Thompson ID, Bakhtiari M, Rodgers AR, Baker JA, Fryxell JM, Iwachewski
E. Application of a high-resolution animal-borne remote video camera
with global positioning for wildlife study: observations on the secret
lives of woodland caribou. Wildl Soc Bull. 2012;36(2):365–70. https://doi.
org/10.1002/wsb.130.
64. Van Buskirk A. Estimating the effects of changes in harvest management on
white-tailed deer (Odocoileous virginianus) populations. University Park:
Master's thesis, Pennsylvania State University; 2020.
65. Whitehead H. Rules for roving males. J Theor Biol. 1990;145(3):355–68.
https://doi.org/10.1016/S0022-5193(05)80115-8.
66. Wilmers CC, Nickel B, Bryce CM, Smith JA, Wheat RE, Yovovich V. The
golden age of bio-logging: how animal-borne sensors are advancing the
frontiers of ecology. Ecology. 2015;96(7):1741–53. https://doi.org/10.1
890/14-1401.1.
67. Ylitalo AK, Heikkinen J, Kojola I. Analysis of central place foraging behaviour
of wolves using hidden Markov models. Ethology. 2021;127(2):145–517.
https://doi.org/10.1111/eth.13106.
Publisher’s Note
Springer Nature remains neutral with regard to jurisdictional claims in
published maps and institutional affiliations.You can also read