Multi-year effect of wetting on CH4 flux at taiga-tundra boundary in northeastern Siberia deduced from stable isotope ratios of CH4 - Biogeosciences
←
→
Page content transcription
If your browser does not render page correctly, please read the page content below
Biogeosciences, 16, 755–768, 2019
https://doi.org/10.5194/bg-16-755-2019
© Author(s) 2019. This work is distributed under
the Creative Commons Attribution 4.0 License.

Multi-year effect of wetting on CH4 flux at taiga–tundra boundary
in northeastern Siberia deduced from stable isotope ratios of CH4
Ryo Shingubara1,a , Atsuko Sugimoto2,3,4 , Jun Murase5 , Go Iwahana2,6 , Shunsuke Tei2,3 , Maochang Liang1,b ,
Shinya Takano1 , Tomoki Morozumi1 , and Trofim C. Maximov7,8
1 Graduate   School of Environmental Science, Hokkaido University, Sapporo, 060-0810, Japan
2 Arctic  Research Center, Hokkaido University, Sapporo, 001-0021, Japan
3 Faculty of Environmental Earth Science, Hokkaido University, Sapporo, 060-0810, Japan
4 Global Station for Arctic Research, Global Institution for Collaborative Research

and Education, Hokkaido University, Sapporo, 060-0808, Japan
5 Graduate School of Bioagricultural Sciences, Nagoya University, Nagoya, 464-8601, Japan
6 International Arctic Research Center, University of Alaska Fairbanks, Fairbanks, 99775-7340, USA
7 Institute for Biological Problems of Cryolithozone, Siberian Branch, Russian Academy of Sciences, Yakutsk, 677890, Russia
8 Institute of Natural Sciences, North-Eastern Federal University, Yakutsk, 677000, Russia
a currently at: Graduate School of Environmental Studies, Nagoya University, Nagoya, 464-8601, Japan
b currently at: College of Horticulture and Gardening, Yangtze University, Jingzhou, 434025, China

Correspondence: Atsuko Sugimoto (atsukos@ees.hokudai.ac.jp)

Received: 23 October 2018 – Discussion started: 7 November 2018
Revised: 7 January 2019 – Accepted: 24 January 2019 – Published: 11 February 2019

Abstract. The response of CH4 emission from natural wet-         to 2013. Large variations in δ 13 C and δD of dissolved CH4
lands due to meteorological conditions is important because      were observed in 2011, and smaller variations were seen
of its strong greenhouse effect. To understand the relation-     in 2012 and 2013, suggesting both enhancement of CH4 pro-
ship between CH4 flux and wetting, we observed interan-          duction and less significance of CH4 oxidation relative to
nual variations in chamber CH4 flux, as well as the concen-      the larger pool of dissolved CH4 . These multi-year effects
tration, δ 13 C, and δD of dissolved CH4 during the summer       of wetting on CH4 dynamics may have been caused by con-
from 2009 to 2013 at the taiga–tundra boundary in the vicin-     tinued soil reduction across multiple years following the wet-
ity of Chokurdakh (70◦ 370 N, 147◦ 550 E), located on the low-   ting. Delayed activation of acetoclastic methanogenesis fol-
lands of the Indigirka River in northeastern Siberia. We also    lowing soil reduction could also have contributed to the en-
conducted soil incubation experiments to interpret δ 13 C and    hancement of CH4 production. These processes suggest that
δD of dissolved CH4 and to investigate variations in CH4         duration of water saturation in the active layer can be impor-
production and oxidation processes. Methane flux showed          tant for predicting CH4 emission following a wetting event
large interannual variations in wet areas of sphagnum mosses     in the permafrost ecosystem.
and sedges (36–140 mg CH4 m−2 day−1 emitted). Increased
CH4 emission was recorded in the summer of 2011 when a
wetting event with extreme precipitation occurred. Although
water level decreased from 2011 to 2013, CH4 emission re-        1   Introduction
mained relatively high in 2012, and increased further in 2013.
Thaw depth became deeper from 2011 to 2013, which may            Atmospheric CH4 has an important greenhouse effect
partly explain the increase in CH4 emission. Moreover, dis-      (Myhre et al., 2013). The largest source of atmospheric CH4
solved CH4 concentration rose sharply by 1 order of mag-         is the emission from natural wetlands, which is considered to
nitude from 2011 to 2012, and increased further from 2012        be the main driver of interannual variations in the global CH4
                                                                 emission, depending on meteorological conditions such as

Published by Copernicus Publications on behalf of the European Geosciences Union.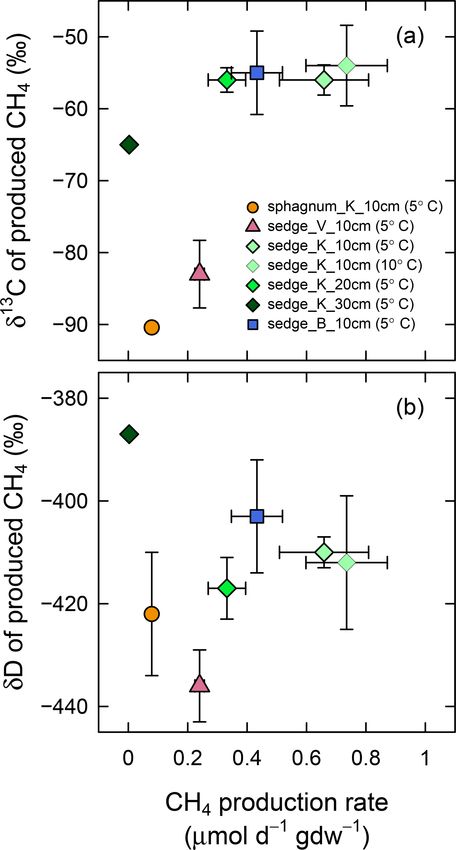
756               R. Shingubara et al.: Multi-year effect of wetting on CH4 flux at taiga–tundra boundary in NE Siberia

air temperature and precipitation (Ciais et al., 2013). For in-    vegetation types at the taiga–tundra boundary on the lowland
stance, Dlugokencky et al. (2009) reported that high temper-       of the Indigirka River in northeastern Siberia is controlled
atures in the Arctic and high precipitation in the tropics led     by soil moisture, which corresponds to microtopography.
to high CH4 emissions from natural wetlands, which caused          Larches, the dominant tree species in the taiga forests of east-
the observed large growth rates in atmospheric CH4 concen-         ern Siberia, grow on microreliefs with higher ground level
tration during 2007 and 2008. Atmospheric CH4 has been in-         and drier soil, while wetland vegetation such as sphagnum
creasing from 2007 through the present (Nisbet et al., 2014).      mosses and sedges, typically seen in wet tundra (van Huis-
   Methane flux from wetland soil to the atmosphere (we de-        steden et al., 2005; van der Molen et al., 2007), dominates
fine a positive flux value as CH4 emission) is determined          lower and wetter microreliefs. Thus, it is reasonable to as-
by three processes: CH4 production, oxidation, and trans-          sume that the taiga–tundra boundary ecosystem has various
port (Lai, 2009). Methane is produced by strictly anaer-           microreliefs in terms of interannual variation in soil wetness
obic Archaea (methanogens) mainly via hydrogenotrophic             conditions: always wet microreliefs, always dry microreliefs,
methanogenesis (4H2 +CO2 → CH4 +2H2 O) or acetoclastic             and microreliefs with large interannual wetness variations.
methanogenesis (CH3 COOH → CH4 +CO2 ) as an end prod-              Hence, this ecosystem is a suitable area to evaluate the pro-
uct of organic matter decomposition (Lai, 2009). In the soil’s     cesses controlling CH4 flux in relation to soil wetting and/or
aerobic zone, CH4 is oxidized to CO2 by methanotrophic             drying on an interannual timescale.
bacteria utilizing O2 , which reduces CH4 emission to the at-         In this study, to understand relationships between CH4
mosphere (Lai, 2009). Underground CH4 is transported to            flux and environmental factors, we observed interannual
the atmosphere via bubble ebullition, diffusion through soil       variations in chamber CH4 flux, along with the concentra-
layers and surface water, and via aerenchyma of vascular           tion, δ 13 C, and δD of dissolved CH4 during the summer,
plants (Lai, 2009).                                                from 2009 to 2013, at the taiga–tundra boundary located on
   High water levels can lead to development of reducing           Indigirka River lowlands in northeastern Siberia. We also
conditions in soil, which can promote CH4 production or de-        conducted soil incubation experiments to investigate how
press CH4 oxidation, both leading to increases in CH4 flux         δ values of CH4 reflect CH4 production and oxidation pro-
(Lai, 2009). This is reflected in the widely observed posi-        cesses in this ecosystem. In 2011, a wetting event with a
tive relationship between water level and CH4 flux, found          significant amount of precipitation occurred. We focused in
in a meta-analysis across the circum-Arctic permafrost zone        particular on the responses of CH4 flux and other underlying
(Olefeldt et al., 2013). Meanwhile, Desyatkin et al. (2014)        processes to this unusual wetting event.
observed increases in CH4 flux during the second consecu-
tive year of flooding at a thermokarst depression in boreal
eastern Siberia. Treat et al. (2007) reported observations at      2     Methods
a temperate fen in the northeastern USA, showing that high
water level coincided with high CH4 flux in interannual vari-      2.1    Study sites
ations. However, water level correlated negatively with CH4
flux over shorter timescales, namely as monthly means or           The taiga–tundra boundary on the lowlands of the Indigirka
individual measurements. These observational results imply         River was selected as our study area. Observations and sam-
that wetting is not directly related to CH4 flux in wetlands. To   pling were conducted at three sites (V: Verkhny Khatis-
understand the relationship between wetting and CH4 flux, it       takha; K: Kodac; B: Boydom) in the vicinity of Chokurdakh
is necessary to assess the underlying processes.                   (70◦ 370 N, 147◦ 550 E), Republic of Sakha (Yakutia), Russia
   Stable isotopes of CH4 have been used to estimate produc-       (Fig. 1 and Table 1). The sites are located in the Russian
tion pathways of CH4 (Sugimoto and Wada, 1993, 1995; Mc-           Arctic with an annual mean air temperature of −13.9 ◦ C
Calley et al., 2014; Itoh et al., 2015), determine the fraction    and an annual mean precipitation of 208 mm for the pe-
of oxidized CH4 versus produced CH4 (Marik et al., 2002;           riod of 1950–2008, according to the Baseline Meteorologi-
Preuss et al., 2013), and study mechanisms of CH4 transport        cal Data in Siberia database (Yabuki et al., 2011). Sites V, K,
by plants (Chanton, 2005). When CH4 in soil is lost by oxi-        and B are beside the Indigirka River or its tributary, and tree
dation or diffusion, both δ 13 C and δD of the remaining CH4       density decreases from site V to site B.
increase. While the hydrogen isotope ratio increases more             These study sites are underlain by continuous permafrost
than that of carbon during oxidation, both ratios are consid-      (Iwahana et al., 2014). Normally, snowmelt and the start of
ered to change to the same extent during diffusion. Thus it is     active layer thawing begin in the latter half of May through
useful to analyze both carbon and hydrogen isotopes of CH4         the first half of June, and the growing season occurs from
to distinguish the effects of both of these processes (Chanton,    the end of June through the beginning of August. Air tem-
2005).                                                             perature and surface soil temperature (10 cm in depth) peak
   The taiga–tundra boundary ecosystem (or transition zone)        in July, whereas the maximum thaw depth occurs from the
contains vegetation types of both taiga and tundra ecosys-         latter half of August to the first half of September. The freez-
tems. Liang et al. (2014) reported that the distribution of        ing of the active layer starts in the latter half of September to

Biogeosciences, 16, 755–768, 2019                                                        www.biogeosciences.net/16/755/2019/
R. Shingubara et al.: Multi-year effect of wetting on CH4 flux at taiga–tundra boundary in NE Siberia                                                       757

Table 1. Observation points of chamber CH4 flux. Concentration and isotopic compositions of dissolved CH4 were also observed in the
following wet areas.

                  Site                Landscape                 Observation points and            Dominant               Volumetric           Thaw
                                                                surface conditions                vegetation             water                depth
                                                                                                                         content (%)b         (cm)c
                  V (Verkhny                                    tree mound_V                      Green moss,            17 ± 5               23 ± 3
                  Khatistakha)                                                                    Larix gmelinii         (n = 3)              (n = 5)
                  70◦ 150 N           Larch forest              sedge_V                           Carex spp.,            48 ± 4               56 ± 3
                  147◦ 280 E          and wetland               (wet area)                        Eriophorum             (n = 3)              (n = 4)
                                                                                                  angustifolium
                                                                tree mound_K                      Green moss,            2.1 ± 0.6            23 ± 4
                  K (Kodac)a                                                                      Larix gmelinii         (n = 4)              (n = 9)
                  70◦ 340 N           Typical taiga–            sphagnum_K                        Sphagnum               42 ± 5               31 ± 8
                  148◦ 160 E          tundra boundary           (wet area)                        squarrosum             (n = 6)              (n = 15)
                                                                sedge_K                           Eriophorum             44 ± 4               32 ± 13
                                                                (wet area)                        angustifolium          (n = 6)              (n = 28)
                                                                tree mound_B                      Green moss,            6±2                  20 ± 4
                  B (Boydom)          Low-centered                                                Larix gmelinii         (n = 5)              (n = 8)
                  70◦ 380 N           polygon                   sedge_B                           Eriophorum             46 ± 2               36 ± 9
                  148◦ 090 E                                    (wet area)                        angustifolium          (n = 5)              (n = 8)
                a Site K was previously named Kryvaya (Iwahana et al., 2014) or Kodak (Liang et al., 2014). b Observed for the surface soil layer down to
                20 cm on 1 to 3 days in July 2011 at each observation point (see Table S2 for detailed observation dates). Standard deviations are shown.
                c Observed from early July to early August during 2010–2013 (see Table S1 for the interannual variation and Table S2 for detailed
                observation dates). Standard deviations are shown.

Figure 1. Locations of study sites. (a) Location of study region in northeastern Siberia (the Generic Mapping Tools 5.0.0). (b) Satellite image
of Indigirka River lowland around Chokurdakh village (Ckh: 70◦ 370 N, 147◦ 550 E) from Landsat 8. Observation sites (V, K, B) were selected
in this region beside the main stem and a tributary of the Indigirka River.

October and the whole active layer freezes from November                                 responding to microtopography and soil moisture (Liang et
to December.                                                                             al., 2014). Microrelief with a higher ground level is covered
   Observations of CH4 flux were conducted at seven points                               by green moss, larch trees, and shrubs of willows or dwarf
with three typical vegetation types, as summarized in Ta-                                birches. Conversely, lower microrelief is covered by wet-
ble 1. These vegetation types are distributed in patches, cor-                           land vegetation of sphagnum moss or sedges. In this study,

www.biogeosciences.net/16/755/2019/                                                                                         Biogeosciences, 16, 755–768, 2019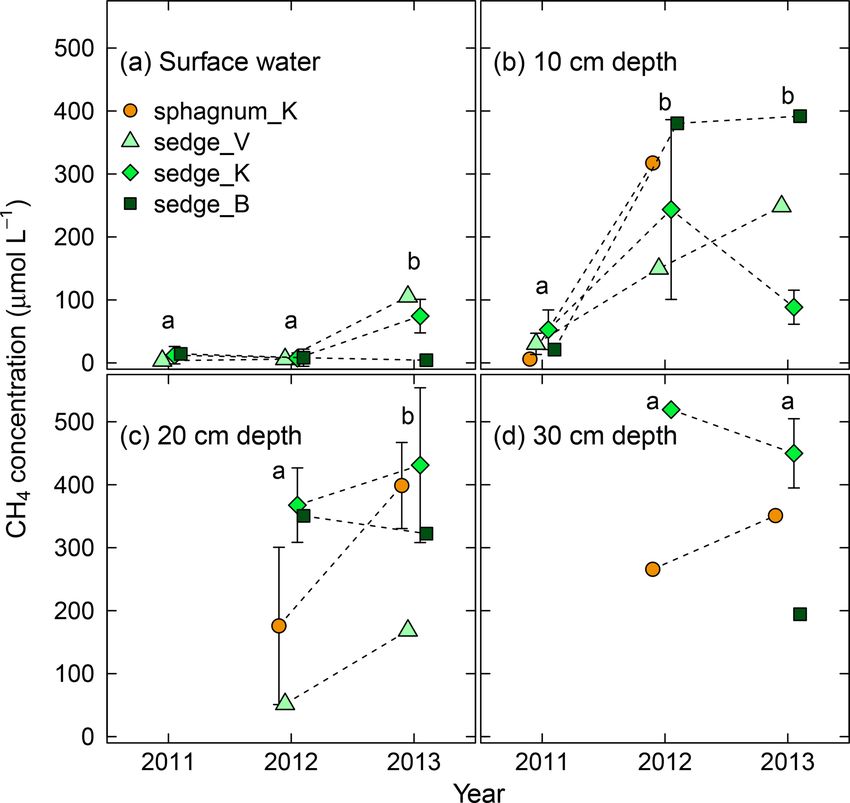
758              R. Shingubara et al.: Multi-year effect of wetting on CH4 flux at taiga–tundra boundary in NE Siberia

the former vegetation type was termed “tree mound”, and           Finally, headspace gas in the syringes was preserved in 10–
the latter type was termed “wet area”. Observation points         20 mL pre-evacuated glass vials with rubber septa.
in tree mounds were selected at each of the sites V, K,              Concurrently with each flux measurement, soil tempera-
and B and termed “tree mound_V”, “tree mound_K”, and              ture around the flux chamber was measured with a temper-
“tree mound_B” (Table 1). For observation points of wet ar-       ature sensor in an ORP electrode (PST-2739C, DKK-TOA
eas, a microrelief covered by sphagnum moss at site K was         Corporation, Japan) with an ORP meter (RM-30P or RM-
termed “sphagnum_K”, and points covered by sedges includ-         20P). After flux measurement samples were collected, thaw
ing, in particular, cotton sedges (Eriophorum angustifolium)      depth was observed on the same day around each chamber
at sites V, K, and B were termed “sedge_V”, “sedge_K”, and        by inserting a steel rod into the ground. From 2011 on, wa-
“sedge_B”, respectively. Measurements of volumetric water         ter level was also measured after flux measurements around
content in the surface soil layer (0–20 cm) by TDR (time          each chamber in wet areas using a scale. The water level was
domain reflectometry; TDR-341F, Fujiwara Scientific Com-          expressed as height relative to the ground surface or the moss
pany, Japan) showed that tree mounds were drier than wet          surface. Observation dates of these environmental factors are
areas; this will be described in Sect. 3.1 (Table 1).             shown in Table S2.

                                                                  2.3   Soil incubation experiments and microbial
2.2   Field observations and samplings
                                                                        community analysis

Methane flux was observed using the chamber method in             Soil incubation experiments were conducted to estimate δ 13 C
each of the typical vegetation types described in Sect. 2.1       and δD of produced CH4 and fractionation factors of CH4
during the summer from 2009 to 2013. A transparent cylin-         oxidation for carbon and hydrogen isotopes. For CH4 pro-
drical flux chamber (acrylic resin, base area 4.7 × 102 cm2 ,     duction experiments, surface soil was sampled in all the
height 25 cm) was installed on the ground. The headspace          wet areas in Table 1 (sedge_V, sphagnum_K, sedge_K, and
gas of the chamber (ca. 12 L) was circulated with a pump          sedge_B) during summer 2013. Samples were taken at 10 cm
(ca. 1 L min−1 ). The chamber was closed for 15–30 min and        in depth at each sampling location. To observe vertical vari-
headspace gas was sampled two to three times after chamber        ations in δ values of produced CH4 within the thaw layer, we
closure. In most cases, the chamber was closed for 30 min         also collected samples from two additional depths (20 and
and headspace gas was collected at 0, 15, and 30 min after        30 cm) at sedge_K, which is a location typical of the taiga–
closure. Samples were kept in pre-evacuated glass vials with      tundra boundary region. These samples were from organic
butyl rubber septa. To minimize soil disturbance, we stepped      layers, except for the samples from 30 cm, which were from
on wooden boards at observation points. In 2009 and 2010,         the top of the mineral layer.
CH4 flux measurements were conducted in the latter half of           Approximately 10 mL of soil was directly transferred into
July, and from 2011 to 2013 observations were conducted           each plastic syringe (60 mL maximum capacity) along with
continuously from early July to the end of July or early Au-      in situ water (approximately 50 mL) to prevent the sample
gust. For all of these years, the observation period included     from being oxidized by the atmosphere. Syringes were pre-
the warmest season when CH4 emission was expected to be           served in water to ensure no leakage and were immediately
the most active (Table S2).                                       preincubated for 4–8 days and then incubated in triplicate for
   For measurements of dissolved CH4 , surface water and          8 days. Preincubation and incubation temperatures were set
soil pore water were sampled in wet areas from 2011 to 2013.      at 5 ◦ C. We also incubated syringes at 10 ◦ C for samples from
Surface water was directly taken up by a 50 mL plastic sy-        10 cm in depth at sedge_K to investigate temperature depen-
ringe with a three-way cock attached to its tip, whereas soil     dence of δ values of produced CH4 . For each of these seven
pore water was sampled by a 50 mL syringe (with a three-          incubation treatments (sphagnum_K, sedge_V, sedge_K, and
way cock attached) through a plastic tube inserted in the soil.   sphagnum_K, 10 cm in depth, 5 ◦ C; sedge_K, 20 and 30 cm
Soon after collecting water samples, dissolved CH4 was ex-        in depth, 5 ◦ C; sedge_K, 10 cm in depth, 10 ◦ C), three repli-
tracted inside the syringes with the headspace method, af-        cate soil samples were prepared. Water in each incubation
ter adding 15–35 mL of the atmosphere prepared in a 10 L          syringe was sampled twice at the start and the end of incuba-
aluminum bag. This atmosphere was collected beforehand            tion, and dissolved CH4 was extracted using the headspace
at Chokurdakh village or our observation sites and filtered       method described in Sect. 2.2. As a consequence, dissolved
using Molecular Sieves 5Å (1/16 pellets, FUJIFILM Wako            CH4 samples were collected in triplicate for each of the ini-
Pure Chemical Corporation, Japan). The atmosphere was an-         tial and final conditions of one incubation treatment.
alyzed later for CH4 concentration and isotopic compositions         To interpret CH4 production in the incubation experiments
as a background sample (2.0–4.3 ppm for CH4 concentra-            (Sect. 2.3), phylogenic composition of methanogens in the
tion, −53 ‰ to −45 ‰ for δ 13 C of CH4 , and −168 ‰ to            surface soil was additionally analyzed in 2016 using 16S
−78 ‰ for δD of CH4 ). The syringes were vigorously shaken        rRNA gene sequencing. In July 2016, soil samples from
for 1 min and left standing for 5 min to ensure equilibration.    10 cm in depth were collected in 10 mL plastic tubes in trip-

Biogeosciences, 16, 755–768, 2019                                                       www.biogeosciences.net/16/755/2019/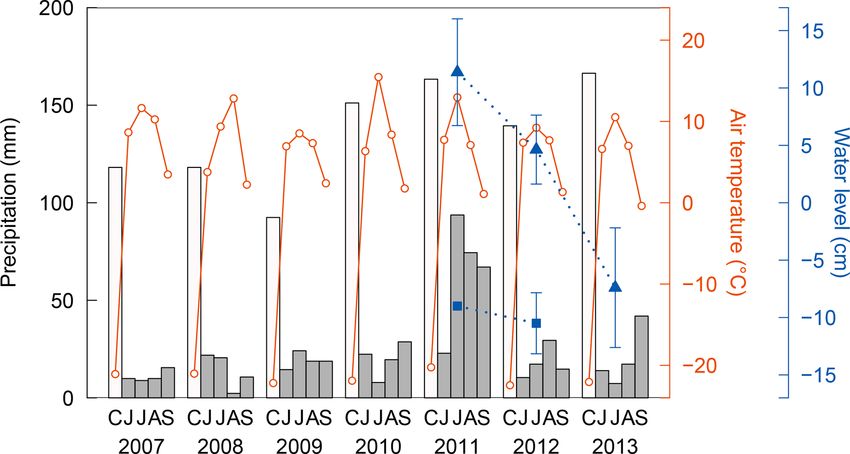
R. Shingubara et al.: Multi-year effect of wetting on CH4 flux at taiga–tundra boundary in NE Siberia                          759

licate in the same four wet areas as the anaerobic incuba-        sisting of two gas chromatographs, a combustion reactor,
tion experiments and kept frozen until analysis. DNA was          and an isotope ratio mass spectrometer (MAT253, Thermo
extracted from 3 g of the soil samples as described by Ikeda et   Fisher Scientific, USA) – and on a GC–GC–P–IRMS (P: py-
al. (2004). Extracted DNA was purified using the OneStep™         rolysis in a HTC reactor of GC IsoLink, Thermo Fisher
PCR Inhibitor Removal Kit (Zymo Research, California) and         Scientific), respectively. Carbon and hydrogen isotope ra-
quantified using the Quant-iT PicoGreen dsDNA assay kit           tios obtained were represented relative to Vienna Peedee
(Invitrogen, Carlsbad, California). Amplicon sequencing was       Belemnite (VPDB) and Vienna Standard Mean Ocean Wa-
conducted targeting the V3–V4 regions of 16S rRNA genes           ter (VSMOW), respectively. Precisions of the analyses were
(Caporaso et al., 2011). Sequences obtained were processed        ±0.2 ‰ and ±2 ‰ for δ 13 C and δD, respectively. When cal-
through the QIIME pipeline (Caporaso et al., 2010). A rep-        culating δ 13 C and δD of dissolved CH4 , the effect of CH4 in
resentative sequence was picked from each operational tax-        background air was removed based on the mass balance. In
onomic unit (OTU), and the Greengenes reference database          the aerobic incubation experiments, the fractionation factors
(version 13.8) was used to assign taxonomic information and       of CH4 oxidation for carbon and hydrogen were calculated
calculate the relative abundance of methanogenic archaea          using the following Rayleigh distillation equation:
present.
   For CH4 oxidation, surface organic layers (0–13 cm in             Rt        1          [CH4 ]t
                                                                  ln     =         − 1 ln         ,                          (1)
depth) were sampled at sphagnum_K and sedge_K in                     R0       αox         [CH4 ]0
July 2012 and then kept in a refrigerator until the experi-
ment (6 days). These soil samples were cut into small pieces      where R0 and Rt represent isotope ratios under initial condi-
and mixed well with air. A total of 10 g (about 40 mL) of         tions and at time t, respectively; αox is the fractionation factor
soil sample was transferred into plastic syringes (maximum        for CH4 oxidation (defined so that αox > 1); and [CH4 ]0 and
120 mL) in quadruplicate for each sampling location. Ap-          [CH4 ]t are CH4 concentrations under initial conditions and
proximately 80 mL of air and 0.2–2 mL of 25 % CH4 gas             at time t, respectively.
were added to each syringe so the total volume in each sy-           All statistical tests for detecting differences in CH4 fluxes
ringe was 120 mL and the headspace CH4 concentration was          or dissolved CH4 concentrations were conducted using
5.0 × 10² –4.8 × 10³ ppm. Syringes were preserved in water        R software (version 3.3.3). Mann–Whitney’s U test was ap-
and incubated at 8 ◦ C for 8 days. Headspace gas was sampled      plied to compare magnitudes between 2 years of data and
on day 0, day 4, and day 8 from each syringe into 20 mL pre-      Steel–Dwass’s multiple comparison test was used to compare
evacuated glass vials with rubber septa. Consequently, qua-       magnitudes among 3 years or more of data.
druplicate gas samples were collected for each location and
each sampling day.                                                2.5    Meteorological data

                                                                  Air temperature and precipitation observed at a weather sta-
2.4   Sample analysis and data processing
                                                                  tion in Chokurdakh (WMO station 21946) were used to in-
                                                                  vestigate interannual variations in meteorological conditions
Methane concentrations in air samples were analyzed us-
                                                                  during our observation period of CH4 flux (2009–2013) and
ing a gas chromatograph (HP6890 series G1530A, Hewlett
                                                                  during the preceding 2 years (2007–2008). The distance be-
Packard, USA) equipped with a flame ionization detector and
                                                                  tween the weather station and our farthest observation site
a CP-carboPLOT capillary column (Varian, USA). Methane
                                                                  (site V) is approximately 45 km (Fig. 1). These data were ob-
flux was calculated from CH4 concentration in chamber
                                                                  tained from GHCN-Daily, a NOAA database (Menne et al.,
headspace by a linear regression of two to three concentra-
                                                                  2012a, b).
tion values against the time elapsed since chamber closure.
The detection limit of CH4 flux for each observation was cal-
culated as 0.8–2.4 mg CH4 m−2 day−1 , based on whether the        3     Results
change of chamber CH4 concentration during the observation
was significant relative to the precision of CH4 concentration    3.1    Environmental factors
analysis. Regression r 2 was calculated (formally) as ≥ 0.87,
when the flux value was larger than 2 mg CH4 m−2 day−1 .          Soil wetness conditions and thaw depth differed among veg-
Dissolved CH4 concentrations were obtained from calcula-          etation types (Table 1). Tree mounds had lower surface water
tion of the headspace method for which equilibrations of          content (2.1 %–17 %) than wet areas (42 %–48 %). Among
CH4 between gas and water phases are described by the Bun-        the two types of wet areas, the water level was lower in wet
sen absorption coefficient of CH4 (Yamamoto et al., 1976).        areas of sphagnum mosses than those of sedges (Fig. 2).
   Carbon and hydrogen isotope ratios of in situ dissolved        Wet areas of sedges experienced water levels higher than
CH4 and CH4 samples from both incubation experiments              the ground surface (defined as 0 cm), reaching more than
were analyzed on a GC–GC–C–IRMS (modified after Sug-              10 cm above the ground surface. Corresponding with soil wa-
imoto, 1996) – which is a continuous flow system con-             ter content, the thaw depth was shallower at dry tree mounds

www.biogeosciences.net/16/755/2019/                                                          Biogeosciences, 16, 755–768, 2019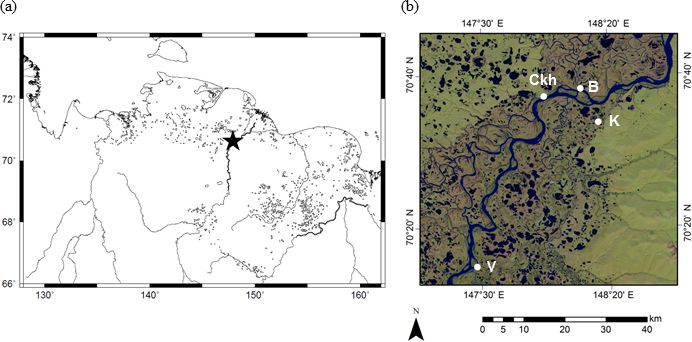
760 R. Shingubara et al.: Multi-year effect of wetting on CH4 flux at taiga–tundra boundary in NE Siberia
Figure 2. Interannual variations in precipitation (bars) and air tem- Figure 3. Interannual variations in averaged CH4 flux in tree
perature (solid lines) observed at a weather station at Chokurdakh mounds (denoted as “Tr”) and wet areas (“Wt”) for the main sum-
for the cold season with snow cover (C: total from October in the mer seasons from 2009 to 2013. Replication numbers (“n”) are
previous year to May in the current year) and the warm season shown for each averaged flux value, and standard deviations are rep-
(JJAS), and water level (dotted lines) measured in wet areas of resented by error bars. Different letters show statistical interannual
sedges (triangle) and sphagnum mosses (square). Water level was differences in the flux values for wet areas. See Table S2 for flux
very low (< −12 cm) in the wet area of sphagnum in 2013 and could values at respective observation points.
not be measured. Error bars represent standard deviations. Methane
flux was observed during the main summers (early July to early Au-
gust) from 2009 to 2013. (Table S2) were conducted in concert with dissolved CH4
analysis, and the interannual variation during this period will
be discussed in detail.
(20–23 cm) and deeper in wet areas (31–56 cm). In wet ar- With regards to the spatial variation in CH4 flux, tree
eas, thaw depth became deeper from 2011 (22 ± 4 cm) to mounds had consistently small values around the detection
2012 (25 ± 8 cm) and 2013 (35 ± 7 cm) in observations made limit for all measurements (−4.9 to 1.9 mg CH4 m−2 day−1 ),
during mid-July (Table S1 in the Supplement). The overall while wet areas showed CH4 emissions. From 2009 to 2013,
average thaw depth observed on days when flux measure- the CH4 flux in wet areas showed large interannual vari-
ments were taken was 31 ± 12 cm (n = 77, 9–58 cm between ations ranging from 36 to 140 mg CH4 m−2 day−1 . The
3 July and 9 August). flux increased in 2011 when the wetting event occurred,
Figure 2 shows persistently low annual precipitation (162– and then remained relatively large in 2012 (compared
173 mm) from 2007 to 2009. In 2010, July air tempera- to 2009 and 2010). Moreover, the flux increased again
ture was characteristically high (15.5 ◦ C) accompanying low from 2011/2012 to 2013 (p < 0.05). No statistically sig-
monthly precipitation (8 mm). These show dry conditions nificant correlation was found when CH4 flux was plotted
during our flux observations in 2009 and 2010. Parmentier against soil temperature (10 cm in depth), thaw depth, or wa-
et al. (2011) reported that water level was lower in sum- ter level using all the data from wet areas (Fig. S1 in the
mer 2009 than the previous two summers at a tundra re- Supplement).
search station (Kytalyk) in the vicinity, approximately 30 km In addition to CH4 flux, dissolved CH4 concentration in-
to the northwest of Chokurdakh. In contrast, precipitation creased after the wetting event in 2011 (Fig. 4). From 2011
in July 2011 was extremely high (94 mm) with a relatively to 2012, CH4 concentration in soil pore water at 10 cm in
mild temperature (13.0 ◦ C), which caused an unusual wet- depth (Fig. 4b) exhibited a sharp increase of 1 order of mag-
ting. High precipitation continued in August (74 mm) and nitude (p < 0.005). It remained high from 2012 to 2013, and
September (67 mm) of the same year. Corresponding with the concentrations in surface water and that at 20 cm in depth
this heavy rainfall, water levels were also high in 2011, and (Fig. 4a and c) also increased significantly over the same pe-
subsequent observations show a clear decrease from 2011 riod (p < 0.05). No significant difference in concentration
to 2013 in wet areas of sedges (p < 0.005). Water levels also was observed at 30 cm in depth between 2012 and 2013. In
declined in wet area of sphagnum mosses, with values of −9, terms of vertical variation, the concentration in surface water
−10 cm, and less than −12 cm in 2011–2013. was lower than that in soil pore water (10, 20, and 30 cm in
depth).
3.2 CH4 flux and dissolved CH4 concentration
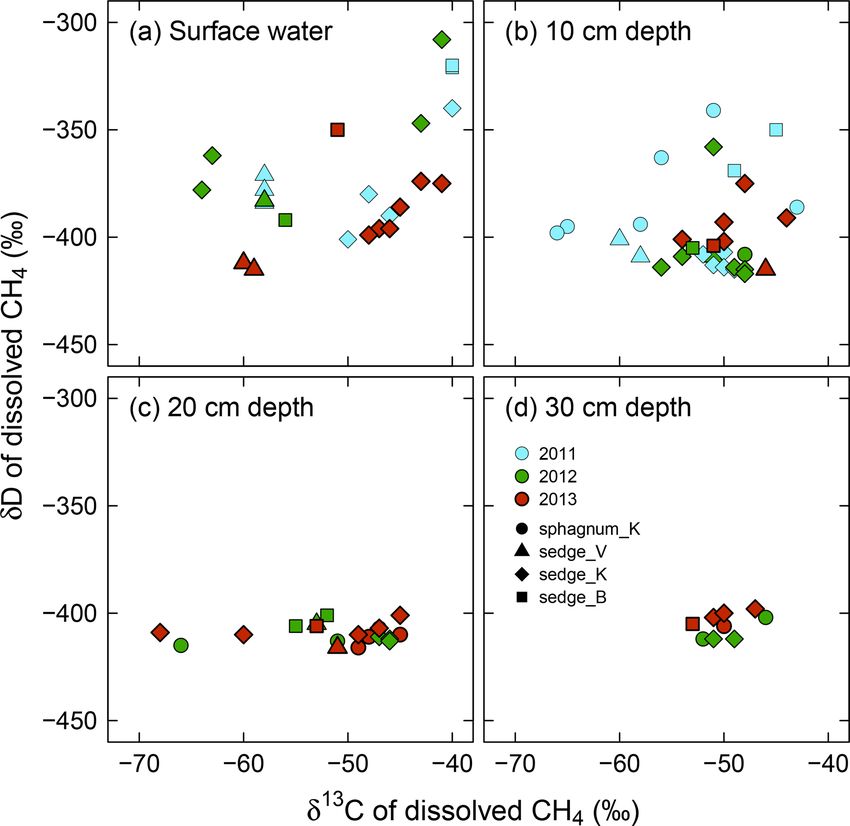
3.3 δ 13 C and δD of in situ dissolved CH4
Obtained CH4 flux shows clear spatial and interannual vari-
ations (Fig. 3). Individual flux measurements (n = 143 in to- Variability in both δ 13 C and δD of dissolved CH4 was
tal) are summarized as mean values for the main summer smaller in deeper layers, showing different patterns between
seasons. From 2011 to 2013, continuous flux observations δ 13 C and δD, and across years (Fig. 5). The δ 13 C of dis-
Biogeosciences, 16, 755–768, 2019 www.biogeosciences.net/16/755/2019/R. Shingubara et al.: Multi-year effect of wetting on CH4 flux at taiga–tundra boundary in NE Siberia 761
Figure 4. Interannual variation in dissolved CH4 concentration
Figure 5. In situ δ 13 C versus δD of dissolved CH4 in (a) surface
in (a) surface water and soil pore water at (b) 10 cm, (c) 20 cm,
water and soil pore water at (b) 10 cm in depth, (c) 20 cm in depth,
and (d) 30 cm in depth in wet areas from 2011 (wetting event)
and (d) 30 cm in depth from the wetting event in 2011 to 2013.
to 2013. Different letters in each panel denote statistical differences
Individual delta values are shown here. See Table S3 for averaged
among years in averaged concentration across the four wet areas
delta values for each observation point and each year.
(p < 0.05). Error bars represent standard deviations. See Table S3
for numerical values of dissolved CH4 concentrations.
3.4 Soil incubation experiments and microbial
solved CH4 had similarly large ranges (−68 ‰ to −40 ‰) community analysis
in surface water and at 10 cm and 20 cm in depth, com-
pared to a small range (−53 ‰ to −46 ‰) at 30 cm in In the anaerobic incubation experiment, the CH4 produc-
depth. The δD of dissolved CH4 was variable only in sur- tion rate was different among sampling locations (Fig. 7);
face water (−415 ‰ to −308 ‰) and at 10 cm in depth the rate was higher for sedge_K and sedge_B (0.66 ±
(−417 ‰ to −341 ‰), whereas it had a constant value of 0.15 and 0.43 ± 0.09 µmol day−1 g−1 (dry weight), respec-
around −408 ‰ at 20 and 30 cm in depth. Additionally, δ 13 C tively) than sedge_V and sphagnum_K (0.24 ± 0.02 and
values approached a relatively high value (approximately 0.08 ± 0.01 µmol day−1 g−1 (dry weight), respectively). At
−50 ‰) at depth, while δD values converged to almost their sedge_K, the sampling location tested in detail, produc-
lowest value. In terms of interannual variations in δ 13 C and tion was more rapid for shallower soil layers among
δD of dissolved CH4 from 2011 to 2013, both δ 13 C and δD the 10, 20, and 30 cm in depth (0.66 ± 0.15, 0.33 ± 0.06,
values in surface soil pore water (10 cm in depth) were scat- 0.003 ± 0.004 µmol day−1 g−1 (dry weight), respectively;
tered more widely in 2011, showing standard deviations (SD) p < 0.01 in Welch’s ANOVA test), while no difference
of 6.6 ‰ and 24 ‰, respectively, whereas their ranges were in the rate was found between incubation temperatures
smaller in 2012 and 2013 (SD: 3.3 ‰ and 17 ‰ at maxima, (0.66 ± 0.15 µmol day−1 g−1 (dry weight) at 5 ◦ C and 0.74 ±
respectively). 0.14 µmol day−1 g−1 (dry weight) at 10 ◦ C, p > 0.5 in t test).
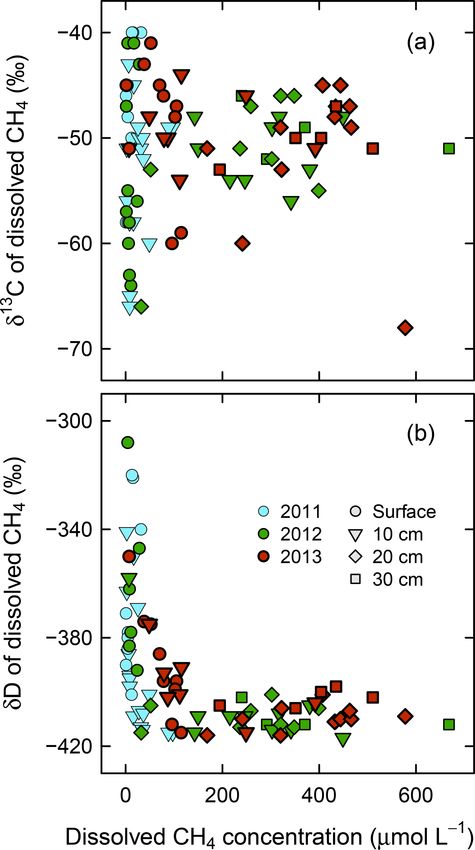
As shown in Fig. 6, convergence of δ 13 C and δD of dis- When the CH4 production rate was high, the δ 13 C and δD
solved CH4 is associated with dissolved CH4 concentrations. values of produced CH4 were less variable irrespective of
The δ 13 C and δD values of dissolved CH4 , including surface sampling location, sampling depth, or incubation tempera-
water and 10 cm in depth, converged at high CH4 concentra- ture. The δ 13 C value of produced CH4 at a high produc-
tions to the values seen in deeper soil layers (δ 13 C = −50 ± tion rate (> 0.26 µmol day−1 g−1 ) (dry weight) was −55 ±
5 ‰ and δD = −408 ± 5 ‰ at > 200 µmol CH4 L−1 ). 4 ‰ (n = 12). Similarly, δD under rapid CH4 production
was −410 ± 9 ‰ (n = 12). These δ 13 C and δD values of
CH4 obtained under rapid production were mostly compa-
rable with the δ values of in situ dissolved CH4 that con-
verged in deep soil layers (δ 13 C = −50 ± 2 ‰ at 30 cm in
depth and δD = −408 ± 5 ‰ at 20–30 cm in depth; Fig. 5c
www.biogeosciences.net/16/755/2019/ Biogeosciences, 16, 755–768, 2019762 R. Shingubara et al.: Multi-year effect of wetting on CH4 flux at taiga–tundra boundary in NE Siberia
Figure 6. In situ (a) δ 13 C and (b) δD versus concentration of dis-
solved CH4 at four depths (surface water, 10, 20, and 30 cm) in wet Figure 7. (a) δ 13 C and (b) δD of produced CH4 versus CH4 pro-
areas from 2011 to 2013. duction rate in the anaerobic soil incubation experiment. Produc-
tion rates are shown in micromoles of produced CH4 per day and
per weight of dry soil in grams. Soil samples were collected at four
and d), although δ 13 C values in the incubation experiment observation points (sphagnum_K, sedge_V, sedge_K, and sedge_B)
were slightly lower than those in situ. at three depths (10, 20, and 30 cm) and incubated at two tempera-
In the microbial community analysis using 16S rRNA tures (5 and 10 ◦ C). These samples contain organic layers except for
gene sequencing (Fig. 8), soil with high rates of CH4 pro- those collected at 30 cm. Error bars represent standard deviations.
duction shown in the incubation experiment (sedge_K and
sedge_B as in Fig. 7) had more abundant total methanogens
within the detected archaea than that with slow CH4 pro- and sedge, respectively, while carbon isotope fractionations
duction rates (sphagnum_K and sedge_V). Acetoclastic were 1.021 and 1.015, respectively.
methanogens in the order Methanosarcinales were higher in
proportion among methanogens in sedge_K and sedge_B, 4 Discussion
where δ 13 C values of produced CH4 in the incubation were
higher. In contrast, Methanosarcinales were fewer in propor- 4.1 CH4 flux at tree mounds and wet areas at the
tion in sphagnum_K, where δ 13 C of the produced CH4 was taiga–tundra boundary on the Indigirka River
lower. lowlands
In the CH4 oxidation experiment, CH4 concentration in
headspace declined continuously in every sample (Fig. S2). Methane flux observed in our study was clearly larger in wet
As CH4 oxidation proceeded, both δD and δ 13 C of the re- areas than at dry tree mounds (Table 1, Fig. 3). Such differ-
maining CH4 increased with a linear relationship between ences in CH4 flux between wetland vegetation and dry areas
them (Figs. 9 and S2). Observed slope 1(δD)/1(δ 13 C) with trees or shrubs is generally observed (van Huissteden et
was 11, indicating a much larger fractionation of hydro- al., 2005; van der Molen et al., 2007; Flessa et al., 2008) and
gen than carbon, regardless of vegetation types in wet ar- is consistent with the fact that CH4 production requires re-
eas (sphagnum or sedge). The hydrogen isotope fractiona- ducing conditions in soil (Conrad, 2007). Our CH4 flux in
tion factors of CH4 oxidation calculated from the data shown wet areas (36–140 mg CH4 m−2 day−1 ) was comparable to
in Fig. 9 were 1.25 and 1.16 for wet areas of sphagnum that reported for wet tundras (32–101 mg CH4 m−2 day−1 ) or
Biogeosciences, 16, 755–768, 2019 www.biogeosciences.net/16/755/2019/R. Shingubara et al.: Multi-year effect of wetting on CH4 flux at taiga–tundra boundary in NE Siberia 763
Figure 9. Enrichment of D/H (CH4 ) and 13 C/12 C (CH4 ) through
CH4 oxidation during the aerobic incubation experiment of surface
organic layers from wet areas of sphagnum mosses and sedges at
Figure 8. Phylogenetic compositions of methanogenic archaea by site K. Individual delta values of the headspace CH4 from each in-
order in wet areas. Soil samples (organic layers) were taken in tripli- cubated syringe and each day are shown. Initial isotopic composi-
cate from 10 cm in depth in each wet area in July 2016. See Table S5 tions of the headspace CH4 were −66 ‰ to −65 ‰ for δ 13 C and
for detailed results. −167 ‰ to −162 ‰ for δD.
permafrost fens (42–147 mg CH4 m−2 day−1 ) in a database
across permafrost zones compiled by Olefeldt et al. (2013). could eliminate O2 from soil pore spaces due to water satu-
In forests, many studies have observed CH4 absorption in- ration. These reducing conditions may have been preserved
stead of emission (King, 1997; Dutaur and Verchot, 2007; by freezing of the soil throughout the following winter. Ad-
Flessa et al., 2008; Morishita et al., 2014). However, our ob- ditionally, a surface soil layer saturated with ice could have
servations at tree mounds rarely found CH4 absorption or prevented snowmelt water (rich in O2 ) from infiltrating the
emission. In addition, CH4 was not consumed even under soil during the spring thaw season of 2012 (Woo, 2012).
O2 - and CH4 -rich conditions in incubation experiments of These processes would have led to the continuation of re-
tree mound soil from site K (Murase et al., 2014), indicating ducing conditions in the soil, which were created in sum-
that a lack of methanotrophic bacterial activity limited CH4 mer 2011, into 2012. Through further decomposition of soil
absorption at this vegetation type. Our results show that CH4 organic matter with the consumption of O2 , reducing soil
emission from wet areas is expected to make a greater contri- conditions may have been exacerbated in the water-saturated
bution to ecosystem-scale CH4 exchange at the taiga–tundra soil layer to a greater extent in summer 2012. Water in the
boundary on the Indigirka River lowlands. saturated soil layer may be retained without exchange for a
relatively long time at our study sites because lateral runoff is
4.2 Methane flux, production, and oxidation responses assumed to be small in the flat floodplain that comprises the
to the wetting event Indigirka River lowlands (Nassif and Wilson, 1975). In addi-
tion, deep percolation loss is prevented by the impermeable
In 2009 and 2010 the CH4 emission in wet areas was low permafrost layer (Woo, 2012). From summer 2012 to sum-
(Fig. 3), even at relatively high soil temperatures in 2010 mer 2013, reducing conditions in the soil may have been sim-
(Fig. S1), under dry conditions that were not directly ob- ilarly prolonged, especially in the deep soil layer, despite the
served in this study. The wetting event in 2011 initiated the decrease in water level from summer 2011 to summer 2013.
high CH4 emission that continued through 2013 despite de- This continuous soil reduction from 2011 to 2013 could have
creasing water levels (Fig. 2). Moreover, a further increase in promoted CH4 production and/or decreased CH4 oxidation,
flux was observed in 2013, accompanying a buildup of dis- which may explain the increase in dissolved CH4 concentra-
solved CH4 (2011–2013) as shown in Fig. 4. tion and CH4 flux in wet areas following the wetting event
These interannual variations from 2011 to 2013 could be and continuing until 2013 (Figs. 3 and 4).
caused by the development of reducing soil conditions over In 2011, δ 13 C and δD of dissolved CH4 (10 cm in depth)
multiple years after the wetting event. Reducing soil con- were scattered broadly across a wide range, whereas in 2012
ditions may have developed, to some extent, as a result of and 2013 the ranges were narrower and they clustered around
the extreme precipitation in the summer of 2011 (Fig. 2). a high δ 13 C value (−50 ‰) and a low δD value (−408 ‰;
The surface soil layer, particularly under high water levels, Fig. 5b). Considering that δD increased much more rapidly
www.biogeosciences.net/16/755/2019/ Biogeosciences, 16, 755–768, 2019764 R. Shingubara et al.: Multi-year effect of wetting on CH4 flux at taiga–tundra boundary in NE Siberia than δ 13 C in our oxidation experiment (Fig. 9), δD can be and Iwahana et al., 2014) due to a shallow active layer un- considered a sensitive indicator of CH4 oxidation. In con- derlain by permafrost. Therefore, decomposition of organic trast, δ 13 C is not a good indicator because its fractionation matter can be slow (Treat et al., 2015), which would slowly factor of CH4 oxidation (1.015–1.021) was similar to that decrease soil redox potential, allowing it to remain relatively of CH4 diffusion (1.019; Chanton, 2005); thus the effects of high in the first year of wetting. CH4 oxidation and diffusion cannot be discerned by δ 13 C. In the following 2 years (2012–2013), we observed redox Additionally, δD of dissolved CH4 (Fig. 5) was clearly lower potential values lower than −100 mV in wet areas (Table S6), in deeper layers (20 and 30 cm in depth) than in shallower which are well below the upper limit for CH4 production in layers (surface water and 10 cm in depth), which indicates δD soil (Conrad, 2007; Street et al., 2016). Methane production showed CH4 oxidation in situ as well because shallower lay- at a potential higher than −100 mV can also occur because ers are provided with O2 from the atmosphere and precipita- soil is heterogeneous and can have more reducing microsites tion. The effect of CH4 exchange between surface dissolved than the rest of the bulk soil, where redox potential can be CH4 and atmospheric CH4 can be excluded because all the measured (Teh et al., 2005; Teh and Silver, 2006). dissolved CH4 observed in this study was highly oversatu- In addition to the multi-year soil reduction, it appears that rated (> 0.3 µmol L−1 , Fig. 4) compared to the equilibrium the wetting event led to the thaw depth increase in wet ar- concentration of atmospheric CH4 (4–5 nmol L−1 , assuming eas from 2011 to 2013 (Table S1). Although thaw depth in- 1–10 ◦ C water temperature and 2 ppm atmospheric CH4 con- creased, summer air temperatures decreased from 2011 (7.7 centration; Yamamoto et al., 1976). Thus, δD values at 10 cm and 13.0 ◦ C as June and July mean temperatures, respec- in 2011 were scattered broadly compared with those in 2012 tively) to 2012 (7.4, 9.2 ◦ C) and 2013 (6.6, 10.5 ◦ C) as shown and 2013 that clustered around a low value, suggesting that in Fig. 2. The wetting event may have led to the CH4 flux in- CH4 oxidation was significant in the surface soil layer dur- crease from 2011 to 2013 (Fig. 3) partly through the thaw ing the year of the wetting event (2011). In 2012 and 2013, depth increase, by thickening the soil layer where CH4 pro- CH4 oxidation became insignificant, relative to the larger duction occurs (Nakano et al., 2000; van Huissteden et al., pool of dissolved CH4 (Fig. 4). In the CH4 production incu- 2005). However, the clear increase in dissolved CH4 con- bation experiment, δ 13 C and δD of produced CH4 were less centration (Fig. 4) and the enhanced CH4 production and variable at higher production rates (δ 13 C = −55 ± 4 ‰ and less significant CH4 oxidation reflected in our isotopic data δD = −410 ± 9 ‰ as in Fig. 7). Analogously, those of in situ (Fig. 5b) cannot be explained by the thaw depth increase. Ad- dissolved CH4 converged at a high CH4 concentration around ditionally, in the incubation experiment of CH4 production similar values (δ 13 C = −50 ± 5 ‰ and δD = −408 ± 5 ‰ in (Fig. 7), the CH4 production rate under anaerobic conditions Fig. 6). This suggests that δ values of produced CH4 became was slower in the deeper layer, especially at 30 cm in depth almost constant under rapid CH4 production in situ and that (mineral soil) compared to 10 cm and 20 cm in depth (or- the convergence of δ values of dissolved CH4 observed in ganic soil) in sedge_K. Treat et al. (2015) also reported, from situ reflect rapid CH4 production. Hence, the narrow ranges a pan-Arctic synthesis of anaerobic incubations, that differ- of δ 13 C and δD values of dissolved CH4 at 10 cm in depth ob- ences in soil types (organic/mineral) and in substrate quality served in 2012 and 2013 (δ 13 C around −50 ‰ and δD around along depth are important controls on CH4 production rate. −408 ‰, Fig. 5b) suggest enhanced CH4 production relative Our results from the incubations suggests that the deep layer to the wetting year (2011). comprised of mineral soil, where CH4 production becomes Multi-year effects of wetting on CH4 flux through soil re- active when thaw depth increases, is not the main region for duction processes have been previously proposed by Kuma- CH4 production. gai and Konno (1998) and Desyatkin et al. (2014) as one This study did not evaluate vegetation cover quantitatively, possible factor for explaining the increase in CH4 flux af- and the wetting event might have also led to some vegeta- ter wetting. Kumagai and Konno (1998) reported a CH4 flux tion change (such as increase in sedges), although no drastic increase at a temperate rice field in Japan 1 year after the rice changes were found visually in the observed wet areas. In- field was irrigated and restored from farmland that had been crease in cover by sedges might have raised CH4 flux partly drained for 8 years. Desyatkin et al. (2014) observed flux in- by providing labile organic substrate for CH4 production or creases at a thermokarst depression in boreal eastern Siberia conduits for the CH4 transport from the soil to the atmo- during the second consecutive year of flooding following sphere (Chanton, 2005; Lai, 2009; Ström et al., 2015). large volumes of precipitation. Conversely, studies at natural wetlands in the northeastern USA (Smemo and Yavitt, 2006; 4.3 Process behind CH4 production response Treat et al., 2007; Olson et al., 2013) and southern Canada (Moore et al., 2011) reported that interannual variations in When CH4 production is initiated after the onset of anoxia in CH4 flux correspond with those of water level and/or pre- rice paddy soil, it first occurs via hydrogenotrophic methano- cipitation in the current year. In our study area, multi-year genesis, and then by both hydrogenotrophic and acetoclas- soil reduction may be important because soil temperature is tic methanogenesis, which increases CH4 production rate generally lower than 11 ◦ C (10 to 30 cm in depth; Fig. S1a (Conrad, 2007). Afterwards, the ratio of acetoclastic to hy- Biogeosciences, 16, 755–768, 2019 www.biogeosciences.net/16/755/2019/
R. Shingubara et al.: Multi-year effect of wetting on CH4 flux at taiga–tundra boundary in NE Siberia                            765

drogenotrophic methanogenesis can stabilize (Roy et al.,              In recent years, strong storm activity and wetting events
1997). Considering that this ratio is an important control on      in terrestrial ecosystems have been observed in northern re-
isotopic compositions of produced CH4 , stabilization of pro-      gions (Iijima et al., 2016). A wetting event at the taiga–tundra
duction pathways might explain the convergence in δ values         boundary can switch microreliefs with large interannual vari-
of dissolved CH4 at our study sites under high CH4 concen-         ations in soil wetness conditions to significant CH4 sources;
tration (Fig. 6) and the reduced variability in δ values of pro-   we observed clear increases in CH4 flux in wet areas after the
duced CH4 in our experiment under rapid production condi-          wetting event. In order to predict CH4 flux following a wet-
tions (Fig. 7). As acetoclastic methanogenesis leads to higher     ting event in a permafrost ecosystem, our results show the
δ 13 C in produced CH4 than hydrogenotrophic methanogen-           multi-year process of soil reduction affected by the duration
esis (Sugimoto and Wada, 1993), acetoclastic methanogen-           of water saturation in the active layer.
esis may have been activated when dissolved CH4 concen-
tration or CH4 production rate were high during our study.
This interpretation is supported by the microbial commu-           Data availability. Our data of CH4 flux, concentration and iso-
nity analysis (Fig. 8), in which acetoclastic methanogens of       tope ratios of dissolved CH4 , soil incubation experiments, phy-
Methanosarcinales were more abundant in wet areas, with            logenic compositions of methanogenic archaea, soil temperature,
a higher δ 13 C of produced CH4 in the incubation. Therefore,      thaw depth, and water level have been deposited in the Arctic
                                                                   Data archive System (ADS), Japan (https://ads.nipr.ac.jp/dataset/
the high δ 13 C values with smaller variation observed at 10 cm
                                                                   A20190211-001, Shingubara et al., 2019). Meteorological data
in depth in 2012 and 2013 (Fig. 5b) suggest a greater con-         shown in Fig. 2 are available from GHCN-Daily, a NOAA database
tribution from acetoclastic methanogenesis compared to the         (https://doi.org/10.7289/V5D21VHZ, Menne et al., 2012b).
wetting year (2011). Similar to findings from rice paddy soil
(Conrad, 2007), acetoclastic methanogenesis may have ex-
perienced delayed activation after anoxic conditions began         Supplement. The supplement related to this article is available
in 2011, which could also have promoted CH4 production             online at: https://doi.org/10.5194/bg-16-755-2019-supplement.
in 2012 and 2013.

                                                                   Author contributions. RS and AS designed the experiments and
5   Concluding remarks                                             RS carried them out. GI, ST, LM, ST, TM, and TCM helped with
                                                                   sampling, in situ data collection, and preparing resources for the
At the taiga–tundra boundary on the Indigirka River low-           fieldwork. JM contributed to the laboratory analysis. RS prepared
lands, we observed an increase in CH4 flux in wet areas fol-       the paper with contributions from all co-authors.
lowing the wetting event in 2011 and a further increase in
flux in 2013. Our results show interannual variations in δ 13 C
and δD of dissolved CH4 , and when compared with our in-           Competing interests. The authors declare that they have no conflict
cubation experiments, these variations suggest both enhance-       of interest.
ment of CH4 production and less significance of CH4 oxida-
tion in 2012 and 2013 compared to 2011. This enhancement
of production could be partly caused by activation of aceto-       Acknowledgements. This research was supported by JSPS Grants-
clastic methanogenesis following the development of reduc-         in-Aid for Scientific Research (KAKENHI) numbers 21403011
ing soil conditions after the wetting event. Analyses of iso-      and 16H05618, a Grant-in-Aid from the Global COE Program
topic compositions of CH4 both in situ and in incubation ex-       “Establishment of Center for Integrated Field Environmental Sci-
periments can be combined to investigate the effects of CH4        ence” (IFES-GCOE) funded by the Ministry of Education, Culture,
                                                                   Sports, Science and Technology – Japan (MEXT), JST (Strategic
production and oxidation on these isotopic compositions and
                                                                   International Collaborative Research Program: SICORP) EU
to clarify the relationship between CH4 flux and wetting. In
                                                                   cooperative research project “Dynamics of permafrost and methane
the future, measuring the δ 13 C of dissolved CO2 would be         emission in Arctic terrestrial ecosystem in Eastern Siberia”, the
useful to further validate activation of acetoclastic methano-     Green Network of Excellence (GRENE) program funded by
genesis (Sugimoto and Wada, 1993; McCalley et al., 2014;           MEXT, and the COPERA (C budget of Ecosystems, Cities and
Itoh et al., 2015). Outside of these processes, the wetting        Villages on Permafrost in Eastern Russian Arctic) project funded
event might have affected CH4 flux partly via the thaw depth       by the Belmont Forum through JST. We sincerely thank Alexan-
increase or some amount of vegetation change. It would be          der Kononov, Roman Petrov, Egor Starostin, Alexandra Alexeeva,
useful to analyze δ 13 C and δD values of emitted CH4 in or-       and other members of the Institute for Biological Problems of
der to assess changes in CH4 transport (such as by increase in     Cryolithozone SB RAS and Tatiana Stryukova, Sergey Ianygin,
sedge cover) and to investigate the relationship between dis-      and other staff at the Allikhovsky Ulus Inspectorate of Nature
                                                                   Protection for supporting our fieldwork in the vicinity of Chokur-
solved CH4 concentration and CH4 flux in detail (Chanton,
                                                                   dakh. We also wish to acknowledge help from Yumi Hoshino,
2005).
                                                                   Satori Nunohashi, Kanako Tanaka, Kayoko Saito, Hanae Kudo, and
                                                                   Ruslan Shakhmatov in our research group at Hokkaido University.

www.biogeosciences.net/16/755/2019/                                                           Biogeosciences, 16, 755–768, 2019
766 R. Shingubara et al.: Multi-year effect of wetting on CH4 flux at taiga–tundra boundary in NE Siberia
Ikeda, S., Watanabe, K. N., Minamisawa, K., and Ytow, N.: Eval-
Edited by: Nobuhito Ohte uation of Soil DNA from Arable Land in Japan Using a Modi-
Reviewed by: two anonymous referees fied Direct-extraction Method, Microbes Environ., 19, 301–309,
https://doi.org/10.1264/jsme2.19.301, 2004.
Itoh, M., Shimamura, T., Ohte, N., and Takemon, Y.: Dif-
ferences in hydrophyte life forms induce spatial hetero-
geneity of CH4 production and its carbon isotopic signa-
References ture in a temperate bog peatland: δ 13 CH4 variations in hy-
drophyte species, J. Geophys. Res.-Biogeo., 120, 1177–1195,
Caporaso, J. G., Kuczynski, J., Stombaugh, J., Bittinger, K., Bush- https://doi.org/10.1002/2014JG002881, 2015.
man, F. D., Costello, E. K., Fierer, N., Peña, A. G., Goodrich, Iwahana, G., Takano, S., Petrov, R. E., Tei, S., Shingubara, R.,
J. K., Gordon, J. I., Huttley, G. A., Kelley, S. T., Knights, Maximov, T. C., Fedorov, A. N., Desyatkin, A. R., Nikolaev, A.
D., Koenig, J. E., Ley, R. E., Lozupone, C. A., McDonald, N., Desyatkin, R. V., and Sugimoto, A.: Geocryological char-
D., Muegge, B. D., Pirrung, M., Reeder, J., Sevinsky, J. R., acteristics of the upper permafrost in a tundra-forest transition
Turnbaugh, P. J., Walters, W. A., Widmann, J., Yatsunenko, T., of the Indigirka River Valley, Russia, Polar Science, 8, 96–113,
Zaneveld, J., and Knight, R.: QIIME allows analysis of high- https://doi.org/10.1016/j.polar.2014.01.005, 2014.
throughput community sequencing data, Nat. Meth., 7, 335–336, King, G.: Responses of atmospheric methane consumption by soils
https://doi.org/10.1038/nmeth.f.303, 2010. to global climate change, Global Change Biol., 3, 351–362,
Caporaso, J. G., Lauber, C. L., Walters, W. A., Berg-Lyons, D., https://doi.org/10.1046/j.1365-2486.1997.00090.x, 1997.
Lozupone, C. A., Turnbaugh, P. J., Fierer, N., and Knight, R.: Kumagai, K. and Konno, Y.: Methane emissions from rice paddy
Global patterns of 16S rRNA diversity at a depth of millions of fields after upland farming, Japan. J. Soil Sci. Plant Nutr., 69,
sequences per sample, P. Natl. Acad. Sci. USA, 108, 4516–4522, 333–339, https://doi.org/10.20710/dojo.69.4_333, 1998.
https://doi.org/10.1073/pnas.1000080107, 2011. Lai, D. Y. F.: Methane dynamics in northern peatlands: A re-
Chanton, J. P.: The effect of gas transport on the isotope sig- view, Pedosphere, 19, 409–421, https://doi.org/10.1016/S1002-
nature of methane in wetlands, Org. Geochem., 36, 753–768, 0160(09)00003-4, 2009.
https://doi.org/10.1016/j.orggeochem.2004.10.007, 2005. Liang, M., Sugimoto, A., Tei, S., Bragin, I. V., Takano, S.,
Ciais, P., Sabine, C., Bala, G., Bopp, L., Brovkin, V., Canadell, J., Morozumi, T., Shingubara, R., Maximov, T. C., Kiyashko,
Chhabra, A., DeFries, R., Galloway, J., Heimann, M., Jones, C., S. I., Velivetskaya, T. A., and Ignatiev, A. V.: Importance
Le Quéré, C., Myneni, R. B., Piao, S., and Thornton, P.: Carbon of soil moisture and N availability to larch growth and
and other biogeochemical cycles, in: Climate change 2013: The distribution in the Arctic taiga-tundra boundary ecosys-
physical science basis, Contribution of Working Group I to the tem, northeastern Siberia, Polar Science, 8, 327–341,
Fifth Assessment Report of the Intergovernmental Panel on Cli- https://doi.org/10.1016/j.polar.2014.07.008, 2014.
mate Change, Cambridge University Press, Cambridge, UK and Marik, T., Fischer, H., Conen, F., and Smith, K.: Seasonal
New York, NY, USA, 465–570, 2014. variations in stable carbon and hydrogen isotope ratios in
Conrad, R.: Microbial ecology of methanogens and methanotrophs, methane from rice fields: Seasonal variations in CH4 iso-
in: Advances in Agronomy, vol. 96, Academic Press, Burlington, tope ratios from rice, Global Biogeochem. Cy., 16, 1094,
San Diego, USA, 1–63, 2007. https://doi.org/10.1029/2001GB001428, 2002.
Desyatkin, A. R., Takakai, F., and Hatano, R.: Flood ef- McCalley, C. K., Woodcroft, B. J., Hodgkins, S. B., Wehr, R. A.,
fect on CH4 emission from the alas in Central Yaku- Kim, E.-H., Mondav, R., Crill, P. M., Chanton, J. P., Rich, V. I.,
tia, East Siberia, Soil Sci. Plant Nutr., 60, 242–253, Tyson, G. W., and Saleska, S. R.: Methane dynamics regulated by
https://doi.org/10.1080/00380768.2014.883486, 2014. microbial community response to permafrost thaw, Nature, 514,
Dlugokencky, E. J., Bruhwiler, L., White, J. W. C., Emmons, 478–481, https://doi.org/10.1038/nature13798, 2014.
L. K., Novelli, P. C., Montzka, S. A., Masarie, K. A., Menne, M. J., Durre, I., Vose, R. S., Gleason, B. E., and Hous-
Lang, P. M., Crotwell, A. M., Miller, J. B., and Gatti, L. ton, T. G.: An overview of the Global Historical Climatology
V.: Observational constraints on recent increases in the at- Network-Daily database, J. Atmos. Ocean. Tech., 29, 897–910,
mospheric CH4 burden, Geophys. Res. Lett., 36, L18803, https://doi.org/10.1175/JTECH-D-11-00103.1, 2012a.
https://doi.org/10.1029/2009GL039780, 2009. Menne, M. J., Durre, I., Korzeniewski, B., McNeal, S., Thomas,
Dutaur, L. and Verchot, L. V.: A global inventory of the K., Yin, X., Anthony, S., Ray, R., Vose, R. S., Glea-
soil CH4 sink, Global Biogeochem. Cy., 21, GB4013, son, B. E., and Houston, T. G.: Global Historical Cli-
https://doi.org/10.1029/2006GB002734, 2007. matology Network – Daily (GHCN-Daily), Version 3.22,
Flessa, H., Rodionov, A., Guggenberger, G., Fuchs, H., Magdon, P., NOAA National Data Climatic Data Center, Asheville, USA,
Shibistova, O., Zrazhevskaya, G., Mikheyeva, N., Kasansky, O. https://doi.org/10.7289/V5D21VHZ, 2012b.
A., and Blodau, C.: Landscape controls of CH4 fluxes in a catch- Moore, T. R., De Young, A., Bubier, J. L., Humphreys, E. R.,
ment of the forest tundra ecotone in northern Siberia, Global Lafleur, P. M., and Roulet, N. T.: A multi-year record of methane
Change Biol., 14, 2040–2056, https://doi.org/10.1111/j.1365- flux at the Mer Bleue Bog, southern Canada, Ecosystems, 14,
2486.2008.01633.x, 2008. 646–657, https://doi.org/10.1007/s10021-011-9435-9, 2011.
Iijima, Y., Nakamura, T., Park, H., Tachibana, Y., and Fedorov, Morishita, T., Matsuura, Y., Kajimoto, T., Osawa, A., Zyryanova,
A. N.: Enhancement of Arctic storm activity in relation to per- O. A., and Prokushkin, A. S.: CH4 and N2 O dynamics of a
mafrost degradation in eastern Siberia, Int. J. Climatol., 36, Larix gmelinii forest in a continuous permafrost region of central
4265–4275, https://doi.org/10.1002/joc.4629, 2016.
Biogeosciences, 16, 755–768, 2019 www.biogeosciences.net/16/755/2019/You can also read