Health, psychosocial, and economic impacts of the COVID-19 pandemic on people with chronic conditions in India: a mixed methods study
←
→
Page content transcription
If your browser does not render page correctly, please read the page content below
Singh et al. BMC Public Health    (2021) 21:685
https://doi.org/10.1186/s12889-021-10708-w

 RESEARCH ARTICLE                                                                                                                                   Open Access

Health, psychosocial, and economic
impacts of the COVID-19 pandemic on
people with chronic conditions in India: a
mixed methods study
Kavita Singh1,2* , Dimple Kondal1, Sailesh Mohan1,2,3, Suganthi Jaganathan2, Mohan Deepa4,
Nikhil Srinivasapura Venkateshmurthy1,2, Prashant Jarhyan1, Ranjit Mohan Anjana4, K. M. Venkat Narayan5,
Viswanathan Mohan4, Nikhil Tandon6, Mohammed K. Ali5, Dorairaj Prabhakaran1,2,7 and Karen Eggleston8

  Abstract
  Background: People with chronic conditions are disproportionately prone to be affected by the COVID-19
  pandemic but there are limited data documenting this. We aimed to assess the health, psychosocial and economic
  impacts of the COVID-19 pandemic on people with chronic conditions in India.
  Methods: Between July 29, to September 12, 2020, we telephonically surveyed adults (n = 2335) with chronic
  conditions across four sites in India. Data on participants’ demographic, socio-economic status, comorbidities,
  access to health care, treatment satisfaction, self-care behaviors, employment, and income were collected using
  pre-tested questionnaires. We performed multivariable logistic regression analysis to examine the factors associated
  with difficulty in accessing medicines and worsening of diabetes or hypertension symptoms. Further, a diverse
  sample of 40 participants completed qualitative interviews that focused on eliciting patient’s experiences during the
  COVID-19 lockdowns and data analyzed using thematic analysis.
  Results: One thousand seven hundred thirty-four individuals completed the survey (response rate = 74%). The
  mean (SD) age of respondents was 57.8 years (11.3) and 50% were men. During the COVID-19 lockdowns in India,
  83% of participants reported difficulty in accessing healthcare, 17% faced difficulties in accessing medicines, 59%
  reported loss of income, 38% lost jobs, and 28% reduced fruit and vegetable consumption. In the final-adjusted
  regression model, rural residence (OR, 95%CI: 4.01,2.90–5.53), having diabetes (2.42, 1.81–3.25) and hypertension
  (1.70,1.27–2.27), and loss of income (2.30,1.62–3.26) were significantly associated with difficulty in accessing
  medicines. Further, difficulties in accessing medicines (3.67,2.52–5.35), and job loss (1.90,1.25–2.89) were associated
  with worsening of diabetes or hypertension symptoms. Qualitative data suggest most participants experienced
  psychosocial distress due to loss of job or income and had difficulties in accessing in-patient services.
  (Continued on next page)

* Correspondence: kavita.singh@phfi.org
1
 Public Health Foundation of India, Plot number 47, Sector 44, Gurugram,
New Delhi, Haryana 122002, India
2
 Centre for Chronic Disease Control, New Delhi, India
Full list of author information is available at the end of the article

                                        © The Author(s). 2021 Open Access This article is licensed under a Creative Commons Attribution 4.0 International License,
                                        which permits use, sharing, adaptation, distribution and reproduction in any medium or format, as long as you give
                                        appropriate credit to the original author(s) and the source, provide a link to the Creative Commons licence, and indicate if
                                        changes were made. The images or other third party material in this article are included in the article's Creative Commons
                                        licence, unless indicated otherwise in a credit line to the material. If material is not included in the article's Creative Commons
                                        licence and your intended use is not permitted by statutory regulation or exceeds the permitted use, you will need to obtain
                                        permission directly from the copyright holder. To view a copy of this licence, visit http://creativecommons.org/licenses/by/4.0/.
                                        The Creative Commons Public Domain Dedication waiver (http://creativecommons.org/publicdomain/zero/1.0/) applies to the
                                        data made available in this article, unless otherwise stated in a credit line to the data.
Singh et al. BMC Public Health (2021) 21:685 Page 2 of 15 (Continued from previous page) Conclusion: People with chronic conditions, particularly among poor, rural, and marginalized populations, have experienced difficulties in accessing healthcare and been severely affected both socially and financially by the COVID-19 pandemic. Keywords: SARS coronavirus, COVID-19 pandemic, Chronic conditions, India Background diabetes, hypertension, and cardiovascular diseases. On As the global burden of novel coronavirus disease 2019 March 24, 2020, the Indian government ordered a (COVID-19) continues to increase, particularly in low- nationwide lockdown, which was extended until June in and middle- income countries such as India, it imposes four phases, and later further extended to specific huge costs on individuals, communities, health systems, containment zones. During the lockdowns, many health and economies [1]. Although some countries and re- facilities were functioning sub-optimally or were con- gions are seeing improvements in hospitalization and verted to COVID facilities and provided only essential death rates, COVID-19 remains a major concern for vul- and emergency services. nerable and underserved populations globally [2, 3]. Measures to address coronavirus spread including People with chronic conditions are disproportionately lockdowns may have serious economic consequences prone to COVID-19–related hospitalizations, intensive and unintended effect of exacerbating rather than miti- care admissions, and mortality, compared to those with- gating health disparities [8, 9, 23, 24]. However, to date, out chronic conditions [4–7]. Moreover, they may be few data document the impact of the COVID-19 pan- particularly susceptible to adverse health impacts from demic on disparities in chronic disease management in delayed or foregone care during the pandemic. The 2020 India. Given the unprecedented and rapidly evolving World Health Organization (WHO) report on the COVID-19 situation in India, we aimed to assess the impact of COVID-19 on noncommunicable diseases health, psychosocial and economic impacts of COVID- (NCDs) in 163 countries highlighted that nearly half of 19 pandemic on people with chronic conditions in India. the countries report that patients experienced partial or complete disruption of services for hypertension, dia- Methods betes, and related complications during the pandemic. Study setting and participants One-third reported disrupted services for cardiovascular We conducted a cross-sectional study using sequential emergencies. Further, most countries reassigned the mixed methods design, comprising a quantitative survey health staff towards COVID-19 support, which affected and qualitative interviews to describe the impact of routine care for NCDs [8]. Several reports indicated COVID-19 on the health, psychosocial, and economic change in routine care to virtual consultations and wors- well-being of people with chronic conditions in India. ened mental health problems during the pandemic. Adults with one or more chronic conditions (hyperten- Diabetes, chronic obstructive pulmonary disease, and sion, diabetes mellitus, cardiovascular disease, or chronic hypertension were the most impacted conditions due to kidney disease), from the two large existing cohorts (the significant reduction in access to care [9–14]. Given the Centre for Cardio-metabolic Risk Reduction in South syndemic interaction ─interrelationship between Asia, CARRS [25]; and a comprehensive diabetes and COVID-19 and various socio-ecological and biological hypertension prevention and management program in factors contributing to preexisting NCD epidemics─ India-UDAY [26]) were invited to participate in this people with chronic conditions are more vulnerable to study. The CARRS and UDAY study protocols and main COVID-19 infection [15, 16]. study results have been published previously [14, 15]. As of March 11, 2021 more than 11 million people in Briefly, CARRS enrolled 12,271 adults aged ≥20 years India had been infected with COVID-19, and about 158, that were sampled to be representative of Delhi and 000 had died [6]. The spread of COVID-19 in India is of Chennai in 2010–2011 and has followed them annually great concern due to the country’s large and densely since. The UDAY study enrolled 12,243 adults in 2014– populated areas with widespread poverty and high mi- 15 aged ≥30 years from rural and urban communities in gration rates, coupled with a high prevalence of chronic Sonipat (Haryana), and Visakhapatnam (Vizag), Andhra conditions [17–19] that are generally poorly controlled Pradesh, India. For this study, we used stratified random [20–22]. Further, the progression of COVID-19 from sampling of participants with chronic conditions by age urban to rural areas, the strict lockdown measures, and and sex. We randomly selected and approached around the associated economic shocks are likely to impede ef- 600 participants at each of the four sites (Delhi, Chennai forts to address other health scourges in India such as Haryana and Vizag) in India. Furthermore, a diverse
Singh et al. BMC Public Health   (2021) 21:685                                                               Page 3 of 15

sample of 40 participants stratified by age, sex, comor-     hypertension, cardiovascular disease and chronic kidney
bidities, and urban/rural sites were purposively selected    disease); Model 3, in addition to model 2 variables, in-
for the qualitative interview. This study was approved by    cluded financial support from government (yes/no), loss
the Institutional Ethics Committees of the Centre for        of job (yes/no), and loss of income (yes/no) during the
Chronic Disease Control, New Delhi, India, and the           COVID-19 lockdowns. Next, for the outcome “worsen-
Madras Diabetes Research Foundation, Chennai, India.         ing diabetes or hypertension symptoms”, Model 1 in-
All participants provided verbal consent to this study       cluded demographic variables (age, sex, education and
over the phone.                                              income); Model 2 included demographic variables and
                                                             chronic conditions (diabetes, hypertension), GAD score
Data collection                                              (minimal, mild, moderate/severe), physical activity level,
Between July 29 and September 12, 2020, we collected         changes in fruit consumption during lockdown, and
data on participants’ demographic, socio-economic            difficulty in accessing medicines (yes/no); Model 3, in
status, comorbidities, access to healthcare, difficulty in   addition to Model 2 variables, included financial support
accessing medicines due to financial and non-financial       from the government (yes/no), loss of job (yes/no), and
(COVID-19 related) reasons, and treatment satisfaction.      loss of income (yes/no) during the COVID-19 lock-
Quantitative survey questionnaire and qualitative study      downs. All data were analyzed using Stata version 16.0.
interview guide were developed by the authors for this         Qualitative data analyses focused on identifying views
mixed-methods study (Supplementary file 1). Partici-         of individuals with chronic conditions, as well as the
pants were asked if their diabetes or hypertension           context, challenges, and mitigating factors or efforts to
symptoms worsened after lockdown. In addition, health        better manage chronic conditions during the COVID-19
status was assessed using EQ. 5D-VAS [27], and anxiety       pandemic in India. In-depth interviews with participants
assessed using a generalized anxiety disorder (GAD)          were audio-recorded, transcribed (verbatim), translated,
questionnaire [28]. Data on self-monitoring of blood         anonymized, and checked for accuracy. The interview
glucose, adherence to diet plan, changes in physical         transcripts were coded thematically using MAXQDA
activity, fruits and vegetables consumption pre- and         software version 2020 [30]. Initial codes were developed
post-lockdowns, employment status, and household in-         and applied initially to a small number of transcripts, en-
come were collected using pre-tested questionnaire.          abling further iteration of the thematic index [29, 32].
Centralized online training was provided to the field        We used illustrative non-attributable quotations.
workers to administer the survey over the telephone.
Survey data were captured using Commcare application.        Results
Qualitative interviews were conducted in participant’s       Participant characteristics
local language by trained researchers (KS, SJ) and fo-       Overall, 1734 out of 2335 contacted participants (74.3%
cused on eliciting patient’s views on the challenges         response rate) completed the survey. We found 58 co-
posed by the COVID-19 lockdowns and their mitigation.        hort members (2.5%) had died, 34 (1.5%) refused to par-
                                                             ticipate, and 509 (22%) were not reachable for various
Statistical analysis                                         reasons. Mean age (SD) of respondents was 57.8 (11.3)
We used a sequential mixed methods study design to           years, 50% were men, a majority had secondary school
guide our analytical approach [29, 30]. Data are reported    or college level education, and one-quarter of partici-
by study site and presented as a number (proportion) for     pants reported monthly household income of >INR 30,
categorical variables (e.g. access to health facility;       000 (Table 1). Most prevalent chronic conditions were
diagnosed or hospitalized with COVID-19, loss of job or      hypertension (56%), diabetes (43%), and cardiovascular
income) and a mean (SD) for normally distributed con-        disease (13%). Of the participants surveyed, 3% were di-
tinuous variables (e.g., age, body mass index, health        agnosed or treated for COVID-19, 1% were hospitalized,
status score). GAD score [31] was defined as 0–4 no          and 69% reported that they had heard of a confirmed
anxiety, 5–9 mild anxiety, 10–14 moderate anxiety, 15–       case of COVID-19 in their locality, more in urban (72%)
21 severe anxiety. We performed bivariable and multi-        than rural (58%) sites. About two-third of respondents
variable logistic regression analyses to find the factors    experienced fear/anxiety related to COVID-19 and
associated with difficulty in accessing medicines and        nearly half reported moderate difficulty in coping with
worsening diabetes or hypertension symptoms. We              stress during the COVID-19 lockdowns.
constructed three logistic regression models for each
outcome. For the outcome “difficulty in accessing medi-      Rural versus urban comparison
cines”, Model 1 included demographic variables (age,         Rural participants were disproportionately affected by
sex, education and income); Model 2 included demo-           the COVID-19 lockdowns compared with urban partici-
graphic variables and chronic conditions (diabetes,          pants (Fig. 1). A greater proportion of rural participants
Table 1 Characteristics of study participants by demographic and socio-economic status, clinical history and COVID-19 status
Overall Delhi Chennai Sonipat (N = 410) Vizag (N = 400) p-value*
(N = 1734) (N = 430) (N = 494)
Rural (N = 209) Urban (N = 201) Rural (N = 192) Urban (N = 208)
Age, years (mean, SD) 57.8 (11.3) 57.8 (11.0) 57.5 (11.6) 56.6 (11.4) 58.5 (10.8) 57.1 (10.2) 59.8 (11.9) 0.055
Male (%) 861 (49.7%) 219 (50.9%) 247 (50.0%) 86 (41.1%) 97 (48.3%) 92 (47.9%) 120 (57.7%) 0.033
Ownership of mobile phone 1366 (78.8%) 398 (92.6%) 382 (77.3%) 118 (56.5%) 123 (61.2%) 152 (79.2%) 193 (92.8%) < 0.001
Internet use/access 741 (42.7%) 341 (79.3%) 175 (35.4%) 16 (7.7%) 50 (24.9%) 34 (17.7%) 125 (60.1%) < 0.001
Singh et al. BMC Public Health
Education
Below primary school 293 (16.9%) 43 (10.0%) 36 (7.3%) 57 (27.3%) 41 (20.4%) 93 (48.4%) 23 (11.1%) < 0.001
Primary school 119 (6.9%) 9 (2.1%) 40 (8.1%) 10 (4.8%) 18 (9.0%) 28 (14.6%) 14 (6.7%)
Secondary school 978 (56.4%) 219 (50.9%) 372 (75.3%) 135 (64.6%) 97 (48.3%) 65 (33.9%) 90 (43.3%)
College degree and above 342 (19.7%) 157 (36.5%) 46 (9.3%) 7 (3.3%) 45 (22.4%) 6 (3.1%) 81 (38.9%)
(2021) 21:685
Household income
< 10,000 INR 540 (31.1%) 51 (11.9%) 235 (47.6%) 96 (45.9%) 32 (15.9%) 115 (59.9%) 11 (5.3%) < 0.001
10,000–30,000 INR 732 (42.2%) 169 (39.3%) 238 (48.2%) 77 (36.8%) 97 (48.3%) 64 (33.3%) 87 (41.8%)
> 30,000 INR 431 (24.9%) 208 (48.4%) 21 (4.3%) 29 (13.9%) 52 (25.9%) 12 (6.3%) 109 (52.4%)
Occupation
Not working 1004 (57.9%) 259 (60.2%) 273 (55.3%) 137 (65.6%) 129 (64.2%) 86 (44.8%) 120 (57.7%) < 0.001
Semiskilled/Unskilled 262 (15.1%) 26 (6.0%) 127 (25.7%) 30 (14.4%) 23 (11.4%) 37 (19.3%) 19 (9.1%)
Trained/Skilled 456 (26.3%) 139 (32.3%) 91 (18.4%) 42 (20.1%) 49 (24.4%) 69 (35.9%) 66 (31.7%)
White collar 12 (0.7%) 6 (1.4%) 3 (0.6%) 0 (0.0%) 0 (0.0%) 0 (0.0%) 3 (1.4%)
BMI (Kg/m2), mean (SD) 26.8 (5.1) 27.8 (5.1) 26.8 (4.9) 26.1 (5) 27.2 (5.4) 23.7 (4.4) 27 (4.3) < 0.001
a
Diabetes mellitus 743 (42.8%) 180 (41.9%) 255 (51.6%) 35 (16.7%) 88 (43.8%) 49 (25.5%) 136 (65.4%) < 0.001
Hypertensionb 975 (56.2%) 202 (47.0%) 210 (42.5%) 154 (73.7%) 104 (51.7%) 152 (79.2%) 153 (73.6%) < 0.001
Cardiovascular disease 229 (13.2%) 47 (10.9%) 38 (7.7%) 57 (27.3%) 35 (17.4%) 20 (10.4%) 32 (15.4%) < 0.001
Chronic kidney disease 43 (2.5%) 9 (2.1%) 6 (1.2%) 12 (5.7%) 2 (1.0%) 7 (3.6%) 7 (3.4%) 0.006
Chronic obstructive pulmonary disease 18 (1.0%) 4 (0.9%) 2 (0.4%) 2 (1.0%) 1 (0.5%) 4 (2.1%) 5 (2.4%) 0.14
COVID-19 status and related fear/anxiety
Participant diagnosed or treated for 46 (2.7%) 18 (4.2%) 6 (1.2%) 13 (6.2%) 5 (2.5%) 2 (1.0%) 2 (1.0%) 0.003
COVID-19
Hospitalized for COVID-19 13 (0.7%) 4 (0.9%) 6 (1.2%) 0 (0.0%) 1 (0.5%) 1 (0.5%) 1 (0.5%) < 0.001
Number of days hospitalized, 10.0 (8.0, 14.0) 13.0 (8.0, 14.0) 8.5 (8.0, 10.0) na 10.0 (10.0, 10.0) 14.0 (14.0, 14.0) 14.0 (14.0, 14.0) 0.44
median (IQR)
Immediate family members diagnosed/ 52 (3.0%) 16 (3.7%) 13 (2.6%) 11 (5.3%) 8 (4.0%) 1 (0.5%) 3 (1.4%) 0.13
treated for COVID-19
Page 4 of 15Table 1 Characteristics of study participants by demographic and socio-economic status, clinical history and COVID-19 status (Continued)
Overall Delhi Chennai Sonipat (N = 410) Vizag (N = 400) p-value*
(N = 1734) (N = 430) (N = 494)
Rural (N = 209) Urban (N = 201) Rural (N = 192) Urban (N = 208)
Any confirmed cases of COVID-19 in 1192 (68.7%) 265 (61.6%) 401 (81.2%) 111 (53.1%) 110 (54.7%) 123 (64.1%) 182 (87.5%) < 0.001
other households in your locality
Experienced fear/anxiety related to 1029 (59.3%) 267 (62.1%) 148 (30.0%) 208 (99.5%) 131 (65.2%) 134 (69.8%) 141 (67.8%) < 0.001
COVID-19
Experienced stigma related to COVID-19 15 (0.9%) 8 (1.9%) 2 (0.4%) 4 (1.9%) 1 (0.5%) 0 (0.0%) 0 (0.0%) 0.17
Singh et al. BMC Public Health
Coping with stress during the
COVID-19 situation
Very well 254 (14.6%) 77 (17.9%) 68 (13.8%) 44 (21.1%) 37 (18.4%) 6 (3.1%) 22 (10.6%) < 0.001
Moderate 850 (49.0%) 190 (44.2%) 160 (32.4%) 164 (78.5%) 158 (78.6%) 92 (47.9%) 86 (41.3%)
With difficulty 281 (16.2%) 93 (21.6%) 40 (8.1%) 0 (0.0%) 4 (2.0%) 70 (36.5%) 74 (35.6%)
(2021) 21:685
No Stress 349 (20.1%) 70 (16.3%) 226 (45.7%) 1 (0.5%) 2 (1.0%) 24 (12.5%) 26 (12.5%)
BMI Body mass Index, IQR interquartile range (p25, p75), INR Indian rupees, SD standard deviation, COVID-19 coronavirus disease 2019
*p value reported for between group difference across study sites
a
Diabetes is defined based on fasting plasma glucose (FPG) > =126 mg/dl (7.0 mmol/l) and/or glycated haemoglobin (HbA1c) > = 6.5% (48 mmol/mol) or self-reported or on anti-diabetic medications. bHypertension was
defined as being on antihypertensive medications or a systolic blood pressure > =140 mmHg and/or a diastolic blood pressure > =90 mmHg. Cardiovascular disease and chronic kidney disease were self-reported and/
or on medications
Page 5 of 15Singh et al. BMC Public Health (2021) 21:685 Page 6 of 15
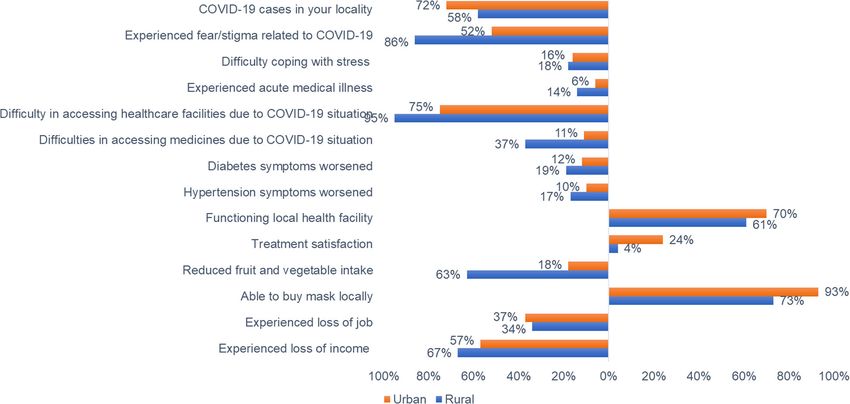
Fig. 1 COVID-19 pandemic impacts on urban and rural people living with chronic conditions in India
experienced acute medical illness (rural 14.2%; urban from the government reduced the odds of difficulty in
6.4%), difficulties in accessing health facilities (rural accessing medicines, i.e., had protective effect (OR: 0.69,
95.0%; urban 75.0%) and medicines (rural 36.9%; urban 95%CI:0.52–0.92) (Fig. 2 and online Table S1). Figure 3
10.9%), worsened diabetes or hypertension symptoms and online Table S2 demonstrate the factors associated
(rural 16.0%; urban 11.0%), a lower treatment satisfac- with worsening of diabetes or hypertension symptoms.
tion rate (rural 3.5%; urban 23.8%), reduced fruit or In the regression Model 1, adjusted for demographic
vegetable consumption (rural 68.8%, urban 28.7%), and and socio-economic variables, we found rural
loss of household income (rural 67.3%, urban 56.9%). participants and females had higher odds of worsening
diabetes or hypertension symptoms compared with
Health impacts urban or male counterparts (OR, 95%CI: 1.53,1.07–2.21
Across the four sites, 8% of study participants experi- and 1.49,1.08–2.06, respectively). However, in the full
enced an acute medical illness during the COVID-19 re- multivariable-adjusted regression model, we found diffi-
lated lockdowns (Table 2) with higher proportions being culties in accessing medicines (3.67, 2.52–5.35), loss of
affected in rural sites (14%). Two-thirds of patients re- job (1.90, 1.25–2.89), and financial support from the
ported that a local health clinic/hospital was functional government (1.87, 1.25–2.80) to be significantly associ-
during the COVID-19 lockdowns. Overall, the average ated with worsening of diabetes or hypertension
health status score on EQ-VAS was 76.1; this was signifi- symptoms.
cantly lower in rural Vizag, 71.1. Nearly half the partici-
pants with diabetes or hypertension had their fasting Psychosocial and economic impacts
blood sugar (FBS) or blood pressure (BP) tested during One-third of respondents did not adhere to their recom-
the lockdowns. Uncontrolled diabetes (FBS > 200 mg/dl) mended diet plan and reduced fruit and vegetable
was reported by 19.3% of participants and uncontrolled consumption during the lockdowns (Table 3). About
systolic BP (> 140-160 mmHg) by 15.7%. About one- two-third of respondents did not perform physical activ-
third of respondents perceived their blood sugar to be ity and reported loss of household income, and one-
controlled and 15% perceived their BP to be under third had lost jobs. Overall, 45% of participants had
control. received financial support from the government, with
In the final-adjusted multivariable regression model, large variation by site (93% in Chennai vs. 8% in Delhi).
we found rural participants (odds ratio (OR), 95% confi- Because of the pandemic and related restrictions im-
dence interval (CI): 4.01,2.90–5.53), having diabetes posed to reduce its spread, few participants (15.2%) re-
(2.42,1.81–3.25) and hypertension (1.70,1.27–2.27), and ported visiting friends/family, although about half were
loss of income (2.30,1.62–3.26) were significantly associ- able to leave their locality to buy food or other supplies
ated with difficulty in accessing medicines. Financial aid (52.6%). The majority reported that fruits, vegetables,Table 2 Impact of COVID-19 pandemic on health, healthcare access, treatment satisfaction and achievement of care goals
Overall Delhi Chennai Sonipat (N = 410) Vizag (N = 400) p-value*
(N = 1734) (N = 430) (N = 494)
Rural (N = 209) Urban (N = 201) Rural (N = 192) Urban (N = 208)
Experienced acute medical illness during the 142 (8.2%) 25 (5.8%) 25 (5.1%) 31 (14.8%) 11 (5.5%) 26 (13.5%) 24 (11.5%) < 0.001
COVID-19 lockdown
Difficulty in accessing healthcare facility during 118 (83.1) 20 (80) 16 (64) 31 (100) 8 (72.7) 23 (88.5) 20 (83.3) 0.014
COVID-19 lockdown
Experienced difficulties in accessing medicines 293 (16.9%) 27 (6.3%) 47 (9.5%) 69 (33.0%) 15 (7.5%) 79 (41.1%) 56 (26.9%)
Singh et al. BMC Public Health
due to COVID-19 situation
Diabetes mellitus 134 (18.0%) 17 (9.4%) 36 (14.1%) 11 (31.4%) 7 (8.0%) 24 (49.0%) 39 (28.7%) 0.24
Hypertension 198 (20.3%) 13 (6.4%) 20 (9.5%) 53 (34.4%) 11 (10.6%) 60 (39.5%) 41 (26.8%) < 0.001
Cardiovascular disease 35 (15.3%) 1 (2%) 7 (18%) 16 (28%) 0 (0%) 4 (20%) 7 (22%) 0.002
Chronic kidney disease 7 (16%) 2 (22%) 1 (17%) 3 (25%) 0 (0%) 0 (0%) 1 (14%) 0.59
(2021) 21:685
COPD 2 (11%) 0 (0%) 1 (50%) 1 (50%) 0 (0%) 0 (0%) 0 (0%) 0.22
Experienced difficulties in accessing medicines 258 (14.9%) 16 (3.7%) 58 (11.7%) 36 (17.2%) 10 (5.0%) 88 (45.8%) 50 (24.0%)
or treatment due to financial reasons
Diabetes mellitus 124 (16.7%) 12 (6.7%) 44 (17.3%) 7 (20.0%) 4 (4.5%) 23 (46.9%) 34 (25.0%) 0.75
Hypertension 162 (16.6%) 7 (3.5%) 28 (13.3%) 21 (13.6%) 7 (6.7%) 70 (46.1%) 29 (19.0%) 0.004
Cardiovascular disease 25 (10.9%) 0 (0%) 3 (8%) 9 (16%) 0 (0%) 5 (25%) 8 (25%) 0.10
Chronic kidney disease 4 (9%) 1 (11%) 0 (0%) 2 (17%) 0 (0%) 0 (0%) 1 (14%) 0.52
Chronic obstructive pulmonary lung disease 2 (11%) 0 (0%) 0 (0%) 1 (50%) 0 (0%) 0 (0%) 1 (20%)
Functioning local health clinic/hospital during 1175 (67.8%) 329 (76.5%) 337 (68.2%) 153 (73.2%) 159 (79.1%) 91 (47.4%) 106 (51.0%) < 0.001
lockdown
Treatment satisfaction during lockdown 331 (19.1%) 96 (22.3%) 181 (36.6%) 3 (1.4%) 24 (11.9%) 11 (5.7%) 16 (7.7%)
Generalized anxiety disorder scale
Minimal anxiety 1497 (86.3%) 403 (93.7%) 451 (91.3%) 196 (93.8%) 194 (96.5%) 115 (59.9%) 138 (66.3%) < 0.001
Mild anxiety 181 (10.4%) 25 (5.8%) 38 (7.7%) 11 (5.3%) 7 (3.5%) 60 (31.3%) 40 (19.2%)
Moderate anxiety 34 (2.0%) 1 (0.2%) 4 (0.8%) 1 (0.5%) 0 (0.0%) 10 (5.2%) 18 (8.7%)
Severe anxiety 22 (1.3%) 1 (0.2%) 1 (0.2%) 1 (0.5%) 0 (0.0%) 7 (3.6%) 12 (5.8%)
Overall health status score (EQ-VAS), 76.1 (15.3) (n = 1734) 77.1 (16.5) 78.4 (15.7) 78.4 (15.6) 72.7 (16.3) 71.1 (11.1) 74.0 (11.7) < 0.001
mean (SD)
Mobility (moderate/severe problems) 360 (20.8%) 91 (21.2%) 78 (15.8%) 60 (28.7%) 58 (28.9%) 45 (23.4%) 28 (13.5%)
Self-care (moderate/severe problems) 136 (7.8%) 23 (5.3%) 41 (8.3%) 16 (7.7%) 29 (14.4%) 14 (7.3%) 13 (6.3%)
Usual care (moderate/severe problems) 223 (12.9%) 31 (7.2%) 59 (11.9%) 38 (18.2%) 39 (19.4%) 29 (15.1%) 27 (13.0%)
Pain/discomfort (moderate/severe problems) 448 (25.8%) 135 (31.4%) 70 (14.2%) 79 (37.8%) 70 (34.8%) 56 (29.2%) 38 (18.3%)
Anxiety/depression (moderate/severe problems) 314 (18.1%) 58 (13.5%) 83 (16.8%) 46 (22.0%) 41 (20.4%) 51 (26.6%) 35 (16.8%)
Page 7 of 15Table 2 Impact of COVID-19 pandemic on health, healthcare access, treatment satisfaction and achievement of care goals (Continued)
Overall Delhi Chennai Sonipat (N = 410) Vizag (N = 400) p-value*
(N = 1734) (N = 430) (N = 494)
Rural (N = 209) Urban (N = 201) Rural (N = 192) Urban (N = 208)
Health consequences in people with 743 180 255 35 88 49 136
diabetes (N)
Fasting blood sugar tested during the 414 (55.7%) 130 (72.2%) 151 (59.2%) 13 (37.1%) 37 (42.0%) 17 (34.7%) 66 (48.5%) < 0.001
lockdown
HbA1c tested during the lockdown 35 (4.7%) 10 (5.6%) 8 (3.1%) 0 (0.0%) 4 (4.5%) 0 (0.0%) 13 (9.6%) < 0.001
Singh et al. BMC Public Health
Fasting blood sugar, mean (SD) 166.6 (71.8) 158.0 (64.5) 185.9 (83.1) 287.3 (83.6) 137.4 (32.1) 197.1 (63.4) 139.7 (44.2) < 0.001
Fasting blood sugar > 160–200 mg/dl 51 (17.9) 19 (16.2) 18 (19.6) 1 (16.7) 3 (30) 3 (42.9) 7 (13.2)
Fasting blood sugar > 200 mg/dl 55 (19.3) 17 (14.5) 29 (31.5) 5 (83.3) 0 (0) 2 (28.6) 2 (3.8)
Blood sugar controlled (perceived) 230 (31.0%) 35 (19.4%) 87 (34.1%) 16 (45.7%) 19 (21.6%) 27 (55.1%) 46 (33.8%) < 0.001
(2021) 21:685
Diabetes symptoms worsened during the 97 (13.1%) 33 (18.3%) 23 (9.0%) 8 (22.9%) 9 (10.2%) 8 (16.3%) 16 (11.8%) < 0.001
lockdown
Glucose monitoring frequency at home
Once in month 83 (11.2%) 43 (23.9%) 13 (5.1%) 2 (5.7%) 16 (18.2%) 1 (2.0%) 8 (5.9%)
Do not monitor glucose at home 530 (71.3%) 70 (38.9%) 223 (87.5%) 33 (94.3%) 62 (70.5%) 46 (93.9%) 96 (70.6%)
Health consequences in people with 975 202 210 154 104 152 153
hypertension (N)
Blood pressure measured during the 515 (52.8%) 137 (67.8%) 127 (60.5%) 70 (45.5%) 39 (37.5%) 53 (34.9%) 89 (58.2%) < 0.001
lockdown
Systolic blood pressure, mean (SD) 139.0 (20.3) 142.5 (18.8) 135.4 (19.4) 152.2 (29.7) 140.3 (19.2) 133.3 (19.5) 132.2 (14.2) < 0.001
Diastolic blood pressure, mean (SD) 86.9 (13.5) 88.7 (11.1) 84.6 (11.0) 91.8 (25.9) 85.8 (17.0) 84.8 (11.3) 84.6 (7.1) 0.042
SBP ≤140 mmHg 271 (74.6%) 79 (69.9%) 38 (67.9%) 22 (56.4%) 27 (75.0%) 25 (86.2%) 80 (88.9%) 0.008
SBP > 140–160 mmHg 57 (15.7%) 19 (16.8%) 12 (21.4%) 9 (23.1%) 6 (16.7%) 3 (10.3%) 8 (8.9%)
SBP > 160 mmHg 35 (9.6%) 15 (13.3%) 6 (10.7%) 8 (20.5%) 3 (8.3%) 1 (3.4%) 2 (2.2%)
Blood pressure controlled (perceived) 142 (14.6%) 18 (8.9%) 65 (31.0%) 24 (15.6%) 5 (4.8%) 21 (13.8%) 9 (5.9%) 0.022
Symptoms of hypertension worsened 120 (12.3%) 42 (20.8%) 6 (2.9%) 38 (24.7%) 8 (7.7%) 13 (8.6%) 13 (8.5%) < 0.001
during the lockdown
Diabetes is defined based on fasting plasma glucose (FPG) > =126 mg/dl (7.0 mmol/l) and/or glycated haemoglobin (HbA1c) > = 6.5% (48 mmol/mol) or self-reported or on anti-diabetic medications. Hypertension was
defined as being on antihypertensive medications or a systolic blood pressure > =140 mmHg and/or a diastolic blood pressure > =90 mmHg. Cardiovascular disease and chronic kidney disease were self-reported and/
or on medications
HbA1c glycated haemoglobin, COPD chronic obstructive pulmonary lung disease, EQ-VAS European Quality of Life 5-dimension, Visual analogue scale, SBP systolic blood pressure, DBP diastolic blood pressure, SD
standard deviation, INR Indian rupees, COVID-19 coronavirus disease 2019, mmHg millimoles of mercury
*p value reported for between group difference across study sites
Page 8 of 15Singh et al. BMC Public Health (2021) 21:685 Page 9 of 15
Fig. 2 Factors associated with difficulty in accessing medicines due to the COVID-19 situation. Diabetes is defined based on fasting plasma glucose
(FPG) > =126 mg/dl (7.0 mmol/l) and/or glycated haemoglobin (HbA1c) > = 6.5% (48 mmol/mol) or self-reported or on anti-diabetic medications.
Hypertension was defined as being on antihypertensive medications or a systolic blood pressure > =140 mmHg and/or a diastolic blood pressure > =90
mmHg. Cardiovascular disease and chronic kidney disease were self-reported and/or on medications. INR = Indian rupees, CVD = cardiovascular disease,
Kidney = chronic kidney disease, 95% CI = confidence interval
and essential groceries were available during the lock- transportation. Some participants lost their jobs due to
downs (96.8%), although we do not know prices or qual- the COVID-19 pandemic, as reflected in the following
ity. Most participants (99.4%) reported being aware of quotes from study participants:
and following recommended preventive measures such
as wearing mask, handwashing, and social distancing “We faced difficulties at home because I am into
(online Table S3). driving. Before lockdown, I went home for some work.
Because of lockdown, I had to stay at home for 2.5
Qualitative study results months. I, my wife, and children are jobless since
Our sample consisted of 40 participants with one or then. There was no possibility of doing any work or
more chronic conditions, mean age: 54.6 years, and 64% going anywhere. We had a lot of trouble at that
were men. Thematic redundancy was achieved with 8th time.” (R-02-V)
interview, and two participants were then interviewed
from each of the four sites (total, N = 40) to confirm the- “The impact was that there were a lot of problems.
matic redundancy. Interviews lasted about 20–40 min. We took the ration distributed by the government. We
Two major themes emerged from qualitative data ana- consumed that. There were a few things [at home], we
lysis: “challenges faced”, and “resilience and mitigating sold one or two things with the help of my daughter.
factors”. My son drives a rickshaw, and my husband stays at
home; we are old. It impacted him [spouse]. He was
Challenges faced out of work for three months.” (U-10-D)
Most participants faced financial difficulties during the
COVID-19 lockdowns. Several participants reported dif- Some participants had difficulty accessing inpatient ser-
ficulty getting to work because of lack of public vices, since many hospitals were full or refused newSingh et al. BMC Public Health (2021) 21:685 Page 10 of 15
Fig. 3 Factors associated with worsening of diabetes or hypertension symptoms during the COVID-19 lockdown. Diabetes is defined based on
fasting plasma glucose (FPG) > =126 mg/dl (7.0 mmol/l) and/or glycated haemoglobin (HbA1c) > = 6.5% (48 mmol/mol) or self-reported or on anti-
diabetic medications. Hypertension was defined as being on antihypertensive medications or a systolic blood pressure > =140 mmHg and/or a diastolic
blood pressure > =90 mmHg. INR = Indian rupees, COVID-19 = coronavirus disease 2019, 95% CI = confidence interval
admissions due to COVID-19 cases. Many participants doctor. I didn’t want to get infected by this (COVID-
were concerned about visiting the hospital or doctor and 19).” (U-02-D)
delayed testing of their blood sugar because of fear and
anxiety about COVID-19. Participants with diabetes and hypertension were almost
all aware of their elevated risk of poor outcomes if in-
“I was not keeping well and none of the hospitals fected with SARS-CoV-2 and many feared to go out for
were taking any admission . . . they [hospital staff] a walk or other regular exercise.
said that due to COVID, beds are not available.
And if you are ready to sleep on ground then we will Resilience and mitigating factors
take your admission.” (U-08-V) Participants were well informed and emphasized the
importance of wearing masks, practicing social distan-
“I was scared that I may not have this [coronavirus cing, or handwashing. Few participants utilized telecon-
infection] but because of someone else I may get af- sultations with doctors to avoid making in-person clinic
fected. We have doubt to go to the hospital, to the visits. Most participants embraced the practice ofSingh et al. BMC Public Health (2021) 21:685 Page 11 of 15
Table 3 Social and economic consequences of COVID-19 pandemic
Overall Delhi Chennai Sonipat (N = 410) Vizag (N = 400)
(N = 1734) (N = 430) (N = 494)
Impact on self-care behaviors Rural Urban Rural Urban
(N = 209) (N = 201) (N = 192) (N = 208)
Adherence to a meal plan in the last 1 week
0 days 553 (36.2) 179 (51.6) 227 (54.7) 48 (25) 46 (25) 37 (20) 16 (7.8)
1–3 days 157 (10.3) 4 (1.2) 0 (0) 52 (27.1) 57 (31) 26 (14.1) 18 (8.7)
4 or more days 819 (53.6) 164 (47.3) 188 (45.3) 92 (47.9) 81 (44) 122 (66) 172 (83.5)
Irregular eating pattern in the last 1 week
0 days 1365 (78.7) 388 (90.2) 456 (92.3) 126 (60.3) 116 (57.7) 134 (69.8) 145 (69.7)
1–3 days 249 (14.4) 32 (7.4) 25 (5.1) 39 (18.7) 60 (29.9) 44 (22.9) 49 (23.6)
4 or more days 120 (6.9) 10 (2.3) 13 (2.6) 44 (21.1) 25 (12.4) 14 (7.3) 14 (6.7)
Physical activity in the last 1 week
0 days 1038 (59.9) 332 (77.2) 338 (68.4) 54 (25.8) 90 (44.8) 122 (63.5) 102 (49)
1–3 days 202 (11.7) 36 (8.4) 12 (2.4) 83 (39.7) 54 (26.9) 7 (3.7) 10 (4.8)
4 or more days 494 (28.5) 62 (14.4) 144 (29.2) 72 (34.5) 57 (28.4) 63 (32.8) 96 (46.2)
Fruits consumption during lockdown vs. pre-lockdown
Reduced fruit intake 658 (37.9%) 77 (17.9%) 153 (31.0%) 198 (94.7%) 94 (46.8%) 78 (40.6%) 58 (27.9%)
Increased fruit intake 105 (6.1%) 40 (9.3%) 10 (2.0%) 1 (0.5%) 5 (2.5%) 13 (6.8%) 36 (17.3%)
No change in fruit intake 971 (56.0%) 313 (72.8%) 331 (67.0%) 10 (4.8%) 102 (50.7%) 101 (52.6%) 114 (54.8%)
Vegetables consumption during lockdown vs. pre-lockdown
Reduced vegetable intake 485 (28.0%) 49 (11.4%) 67 (13.6%) 191 (91.4%) 81 (40.3%) 61 (31.8%) 36 (17.3%)
Increased vegetable intake 196 (11.3%) 46 (10.7%) 39 (7.9%) 2 (1.0%) 8 (4.0%) 35 (18.2%) 66 (31.7%)
No change in vegetable intake 1053 (60.7%) 335 (77.9%) 388 (78.5%) 16 (7.7%) 112 (55.7%) 96 (50.0%) 106 (51.0%)
Duration and intensity of physical activity during lockdown vs. pre-lockdown
Decreased physical activity 431 (24.9%) 42 (9.8%) 111 (22.5%) 149 (71.3%) 89 (44.3%) 10 (5.2%) 30 (14.4%)
Increased physical activity 38 (2.2%) 10 (2.3%) 11 (2.2%) 2 (1.0%) 8 (4.0%) 0 (0.0%) 7 (3.4%)
No change in physical activity 227 (13.1%) 46 (10.7%) 34 (6.9%) 4 (1.9%) 14 (7.0%) 60 (31.3%) 69 (33.2%)
Economic impact of COVID-19
Experienced loss of job 634 (36.6%) 163 (37.9%) 212 (42.9%) 86 (41.1%) 75 (37.3%) 49 (25.5%) 49 (23.6%)
Experienced loss of income 1029 (59.3%) 203 (47.2%) 355 (71.9%) 131 (62.7%) 91 (45.3%) 139 (72.4%) 110 (52.9%)
Received financial support from the government 774 (44.6%) 36 (8.4%) 460 (93.1%) 34 (16.3%) 14 (7.0%) 163 (84.9%) 67 (32.2%)
COVID-19 coronavirus disease 2019
enhanced personal cleanliness and other measures to healthcare; relatively less availability of functioning
proactively reduce risks of COVID-19 infection and health facilities; poor treatment satisfaction; and reduced
transmission. fruit and vegetable consumption.
Infectious disease epidemics have tended to have spill-
“We have to be careful from the corona and we have over effects onto the wider economy [14, 33–37]. This
to be safe from this. That’s the only medicine now.” study showed that impacts of the pandemic extend be-
(U-01-D) yond health to encompass adverse effects on household
incomes, individual livelihoods, interpersonal relation-
Discussion ships, coping skills, nutritional intake, and other factors.
COVID-19 pandemic related restrictions implemented Our quantitative and qualitative data underscore signifi-
to control it had unforeseen adverse impacts on the cant economic impacts from loss of employment and
health status, access to treatment, and achievement of household income in the study population, due at least
care goals among people with chronic conditions in in part to restrictions preventing workers from returning
India. We found rural participants disproportionately ex- to work. Those repercussions may in turn lead to further
perienced acute medical illnesses; difficulties in accessing stress and additional impacts on health. People withSingh et al. BMC Public Health (2021) 21:685 Page 12 of 15 diabetes and hypertension were worst affected due to those of lower educational attainment experienced more their difficulty in accessing health care and experienced difficulties in accessing medicines, controlling for other worsening symptoms or uncontrolled BP or FBS during demographics and self-reported income. Difficulty in ac- the lockdowns, which might lead to poor health out- cess to medicines, in turn was associated with worsening comes and avoidable micro- and macrovascular compli- of diabetes or hypertension symptoms. Global supply cations. People with chronic conditions are known to be chain disruptions during the pandemic contributed to most vulnerable to the complications of COVID-19 as reported shortages of essential medicines for chronic highlighted in the WHO global survey and several pub- conditions [50]. Furthermore, the pandemic caused lished reports [8, 9, 23, 38–40]. It is unclear how the people with chronic conditions to face many lifestyle dis- dual impact of COVID-19 and the health care disrup- ruptions (unhealthy diet and physical inactivity, sleep tions affect these individuals in the long-term. disturbances, stress, and anxiety) needing remedial mea- Our study results are consistent with other online sur- sures [16, 51]. Government aid was associated with veys conducted among people with chronic conditions fewer difficulties in access to medicines, but varied sig- and healthcare providers that showed the coronavirus nificantly across locations, demonstrating the import- pandemic and its related lockdowns significantly re- ance of appropriate policies at the state and local levels. duced access to healthcare, adversely impacted self-care To mitigate the disparities in chronic disease manage- behaviors, and increased mental health problems [11, 15, ment and reduce the potential longer-run health impacts 16, 24, 38]. A recent study from India reported the ef- of the current crisis, a promising approach is to focus on fects of COVID-19–related lockdowns on the adoption enabling access to medicines for vulnerable populations of newer technologies and changes in glycemic control (i.e., those in rural areas, with lower educational attain- in patients with diabetes and found that the pandemic ment, and those experiencing poverty exacerbated by did not poorly affect glycemic control (HbA1c levels be- loss of jobs and household income). New models of fore vs. during lockdown: 8.2% vs. 7.7%). However, that healthcare delivery combined with new skills (e.g., study was conducted at a single private clinic, and the patient-centered orientation and leveraging consumer- higher socio-economic status of the surveyed partici- facing technologies) for the health workforce can pro- pants could influence the study results [41]. Another mote patient engagement and health literacy, ultimately cross-sectional study from India evaluating the impact of improving health outcomes. COVID-19 related lockdowns on changes in health be- Our data may assist health authorities to redesign care haviors and metabolic parameters in people with dia- delivery models to address the urgent needs of people betes found that adherence to therapy, glycemic control, with chronic conditions. We recommend a three- and monitoring did not differ significantly pre- and pronged approach to design resilient healthcare systems post-lockdowns [42]. However, in a sub-analysis of our during and after the COVID-19 pandemic: a) develop study, we noted significant increase in the mean FBS re- and implement digital campaigns to disseminate infor- ported during lockdown (198 mg/dl) vs. before lockdown mation on how to adopt healthy behaviors, better self- (165 mg/dl) in the cohort participants. This indicates manage NCDs, and control COVID-19; b) decentralize that people with diabetes appear to be at greater risk of healthcare delivery for people with chronic conditions experiencing uncontrolled blood sugar during the pan- by involving trained community health workers and demic, which is consistent with the results of another using technology-assisted medical interventions along study from India that found diabetes to be the most with home monitoring devices to improve health care common comorbidity among COVID-19 decedents [43]. services; c) provide effective social and economic sup- COVID-19 has also been a major concern in higher- port for people with chronic conditions, particularly income countries, with many European countries and rural communities, elderly, and those with severe mental the United States experiencing significant excess mortal- health problems. Many have experienced loss of liveli- ity in 2020 and a greater proportion of deaths from hoods, isolation, stress, and anxiety during the pan- NCDs at home [44–49]. demic; however, those with preexisting chronic The COVID-19 pandemic is unprecedented and ser- conditions have often experienced compounding effects ious, and several of the policy measures taken to miti- that exacerbate their illness [52]. Therefore, social net- gate and contain it were necessary and understandable. works and family members have an important role to At the same time, we believe that the data from our play within the community and at home in monitoring study provide insights for policy makers as they consider and enhancing self-care behaviors among patients with the asymmetrical psycho-social and economic impacts of chronic conditions. Although regulatory authorities in the pandemic on people with chronic conditions, espe- many countries have approved one or more COVID-19 cially underprivileged urban residents and underserved vaccines for emergency use, important challenges remain rural communities. In our study, rural residents and in mass producing and distributing vaccines in
Singh et al. BMC Public Health         (2021) 21:685                                                                                            Page 13 of 15

developing countries. In addition, the lasting and com-                          Acute Respiratory Syndrome; SD: Standard Deviation; WHO: World Health
plex syndemic effects of the pandemic may linger; there-                         Organization

fore, social health measures remain important. Greater
investment in prevention efforts and strengthening pri-                          Supplementary Information
                                                                                 The online version contains supplementary material available at https://doi.
mary care can help save future healthcare costs, reduce                          org/10.1186/s12889-021-10708-w.
the burden of NCDs, and enhance resilience against fu-
ture pandemics [53].                                                              Additional file 1: Table S1. Factors associated with difficulty in
  The strength of this study lies in its empirical mixed                          accessing medicines during the COVID-19 lockdowns in India. Table S2.
                                                                                  Factors associated with worsening of diabetes or hypertension symptoms
methods study design and focus on people with chronic
                                                                                  during the COVID-19 lockdowns in India. Table S3. COVID-19 pandemic-
conditions from both urban and rural populations. It is                           related restrictions and preventive measures.
the first such study from a populous country like India.                          Additional file 2. Supplementary file.
However, future research is needed to evaluate the
longer-run impact of the COVID-19 pandemic on                                    Acknowledgements
healthcare access and health outcomes for those both                             Authors acknowledge the contributions of field teams for data collection,
                                                                                 and study participants for their participation in this study.
with and without NCDs.
                                                                                 Authors’ contributions
                                                                                 KE, KS, SM, and DP contributed to the conception and design of the study.
Limitations                                                                      SJ, DK, DM, SVN, PJ, ARM, KS, DP, EG, KMVN, and MKA had a role in
This study has important limitations. First, the cross-                          acquisition, analysis, or interpretation of data. KS, DK, MKA, and KE drafted
sectional nature of this study limits the causal inferences                      the manuscript, and all authors critically revised the manuscript. KE, DP, MKA,
                                                                                 NT, VM, and KMVN provided technical and material support. All authors
between SES and chronic conditions and the COVID-19                              approved the final manuscript.
pandemic related restrictions. Second, although the data
are derived from a wide cross section of four sites, it                          Funding
cannot be construed as definitively representative of all                        The CARRS Study was funded in part by the National Heart, Lung, and Blood
                                                                                 Institute (NHLBI), National Institutes of Health (NIH), Department of Health
urban and rural India. Third, because of the ongoing                             and Human Services, under Contract No. HHSN268200900026C, and the
COVID-19 outbreak that we are studying, it was not                               United Health Group, Minneapolis, MN, USA. UDAY is supported by an
possible to conduct the interviews in person; phone in-                          unrestricted educational grant from Eli Lilly and Company under the Lilly
                                                                                 NCD Partnership Program. KS is supported by funding from the Fogarty
terviews may have limited the interpretation of qualita-                         International Centre, National Institutes of Health (NIH), United States (grant
tive data since they do not allow direct observation of                          award: 1K43TW011164). NSV is supported by the Fogarty International Centre
participants’ expressions and body language.                                     and National Institute of Mental Health, of the National Institutes of Health
                                                                                 under Award Number D43 TW010543. KMVN, and MKA, were funded in part
                                                                                 by the National Institute of Diabetes and Digestive and Kidney Diseases of
                                                                                 the National Institutes of Health under Award Number P30DK111024. DP was
Conclusion                                                                       supported by Fogarty International Centre of the National Institutes of
In response to the rapid spread of the COVID-19 pan-                             Health under Award Number U01TW010097. The funding agency had no
demic and associated health system disruptions experi-                           role in the design, conduct, or analysis of the study, and no role in the
                                                                                 decision to submit the manuscript for publication. The content is solely the
enced in under-resourced and low-income settings,                                responsibility of the authors and does not necessarily represent the official
there needs to be renewed focus on building resilient                            views of the National Institutes of Health. KE gratefully acknowledges
health systems that can deliver routine care using in-                           funding from the Stanford Asia Health Policy Program, Asia-Pacific Research
                                                                                 Centre faculty research award, and a seed grant from the Stanford Centre for
novative telehealth approaches during the pandemic and                           Asian Health Research and Education.
respond to the shocks induced by infectious disease pan-
demics or other health crises effectively. People living in                      Availability of data and materials
                                                                                 The datasets generated and analyzed during the current study are not
rural areas and underserved communities in urban areas
                                                                                 publicly available because the datasets are currently used for another project
faced greater challenges in access to healthcare and                             but are available from the corresponding author on reasonable request.
experienced worsening of diabetes or hypertension
symptoms, as well as significant losses of income and                            Declarations
employment. The pandemic exposed disparities in                                  Ethics approval and consent to participate
chronic disease management, but also provides oppor-                             Ethics approval for the study protocol was obtained from the Ethics
tunities to close gaps with innovations in the new post-                         Committee of Centre for Chronic Disease Control (CCDC), New Delhi and
                                                                                 Madras Diabetes Research Foundation (MDRF), Chennai, Tamil Nadu, India.
COVID India.                                                                     Verbal consent was obtained from all participants through telephone
                                                                                 responses before the start of the survey. The Ethics Committee of CCDC and
Abbreviations                                                                    MDRF approved the procedure for obtaining informed consent.
BP: Blood pressure; CARRS: Centre for Cardiometabolic Risk Reduction in
South Asia; CCDC: Centre for Chronic Disease Control; CI: Confidence Interval;   Consent for publication
COVID-19: Coronavirus disease 2019; EQ 5D-VAS: European Quality of Life 5        Not applicable.
Dimension - Visual Analogue Scale; FBS: Fasting Blood Sugar;
GAD: Generalized Anxiety Disorder; MDRF: Madras Diabetes Research                Competing interests
Foundation; NCD: Non-Communicable Disease; OR: Odds Ratio; SARS: Severe          The authors declare no conflict of interest.
Singh et al. BMC Public Health (2021) 21:685 Page 14 of 15
Author details 15. Islam N, Lacey B, Shabnam S, Erzurumluoglu AM, Dambha-Miller H, Chowell
1
Public Health Foundation of India, Plot number 47, Sector 44, Gurugram, G, et al. Social inequality and the syndemic of chronic disease and COVID-
New Delhi, Haryana 122002, India. 2Centre for Chronic Disease Control, New 19: county-level analysis in the USA. J Epidemiol Community Health. 2021:
Delhi, India. 3Deakin University, Melbourne, Australia. 4Madras Diabetes jech-2020-215626. https://doi.org/10.1136/jech-2020-215626.
Research Foundation, Chennai, India. 5Emory University, Atlanta, GA, USA. 6All 16. Yadav UN, Rayamajhee B, Mistry SK, Parsekar SS, Mishra SK. A syndemic
India Institute of Medical Sciences, New Delhi, India. 7London School of perspective on the management of non-communicable diseases amid the
Hygiene and Tropical Medicine, London, UK. 8Stanford University, Stanford, COVID-19 pandemic in low- and middle-income countries. Front Public
California, USA. Health. 2020;8:508. https://doi.org/10.3389/fpubh.2020.00508.
17. India State-Level Disease Burden Initiative C. Nations within a nation:
Received: 7 December 2020 Accepted: 24 March 2021 variations in epidemiological transition across the states of India, 1990-
2016 in the global burden of disease study. Lancet. 2017;390(10111):
2437–60.
18. Anjana RM, Deepa M, Pradeepa R, Mahanta J, Narain K, Das HK, et al.
References Prevalence of diabetes and prediabetes in 15 states of India: results from
1. Coronavirus disease 2019 (COVID-19) Situation Report - 33.pdf. https://www. the ICMR-INDIAB population-based cross-sectional study. Lancet Diabetes
who.int/docs/default-source/coronaviruse/situation-reports/20200222- Endocrinol. 2017;5(8):585–96. https://doi.org/10.1016/S2213-8587(17)30174-2.
sitrep-33-363 (Accessed 24 Sept 2020). 19. Prabhakaran D, Jeemon P, Ghosh S, Shivashankar R, Ajay VS, Kondal D, et al.
2. Garg S, Kim L, Whitaker M, O'Halloran A, Cummings C, Holstein R, et al. Prevalence and incidence of hypertension: results from a representative
Hospitalization rates and characteristics of patients hospitalized with cohort of over 16,000 adults in three cities of South Asia. Indian Heart J.
laboratory-confirmed coronavirus disease 2019 - COVID-NET, 14 states, 2017;69(4):434–41. https://doi.org/10.1016/j.ihj.2017.05.021.
March 1-30, 2020. MMWR Morb Mortal Wkly Rep. 2020;69(15):458–64. 20. Chatterjee P. Is India missing COVID-19 deaths? Lancet. 2020;396(10252):657.
https://doi.org/10.15585/mmwr.mm6915e3. https://doi.org/10.1016/S0140-6736(20)31857-2.
3. Price-Haywood EG, Burton J, Fort D, Seoane L. Hospitalization and mortality 21. The L. COVID-19 in India: the dangers of false optimism. Lancet. 2020;
among black patients and white patients with Covid-19. N Engl J Med. 396(10255):867.
2020;382(26):2534–43. https://doi.org/10.1056/NEJMsa2011686. 22. Debnath R, Bardhan R. India nudges to contain COVID-19 pandemic: a
4. Thienemann F, Pinto F, Grobbee DE, Boehm M, Bazargani N, Ge J, et al. reactive public policy analysis using machine-learning based topic
World heart federation briefing on prevention: coronavirus disease 2019 modelling. PLoS One. 2020;15(9):e0238972. https://doi.org/10.1371/journal.
(COVID-19) in low-income countries. Glob Heart. 2020;15(1):31. https://doi. pone.0238972.
org/10.5334/gh.778. 23. Danhieux K, Buffel V, Pairon A, Benkheil A, Remmen R, Wouters E, et al. The
5. Thienemann F, Ntusi NAB, Battegay E, Mueller BU, Cheetham M. impact of COVID-19 on chronic care according to providers: a qualitative
Multimorbidity and cardiovascular disease: a perspective on low- and study among primary care practices in Belgium. BMC Fam Pract. 2020;21(1):
middle-income countries. Cardiovasc Diagn Ther. 2020;10(2):376–85. https:// 255. https://doi.org/10.1186/s12875-020-01326-3.
doi.org/10.21037/cdt.2019.09.09. 24. Saqib MAN, Siddiqui S, Qasim M, Jamil MA, Rafique I, Awan UA, et al. Effect
6. https://www.worldometers.info/coronavirus/?utm_campaign=homeAdvega of COVID-19 lockdown on patients with chronic diseases. Diabetes Metab
s1?. Accessed on 30 Sept 2020. Syndr. 2020;14(6):1621–3. https://doi.org/10.1016/j.dsx.2020.08.028.
7. Hamer M, Kivimäki M, Gale CR, Batty GD. Lifestyle Risk Factors for 25. Nair M, Ali MK, Ajay VS, Shivashankar R, Mohan V, Pradeepa R, et al. CARRS
Cardiovascular Disease in Relation to COVID-19 Hospitalization: A surveillance study: design and methods to assess burdens from multiple
Community-Based Cohort Study of 387,109 Adults in UK. medRxiv [Preprint]. perspectives. BMC Public Health. 2012;12(1):701. https://doi.org/10.1186/14
2020;2020.05.09.20096438. https://doi.org/10.1101/2020.05.09.20096438. 71-2458-12-701.
Update in: Brain Behav Immun. 2020. PMID: 32511498; PMCID: PMC7273266. 26. Mohan S, Jarhyan P, Ghosh S, Venkateshmurthy NS, Gupta R, Rana R, et al.
8. The impact of the COVID-19 pandemic on noncommunicable disease UDAY: a comprehensive diabetes and hypertension prevention and
resources and services: results of a rapid assessment. Geneva: World Health management program in India. BMJ Open. 2018;8(6):e015919. https://doi.
Organization; 2020. https://www.who.int/publications/i/item/ncds-covid-ra org/10.1136/bmjopen-2017-015919.
pid-assessment. (Accessed on 10 Mar 2021). 27. Rabin R, de Charro F. EQ-5D: a measure of health status from the EuroQol
9. Chudasama YV, Gillies CL, Zaccardi F, Coles B, Davies MJ, Seidu S, et al. group. Ann Med. 2001;33(5):337–43. https://doi.org/10.3109/078538901
Impact of COVID-19 on routine care for chronic diseases: a global survey of 09002087.
views from healthcare professionals. Diabetes Metab Syndr. 2020;14(5):965– 28. Toussaint A, Husing P, Gumz A, Wingenfeld K, Harter M, Schramm E, et al.
7. https://doi.org/10.1016/j.dsx.2020.06.042. Sensitivity to change and minimal clinically important difference of the 7-
10. Su Z, McDonnell D, Wen J, Kozak M, Abbas J, Segalo S, et al. Mental health item generalized anxiety disorder questionnaire (GAD-7). J Affect Disord.
consequences of COVID-19 media coverage: the need for effective crisis 2020;265:395–401. https://doi.org/10.1016/j.jad.2020.01.032.
communication practices. Glob Health. 2021;17(1):4. https://doi.org/10.1186/ 29. Fofana F, Bazeley P, Regnault A. Applying a mixed methods design to test
s12992-020-00654-4. saturation for qualitative data in health outcomes research. PLoS One. 2020;
11. Abbas J. The impact of coronavirus (SARS-CoV2) epidemic on individuals 15(6):e0234898. https://doi.org/10.1371/journal.pone.0234898.
mental health: the protective measures of Pakistan in managing and 30. Fisher MP, Hamer MK. Qualitative methods in health policy and systems
sustaining transmissible disease. Psychiatr Danub. 2020;32(3–4):472–7. research: a framework for study planning. Qual Health Res. 2020;30(12):
https://doi.org/10.24869/psyd.2020.472. 1899–912. https://doi.org/10.1177/1049732320921143.
12. NeJhaddadgar N, Ziapour A, Zakkipour G, Abbas J, Abolfathi M, Shabani M. 31. Johnson SU, Ulvenes PG, Oktedalen T, Hoffart A. Psychometric properties of
Effectiveness of telephone-based screening and triage during COVID-19 the general anxiety disorder 7-item (GAD-7) scale in a heterogeneous
outbreak in the promoted primary healthcare system: a case study in psychiatric sample. Front Psychol. 2019;10:1713. https://doi.org/10.3389/
Ardabil province, Iran. Z Gesundh Wiss. 2020:1–6. https://doi.org/10.1007/s1 fpsyg.2019.01713.
0389-020-01407-8. Epub ahead of print. PMID: 33224715; PMCID: 32. Johnson GA, Vindrola-Padros C. Rapid qualitative research methods during
PMC7665795. complex health emergencies: a systematic review of the literature. Soc Sci
13. Addis SG, Nega AD, Miretu DG. Psychological impact of COVID-19 Med. 2017;189:63–75. https://doi.org/10.1016/j.socscimed.2017.07.029.
pandemic on chronic disease patients in Dessie town government and 33. Fagoonee I, Pellicano R. COVID-19 brings the world economy to its knees.
private hospitals, Northeast Ethiopia. Diabetes Metab Syndr. 2021;15(1):129– Minerva Med. 2020;111(4):297–9. https://doi.org/10.23736/S0026-4806.20.06603-3.
35. https://doi.org/10.1016/j.dsx.2020.12.019. 34. Bowie C, Hill T. Exit strategy to control covid-19 and relaunch the economy.
14. Yoosefi Lebni J, Abbas J, Moradi F, Salahshoor MR, Chaboksavar F, Irandoost BMJ. 2020;369:m1851.
SF, et al. How the COVID-19 pandemic effected economic, social, political, 35. Tiirinki H, Tynkkynen LK, Sovala M, Atkins S, Koivusalo M, Rautiainen P, et al.
and cultural factors: a lesson from Iran. Int J Soc Psychiatry. 2020: COVID-19 pandemic in Finland - preliminary analysis on health system
20764020939984. https://doi.org/10.1177/0020764020939984. Epub ahead of response and economic consequences. Health Policy Technol. 2020;9(4):
print. PMID: 32615838. 649–62. https://doi.org/10.1016/j.hlpt.2020.08.005.You can also read