Utilizing machine learning dimensionality reduction for risk stratification of chest pain patients in the emergency department
←
→
Page content transcription
If your browser does not render page correctly, please read the page content below
Liu et al. BMC Medical Research Methodology             (2021) 21:74
https://doi.org/10.1186/s12874-021-01265-2

 RESEARCH ARTICLE                                                                                                                                   Open Access

Utilizing machine learning dimensionality
reduction for risk stratification of chest pain
patients in the emergency department
Nan Liu1,2,3* , Marcel Lucas Chee4, Zhi Xiong Koh5, Su Li Leow1, Andrew Fu Wah Ho1,5, Dagang Guo6 and
Marcus Eng Hock Ong1,2,5

  Abstract
  Background: Chest pain is among the most common presenting complaints in the emergency department (ED).
  Swift and accurate risk stratification of chest pain patients in the ED may improve patient outcomes and reduce
  unnecessary costs. Traditional logistic regression with stepwise variable selection has been used to build risk
  prediction models for ED chest pain patients. In this study, we aimed to investigate if machine learning
  dimensionality reduction methods can improve performance in deriving risk stratification models.
  Methods: A retrospective analysis was conducted on the data of patients > 20 years old who presented to the ED
  of Singapore General Hospital with chest pain between September 2010 and July 2015. Variables used included
  demographics, medical history, laboratory findings, heart rate variability (HRV), and heart rate n-variability (HRnV)
  parameters calculated from five to six-minute electrocardiograms (ECGs). The primary outcome was 30-day major
  adverse cardiac events (MACE), which included death, acute myocardial infarction, and revascularization within 30
  days of ED presentation. We used eight machine learning dimensionality reduction methods and logistic regression
  to create different prediction models. We further excluded cardiac troponin from candidate variables and derived a
  separate set of models to evaluate the performance of models without using laboratory tests. Receiver operating
  characteristic (ROC) and calibration analysis was used to compare model performance.
  Results: Seven hundred ninety-five patients were included in the analysis, of which 247 (31%) met the primary
  outcome of 30-day MACE. Patients with MACE were older and more likely to be male. All eight dimensionality
  reduction methods achieved comparable performance with the traditional stepwise variable selection; The
  multidimensional scaling algorithm performed the best with an area under the curve of 0.901. All prediction
  models generated in this study outperformed several existing clinical scores in ROC analysis.
  Conclusions: Dimensionality reduction models showed marginal value in improving the prediction of 30-day MACE
  for ED chest pain patients. Moreover, they are black box models, making them difficult to explain and interpret in
  clinical practice.
  Keywords: Machine learning, Dimensionality reduction, Heart rate n-variability (HRnV), Heart rate variability (HRV),
  Chest pain, Emergency department

* Correspondence: liu.nan@duke-nus.edu.sg
1
 Duke-NUS Medical School, National University of Singapore, Singapore,
Singapore
2
 Health Services Research Centre, Singapore Health Services, Singapore,
Singapore
Full list of author information is available at the end of the article

                                        © The Author(s). 2021 Open Access This article is licensed under a Creative Commons Attribution 4.0 International License,
                                        which permits use, sharing, adaptation, distribution and reproduction in any medium or format, as long as you give
                                        appropriate credit to the original author(s) and the source, provide a link to the Creative Commons licence, and indicate if
                                        changes were made. The images or other third party material in this article are included in the article's Creative Commons
                                        licence, unless indicated otherwise in a credit line to the material. If material is not included in the article's Creative Commons
                                        licence and your intended use is not permitted by statutory regulation or exceeds the permitted use, you will need to obtain
                                        permission directly from the copyright holder. To view a copy of this licence, visit http://creativecommons.org/licenses/by/4.0/.
                                        The Creative Commons Public Domain Dedication waiver (http://creativecommons.org/publicdomain/zero/1.0/) applies to the
                                        data made available in this article, unless otherwise stated in a credit line to the data.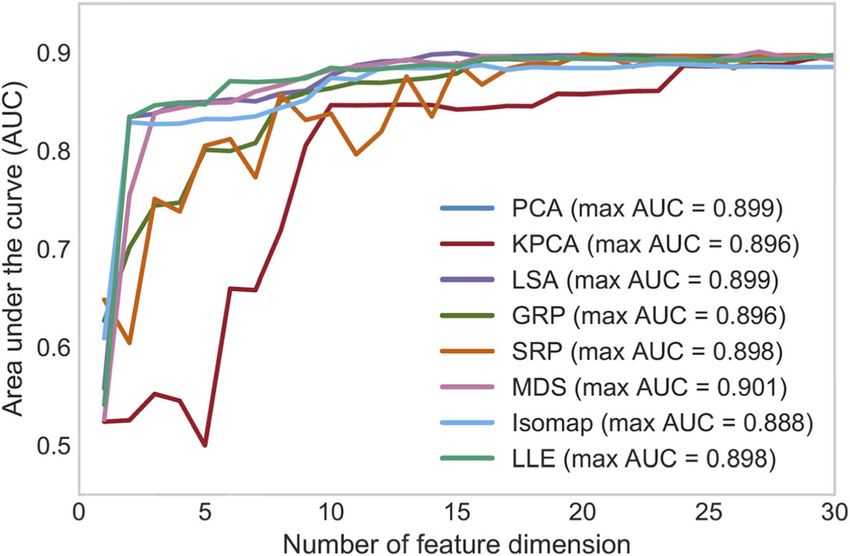
Liu et al. BMC Medical Research Methodology   (2021) 21:74                                                     Page 2 of 13

Background                                                    outperformed the HEART, TIMI, and GRACE scores in
Chest pain is among the most common chief complaints          predicting 30-day MACE [28]. Nevertheless, multicolli-
presenting to the emergency department (ED) [1–3].            nearity is a common problem in logistic regression
The assessment of chest pain patients poses a diagnostic      models where supposedly independent predictor vari-
challenge in balancing risk and cost. Inadvertent dis-        ables are correlated. They tend to overestimate the vari-
charge of acute coronary syndrome (ACS) patients is as-       ance of regression parameters and hinder the
sociated with higher mortality rates while inappropriate      determination of the exact effect of each parameter,
admission of patients with more benign conditions in-         which could potentially result in inaccurate identification
creases health service costs [4, 5]. Hence, the challenge     of significant predictors [29, 30]. In the paper, 115
lies in recognizing low-risk chest pain patients for safe     HRnV parameters were derived but only seven variables
and early discharge from the ED. There has been in-           were left in the final prediction model, and this implies
creasing focus on the development of risk stratification      the possible elimination of relevant information [28].
scores. Initially, risk scores such as the Thrombolysis in      Within the general medical literature, machine learning
Myocardial Infarction (TIMI) score [6, 7] and the Global      dimensionality reduction methods are uncommon and
Registry of Acute Coronary Events (GRACE) score [8]           limited to a few specific areas, such as bioinformatics stud-
were developed from post-ACS patients to estimate             ies on genetics [31, 32] and diagnostic radiological im-
short-term mortality and recurrence of myocardial in-         aging [33, 34]. Despite this, dimensionality reduction in
farction. The History, Electrocardiogram (ECG), Age,          HRV has been investigated and shown to effectively com-
Risk factors, and initial Troponin (HEART) score was          press multidimensional HRV data for the assessment of
subsequently designed for ED chest pain patients [9],         cardiac autonomic neuropathy [35]. In this paper, we
which demonstrated superior performance in many               attempted to investigate several machine learning dimen-
comparative studies on the identification of low-risk         sionality reduction algorithms in building predictive
chest pain patients [10–17]. Nonetheless, the HEART           models, hypothesizing that these algorithms could be use-
score has its disadvantages. Many potential factors can       ful in preserving useful information while improving pre-
affect its diagnostic and prognostic accuracy, such as        diction performance. We aimed to compare the
variation in patient populations, provider determination      performance of the dimensionality reduction models
of low-risk heart score criteria, specific troponin reagent   against the traditional stepwise logistic regression model
used, all of which contribute to clinical heterogeneity       [28] and conventional risk stratification tools such as the
[18–21]. In addition, most risk scores still require vari-    HEART, TIMI, and GRACE scores, in the prediction of
ables that may not be available during the initial presen-    30-day MACE in chest pain patients presenting to the ED.
tation of the patient to the ED such as troponin. There
remains a need for a more efficient risk stratification       Methods
tool.                                                         Study design and clinical setting
   We had previously developed a heart rate variability       A retrospective analysis was conducted on data collected
(HRV) prediction model using readily available variables      from patients > 20 years old who presented to Singapore
at the ED, in an attempt to reduce both diagnostic time       General Hospital ED with chest pain between September
and subjective components [22]. HRV characterizes             2010 to July 2015. These patients were triaged using the
beat-to-beat variation using time, frequency domain, and      Patient Acuity Category Scale (PACS) and those with
nonlinear analysis [23] and has proven to be a good pre-      PACS 1 or 2 were included in the study. Patients were
dictor of major adverse cardiac events (MACE) [22, 24,        excluded if they were lost to the 30-day follow-up or if
25]. Most HRV-based scores were reported to be super-         they presented with ST-elevation myocardial infarction
ior to TIMI and GRACE scores while achieving compar-          (STEMI) or non-cardiac etiology chest pain such as
able performance with HEART score [17, 24, 26, 27].           pneumothorax, pneumonia, and trauma as diagnosed by
Recently, we established a new representation of beat-to-     the ED physician. Patients with ECG findings that pre-
beat variation in ECGs, the heart rate n-variability          cluded quality HRnV analysis such as artifacts, ectopic
(HRnV) [28]. HRnV utilizes variation in sampling RR-          beats, paced or non-sinus rhythm were also excluded.
intervals and overlapping RR-intervals to derive add-
itional parameters from a single strip of ECG reading.        Data collection
As an extension to HRV, HRnV potentially supplements          For each patient, HRV and HRnV parameters were cal-
additional information about adverse cardiac events           culated using HRnV-Calc software suite [28, 36] from a
while reducing unwanted noise caused by abnormal              five to six-minute single-lead (lead II) ECG performed
heartbeats. Moreover, HRV is a special case of HRnV           via the X-series Monitor (ZOLL Medical, Corporation,
when n = 1. The HRnV prediction model, developed              Chelmsford, MA). Table 1 shows the full list of HRV
from multivariable stepwise logistic regression,              and HRnV parameters used in this study. Besides, the
Liu et al. BMC Medical Research Methodology           (2021) 21:74                                                                             Page 3 of 13

Table 1 List of traditional heart rate variability (HRV) and novel heart rate n-variability (HRnV) parameters used in this study. HRnV is
a new representation of beat-to-beat variation in ECGs and parameter “n” controls the formation of new RR-intervals that are used
for parameter calculation. Details of HRnV definition can be found in [28]
HRV                      HR2V                       HR2V1                      HR3V                      HR3V1                      HR3V2
Mean NN                  HR2V Mean NN               HR2V1 Mean NN              HR3V Mean NN              HR3V1 Mean NN              HR3V2 Mean NN
SDNN                     HR2V SDNN                  HR2V1 SDNN                 HR3V SDNN                 HR3V1 SDNN                 HR3V2 SDNN
RMSSD                    HR2V RMSSD                 HR2V1 RMSSD                HR3V RMSSD                HR3V1 RMSSD                HR3V2 RMSSD
Skewness                 HR2V Skewness              HR2V1 Skewness             HR3V Skewness             HR3V1 Skewness             HR3V2 Skewness
Kurtosis                 HR2V Kurtosis              HR2V1 Kurtosis             HR3V Kurtosis             HR3V1 Kurtosis             HR3V2 Kurtosis
Triangular index         HR2V Triangular index      HR2V1 Triangular index     HR3V Triangular index     HR3V1 Triangular index     HR3V2 Triangular index
NN50                     HR2V NN50                  HR2V1 NN50                 HR3V NN50                 HR3V1 NN50                 HR3V2 NN50
pNN50                    HR2V pNN50                 HR2V1 pNN50                HR3V pNN50                HR3V1 pNN50                HR3V2 pNN50
–                        HR2V NN50n                 HR2V1 NN50n                HR3V NN50n                HR3V1 NN50n                HR3V2 NN50n
–                        HR2V pNN50n                HR2V1 pNN50n               HR3V pNN50n               HR3V1 pNN50n               HR3V2 pNN50n
Total powera             HR2V Total power           HR2V1 Total power          HR3V Total power          HR3V1 Total power          HR3V2 Total power
VLF power                HR2V VLF power             HR2V1 VLF power            HR3V VLF power            HR3V1 VLF power            HR3V2 VLF power
LF power                 HR2V LF power              HR2V1 LF power             HR3V LF power             HR3V1 LF power             HR3V2 LF power
HF power                 HR2V HF power              HR2V1 HF power             HR3V HF power             HR3V1 HF power             HR3V2 HF power
LF power norm            HR2V LF power norm         HR2V1 LF power norm        HR3V LF power norm        HR3V1 LF power norm        HR3V2 LF power norm
HF power norm            HR2V HF power norm         HR2V1 HF power norm        HR3V HF power norm        HR3V1 HF power norm        HR3V2 HF power norm
LF/HF                    HR2V LF/HF                 HR2V1 LF/HF                HR3V LF/HF                HR3V1 LF/HF                HR3V2 LF/HF
Poincaré SD1             HR2V Poincaré SD1          HR2V1 Poincaré SD1         HR3V Poincaré SD1         HR3V1 Poincaré SD1         HR3V2 Poincaré SD1
Poincaré SD2             HR2V Poincaré SD2          HR2V1 Poincaré SD2         HR3V Poincaré SD2         HR3V1 Poincaré SD2         HR3V2 Poincaré SD2
Poincaré SD1/SD2         HR2V Poincaré SD1/         HR2V1 Poincaré SD1/        HR3V Poincaré SD1/        HR3V1 Poincaré SD1/        HR3V2 Poincaré SD1/
ratio                    SD2                        SD2                        SD2                       SD2                        SD2
SampEn                   HR2V SampEn                HR2V1 SampEn               HR3V SampEn               HR3V1 SampEn               HR3V2 SampEn
ApEn                     HR2V ApEn                  HR2V1 ApEn                 HR3V ApEn                 HR3V1 ApEn                 HR3V2 ApEn
DFA, α1                  HR2V DFA, α1               HR2V1 DFA, α1              HR3V DFA, α1              HR3V1 DFA, α1              HR3V2 DFA, α1
DFA, α2                  HR2V DFA, α2               HR2V1 DFA, α2              HR3V DFA, α2              HR3V1 DFA, α2              HR3V2 DFA, α2
Mean NN average of R-R intervals, SDNN standard deviation of R-R intervals, RMSSD square root of the mean squared differences between R-R intervals, NN50 the
number of times that the absolute difference between 2 successive R-R intervals exceeds 50 ms pNN50, NN50 divided by the total number of R-R intervals, NN50n
the number of times that the absolute difference between 2 successive RRnI/RRnIm sequences exceeds 50 × n ms, pNN50n NN50n divided by the total number of
RRnI/RRnIm sequences, VLF very low frequency, LF low frequency, HF high frequency, SD standard deviation, SampEn sample entropy, ApEn approximate entropy,
DFA detrended fluctuation analysis
a
 In frequency domain analysis, the power of spectral components is the area below the relevant frequencies presented in absolute units (square milliseconds)

first 12-lead ECGs taken during patients’ presentation to                        Machine learning dimensionality reduction
the ED were interpreted by two independent clinical re-                          Dimensionality reduction in machine learning and data
viewers and any pathological ST changes, T wave inver-                           mining [37] refers to the process of transforming high-
sions, and Q-waves were noted. Patients’ demographics,                           dimensional data into lower dimensions such that fewer
medical history, first set of vital signs, and troponin-T                        features are selected or extracted while preserving essen-
values were obtained from the hospital’s electronic                              tial information of the original data. Two types of di-
health records (EHR). In this study, high-sensitivity                            mensionality reduction approaches are available, namely
troponin-T was selected as the cardiac biomarker and an                          variable selection and feature extraction. Variable selec-
abnormal value was defined as > 0.03 ng/mL.                                      tion methods generally reduce data dimensionality by
   The primary outcome measured was any MACE within                              choosing a subset of variables, while feature extraction
30 days, including acute myocardial infarction, emergent re-                     methods transform the original feature space into lower-
vascularization procedures such as percutaneous coronary                         dimensional space through linear or nonlinear feature
intervention (PCI) or coronary artery bypass graft (CABG),                       projection. In clinical predictive modeling, variable selec-
or death. The primary outcome was captured through a                             tion techniques such as stepwise logistic regression are
retrospective review of patients’ EHR.                                           popular for constructing prediction models [38]. In con-
                                                                                 trast, feature extraction approaches [39] are less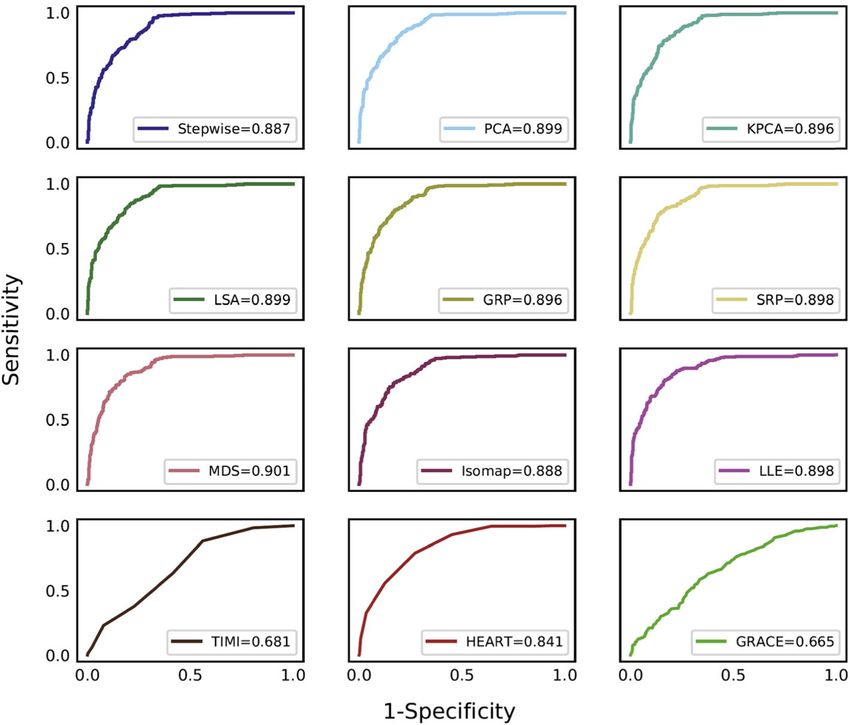
Liu et al. BMC Medical Research Methodology         (2021) 21:74                                                                          Page 4 of 13

commonly used in medical research, although they have                        embedding (LLE) [51]. All these algorithms are unsuper-
been widely used in computational biology [40], image                        vised learning methods, meaning the transformation of
analysis [41, 42], physiological signal analysis [43],                       feature space does not rely on sample labels y. Among
among others. In this study, we investigated the imple-                      the eight methods, MDS, Isomap, and LLE are manifold
mentation of eight feature extraction algorithms and                         learning-based techniques for nonlinear dimensionality
evaluated their contributions to prediction performance                      reduction. Table 2 gives a brief introduction to these
in risk stratification of ED chest pain patients. We also                    eight methods.
compared them with a prediction model that was built
using conventional stepwise variable selection [28].                         Predictive and statistical analysis
Henceforth, we use the terms “dimensionality reduction”                      In this study, we chose logistic regression as the classifi-
and “feature extraction” interchangeably.                                    cation algorithm to predict the MACE outcome. As de-
   Given that there were n samples (xi, yi), i = 1, 2, …, n,                 scribed earlier, we determined the threshold P       ~ to
in the dataset (X, y), where each sample xi had original D                   preselect a subset of D~ variables, ensuring the removal
features and its label yi = 1 or 0, with 1 indicating a posi-                of less significant variables as indicated by univariable
tive primary outcome, i.e., MACE within 30 days. We                                                                              ~
                                                                             analysis, after which X ∈ ℝn × D became X∈ℝ ~ n D     . In
applied dimensionality reduction algorithms to project xi
into a d-dimensional space (d < D). As a result, the ori-                    summary, the inputs to all dimensionality reduction al-
                                     ^ nd . There was a                     gorithms were in D   ~ -dimensional space. Subsequently,
ginal dataset X ∈ ℝn × D became X∈ℝ
total of D = 174 candidate variables in this study. As sug-                  conventional logistic regression was implemented to take
gested in Liu et al. [28], some variables were less statisti-                d-dimensional X  ^ to predict y, where 5-fold cross-
cally significant in terms of contributions to the                           validation was used.
prediction performance. Thus, we conducted univariable                         We compared the models built with machine learning
analysis and preselected a subset of D  ~ variables if their p               dimensionality reduction with our previous stepwise
   ~ In this study, we determined P
< P.                                 ~ by running principal                  model [28], in which the following 16 variables were
component analysis (PCA) [44] and logistic regression                        used: age, diastolic blood pressure, pain score, ST-
through 5-fold cross-validation; we plotted a curve to                       elevation, ST-depression, Q wave, cardiac history (the
visualize the choice of a threshold and its impact on pre-                   “History” component in the HEART score), troponin,
dictive performance. PCA was used for demonstration                          HRV NN50, HR2V skewness, HR2V SampEn, HR2V
because of its simplicity and fast running speed. Other                      ApEn, HR2V1 ApEn, HR3V RMSSD, HR3V skewness,
than PCA, we also implemented seven dimensionality                           and HR3V2 HF power. As described in [28], we selected
reduction algorithms, including kernel PCA (KPCA) [45]                       candidate variables with p < 0.2 in univariable analysis
with polynomial kernel function, latent semantic analysis                    and subsequently conducted multivariable analysis using
(LSA) [46], Gaussian random projection (GRP) [47],                           backward stepwise logistic regression. In the current
sparse random projection (SRP) [48], multidimensional                        study, we further built eight dimensionality reduction
scaling (MDS) [49], Isomap [50], and locally linear                          models without using the cardiac troponin and com-
                                                                             pared them with the stepwise model without the

Table 2 Summary of machine learning dimensionality reduction methods used in this study
Methods                                                                              Descriptions
Principal component analysis     PCA decomposes data into a set of successive orthogonal components that explain a maximum amount of the
(PCA) [44]                       variance
Kernel PCA (KPCA) [45]           KPCA extends PCA by using kernel functions to achieve non-linear dimensionality reduction
Latent semantic analysis (LSA)   LSA is similar to PCA but differs in that the data matrix does not need to be centered
[46]
Gaussian random projection       GRP projects the original input features onto a randomly generated matrix where components are drawn from a
(GRP) [47]                       Gaussian distribution
Sparse random projection         SRP projects the original input features onto a sparse random matrix, which is an alternative to dense Gaussian
(SRP) [48]                       random projection matrix
Multidimensional scaling         MDS is a technique used for analyzing similarity or dissimilarity data, seeking a low-dimensional representation of
(MDS) [49]                       the data in which the distances respect well the distances in the original high-dimensional space
Isomap [50]                      Isomap is a manifold learning algorithm, seeking a lower-dimensional embedding that maintains geodesic distances
                                 between all points
Locally linear embedding (LLE) LLE projects the original input features to a lower-dimensional space by preserving distances within local
[51]                           neighborhoods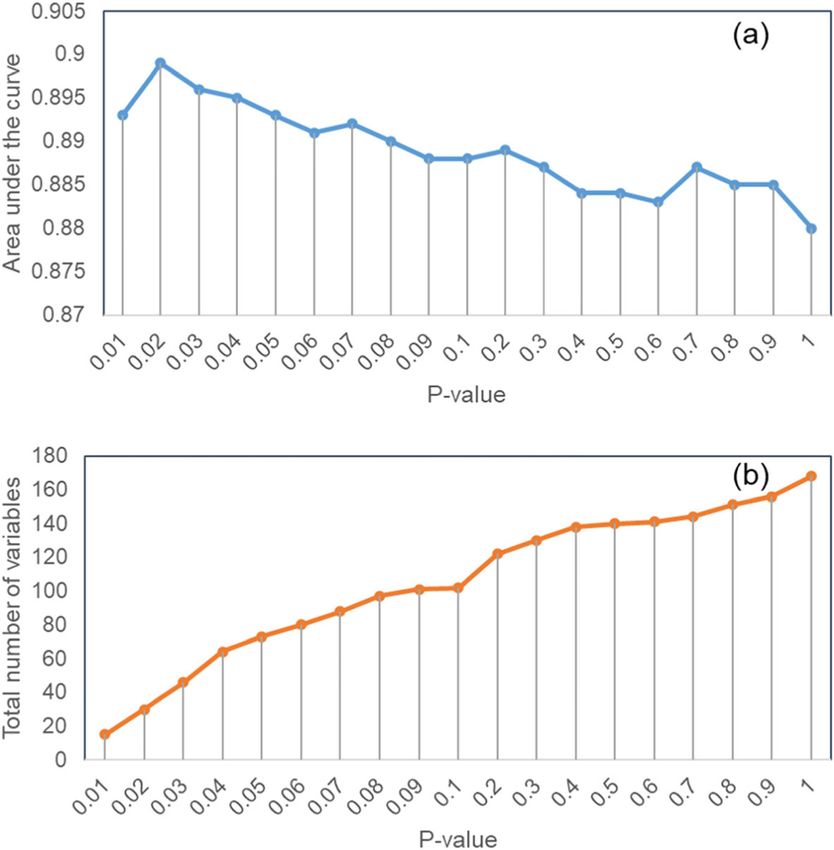
Liu et al. BMC Medical Research Methodology (2021) 21:74 Page 5 of 13
troponin component. This analysis enabled us to check Figure 2 shows the predictive performance (in terms
the feasibility of avoiding the use of laboratory results of AUC value) versus feature dimension (i.e., number of
for quick risk stratification. “principal components”) for all eight dimensionality re-
In evaluating the modeling performance, we per- duction algorithms. The AUC values of GRP, SRP, and
formed the receiver operating characteristic (ROC) curve KPCA gradually increased with the increment of feature
analysis and reported the corresponding area under the dimension, while the AUC values of PCA, LSA, MDS,
curve (AUC), sensitivity, specificity, positive predictive Isomap, and LLE drastically jumped to more than 0.8
value (PPV), and negative predictive value (NPV) mea- when feature dimension d ≥ 3 and plateaued in the
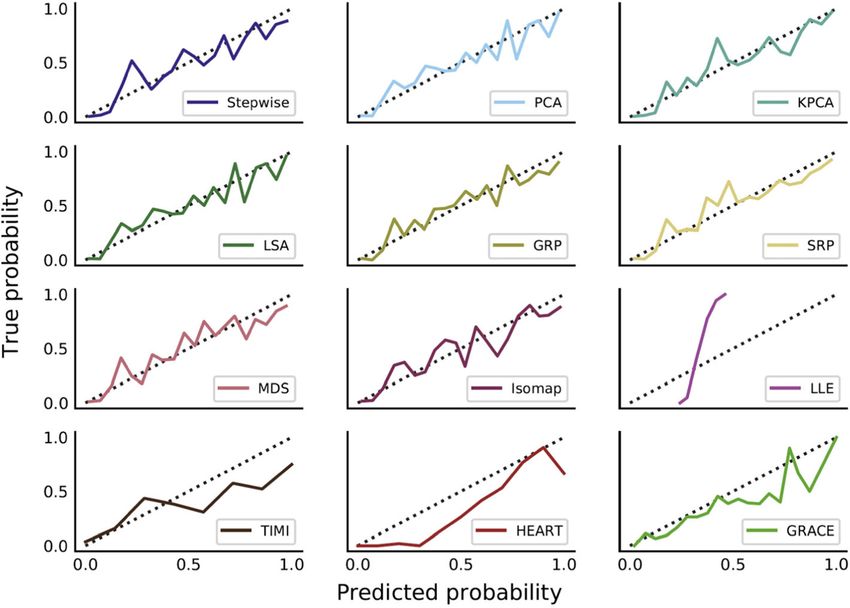
sures. Moreover, we generated the calibration plots for curves when d ≥ 15. The highest AUC values of PCA,
prediction models. In describing the data, we reported KPCA, LSA, GRP, SRP, MDS, Isomap, and LLE were
continuous variables as the median and interquartile 0.899, 0.896, 0.899, 0.896, 0.898, 0.901, 0.888, and 0.898,
range (IQR) and statistical significance using two-sample achieved with feature dimensions of 15, 30, 15, 22, 20,
t-test. We reported categorical variables as frequency 27, 23, and 30, respectively.
and percentage and statistical significance using chi- Figure 3 shows the ROC curves of the eight dimen-
square test. All analyses were conducted in Python ver- sionality reduction algorithms, the stepwise logistic re-
sion 3.8.0 (Python Software Foundation, Delaware, gression [28], and three clinical scores. All eight
USA). dimensionality reduction methods performed compar-
ably with the stepwise variable selection, and MDS
achieved the highest AUC of 0.901. Table 4 presents
Results ROC analysis results of all 12 methods/scores where
We included 795 chest pain patients in this study, of which sensitivity, specificity, PPV, and NPV are reported with
247 (31%) patients had MACE within 30 days of presenta- 95% confidence intervals (CIs), noting that the perform-
tion to the ED. Table 3 presents the baseline characteristics ance of the stepwise model in this paper was slightly dif-
of the patient cohort. Patients with MACE were older (me- ferent from that reported in [28] due to the choice of
dian age 61 years vs. 59 years, p = 0.035) and more likely to cross-validation scheme, i.e., 5-fold (AUC of 0.887) ver-
be male (76.1% vs. 64.6%, p = 0.002). History of diabetes, sus leave-one-out (AUC of 0.888). Figure 4 presents the
current smoking status, and pathological ECG changes calibration curves of predictions by all methods/scores.
such as ST elevation, ST depression, T wave inversion, The stepwise model and seven dimensionality reduction
pathological Q waves, and QTc prolongation were signifi- models (PCA, KPCA, LSA, GRP, SRP, MDS, and Iso-
cantly more prevalent in patients with the primary out- map) showed reasonable model calibrations, in which
come. Troponin-T and creatine kinase-MB levels were also their curves fluctuated along the diagonal line, meaning
significantly elevated in patients with the primary outcome. these models only slightly overestimated or underesti-
There was no statistically significant difference in patient mated the predicted probability of 30-day MACE. The
ethnicity between MACE and non-MACE groups. LLE model was unable to achieve good calibration. In
Figure 1a depicts the PCA-based predictive per- comparison, all three clinical scores (HEART, TIMI, and
formance versus the threshold P ~ (for preselection of GRACE) generally underpredicted the probability of 30-
variables) and Fig. 1b shows the number of prese- day MACE.
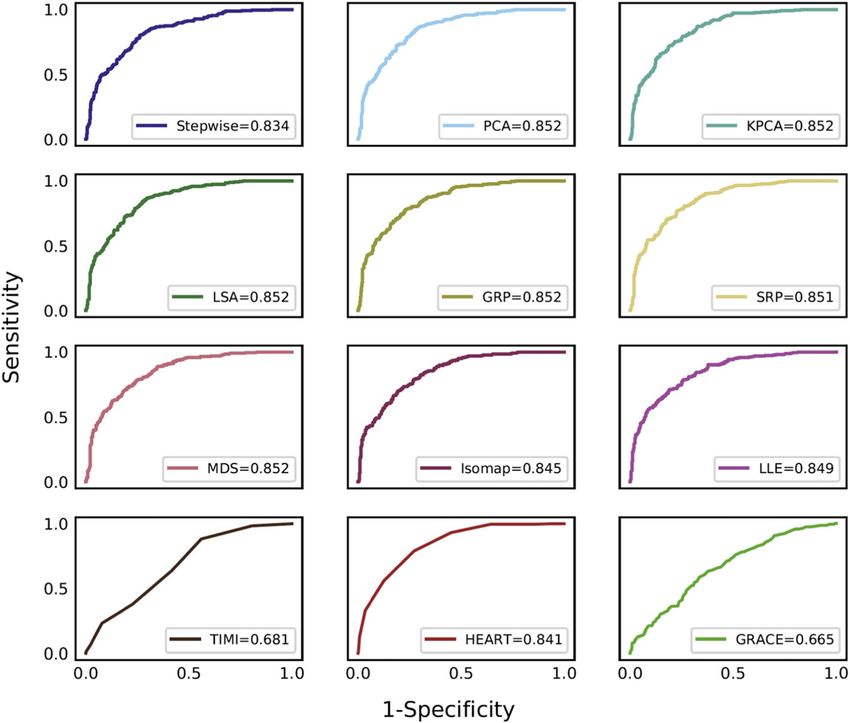
lected variables versus threshold P ~ . The predictive Figure 5 shows the ROC curves of prediction models
performance peaked at P ~ ¼ 0:02, where a total of 30 without using cardiac troponin. At feature dimensions of
variables were preselected, including gender, diastolic 13, 21, 13, 29, 24, 17, 18, and 18, the highest AUC values
blood pressure, pain score, ST-elevation, ST- of PCA, KPCA, LSA, GRP, SRP, MDS, Isomap, and LLE
depression, T-wave inversion, Q wave, cardiac history, were 0.852, 0.852, 0.852, 0.852, 0.851, 0.852, 0.845, and
EKG, and risk factor components of the HEART 0.849, respectively. The stepwise model without troponin
score, troponin, HRV RMSSD, HRV NN50, HRV yielded an AUC of 0.834 compared to 0.887 with tropo-
pNN50, HRV HF power, HRV Poincaré SD1, HR2V nin. All prediction models outperformed both the TIMI
RMSSD, HR2V NN50, HR2V pNN50, HR2V HF and GRACE scores while achieving comparable results
power, HR2V Poincaré SD1, HR2V1 RMSSD, HR2V1 with the HEART score.
NN50, HR2V1 HF power, HR2V1 Poincaré SD1, HR3V1
RMSSD, HR3V1 HF power, HR3V1 Poincaré SD1, HR3V2 Discussion
RMSSD, and HR3V2 Poincaré SD1. These were used as in- In this study, we showed that machine learning dimen-
puts to all dimensionality reduction algorithms whose out- sionality reduction yielded only marginal, non-significant
puts were linear or nonlinear combinations of these 30 improvements compared to stepwise model in predicting
variables. the risk of 30-day MACE among chest pain patients in
the ED. This corroborates with similar observations thatLiu et al. BMC Medical Research Methodology (2021) 21:74 Page 6 of 13
Table 3 Baseline characteristics of patient cohorts
Total (n = 795) MACE (n = 247) Non-MACE (n = 548) p-value
Age, median (IQR) 60 (51–68) 61 (54–68) 59 (50–68) 0.035
Male gender, n (%) 542 (68.2) 188 (76.1) 354 (64.6) 0.002
Race, n (%) 0.623
Chinese 492 (61.9) 159 (64.4) 333 (60.8) 0.374
Indian 129 (16.2) 34 (13.8) 95 (17.3) 0.246
Malay 150 (18.9) 46 (18.6) 104 (19.0) 0.984
Other 24 (3.0) 8 (3.2) 16 (2.9) 0.984
Vital signs, median (IQR)
Temperature (°C) 36.4 (36.0–36.7) 36.3 (36.0–36.7) 36.4 (36.0–36.7) 0.793
Heart rate (beats/min) 76 (67–89) 80 (69–92.5) 75 (66–87) 0.03
Respiratory rate (breaths/min) 18 (17–18) 18 (17–18) 18 (17–18) 0.716
Systolic blood pressure (mmHg) 138 (123.0–159.0) 142 (123.5–165.5) 137 (122.0–156.2) 0.037
Diastolic blood pressure (mmHg) 76.0 (68.0–86.0) 78.0 (70.0–89.0) 75.0 (67.0–84.0) 0.001
SpO2 (%) 99.0 (97.0–100.0) 99.0 (97.0–100.0) 99.0 (97.0–100.0) 0.842
Pain score 2.0 (0.0–5.0) 2.0 (0.0–5.0) 2.0 (0.0–5.0) 0.008
Glasgow Coma Scale (GCS) score 15.0 (15.0–15.0) 15.0 (15.0–15.0) 15.0 (15.0–15.0) 0.121
Medical history, n (%)
Ischaemic heart disease 343 (43.1) 115 (46.6) 228 (41.6) 0.22
Diabetes 278 (35.0) 106 (42.9) 172 (31.4) 0.002
Hypertension 509 (64.0) 161 (65.2) 348 (63.5) 0.707
Hypercholesterolaemia 476 (59.9) 151 (61.1) 325 (59.3) 0.683
Stroke 58 (7.3) 15 (6.1) 43 (7.8) 0.458
Cancer 29 (3.6) 7 (2.8) 22 (4.0) 0.537
Respiratory disease 31 (3.9) 5 (2.0) 26 (4.7) 0.102
Chronic kidney disease 87 (10.9) 26 (10.5) 61 (11.1) 0.896
Congestive heart failure 38 (4.8) 9 (3.6) 29 (5.3) 0.407
History of PCI 199 (25.0) 68 (27.5) 131 (23.9) 0.316
History of CABG 71 (8.9) 26 (10.5) 45 (8.2) 0.355
History of AMI 133 (16.7) 48 (19.4) 85 (15.5) 0.205
Active smoker 197 (24.8) 73 (29.6) 124 (22.6) 0.045
ECG pathology, n (%)
ST elevation 65 (8.2) 48 (19.4) 17 (3.1) < 0.001
ST depression 92 (11.6) 69 (27.9) 23 (4.2) < 0.001
T wave inversion 209 (26.3) 86 (34.8) 123 (22.4) < 0.001
Pathological Q wave 86 (10.8) 51 (20.6) 35 (6.4) < 0.001
QTc prolongation 174 (21.9) 73 (29.6) 101 (18.4) 0.001
Left axis deviation 64 (8.1) 16 (6.5) 48 (8.8) 0.34
Right axis deviation 16 (2.0) 6 (2.4) 10 (1.8) 0.773
Left bundle branch block 8 (1.0) 3 (1.2) 5 (0.9) 0.991
Right bundle branch block 56 (7.0) 14 (5.7) 42 (7.7) 0.385
Interventricular conduction delay 30 (3.8) 13 (5.3) 17 (3.1) 0.201
Left atrial abnormality 12 (1.5) 4 (1.6) 8 (1.5) 0.886
Left ventricular hypertrophy 103 (13.0) 38 (15.4) 65 (11.9) 0.21
Right ventricular hypertrophy 6 (0.8) 1 (0.4) 5 (0.9) 0.747Liu et al. BMC Medical Research Methodology (2021) 21:74 Page 7 of 13
Table 3 Baseline characteristics of patient cohorts (Continued)
Total (n = 795) MACE (n = 247) Non-MACE (n = 548) p-value
Laboratory findings, median (IQR)
Troponin (ng/L) 0 (0–39.5) 40 (10–170) 0 (0–15.2) < 0.001
Creatine kinase-MB 2.4 (1.8–3.2) 2.7 (2.1–6.0) 2.4 (1.7–2.7) < 0.001
Clinical scores, median (IQR)
HEART 5.0 (4.0 to 7.0) 7.0 (6.0 to 8.0) 4.0 (3.0 to 6.0) < 0.001
TIMI 2.0 (1.0 to 4.0) 3.0 (2.0 to 4.0) 2.0 (1.0 to 3.0) < 0.001
GRACE 104.0 (83.5 to 128.0) 119.0 (97.0 to 139.0) 98.0 (78.0 to 125.0) < 0.001
IQR interquartile range, MACE major adverse cardiac events, PCI percutaneous coronary intervention, CABG coronary artery bypass graft, AMI acute myocardial
infarction, HEART History, ECG, Age, Risk factors and Troponin, TIMI Thrombolysis in Myocardial Infarction, GRACE Global Registry of Acute Coronary Events
traditional statistical methods can perform comparably methods in risk prediction, while benefiting from model
to machine learning algorithms [52, 53]. Among the di- simplicity, transparency, and interpretability that are de-
mensionality reduction models integrated with cardiac sired in real-world clinical practice.
troponin, the MDS model had the highest discriminative High-dimensional data suffers from the curse of di-
performance (AUC of 0.901, 95% CI 0.874–0.928) but mensionality, which refers to the exponentially increas-
did not significantly outperformed the traditional step- ing sparsity of data and sample size required to estimate
wise model (AUC of 0.887, 95% CI 0.859–0.916). Among a function to a given accuracy as dimensionality in-
the models without using troponin, PCA, KPCA, LSA, creases [54]. Dimensionality reduction has successfully
GRP, and MDS performed equally well, achieving an mitigated the curse of dimensionality in the analysis of
AUC of 0.852, compared with the stepwise model with- high-dimensional data in various domains such as com-
out troponin which had an AUC of 0.834. In general, the putational biology and bioinformatics [31, 32]. However,
traditional stepwise approach was proved to be compar- clinical predictive modeling typically considers relatively
able to machine learning dimensionality reduction few features, limiting the effects of the curse of
Fig. 1 Variable preselection using p-value in univariable analysis for dimensionality reduction: a prediction area under the curve versus the p-
value, and (b) the number of preselected variables versus the p-valueLiu et al. BMC Medical Research Methodology (2021) 21:74 Page 8 of 13 Fig. 2 Prediction performance based on the eight dimensionality reduction algorithms versus the number of feature dimensions after reduction dimensionality. This may account for the relatively lim- models are constrained by complex algorithmic transfor- ited benefit of dimensionality reduction in our analysis. mations of variables, leading to obstacles in the adoption Additionally, with comparable performance to the of such models in real-world clinical settings. In con- traditional stepwise model, transparency and interpret- trast, traditional biostatistical approaches like logistic re- ability of machine learning dimensionality reduction gression with stepwise variable selection deliver a simple Fig. 3 ROC curves (based on the optimal number of dimensions) generated by the stepwise model, eight dimensionality reduction models, and three clinical scores
Liu et al. BMC Medical Research Methodology              (2021) 21:74                                                                                Page 9 of 13

Table 4 Comparison of performance of the HRnV models (based on 5-fold cross-validation), HEART, TIMI, and GRACE scores in
predicting 30-day major adverse cardiac events (MACE). The cut-off values were defined as the points nearest to the upper-left
corner on the ROC curves
                AUC (95% CI)               Cut-off       Sensitivity % (95% CI)          Specificity % (95% CI)          PPV % (95% CI)          NPV % (95% CI)
Stepwise        0.887 (0.859–0.916)        0.3140        79.4 (74.3–84.4)                78.8 (75.4–82.3)                62.8 (57.5–68.2)        89.4 (86.7–92.2)
PCA             0.899 (0.872–0.926)        0.2881        85.4 (81.0–89.8)                78.5 (75.0–81.9)                64.1 (59.0–69.3)        92.3 (89.9–94.7)
KPCA            0.896 (0.869–0.923)        0.3489        81.8 (77.0–86.6)                82.1 (78.9–85.3)                67.3 (62.0–72.6)        90.9 (88.4–93.4)
LSA             0.899 (0.872–0.926)        0.2884        85.4 (81.0–89.8)                78.6 (75.2–82.1)                64.3 (59.1–69.5)        92.3 (89.9–94.7)
GRP             0.896 (0.868–0.923)        0.2965        85.0 (80.6–89.5)                78.5 (75.0–81.9)                64.0 (58.8–69.2)        92.1 (89.6–94.5)
SRP             0.898 (0.871–0.925)        0.2940        84.6 (80.1–89.1)                79.6 (76.2–82.9)                65.1 (59.9–70.3)        92.0 (89.5–94.4)
MDS             0.901 (0.874–0.928)        0.3095        83.4 (78.8–88.0)                81.6 (78.3–84.8)                67.1 (61.8–72.4)        91.6 (89.1–94.1)
Isomap          0.888 (0.860–0.917)        0.3468        78.5 (73.4–83.7)                82.7 (79.5–85.8)                67.1 (61.7–72.5)        89.5 (86.9–92.2)
LLE             0.898 (0.870–0.925)        0.3140        85.0 (80.6–89.5)                79.4 (76.0–82.8)                65.0 (59.8–70.2)        92.2 (89.7–94.6)
HEART           0.841 (0.808–0.874)        5             78.9 (73.9–84.0)                72.8 (69.1–76.5)                56.7 (51.4–61.9)        88.5 (85.5–91.4)
TIMI            0.681 (0.639–0.723)        2             63.6 (57.6–69.6)                58.4 (54.3–62.5)                40.8 (35.9–45.7)        78.0 (74.0–82.1)
GRACE           0.665 (0.623–0.707)        107           64.0 (58.0–70.0)                60.8 (56.7–64.9)                42.4 (37.3–47.4)        78.9 (75.0–82.8)
AUC area under the curve, CI confidence interval, PPV positive predictive value, NPV negative predictive value, HEART History, ECG, Age, Risk factors and Troponin,
TIMI Thrombolysis in Myocardial Infarction, GRACE Global Registry of Acute Coronary Events

and transparent model, in which the absolute and rela-                              techniques to learn to create principal components in a
tive importance of each variable can be easily interpreted                          compressed data space, while MDS, Isomap, and LLE
and explained from the odds ratio. Marginal perform-                                are nonlinear, manifold learning-based dimensionality
ance improvements should be weighed against these lim-                              reduction methods. As observed from our results, com-
itations in interpretability, which is an important                                 plex nonlinear algorithms did not show an obvious ad-
consideration in clinical predictive modeling.                                      vantage over simple PCA and LSA methods in
   Comparing the eight dimensionality reduction algo-                               enhancing the predictive performance. Yet, nonlinear al-
rithms, PCA and LSA use common linear algebra                                       gorithms are more computationally complex and require

  Fig. 4 Calibration curves (based on the optimal number of dimensions) generated by the stepwise model, eight dimensionality reduction
  models, and three clinical scores
Liu et al. BMC Medical Research Methodology (2021) 21:74 Page 10 of 13
Fig. 5 ROC curves (based on the optimal number of dimensions) generated by the stepwise model, eight dimensionality reduction models, and
three clinical scores, where the prediction models were built without using cardiac troponin.s
more computing memory. For example, KPCA and Iso- address these difficulties, machine learning-based pre-
map have computational complexity of O(n3) and mem- dictive models that integrate HRV measures and clinical
ory complexity of O(n2), while PCA has computational parameters have been proposed [17, 22, 25, 26], includ-
complexity of OðD ~ 3 Þ and memory complexity of OðD ~ 2Þ ing our development of HRnV, a novel alternative meas-
[39]. In applications of clinical predictive modeling, n — ure to HRV that has shown promising results in
the number of patients — is usually larger than D ~ — predicting 30-day MACE [28], which was the stepwise
~ is model in this paper. Both the dimensionality reduction-
the number of variables; in our study, n is 795 and D
based predictive models and the stepwise model with
29 or 30, depending on the inclusion of troponin. This
troponin presented superior performance than HEART,
suggests that linear algorithms may be preferred due to
TIMI, and GRACE scores. When troponin was not used,
reduced computational complexity and memory while
several dimensionality reduction-based models such as
retaining comparable performance. Another observation
PCA, KPCA, and MDS still yielded marginally better
in this study was that the impact of preselection (as
performance than the original HEART score, while
shown in Fig. 1) on predictive performance was more
benefiting from generating the predictive scores in
substantial than that of dimensionality reduction, indi-
merely 5 to 6 min.
cating the importance of choosing statistically significant
Additionally, Table 4 shows that all HRnV-based pre-
candidate variables.
dictive models had higher specificities than the HEART
Our study also reiterates the value of HRnV-based
score while all HRnV-based models except Isomap also
prediction models for chest pain risk stratification.
improved on the already high sensitivity of the HEART
Among chest pain risk stratification tools in the ED,
score [21, 57]. The specificities of KPCA, Isomap, and
clinical scores like HEART, TIMI, and GRACE are cur-
MDS were significantly higher by an absolute value of al-
rently the most widely adopted and validated [55, 56].
most 10%. Substantial improvements to the specificity of
However, a common barrier to quick risk prediction
MACE predictive models may reduce unnecessary ad-
using these traditional clinical scores is the requirement
mission and thus minimize costs and resource usage [5].
of cardiac troponin, which can take hours to obtain. To
This is particularly relevant in low-resource settings, forLiu et al. BMC Medical Research Methodology (2021) 21:74 Page 11 of 13
example, the overburdened EDs in the current corona- suggest additional investigations such as exploring deep
virus disease 2019 (COVID-19) pandemic, where novel representations of the input variables and creating inter-
methods in resource allocation and risk stratification pretable machine learning models to facilitate real-world
could alleviate the strain on healthcare resources [58]. clinical implementation.
There remains a need for further investigation into
methods that utilize information from the full set of Abbreviations
ACS: Acute coronary syndrome; AMI: Acute myocardial infarction; AUC: Area
HRV and HRnV variables. From 174 variables in the ini- under the curve; ApEn: Approximate entropy; CI: Confidence intervals;
tial data set, dimensionality reduction performed the CABG: Coronary artery bypass graft; COVID-19: Coronavirus disease 2019;
best with a preselection of 30 variables, of which 19 were DFA: Detrended fluctuation analysis; ECG: Electrocardiogram; EHR: Electronic
health records; ED: Emergency department; GRP: Gaussian random
HRV and HRnV parameters. That is, the majority of the projection; GRACE: Global registry of acute coronary events; HRnV: Heart rate
newly constructed HRnV parameters were removed n-variability; HRV: Heart rate variability; HF: High frequency; HEART: History,
based on the strict significance threshold of p < 0.02 on ECG, Age, Risk factors, and initial Troponin; IQR: Interquartile range;
KPCA: Kernel principal component analysis; LSA: Latent semantic analysis;
univariable analysis. Therefore, novel HRnV measures LLE: Locally linear embedding; LF: Low frequency; MACE: Major adverse
were not fully used in prediction models of 30-day cardiac events; Mean NN: Average of R-R intervals; MDS: Multidimensional
MACE, leaving room for further investigation of alterna- scaling; NPV: Negative predictive value; NN50: The number of times that the
absolute difference between 2 successive R-R intervals exceeds 50 ms;
tive ways of using them. Moving forward, it may be valu- NN50n: The number of times that the absolute difference between 2
able to develop and evaluate deep learning frameworks successive RRnI/RRnIm sequences exceeds 50 × n ms; PACS: Patient acuity
[59] to synthesize novel low-dimensional representations category scale; PCI: Percutaneous coronary intervention; pNN50: NN50
divided by the total number of R-R intervals; pNN50n: NN50n divided by the
of multidimensional information. Alternatively, building total number of RRnI/RRnIm sequences; PPV: Positive predictive value;
point-based, interpretable risk scores [60] can also be PCA: Principal component analysis; ROC: Receiver operating characteristic;
beneficial to implementation and adoption in real-world RMSSD: Square root of the mean squared differences between R-R intervals;
RRI: R-R interval; SampEn: Sample entropy; SD: Standard deviation;
clinical settings, since designing inherently interpretable SDNN: Standard deviation of R-R intervals; SRP: Sparse random projection;
models is more favorable than explaining black box STEMI: ST-elevation myocardial infarction; TIMI: Thrombolysis in myocardial
models [61]. infarction; VLF: Very low frequency
We acknowledge the following limitations of this
study. First, the clinical application (i.e., risk stratification Acknowledgments
We would like to thank and acknowledge the contributions of doctors,
of ED chest pain patients) was only one example of clin- nurses, and clinical research coordinators from the Department of
ical predictive modeling, thus our conclusion on the ef- Emergency Medicine, Singapore General Hospital.
fectiveness of machine learning dimensionality reduction
algorithms may not be generalizable to other applica- Authors’ contributions
NL conceived the study and supervised the project. NL and MLC performed
tions, particularly those with a larger number of vari- the analyses and drafted the manuscript. NL, MLC, ZXK, SLL, AFWH, DG, and
ables. Second, only eight dimensionality reduction MEHO made substantial contributions to results interpretation and critical
algorithms were investigated, while many other methods revision of the manuscript. All authors read and approved the final
manuscript.
are available. Third, given the small sample size, we were
unable to determine the threshold P ~ and build predictive
Funding
models with a separate training set; this also limited the This work was supported by the Duke-NUS Signature Research Programme
stability check [62] for both logistic regression and ma- funded by the Ministry of Health, Singapore. The funder of the study had no
role in study design, data collection, data analysis, data interpretation, or writ-
chine learning models. Last, we did not build a workable ing of the report.
predictive model for risk stratification of ED chest pain
patients, although several models built in this study Availability of data and materials
showed promising results compared to existing clinical The datasets used and/or analyzed during the current study are available
from the corresponding author on reasonable request.
scores. We aim to conduct further investigations.
Declarations
Conclusions Ethics approval and consent to participate
In this study we found that machine learning dimension- The ethical approval was obtained from the Centralized Institutional Review
Board (CIRB, Ref: 2014/584/C) of SingHealth, in which patient consent was
ality reduction models showed marginal value in im- waived.
proving the prediction of 30-day MACE for ED chest
pain patients. Being black box models, they are further Consent for publication
constrained in clinical practice due to low interpretabil- Not applicable.
ity. Whereas traditional stepwise prediction model
showed simplicity and transparency, making it feasible Competing interests
NL and MEHO hold patents related to using heart rate variability and artificial
for clinical use. To fully utilize the available information intelligence for medical monitoring. NL, ZXK, DG, and MEHO are advisers to
in building high-performing predictive models, we TIIM SG. The other authors report no conflicts.Liu et al. BMC Medical Research Methodology (2021) 21:74 Page 12 of 13
Author details in the emergency department. Crit Path Cardiol. 2016;15(1):1–5. https://doi.
1
Duke-NUS Medical School, National University of Singapore, Singapore, org/10.1097/HPC.0000000000000066.
Singapore. 2Health Services Research Centre, Singapore Health Services, 16. Poldervaart JM, Langedijk M, Backus BE, Dekker IMC, Six AJ, Doevendans PA,
Singapore, Singapore. 3Institute of Data Science, National University of et al. Comparison of the GRACE, HEART and TIMI score to predict major
Singapore, Singapore, Singapore. 4Faculty of Medicine, Nursing and Health adverse cardiac events in chest pain patients at the emergency department.
Sciences, Monash University, Melbourne, Australia. 5Department of Int J Cardiol. 2017;227:656–61. https://doi.org/10.1016/j.ijcard.2016.10.080.
Emergency Medicine, Singapore General Hospital, Singapore, Singapore. 17. Sakamoto JT, Liu N, Koh ZX, Guo D, Heldeweg MLA, Ng JCJ, et al.
6
SingHealth Duke-NUS Emergency Medicine Academic Clinical Programme, Integrating heart rate variability, vital signs, electrocardiogram, and troponin
Singapore, Singapore. to triage chest pain patients in the ED. Am J Emerg Med. 2018;36(2):185–92.
18. Engel J, Heeren MJ, van der Wulp I, de Bruijne MC, Wagner C.
Received: 14 July 2020 Accepted: 5 April 2021 Understanding factors that influence the use of risk scoring instruments in
the management of patients with unstable angina or non-ST-elevation
myocardial infarction in the Netherlands: a qualitative study of health care
practitioners' perceptions. BMC Health Serv Res. 2014;14(1):418. https://doi.
References org/10.1186/1472-6963-14-418.
1. Long B, Koyfman A. Best clinical practice: current controversies in evaluation 19. Wu WK, Yiadom MY, Collins SP, Self WH, Monahan K. Documentation of
of low-risk chest pain-part 1. J Emerg Med. 2016;51(6):668–76. https://doi. HEART score discordance between emergency physician and cardiologist
org/10.1016/j.jemermed.2016.07.103. evaluations of ED patients with chest pain. Am J Emerg Med. 2017;35(1):
2. Long B, Koyfman A. Best clinical practice: current controversies in the 132–5. https://doi.org/10.1016/j.ajem.2016.09.058.
evaluation of low-risk chest pain with risk stratification aids. Part 2. J Emerg 20. Ras M, Reitsma JB, Hoes AW, Six AJ, Poldervaart JM. Secondary analysis of
Med. 2017;52(1):43–51. https://doi.org/10.1016/j.jemermed.2016.07.004. frequency, circumstances and consequences of calculation errors of the
3. Januzzi JL Jr, McCarthy CP. Evaluating chest pain in the emergency HEART (history, ECG, age, risk factors and troponin) score at the emergency
department: searching for the optimal gatekeeper. J Am Coll Cardiol. 2018; departments of nine hospitals in the Netherlands. BMJ Open. 2017;7(10):
71(6):617–9. https://doi.org/10.1016/j.jacc.2017.11.065. e017259. https://doi.org/10.1136/bmjopen-2017-017259.
4. Pope JH, Aufderheide TP, Ruthazer R, Woolard RH, Feldman JA, Beshansky 21. Laureano-Phillips J, Robinson RD, Aryal S, Blair S, Wilson D, Boyd K, et al.
JR, et al. Missed diagnoses of acute cardiac ischemia in the emergency HEART score risk stratification of low-risk chest pain patients in the
department. N Engl J Med. 2000;342(16):1163–70. https://doi.org/10.1056/ emergency department: a systematic review and meta-analysis. Ann Emerg
NEJM200004203421603. Med. 2019;74(2):187–203. https://doi.org/10.1016/j.annemergmed.2018.12.01
5. Hollander JE, Than M, Mueller C. State-of-the-art evaluation of emergency 0.
department patients presenting with potential acute coronary syndromes. 22. Ong MEH, Goh K, Fook-Chong S, Haaland B, Wai KL, Koh ZX, et al. Heart rate
Circulation. 2016;134(7):547–64. https://doi.org/10.1161/CIRCULATIONAHA.11 variability risk score for prediction of acute cardiac complications in ED
6.021886. patients with chest pain. Am J Emerg Med. 2013;31(8):1201–7. https://doi.
6. Antman EM, Cohen M, Bernink PJ, McCabe CH, Horacek T, Papuchis G, et al. org/10.1016/j.ajem.2013.05.005.
The TIMI risk score for unstable angina/non-ST elevation MI: a method for 23. Rajendra Acharya U, Paul Joseph K, Kannathal N, Lim CM, Suri JS. Heart rate
prognostication and therapeutic decision making. JAMA. 2000;284(7):835– variability: a review. Med Biol Eng Comput. 2006;44(12):1031–51. https://doi.
42. https://doi.org/10.1001/jama.284.7.835. org/10.1007/s11517-006-0119-0.
7. Morrow DA, Antman EM, Charlesworth A, Cairns R, Murphy SA, de Lemos 24. Liu N, Koh ZX, Chua ECP, Tan LML, Lin Z, Mirza B, et al. Risk scoring for
JA, et al. TIMI risk score for ST-elevation myocardial infarction: a convenient, prediction of acute cardiac complications from imbalanced clinical data.
bedside, clinical score for risk assessment at presentation: an intravenous IEEE J Biomed Health Inform. 2014;18(6):1894–902. https://doi.org/10.1109/
nPA for treatment of infarcting myocardium early II trial substudy. JBHI.2014.2303481.
Circulation. 2000;102(17):2031–7. https://doi.org/10.1161/01.CIR.102.17.2031. 25. Liu N, Lin Z, Cao J, Koh ZX, Zhang T, Huang G-B, et al. An intelligent scoring
8. Fox KA, Dabbous OH, Goldberg RJ, Pieper KS, Eagle KA, Van de Werf F, et al. system and its application to cardiac arrest prediction. IEEE Trans Inf
Prediction of risk of death and myocardial infarction in the six months after Technol Biomed. 2012;16(6):1324–31. https://doi.org/10.1109/TITB.2
presentation with acute coronary syndrome: prospective multinational 012.2212448.
observational study (GRACE). BMJ (Clinical research ed). 2006;333(7578):1091. 26. Heldeweg ML, Liu N, Koh ZX, Fook-Chong S, Lye WK, Harms M, et al. A
9. Six AJ, Backus BE, Kelder JC. Chest pain in the emergency room: value of novel cardiovascular risk stratification model incorporating ECG and heart
the HEART score. Neth Hear J. 2008;16(6):191–6. https://doi.org/10.1007/ rate variability for patients presenting to the emergency department with
BF03086144. chest pain. Crit Care. 2016;20(1):179. https://doi.org/10.1186/s13054-016-13
10. Backus BE, Six AJ, Kelder JC, Bosschaert MA, Mast EG, Mosterd A, et al. A 67-5.
prospective validation of the HEART score for chest pain patients at the 27. Liu N, Koh ZX, Goh J, Lin Z, Haaland B, Ting BP, et al. Prediction of adverse
emergency department. Int J Cardiol. 2013;168(3):2153–8. https://doi.org/1 cardiac events in emergency department patients with chest pain using
0.1016/j.ijcard.2013.01.255. machine learning for variable selection. BMC Med Inform Decis Mak. 2014;
11. Six AJ, Cullen L, Backus BE, Greenslade J, Parsonage W, Aldous S, et al. The 14(1):75. https://doi.org/10.1186/1472-6947-14-75.
HEART score for the assessment of patients with chest pain in the 28. Liu N, Guo D, Koh ZX, Ho AFW, Xie F, Tagami T, et al. Heart rate n-variability
emergency department: a multinational validation study. Crit Path Cardiol. (HRnV) and its application to risk stratification of chest pain patients in the
2013;12(3):121–6. https://doi.org/10.1097/HPC.0b013e31828b327e. emergency department. BMC Cardiovasc Disord. 2020;20(1):168. https://doi.
12. Chen X-H, Jiang H-L, Li Y-M, Chan CPY, Mo J-R, Tian C-W, et al. Prognostic org/10.1186/s12872-020-01455-8.
values of 4 risk scores in Chinese patients with chest pain: prospective 2- 29. Meloun M, Militký J, Hill M, Brereton RG. Crucial problems in regression
Centre cohort study. Medicine. 2016;95(52):e4778. https://doi.org/10.1097/ modelling and their solutions. Analyst. 2002;127(4):433–50. https://doi.org/1
MD.0000000000004778. 0.1039/b110779h.
13. Jain T, Nowak R, Hudson M, Frisoli T, Jacobsen G, McCord J. Short- and 30. Dormann CF, Elith J, Bacher S, Buchmann C, Carl G, Carré G, et al.
Long-term prognostic utility of the HEART score in patients evaluated in the Collinearity: a review of methods to deal with it and a simulation study
emergency Department for Possible Acute Coronary Syndrome. Crit Path evaluating their performance. Ecography. 2013;36(1):27–46. https://doi.org/1
Cardiol. 2016;15(2):40–5. https://doi.org/10.1097/HPC.0000000000000070. 0.1111/j.1600-0587.2012.07348.x.
14. Sakamoto JT, Liu N, Koh ZX, Fung NX, Heldeweg ML, Ng JC, et al. 31. Gui J, Andrew AS, Andrews P, Nelson HM, Kelsey KT, Karagas MR, et al. A
Comparing HEART, TIMI, and GRACE scores for prediction of 30-day major robust multifactor dimensionality reduction method for detecting gene-
adverse cardiac events in high acuity chest pain patients in the emergency gene interactions with application to the genetic analysis of bladder Cancer
department. Int J Cardiol. 2016;221:759–64. https://doi.org/10.1016/j.ijcard.2 susceptibility. Ann Hum Genet. 2011;75(1):20–8. https://doi.org/10.1111/j.14
016.07.147. 69-1809.2010.00624.x.
15. Sun BC, Laurie A, Fu R, Ferencik M, Shapiro M, Lindsell CJ, et al. Comparison 32. Ritchie MD, Hahn LW, Roodi N, Bailey LR, Dupont WD, Parl FF, et al.
of the HEART and TIMI risk scores for suspected acute coronary syndrome Multifactor-dimensionality reduction reveals high-order interactions amongLiu et al. BMC Medical Research Methodology (2021) 21:74 Page 13 of 13
estrogen-metabolism genes in sporadic breast Cancer. Am J Hum Genet. 55. D'Ascenzo F, Biondi-Zoccai G, Moretti C, Bollati M, Omedè P, Sciuto F, et al.
2001;69(1):138–47. https://doi.org/10.1086/321276. TIMI, GRACE and alternative risk scores in acute coronary syndromes: a
33. Akhbardeh A, Jacobs MA. Comparative analysis of nonlinear dimensionality meta-analysis of 40 derivation studies on 216,552 patients and of 42
reduction techniques for breast MRI segmentation. Med Phys. 2012;39(4): validation studies on 31,625 patients. Contemp Clin Trials. 2012;33(3):507–14.
2275–89. https://doi.org/10.1118/1.3682173. https://doi.org/10.1016/j.cct.2012.01.001.
34. Balvay D, Kachenoura N, Espinoza S, Thomassin-Naggara I, Fournier LS, 56. Liu N, Ng JCJ, Ting CE, Sakamoto JT, Ho AFW, Koh ZX, et al. Clinical scores
Clement O, et al. Signal-to-noise ratio improvement in dynamic contrast- for risk stratification of chest pain patients in the emergency department:
enhanced CT and MR imaging with automated principal component an updated systematic review. J Emerg Crit Care Med. 2018;2:16.
analysis filtering. Radiology. 2011;258(2):435–45. https://doi.org/10.1148/ra 57. Byrne C, Toarta C, Backus B, Holt T. The HEART score in predicting major
diol.10100231. adverse cardiac events in patients presenting to the emergency department
35. Tarvainen MP, Cornforth DJ, Jelinek HF. Principal component analysis of with possible acute coronary syndrome: protocol for a systematic review
heart rate variability data in assessing cardiac autonomic neuropathy. In: and meta-analysis. Syst Rev. 2018;7(1):148.
2014 36th Annual International Conference of the IEEE Engineering in 58. Liu N, Chee ML, Niu C, Pek PP, Siddiqui FJ, Ansah JP, et al. Coronavirus
Medicine and Biology Society; 2014. p. 6667–70. disease 2019 (COVID-19): an evidence map of medical literature. BMC Med
36. Vest AN, Da Poian G, Li Q, Liu C, Nemati S, Shah AJ, et al. An open source Res Methodol. 2020;20(1):177. https://doi.org/10.1186/s12874-020-01059-y.
benchmarked toolbox for cardiovascular waveform and interval analysis. 59. Xie J, Girshick R, Farhadi A. Unsupervised deep embedding for clustering
Physiol Meas. 2018;39(10):105004. https://doi.org/10.1088/1361-6579/aae021. analysis. In: Proceedings of the 33rd international conference on
37. Maimon O, Rokach L. Data mining and knowledge discovery handbook. international conference on machine learning - volume 48. New York: JMLR.
Berlin: Springer Publishing Company, Incorporated; 2010. https://doi.org/1 org; 2016. p. 478–87.
0.1007/978-0-387-09823-4. 60. Xie F, Chakraborty B, Ong MEH, Goldstein BA, Liu N. AutoScore: a machine
38. Zhang Z. Variable selection with stepwise and best subset approaches. Ann learning-based automatic clinical score generator and its application to
Transl Med. 2016;4(7):136. https://doi.org/10.21037/atm.2016.03.35. mortality prediction using electronic health records. JMIR Med Inform. 2020;
39. van der Maaten LJP, Postma EO, van den Herik HJ. Dimensionality 21798.
Reduction: A Comparative Review. In: Tilburg University Technical Report 61. Rudin C. Stop explaining black box machine learning models for high
TiCC-TR 2009–005. Tilburg: Tilburg University; 2009. stakes decisions and use interpretable models instead. Nat Machine
40. Nguyen LH, Holmes S. Ten quick tips for effective dimensionality reduction. Intelligence. 2019;1(5):206–15. https://doi.org/10.1038/s42256-019-0048-x.
PLoS Comput Biol. 2019;15(6):e1006907. https://doi.org/10.1371/journal. 62. Heinze G, Wallisch C, Dunkler D. Variable selection – a review and
pcbi.1006907. recommendations for the practicing statistician. Biom J. 2018;60(3):431–49.
41. Liu N, Wang H. Weighted principal component extraction with genetic https://doi.org/10.1002/bimj.201700067.
algorithms. Appl Soft Comput. 2012;12(2):961–74. https://doi.org/10.1016/j.a
soc.2011.08.030. Publisher’s Note
42. Pan Y, Ge SS, Al Mamun A. Weighted locally linear embedding for Springer Nature remains neutral with regard to jurisdictional claims in
dimension reduction. Pattern Recogn. 2009;42(5):798–811. https://doi.org/1 published maps and institutional affiliations.
0.1016/j.patcog.2008.08.024.
43. Artoni F, Delorme A, Makeig S. Applying dimension reduction to EEG data
by principal component analysis reduces the quality of its subsequent
independent component decomposition. Neuroimage. 2018;175:176–87.
https://doi.org/10.1016/j.neuroimage.2018.03.016.
44. Diamantaras KI, Kung SY. Principal component neural networks: theory and
applications. New Jersey: Wiley; 1996.
45. Schölkopf B, Smola AJ, Müller KR. Kernel principal component analysis. In:
Advances in kernel methods: support vector learning. Cambridge: MIT Press;
1999. p. 327–52.
46. Landauer TK, Foltz PW, Laham D. An introduction to latent semantic
analysis. Discourse Process. 1998;25(2–3):259–84. https://doi.org/10.1080/01
638539809545028.
47. Dasgupta S. Experiments with random projection. In: Proceedings of the
sixteenth conference on uncertainty in artificial intelligence. Stanford:
Morgan Kaufmann Publishers Inc; 2000. p. 143–51.
48. Li P, Hastie TJ, Church KW. Very sparse random projections. In: Proceedings
of the 12th ACM SIGKDD international conference on knowledge discovery
and data mining. Philadelphia: Association for Computing Machinery; 2006.
p. 287–96.
49. Mead A. Review of the development of multidimensional scaling methods.
J Royal Stat Soc Ser D (The Statistician). 1992;41(1):27–39.
50. Tenenbaum JB, de Silva V, Langford JC. A global geometric framework for
nonlinear dimensionality reduction. Science (New York, NY). 2000;290(5500):
2319–23.
51. Roweis ST, Saul LK. Nonlinear dimensionality reduction by locally linear
embedding. Science (New York, NY). 2000;290(5500):2323–6.
52. Gravesteijn BY, Nieboer D, Ercole A, Lingsma HF, Nelson D, van Calster B,
et al. Machine learning algorithms performed no better than regression
models for prognostication in traumatic brain injury. J Clin Epidemiol. 2020;
122:95–107. https://doi.org/10.1016/j.jclinepi.2020.03.005.
53. Nusinovici S, Tham YC, Chak Yan MY, Wei Ting DS, Li J, Sabanayagam C,
et al. Logistic regression was as good as machine learning for predicting
major chronic diseases. J Clin Epidemiol. 2020;122:56–69. https://doi.org/10.1
016/j.jclinepi.2020.03.002.
54. Lee JA, Verleysen M. Nonlinear dimensionality reduction. New York:
Springer; 2007. https://doi.org/10.1007/978-0-387-39351-3.You can also read