SCIENCEDIRECT - BIRKBECK ...
←
→
Page content transcription
If your browser does not render page correctly, please read the page content below
c o r t e x 1 1 1 ( 2 0 1 9 ) 7 4 e8 6

                                              Available online at www.sciencedirect.com

                                                           ScienceDirect
                                          Journal homepage: www.elsevier.com/locate/cortex

Research Report

Distortions of perceived volume and length of body
parts

Renata Sadibolova a,*, Elisa R. Ferre b, Sally A. Linkenauger c and
Matthew R. Longo a
a
  Department of Psychological Sciences, Birkbeck, University of London, United Kingdom
b
  Department of Psychology, Royal Holloway, University of London, United Kingdom
c
  Department of Psychology, Lancaster University, United Kingdom

article info                                 abstract

Article history:                             We experience our body as a 3D, volumetric object in the world. Measures of our conscious
Received 20 May 2018                         body image, in contrast, have investigated the perception of body size along one or two
Reviewed 18 July 2018                        dimensions at a time. There is, thus, a discrepancy between existing methods for
Revised 14 August 2018                       measuring body image and our subjective experience of having 3D body. Here we assessed
Accepted 13 October 2018                     in a sample of healthy adults the perception of body size in terms of its 1D length and 3D
Published online 1 November 2018             volume. Participants were randomly assigned to two groups using different measuring
                                             units (other body part and non-body object). They estimated how many units would fit in a
Keywords:                                    perceived size of body segments and the whole body. The patterns of length and volume
Body image                                   misperception across judged segments were determined as their perceived size propor-
3D body                                      tional to their actual size. The pattern of volume misperception paints the representation
Body size perception                         of 3D body proportions resembling those of a somatosensory homunculus. The body parts
Body proportions                             with a smaller actual surface area relative to their volume were underestimated more.
Surface area to volume ratio                 There was a tendency for body parts underestimated in volume to be overestimated in
                                             length. Perceived body proportions thus changed as a function of judgement type while
                                             showing a similarity in magnitude of the absolute estimation error, be it an underesti-
                                             mation of volume or overestimation of length. The main contribution of this study is
                                             assessing the body image as a 3D body representation, and thus extending beyond the
                                             conventional ‘allocentric’ focus to include the body on the inside. Our findings highlight
                                             the value of studying the perceptual distortions “at the baseline”, i.e., in healthy popula-
                                             tion, so as to advance the understanding of the nature of perceptual distortions in clinical
                                             conditions.
                                             © 2018 The Authors. Published by Elsevier Ltd. This is an open access article under the CC
                                                                                     BY license (http://creativecommons.org/licenses/by/4.0/).

 * Corresponding author. Department of Psychological Sciences, Birkbeck, University of London, Malet Street, London, WC1E 7HX, United
Kingdom.
   E-mail address: sadibolovar@gmail.com (R. Sadibolova).
https://doi.org/10.1016/j.cortex.2018.10.016
0010-9452/© 2018 The Authors. Published by Elsevier Ltd. This is an open access article under the CC BY license (http://creativecommons.
org/licenses/by/4.0/).
c o r t e x 1 1 1 ( 2 0 1 9 ) 7 4 e8 6                                           75

                                                                           (Linkenauger et al., 2015, 2017; Longo & Haggard, 2012;
1.      Introduction                                                       Reitman & Cleveland, 1964; Slade, 1985), or circumference
                                                                           judgements (Horne, Van Vactor, & Emerson, 1991; Mo       € lbert
Distortions of the body image are central to several serious
                                                                           et al., 2016; Salbach, Klinkowski, Pfeiffer, Lehmkuhl, &
diseases, including eating disorders (Cash & Deagle, 1997) and
                                                                           Korte, 2007; Schneider, Frieler, Pfeiffer, Lehmkuhl, &
body dysmorphic disorder (Phillips, Didie, Feusner, &
                                                                           Salbach-Andrae, 2009).
Wilhelm, 2008). Indeed, since the seminal work of Bruch
                                                                               To our knowledge, no studies have looked into what the
(1978) perceptual distortions of body image have been
                                                                           mental image of our 3D body is like and how it may deviate
considered central to the aetiology of anorexia nervosa.
                                                                           from the actual 3D body form. This may seem surprising
Conversely, the body image in healthy individuals was
                                                                           given our experience of having 3D bodies; however, the rea-
assumed to be highly accurateeif not infallible, and as such it
                                                                           sons become clear once the importance of the visual
was used as a standard in early studies to interpret body size
                                                                           component in body size assessment is considered. Indeed,
misperceptions, e.g., in anorexic or obese patients (Bell,
                                                                           the term ‘body image’ itself suggests predominantly visual
Kirkpatrick, & Rinn, 1986). Calling this assumption into ques-
                                                                           representation of a conscious body shape and size, akin to a
tion, recent evidence showed systematic distortions of body
                                                                           2D photograph of what we look like and how other people see
representation in healthy cognition. The understanding of
                                                                           us in a manner not dissimilar from other visual objects in the
these neurotypical distortions may shed more light on the
                                                                           environment. In addition to our ability to assess it as if
perceptual distortions in clinical conditions (Longo, 2015,
                                                                           viewed from the outside, the body is however also perceived
2017). One particularly interesting recent finding was that
                                                                           ‘from the inside’. This internal access, clearly unavailable for
the body image distortions in healthy individuals appear to be
                                                                           other objects, comes with additional sources of information
linked to homuncular distortions in primary somatosensory
                                                                           including touch, proprioception, and interoception.
cortex (SI) (Linkenauger et al., 2015; Longo & Haggard, 2012).
                                                                           Although these senses may not appear as informative as
Here we aimed to replicate these observations, and to address
                                                                           vision in perceptual assessment of body size, recent research
an important limitation of this research and of the work on
                                                                           has validated their relevance. For instance, Longo and
perceptual body image in general. Traditional methods of
                                                                           Haggard (2012) reported a dissociation between depictive
body size perception in patients and healthy individuals alike
                                                                           and metric methods in judgements of hand size, with the
come short of assessing our experience of having a 3D volu-
                                                                           metric measurements showing distortions qualitatively
metric body of a certain size. We addressed this limitation by
                                                                           similar to those of a somatosensory representation (Longo,
investigating the representation of body volume in healthy
                                                                           2017; Longo & Haggard, 2012), while the performance was
cognition. Analogous to the functional role of cortical
                                                                           nearly veridical in the visual template-matching task. They
magnification in SI, we also set out to investigate if body part's
                                                                           suggested that the metric assessment did not involve the
surface area relative to its volume (SA/VO), i.e., the proportion
                                                                           visual body representations alone but some weighted com-
of its 3D size at interface with the outer world, predicted the
                                                                           bination of the visual and (distorted) somatosensory body
perception of volumetric size.
                                                                           representations.
    A large literature going back several decades has investi-
                                                                               In another study, Linkenauger et al. (2015) asked partic-
gated perceptual body size estimation, largely in the context
                                                                           ipants to judge the length of body segments or of the whole
of eating disorders such as anorexia and obesity. A number of
                                                                           body in units of the length of other body part (e.g., hand) or
paradigms for body size estimation have been developed,
                                                                           a non-body object (dowel). This assessment involved esti-
which Longo and Haggard (2012) grouped into two broad
                                                                           mating how many measuring units would fit in a size of a
families. Depictive methods involve comparing the experi-
                                                                           judged body segment, or, to put it differently, by how much
ence of one's own body with a visual image of a body, and
                                                                           the body segment differed in size relative to the measuring
include tasks such as the distorting mirror (Traub & Orbach,
                                                                           unit. Linkenauger et al. (2015) found a robust pattern of
1964), the distorted photograph technique (Glucksman &
                                                                           length mis-estimation, which suggested that some body
Hirsch, 1969), video distortion (Probst, Vandereycken, Van
                                                                           parts such as torso and arms were misperceived as longer
Coppenolle, & Pieters, 1998), and template matching
                                                                           more than others like the head and leg for instance.
(Gandevia & Phegan, 1999). Metric methods, in contrast,
                                                                           Notably, for judgements in body units, the pattern of
involve comparing the experienced size of one's own body to
                                                                           misperception was predicted by the segment's actual size
a physical length, and include tasks such as the moving
                                                                           and tactile spatial sensitivity. Body parts which are under-
caliper (Slade & Russell, 1973), the image marking procedure
                                                                           represented in primary somatosensory cortex (SI), i.e.,
(Askevold, 1975), and the adjustable light beam apparatus
                                                                           showing reduced tactile spatial sensitivity (Mancini et al.,
(Thompson & Spana, 1988). Depictive methods thus involve
                                                                           2014; Weinstein, 1968), were more overestimated in
comparing our body to a 2D image, while metric methods
                                                                           length, particularly if they were small in their actual size.
involve comparing our body to a 1D standard. The body size
                                                                           Based on these findings, the authors developed a ‘reverse
is not assessed in all three dimensions when judged with
                                                                           distortion’ theory whereby the distortions of body image
reference to 2D images (Benson, Emery, Cohen-Tove           e, &
                                                                           were of compensatory nature to those of the distorted so-
Tove e, 1999; Cafri & Thompson, 2004; Gandevia & Phegan,
                                                                           matosensory maps (Penfield & Boldrey, 1937; Penfield &
1999; Traub & Orbach, 1964; Walsh, Hoad, Rothwell,
                                                                           Rasmussen, 1950), alleviating thus the negative impact of
Gandevia, & Haggard, 2015). Similarly, metric methods
                                                                           the latter on somatoperception.
come short of assessing the 3D body size given their focus on
                                                                               In this study, we aimed to fill the gap in existing body
one dimension at a time, e.g., in width or length judgements
                                                                           image literature, by assessing the experience of our body in
76 c o r t e x 1 1 1 ( 2 0 1 9 ) 7 4 e8 6
terms of a perceived volume of 3D space contained by the
skin on the body surface. We adapted the paradigm devel-
2. Method
oped by Linkenauger et al. (2015; 2017) by asking participants,
2.1. Participants
in addition to their length estimates, for judgements of the
volume of body segments in units of a volume of their hand
Forty individuals were randomly assigned to either the Object
(body units) or an object (non-body units). An important
Standard group (8 females/12 males, Mean age ± SD:
novel aspect of this study therefore is the inclusion of the
32.75 ± 9.78 years) or the Hand Standard group (10 females, 10
inside of the body, i.e., body's volumetric substance, rather
males, 28.41 ± 5.79 years). Mean ± SD of body mass index was
than just its superficial exterior. Judging, for instance, how
23.95 ± 4.24. Participants in both groups were predominantly
many volumes of a finger fit in a volume of the foot, may
right handed, as assessed by the Edinburgh Handedness In-
require partitioning in one's mind the volume of the foot into
ventory (Oldfield, 1971; Mean ± SD: 89.1 ± 34.4 in the Object
smaller parts, and thus a mental image of the volumetric
Standard group and 85.8 ± 33.1 in the Hand Standard group). All
body. To put it another way, these judgements are expected
procedures were approved by the Department of Psychologi-
to extend the typical allocentric assessment of perceived
cal Sciences Research Ethics Committee at Birkbeck, Univer-
body dimensions common in the body image literature, by
sity of London.
probing the representation of 3D space that our bodies
The average effect size (h2p) for differences in length esti-
occupy. This has implications for relating the somatosensory
mation across body parts in previous studies was .3
body representation and body image the way Linkenauger
(Linkenauger's et al., 2015). A sample of 14 participants, as
et al. (2015) did. While the body in SI is two-dimensional,
determined in a G*Power software (Faul, Erdfelder, Lang, &
reflecting the two-dimensionality of the skin, the body vol-
Buchner, 2007), would be large enough for this effect to be
ume is unlikely to be represented in SI since it is given by the
detected with a power of .95 at alpha level .05. Given that the
volume of a musculo-skeletal body structure, its internal
perception of body volume has not yet been investigated, we
organs, and other tissue and liquids. The actual surface area
determined the sample size for a small effect (h2p ¼ .1), using
is not linearly related to volume across body segments
the same alpha level and power parameters. Our analysis
(Tikuisis, Meunier, & Jubenville, 2001) due to differences in
shows that a sample of forty participants, in a repeated-
their 3D shape and size. Mathematically, a sphere (e.g., the
measures design with two groups and six body parts to esti-
head) would have a smaller surface area than a truncated
mate, would be appropriately powered to find an effect of this
cone (e.g., the forearm) even if their volume was identical,
magnitude.
and the increase in surface area relative to volume with an
increasing object size is a power function (Schmidt-Nielsen,
2.2. Stimuli, design and procedure
1984).
The literature, however, suggests that the body image is
The experiment began by measuring the length and volume of
related to both, the somatosensory representation and the
the participant's right hand and foot while they were blind-
awareness of interoceptive sensations from within the body.
folded. The lengths were measured with a ruler while the body
A recent review of the literature implicates the sensations
part rested flat on a sheet of a foamboard. Participants were
generated by internal organs in a formation of body image
seated and they did not wear shoes or garments on the
(Badoud & Tsakiris, 2017). Intriguingly, it has been reported
measured body part (e.g., gloves, socks). The volume of each
that patients with eating disorders show impaired tactile
body part was measured using the water displacement
processing (Keizer et al., 2011; Keizer, Smeets, Dijkerman,
method (WDM). The proximal boundary of the hand was the
van Elburg, & Postma, 2012) as well as reduced interocep-
centre of the ulnar styloid process, which was marked with a
tive awareness (Pollatos et al., 2008; Santel, Baving, Krauel,
pen. The proximal boundary of the foot was the centre of the
Münte, & Rotte, 2006). Notably, in healthy individuals,
lateral malleolus, which was also marked. Each body part was
interoceptive sensations tend to reach conscious awareness
immersed in cool water (~10 Celsius). We recorded the weight
less than signals from senses used to interact with the
of the water displaced by each body part using a scale (AMPUT
environment, including those from the skin on body sur-
APTP457A 7500 g, Shenzhen Amput Electronic Technology Co.
face. At a smaller scale, there are differences across body
Ltd). According to Archimedes principle, the volume of dis-
parts with regards to the size of their surface area relative to
placed water equals the volume of the immersed object. The
how volumetric they are (Tikuisis et al., 2001), which would
downward force produced by this displacement is equal to the
imply differences in terms of a conscious accessibility of
weight of the water displaced, regardless of the weight of the
bodily information. The advances in body image research
object doing the displacement. Given the known density of
discussed so far suggest that alongside with vision this
water (1 g/cm3), the change in weight on the scale can be used
general access to tactile and interoceptive information may
to measure the volume of the displaced water, and therefore
play important role in the assessment of body size. We
the volume of the measured body part.
therefore hypothesised that some body parts will be judged
We used the obtained estimates of hand length and vol-
more accurately in volume than others, as is the case for
ume to select objects to use as measuring units (Object Stan-
their length estimation (Linkenauger et al., 2015; 2017), and
dard group), or items in the size judgement task (Hand Standard
that the less reliable volume estimates would be observed
group). The exact volume and length of the measuring units
for body parts with smaller surface area relative to their
were recorded. For length judgements, we used sticks cut out
volume.c o r t e x 1 1 1 ( 2 0 1 9 ) 7 4 e8 6 77
of a foamboard matched to the length of the participant's throughout the experiment. Participants made unspeeded
hand from the ulnar styloid process to the tip of the middle responses and they were instructed to respond as accurately
finger. For volume judgements, we selected seven books and as possible and to use fractions and decimal places.
wrapped them in a beige paper to eliminate extraneous visual The impact of different measuring units was assessed
features and reduce distraction (Mean volume: 415.06 cm3, SD: through catch trials, in which participants in the Hand Stan-
129.73). The books were selected to visually match the size of dard group judged the object (i.e., the book volumes or the
an average hand in depth and width/length ratio. The exact stick lengths) while the participants in the Object Standard
dimension correspondence was of course not possible since it group made judgements of their hand. For the former, the
would have inflated the object volume, inflating thus the size object on a far-end of a 20 50 cm foamboard tray was placed
of a measuring unit in Object Standard group relative to the on a table next to the participant, to their right. The partici-
Hand Standard group. We therefore focused our efforts on pant had a full view of the object which was removed after the
matching the hand and object for each participant in volume judgement was made. The correct answers for catch trials
first and foremost, and we added catch trials (cf. below) to were 1, giving the accuracy ratio of 1, since the measuring unit
understand the impact of other differences between the and the judged item were matched in size. The number of
measuring units. Each book and item matched the partici- catch trials in the block was the same as number of trials for
pant's actual hand volume as closely as possible. We calcu- individual body parts. The catch trial analysis is separate from
lated for each participant the % of how the book deviated in the main analysis.
volume from their hand (M: 97.85%, SD: 10.23). The partici- Each participant completed four blocks, two involving
pants in the Object Standard group used what they perceived to judgments of length and two involving judgments of volume.
be the volume of a beige cuboid object and length of a stick as The blocks were counterbalanced in an ABBA fashion, with
measuring units in their body estimates. Those in the Hand the initial condition counterbalanced across participants.
Standard group used a perceived volume of their right hand Each block consisted of six repetitions of each of the six body
and its length from the centre of the wrist to the tip of the parts and a catch trial item in random order, for forty-two
middle finger. trials in total.
Participants were seated at a table facing the wall. They
wore a black smock which prevented them from seeing their 2.3. Estimation of actual body-part volume and length
body. The experimenter sat behind them, out of their field of
view. The instructions were to visualize their body in an up- In the post-testing phase, we recorded the actual volume and
right posture with outstretched arms in order to judge the length of the judged body parts. Together with 3D body
volume and length of different body parts. The judged body scanning (Robinette, 2000; Tikuisis et al., 2001), water
parts and how they were described to participants are given in displacement is the most reliable way of estimating the vol-
Table 1. The region boundaries were explained in plain, non- ume of an object, and it is the gold standard in cadaver studies
technical language with an emphasis on clarity. Apart from which have estimated the volume of different body parts
the leg (crotch to ankle) and arm (excluding the hand), body (Clauser, McConville, & Young, 1969; Dempster & Gaughran,
part boundaries were identical to those used by Linkenauger 1967). Without specialized water tanks, the WDM poses
et al. (2015). Each trial consisted of read-out instructions fol- obvious difficulties when used with living people. Extremities
lowed by a verbal response which was recorded by the like the hand and foot are straightforward to measure using
experimenter. Participants made estimates of the perceived water displacement, but more proximal body parts are less
length or volume of each body part by estimating how many feasible. The data available from cadaver studies report the
multiples of the measuring unit (i.e., their hand or the object) average volume of individual body parts and their ratios to
would fit in the length or volume of each part of their own total body volume. Although they are useful approximations,
body. The measuring unit was in the participant's full view they are often limited to a particular demographic. The
Table 1 e Judged object boundaries. Participants visualized themselves standing upright with outstretched arms to make
judgements of volume and length of body parts using either a non-body object (Object Standard group) or the right hand
(Hand Standard group) as measuring units. The body part boundaries were explained in plain language to ensure
participants' understanding. The anatomical terms are presented for comparison with anthropometric literature.
Judged object Instructions (anatomical definition)
Volume Length or height
1. right foot From the ankle down Heel to toe
(girth of the lateral malleolus) (tip of the longest toe to the end of the calcaneus)
2. head From the top of the neck up Chin to the top of the head
(uppermost girth around the neck below the mandible) (mandible to the top of the head)
3. right arm Shoulder bone to wrist Shoulder bone to wrist
(Acromion to ulnar styloid process) (Acromion to ulnar styloid process)
4. right leg Crotch to ankle Crotch to ankle
(gluteal fold to lateral malleolus) (gluteal fold to lateral malleolus)
5. torso Shoulder bone to the top of pelvis Shoulder bone to the top of the pelvis
(Acromion to iliac crest) (Acromion to iliac crest)
6. body Whole body Body height78 c o r t e x 1 1 1 ( 2 0 1 9 ) 7 4 e8 6 alternative methods in the literature include the multi- anthropometric data averaged across these studies. Our data viewpoint photography (McConville, Churchill, Kaleps, for hand and foot which were also estimated with WDM, and Clauser, & Cuzzi, 1980), use of plaster moulds (Schneider, for the arm, are nearly identical with the anthropometric ev- Robbins, Pflug, & Snyder, 1983), and geometric shape idence. Some deviation observed for the remaining body parts approximation (Katch & Weltman, 1975). may be due to factors including the use of simplified geo- We estimated the volume of the right hand and foot using metric shapes, demographic differences, but also discrep- the WDM. The volume of the body was computed as a ratio of ancies in segment boundary across studies (we report the the participant's weight and body density of 1.003 g/cm3 (Table neck and pelvic region excluded from head and torso esti- 7 in Dempster & Gaughran, 1967), as determined in cadaver mates, respectively). studies. We approximated the arm and leg to two truncated Fig. 1 shows a summary of approximations to geometric cones each, the head to a sphere, and the torso to a cylinder shapes, the measurements, and mathematical formulas. A with an oval base. The measurements of the participant's tape measure was held flat against the body to record the body were recorded as detailed in Fig. 1. The volume formulas circumference of any given body part. The participants could for truncated cones and sphere were used by Katch and wear their clothes but they would take off extra layers for Weltman (1975). The calculations required circumferences at better measurement accuracy. We subtracted 1 cm when the two bases and height of the cones. The volumes of indi- appropriate due to a thick layer of clothing (e.g., jeans). A vidual cones were summed for a final body part estimate. A maximum girth around head, at temporal bones in the hori- circumference of the head was used to compute the head zontal plane, was used in head volume computation. The arm volume. The volume of the torso was calculated from its and leg were approximated to two truncated cones each, height and averages of its three widths (major axis) and separated at the elbow and knee. The circumferences were breadths (minor axis) at the level of chest, waist and pelvic recorded for each truncated cone. The length (height) of body bone. segments as specified in Fig. 1 (column 3) was marked with an We also computed the volume for the body parts propor- erasable pencil with participants standing upright with their tional to the total body volume using cadaver data. These back against the wall. The widths of torso were marked at the values, averaged across participants (Fig. 1, column 6), were level of chest, waist and pelvis while participants stood then compared to anthropometric estimates. Clauser et al. against the wall with their back and right side (Fig. 1). An (1969) and Dempster and Gaughran (1967) together provide empty box aligned with the body part was placed perpendic- an overview of anthropometric evidence from seven US-based ularly to the wall to ease the marking of round body parts. The studies using cadavers. Fig. 1 (column 7) presents the distance between each pair of markings was recorded. Fig. 1 e The actual length and volume of judged objects. The body segment boundaries were marked on the wall allowing for one-dimensional length (height) measurements. All circumferences were measured with a tape measure flat on the body. Three methods were used to compute the volume of body segments: WDM (hand and foot), weight to volume conversion (whole body), and geometry (arm, leg, head, torso). The arm and leg were each approximated to two truncated cones separated at the elbow and knee. The head and torso were approximated to a sphere and cylinder with an oval base, respectively. The last two columns show the segment volumes proportional to the volume of whole body in this experiment (column 6) and as reported in the anthropometric literature (column 7).
c o r t e x 1 1 1 ( 2 0 1 9 ) 7 4 e8 6                                                         79

2.4.    Data analysis                                                    body parts, F(1.95,71.96) ¼ 26.69, p < .001 (GG-corr), h2p ¼ .42,
                                                                         following the pattern reported by Linkenauger et al. (2015).
We computed ratios of judged and actual volume and length                The post-hoc t-tests in Table 2 report that the torso is mis-
estimates to determine the judgement accuracy. Thus, values              perceived as longer the most, followed by the arm and body
greater than 1 indicate overestimation, and values less than 1           height, leg and head, and finally the foot.
indicate underestimation. The judged estimates were ob-                      As per previous findings, the participants who used their
tained by multiplying each judgement by the size of corre-               hand as a measuring unit gave larger responses than those
sponding measuring unit. One of our objectives was a                     who used an object, F(1,37) ¼ 8.96, p ¼ .01, h2p ¼ .20. We also
replication of the study by Linkenauger et al. (2015) which              found a trend for interaction (Fig. 2), F(1.95,71.96) ¼ 3.15,
reported patterns of length misperception (overestimation)               p ¼ .05, h2p ¼ .08 (GG-corr). It was driven by larger over-
across six body parts. As in the original study, we used the             estimations with hand measuring unit relative to those in
hand and object (stick) measuring units and we analysed the              object units for the torso, t(37) ¼ 2.82, p ¼ .03, dz ¼ .63, arm,
length accuracy ratios in a 6-by-2 ANOVA. Our main interest,             t(1,37) ¼ 3.23, p ¼ .02, dz ¼ .72, and leg, t(37) ¼ 3.17, p ¼ .02,
however, was in accuracy of volumetric size perception across            dz ¼ .71, but not the foot, head and body height (p > .05; HB-
body parts in hand and object (book) units, which was tested             corr). Taken together, these results provide a clear replica-
in a 6-by-2 ANOVA on volume accuracy ratios. We then report              tion of the main findings of Linkenauger et al. (2015).
the analyses for the catch trials, in which the size of a judged
item corresponds with the size of the measuring unit. Finally,           3.2.        Volume judgments
we tested how well our predictor variables explained patterns
of length and volume misperception (accuracy ratios). The                Next, we ran an ANOVA on volume estimates identical to the
influence of somatosensory representation was tested for 1D              one used above for length estimates. In contrast to length
length estimates as in the original study by Linkeauger and              estimates, the overall response bias for volume judgements
colleagues (2015). Our predictor for volume judgements was               was not modulated by the unit of measurement, F(1,37) ¼ 2.84,
the SA/VO e i.e., the ratio of body part surface area and its            p ¼ .10, h2p ¼ .08, nor was there an interaction between body
volumetric size. Our predictors relate to the role of body parts         part and measuring unit (Fig. 3), F(2.88,106.38) ¼ .94, p ¼ .42,
in external signal processing. The somatosensory homun-                  h2p ¼ .03 (GG-corr). There was, however, a clear pattern of dif-
cular distortions serve a functional role by enhancing skin              ferential judgments across body parts, F(2.88,106.38) ¼ 28.02,
sensitivity at regions required to read tactile signals most             p < .001, h2p ¼ .43 (GG-corr). Critically, however, this pattern
accurately, and the SA/VO indexes the proportion of 3D body              (Table 3) was different from the pattern observed for length
size at interface with the external world.                               judgements. The volume of the torso was underestimated the
    To identify potential outlier data, we calculated z-scores           most, more than the volume of the whole body and leg. The
for each trial in subsets of accuracy ratios grouped for each            whole body and leg volume underestimation was greater than
participant by the judgement type and judged object. Trials              that observed for the head, foot, and arm.
with z-scores greater than ±3 were excluded as outliers (.36%).
To identify potential outlier participants, Cook's distance
scores were calculated with an averaged accuracy ratio per
                                                                         Table 2 e The differences in length overestimation across
participant and compared to a cut-off value of .1 (4/sample              body parts. The post-hoc t-tests for main effect of body part
size; Bollen & Jackman, 1985). On this basis, one participant            were conducted based on the overestimation pattern
from a group using the hand measuring unit with a Cook's                 across body parts shown in Fig. 2. The largest
distance value .56 was excluded from the analysis. The type III          overestimation for torso was compared against the second
sums of squares method which weighs group means equally                  and third largest overestimation for the whole body and
                                                                         arm, which were then compared to each other. The data for
in unbalanced designs was used in all ANOVAs (Keppel &
                                                                         each, the arm and whole body, were then compared to the
Wickens, 2004). Apart from foot length judgements (Levene's
                                                                         data for head and leg, which followed in magnitude of
test p ¼ .03), the test assumption of homogeneous variances              overestimation error. The final three comparisons were of
was not violated.                                                        the head and leg, and of them each to the foot. The results
    The Holm-Bonferroni correction (HB-corr) was used to                 confirm the largest overestimation for the torso, followed
correct for multiple comparisons. The corrected p values are             by the arm and body height, leg and head, and finally the
reported for all post-hoc tests.                                         foot.

                                                                           Comparisons                                        Statisticsa
                                                                           Torso and body height                t(38)   ¼   6.54, p < .001, dz ¼ 1.05
3.      Results                                                            Torso and arm                        t(38)   ¼   3.61, p ¼ .004, dz ¼ .58
                                                                           Arm and body height                  t(38)   ¼   .54, p ¼ .59, dz ¼ .09
3.1.    Length judgments                                                   Arm and leg                          t(38)   ¼   5.37, p < .001, dz ¼ .86
                                                                           Body height and leg                  t(38)   ¼   2.65, p ¼ .04, dz ¼ .42
In order to replicate the analyses of Linkenauger et al. (2015),           Arm and head                         t(38)   ¼   4.38, p < .001, dz ¼ .70
we initially assessed the accuracy ratios for length judge-                Body height and head                 t(38)   ¼   4.45, p < .001, dz ¼ .71
                                                                           Head and leg                         t(38)   ¼   .40, p ¼ .69, dz ¼ .06
ments alone. We conducted an ANOVA with the judged body
                                                                           Leg and foot                         t(38)   ¼   3.11, p ¼ .01, dz ¼ .50
part (foot, head, arm, leg, torso, body) as a within-subject               Head and foot                        t(38)   ¼   3.72, p ¼ .004, dz ¼ .60
factor and measuring unit (hand, object) as a between-                     a
                                                                               Holm-Bonferroni corrected p values are reported.
subjects factor. The response bias differed across judged
80 c o r t e x 1 1 1 ( 2 0 1 9 ) 7 4 e8 6
Table 3 e The differences in volume misperception across
body parts. The post-hoc t-tests for main effect of body part
were conducted based on the accuracy ratio pattern across
body parts shown in Fig. 3. The comparison of volume
accuracy ratios collapsed across measuring units
confirmed the largest underestimation for the torso,
followed by the leg and whole body, and finally by the
head, foot and arm.
Comparisons Statisticsa
Torso and whole body t(38) ¼ 3.51, p ¼ .01, dz ¼ .56
Torso and leg t(38) ¼ 3.43, p ¼ .01, dz ¼ .55
Leg and whole body t(38) ¼ .73, p ¼ .62, dz ¼ .12
Leg and head t(38) ¼ 7.67, p < .001, dz ¼ 1.23
Whole body and head t(38) ¼ 4.97, p < .001, dz ¼ .80
Head and arm t(38) ¼ 2.46, p ¼ .07, dz ¼ .39
Head and foot t(38) ¼ 1.03, p ¼ .86, dz ¼ .16
Arm and foot t(38) ¼ 1.08, p ¼ .86, dz ¼ .17
a
Holm-Bonferroni corrected p values are reported.
Fig. 2 e The accuracy ratios for body length estimates in
hand and object measuring units. The plot shows a pattern
of estimation error across body parts. The overestimation
and underestimation bias is indicated by values > 1 been their measuring unit if they were in the other group.
and < 1, respectively. Error bars are ±1 SEM. The biases Similarly, the Object Standard group judged their hand size in
larger than 1, as determined by one-sample t tests using a object units. As previously discussed, since the objects were
Holm-Bonferroni correction for multiple comparison error, selected to match the hand size as closely as possible the
are marked by asterisks. correct answers and the accuracy ratios for catch trials in both
groups should be 1. The analysis shows that the length of
sized-matched object (sticks) was overestimated in hand
units, t(18) ¼ 4.54, p < .001, dz ¼ 1.04, while the estimates of the
hand length in object units did not deviate from veridicality,
t(19) ¼ .82, p ¼ .42, dz ¼ .18. Similarly, the perceived volume of
the size-matched object was overestimated in hand units,
t(18) ¼ 5.55, p < .001, dz ¼ 1.27, while the estimates of the hand
volume in object units again did not deviate from veridicality,
t(19) ¼ 1.17, p ¼ .26, dz ¼ .26 (HB-corr).
The measuring unit was in full view throughout the
experiment. All accuracy ratios for size estimates in hand
units, including those of a non-body object, were larger than
accuracy ratios for estimates in object units. Nevertheless, a
general underestimation of hand size can be ruled out, given
the findings for hand size judgements in object units. One
possible interpretation may be that the hand size is perceived
differently, i.e., as smaller, when the hand is directly viewed
compared to when it is covered by a cloak with other judged
body parts The reason for that may be that the length of a
Fig. 3 e The accuracy ratios for body volume estimates in viewed hand may be perceptually ‘shrank’ relative to its width,
hand and object units. The plot shows a pattern of which is greater than the width of a stick-object in the Object
estimation error across body parts. The overestimation Standard group. Similarly, the hand view may lead to a reca-
and underestimation bias is indicated by values > 1 libration of perceived volume by a reduction, as it highlights
and < 1, respectively. Error bars are ±1 SEM. The biases the shape discontinuities in gaps between the fingers.
marked by asterisks deviate from the mean ¼ 1, as
determined by one-sample t tests using a Holm-Bonferroni 3.4. Inverse distortion model of tactile size constancy
correction for multiple comparison error.
In their original study, Linkenauger et al. (2015) found that the
skin sensitivity alone (predictor 1) comes short of predicting
3.3. Measuring unit estimates (catch trials) the pattern of length overestimation across body parts; how-
ever, it interacts with body part's actual size (predictor 2). That
In addition to body estimates, we presented catch trials in is, body parts which are less represented in somatosensory
which the participants estimated the size of the other cortex tend to be mis-judged as longer but this misjudgement
measuring unit. Thus, those judging in hand units would es- is scaled down by body part's actual size. Those body parts
timate the volume and length of objects which would have which are already long will be less elongated perceptually.c o r t e x 1 1 1 ( 2 0 1 9 ) 7 4 e8 6 81
Fig. 4 e Length overestimation as a function of the overestimation predicted by a product of relative sensitivity and physical
size. The judgements in hand and object units are shown respectively in panel a and b. Note a larger scale in (a) due to larger
response variability. The black line is the regression line. The data is not averaged across trials, i.e., the scatter plots show
all recorded observations. Darker circles reflect higher concentration of the values. This is a replication of previous findings
(cf. Linkenauger et al., 2015, Fig. 6).
Linkenauger et al. (2015) also reported that the actual body This is a direct replication of the previous findings
part length alone (predictor 3) did not explain the pattern in (Linkenauger et al., 2015; refer to Fig. 6). However, we also
length overestimation across body parts. The authors went on found that the product of sensitivity and size reliably pre-
to introduce the inverse distortion model (Linkenauger et al., dicted the length overestimation in object units (Fig. 4b),
2015) positing that the influence of somatosensory homun- X2(1,N ¼ 20) ¼ 11.54, p < .001. Thus, rather than being
cular distortions may be counteracted by the distortions of the restricted to relative body part misperception, the length esti-
explicit body image. They reported their findings to be con- mation error in this experiment increases for less sensitive
strained to the relative body size judgements, i.e., not the body parts which are smaller regardless of the measuring
judgements in object units. unit. Consistent with the literature, the acuity alone did not
To test the theory with our data, we used the tactile spatial predict the length misperception, X2(1,N ¼ 19) ¼ 1.84, p ¼ .17
sensitivity measurements from the whole-body mapping (hand units), and X2(1,N ¼ 20) ¼ 1.33, p ¼ .24 (object units).
study by Weinstein (1968), which comprises the data of 48
subjects (24 males and 24 females). We obtained the com- 3.5. Body volume perception
posite sensitivity measure for each body part as an average
across individual location measurements (e.g., leg: mean The length misperception was previously linked to tactile
acuity for calf and thigh). The predictors were calculated spatial acuity (Linkenauger et al., 2015). However, the tactile
following the procedures of Linkenauger et al. (2015). The spatial acuity concerns only the skin on body surface, which
acuity predictor was computed as the sensitivity of each body is not linearly related to 3D volume of body parts (Tikuisis
part powered by negative hand sensitivity or 1 for judge- et al., 2001). Our predictor for volume judgements was the
ments in object units. The second predictor was a product of SA/VO e i.e., the ratio of body part surface area and its overall
the acuity predictor and the proportional body part and volume. Thus, analogous to a functional role of SI magnifi-
measuring unit length. The body height overestimations were cation in processing of external tactile signals, we tested how
not included given the large tactile spatial variability across the size of 3D body parts' outer world interface impacted on
individual body parts (Linkenauger et al., 2015). The outcome their perceived volumetric size. We used linear mixed-
variable were the raw clean accuracy ratios not averaged effects modelling with the random effects structure re-
across trials. ported in previous section. A freely available SA/VO (Tikuisis
We used R analysis software (R Core Team, 2012) and lme4 et al., 2001, Table 3) obtained in 3D-scanning was submitted
(Bates, Ma€chler, Bolker, & Walker, 2015) to perform a linear to the analysis as a predictor. The SA/VO for the whole body
mixed-effects analysis of the relationship between tactile was not provided and thus it could not be included. The
spatial sensitivity and length accuracy ratios. The maximal measuring unit groups were collapsed together after
random effects structure (Barr, Levy, Scheepers, & Tily, 2013) removing the baseline difference by subtracting the grand
in our design included the random participant and body part mean from the raw accuracy ratios in each group. As ex-
intercepts, and by-participant slopes. In a null model, only the pected, the null model including only the random effects was
random effects were entered (“empty model”; Quene & van improved after the inclusion of SA/VO for the volume accu-
den Bergh, 2004). The model improvement after inclusion of racy ratios, X2(1, N ¼ 39) ¼ 4.55, p ¼ .03, and there was a trend
the predictor (fixed effect) was tested by assessing the for it to improve also for the length accuracy ratios, X2(1,
reduction in the residual sum of squares with a Chi-square N ¼ 39) ¼ 3.14, p ¼ .08 (Fig. 5). The results thus show that the
test. Our results show that the length overestimation in volume is underestimated less with the increasing SA/VO.
hand units was predicted by the product of tactile spatial There is a trend for the length to be overestimated less with
sensitivity and body size (Fig. 4a), X2(1,N ¼ 19) ¼ 3.95, p < .05. the increasing SA/VO.82 c o r t e x 1 1 1 ( 2 0 1 9 ) 7 4 e8 6
Fig. 5 e The volume (a) and length (b) estimation error predicted by the skin surface to volume ratios. The measuring units
are collapsed together after the removal of their baseline difference. The volume underestimation decreases with larger SA/
VO (m2/m3). There was a trend for the surface to volume ratios to predict the length estimation error. The empty circles at
each body part on the x axis represent demeaned accuracy ratios for all participants. Darker circles indicate higher
concentration of the values.
The final two linear mixed-effects models assessed how The largest volume underestimation was found for the
actual body volume and length alone predicted estimation torso, followed by the leg and whole body, and finally by the
error across all six judged body segments. The baseline dif- head, foot, and arm. In the human body, the distal body parts
ference between the measuring unit groups was again actively used for interaction with the environment have larger
removed, and we used the previously specified random ef- SA/VO, whereas more proximal body parts help maintain the
fects structure. The length overestimation was not predicted homeostasis and preserve the heat by being less exposed to
by the actual body length, X2(1,N ¼ 39) ¼ .01, p ¼ .92. Simi- the outer world on account of their smaller SA/VO
larly, the volume underestimation was not increased simply (Romanovsky, 2014; Tikuisis et al., 2001). Notably, there is a
due to body parts being more volumetric, X2(1,N ¼ 39) ¼ 1.62, rough correspondence between SA/VO and tactile spatial
p ¼ .20. acuity, suggesting that the body parts which are more exposed
to the environment are also equipped with greater skin
sensitivity for interacting with it. The representation of 3D
4. Discussion body proportions (panel b) thus shows some resemblance to a
classic somatosensory homunculus (Penfield & Boldrey, 1937;
Earlier, we introduced one particularly interesting recent Penfield & Rasmussen, 1950). There were no theoretical
development in the literature, namely that the perceptual grounds to use the tactile spatial acuity as a predictor of vol-
distortions of body image in healthy cognition may be linked ume misperception, however, because it only relates to skin
to classic homuncular distortions in SI (Linkenauger et al., on the body surface rather than to the 3D volume itself.
2015; Longo & Haggard, 2012). Our results replicated the find- The length of body segments was misperceived as larger.
ings of Linkenauger et al. (2015), providing more support for an The largest overestimation was found for the torso, followed
increased length overestimation of less sensitive body parts by the arm and body height, leg and head, and finally the foot
(Weinstein, 1968) for which the somatosensory representation (Fig. 6c). Linkenauger et al. (2015) found that the body parts
is compressed (Green, 1982; Sadibolova, Tame , Walsh, & which are less represented in somatosensory cortex are mis-
Longo, 2018; Weber, 1996). This suggests that the distortions judged as longer but this misjudgement is scaled down by
of one representation may balance out those of the other body part's actual size. Those body parts which are already
(Linkenauger et al., 2015). Critically, we built on and extended long will be perceptually less elongated. Our pattern of 1D
this literature by testing the volumetric size perception (3D length misperception and its relation to a product of actual
body image) and finding a pattern of underestimation across length and tactile spatial acuity is a direct replication of
body parts. This underestimation was smaller for body parts Linkenauger's et al. (2015) findings. Unlike in their study,
with larger SA/VO ratios, i.e., larger interface between the however, our effect was not constrained to relative judge-
body part and outer world relative to its volume on the inside. ments of body parts. Instead, our data in hand units and object
Our results add to the evidence suggesting a relationship be- units both attest to a relationship between the explicit body
tween the role of body parts in external signal processing and image and the implicit somatosensory representation. These
body image. The absolute perceptual errors were in similar findings were previously interpreted as evidence for the ‘in-
magnitude across body parts for both judgement types. Thus, verse distortion model’ of tactile size constancy (Linkenauger
while the actual size did not predict the misperception pat- et al., 2015). Given that the early somatosensory maps are
terns, the smaller SA/VO was related to a larger volume un- distorted (Sur, Merzenich, & Kaas, 1980), the reliability of
derestimation, and a trend for a larger length overestimation. somatoperception based solely on them would be diminished.
The inverse distortion model posits that the negative impactc o r t e x 1 1 1 ( 2 0 1 9 ) 7 4 e8 6 83
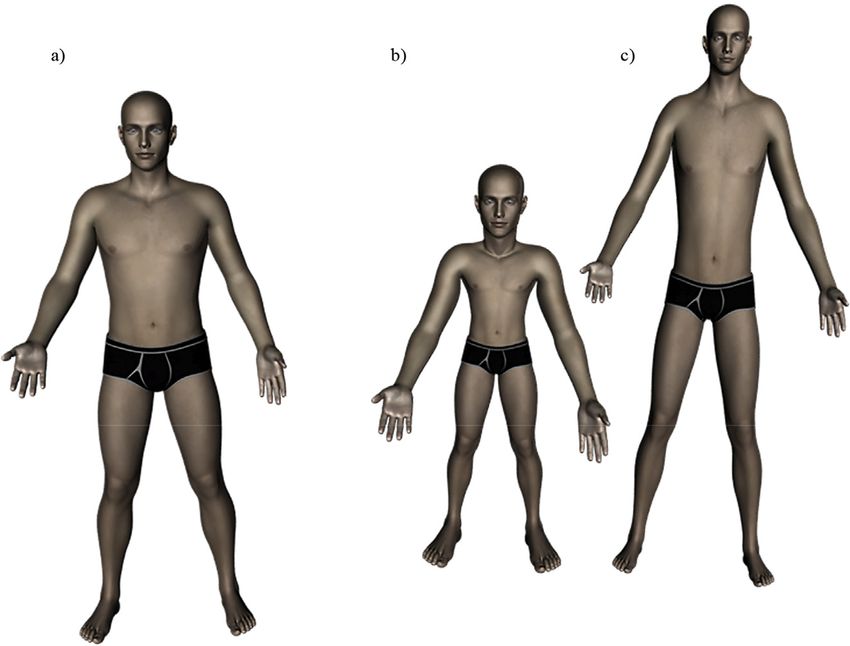
Fig. 6 e Perceptual distortions of body image. Panel (a) shows a body with normal proportions. The representation of 3D
body proportions (panel b) show some resemblance to a classic somatosensory homunculus (Penfield & Boldrey, 1937;
Penfield & Rasmussen, 1950). The body parts underestimated in volume tend to be overestimated in length, thus giving rise
to a tall body shape (panel c). Perceived body proportions change as a function of the judgement type, showing similarity in
a magnitude of the absolute error for individual body parts, be it an underestimation of volume or overestimation of length.
of early somatotopy may be alleviated by inversely distorted exteroceptive senses, including touch on the skin. There-
body image (Linkenauger et al., 2015). As a result, the size of fore, it could be hypothesised that the extent of a surface
objects touching the skin is judged more accurately interface for contact with the world will not be as under-
(Linkenauger et al., 2015). represented in the explicit 3D body image as is the vol-
Conversely, Longo and Haggard (2012) pointed out a ume. In this scenario, surface area would be overestimated
dissociation between the visual template-matching tasks and relative to perceived volume across body parts, and
1D body size judgements with the latter showing the so- increasingly so for those body parts which are more
matosensory distortions but to a reduced degree. When their underestimated in volume. The 1D length misperception
participants judged how the lengths of lines on a computer may reflect this relative body surface overestimation and
screen compared to the length of each of their fingers, body inside underestimation. Critically, the body parts with
perceptual distortions were observed, which were consistent large SA/VO such as hands and feet are the least under-
but smaller than the distortions in their implicit size percep- estimated in volume and overestimated in length, while
tion task. However, the performance was nearly veridical in those with a small SA/VO like the torso show the largest
their visual template-matching task. The authors suggested magnitude of error in both directions. This arrangement
that the 1D size perception was not a pure measure of the could indeed counteract the effect of homuncular distor-
body image, which they thought was veridical, but a weighted tions, and it would not be detected when testing with sen-
combination of both the visual and somatosensory represen- sitive fingers (large SA/VO) as did Longo and Haggard (2012).
tations. Thus, contrary to Linkenauger et al. (2015), Longo and As such, if corroborated by more empirical evidence, it
Haggard (2012) assumed a positive relationship between the would expand on and potentially reconcile the two seem-
1D length misperception and homuncular distortions. ingly contradicting theories.
The key to converge these theories may be in under- On the other hand, it could be assumed, that the body sur-
standing how the body surface area is represented at the face area will be explicitly underestimated akin to pattern of
explicit level. The under-representation of the segment's misperception found for the body volume. The 3D body image
volumes may be related to us being less aware of body's proportions would then be similar to those of the somatosen-
inside than of its surface. We are indeed much less aware of sory homunculus albeit possibly distorted in a reduced
the interoceptive signals originating from the body, magnitude as suggested by Longo and Haggard's (2012) evi-
including our musculo-skeletal, gastro-testinal, respiratory, dence. In other words, the 3D body image measured by other
circulatory and hormonal systems (Seth, 2013; Tsakiris & than pictorial body-matching techniques would roughly be a
Critchley, 2016), compared to the signals from our 3D version of the 2D somatosensory homunculus. The84 c o r t e x 1 1 1 ( 2 0 1 9 ) 7 4 e8 6
overestimation of 1D length for perceptually shrunken body photograph-like visual perspective when studying the 3D
parts would be difficult to interpret in this scenario. It may be body perception. Nevertheless, it would be interesting to
related to largely unexplored dissociations in body perception compare our results to those from a study in the virtual
across different dimensions. For instance, the blockage of environment where again the emphasis will shift to how the
incoming signals in anaesthetised finger results in a perceptual 3D body looks from the outside.
enlargement of its width but not its length (Walsh et al., 2015). To conclude, one of the main contributions of this study is
Similarly, Hashimoto & Iriki (2013) found an activation in two addressing the body image for the first time as a representa-
distinct cortical regions when participants made judgements tion of a 3D volumetric body, and in directing the research
about their body with reference to their photographs from two enquiry towards the ‘body on the inside’. To our knowledge,
different viewing angles (front and the side). Finally, Mo € lbert no prior study assessed the representation of body size and
et al. (2016) reported overestimations for body widths and shape in this respect before. Our results showed that healthy
depths but an underestimation of body circumference. There individuals tend to underestimate their body parts in volume
could be dissociations in body size perception studied in 1D, 2D while overestimating them in length. The patterns of
and 3D space if different aspects of body representation are misperception across body parts thus gave rise to propor-
being probed for each. tionally distorted body shapes, that similar to a well-known
Might these results be affected by perceptual illusions? A depiction of a somatosensory homunculus and a tall bean-
volume of water in a tall and slim glass for instance will be pole, respectively. Our findings add to a growing evidence that
perceived differently as the same water volume in a short and healthy adults do not have highly accurateeif not infallible
wide glass. It is important to note that the body parts were not representation of their body size as previously assumed, and
directly viewed, and as the catch trial evidence suggests, the that their perceptual errors may be determined by a role of
unseen hand was not misperceived in object units while it body parts in external signal processing. More generally, these
may have been judged as smaller when viewed directly. findings and the corresponding recent advances in body
Nevertheless, the role of perceptual illusions should be image literature highlight the importance of studying the
empirically studied and if possible dissociated. A study with perceptual distortions “at the baseline”, i.e., in healthy popu-
non-body objects of similar shape and size is underway to lation, given their potential to further elucidate the nature of
address this concern. Correlations between body size esti- perceptual distortions in clinical conditions. Indeed, without
mation error and visuospatial dysfunctions have been re- understanding the distortions in healthy individuals, it is
ported (Thompson & Spana, 1991) given that the mental body impossible to pinpoint the unique influence of clinical disor-
image requires visuospatial abilities. Thus, similarities in ders on body image. Dissociating normal versus clinical body
body and non-body perception may be observed. However, distortions will likely allow practitioners to develop more
differences were found when participants judged themselves objective and reliable diagnostic criteria for patient pop-
as opposed to judging mannequins, which suggests a differ- ulations. Thus, our study should provide a useful point of
ence in size perception for other bodies or objects (Dolce, departure for future work to replicate and extend with clinical
Thompson, Register, & Spana, 1987). Given that the volu- samples. Indeed, new testable theories were already intro-
metric body perception is fairly under-explored, there may be duced based on the related evidence; e.g., theories positing
numerous other potentially important factors to address in that individuals with eating disorders may be more reliant on
future studies, such as how the feeling of satiety or the distorted somatosensory representations than healthy people
changes in body posture with their corresponding shifts in (Longo, 2015).
centre of gravity across body parts may interact with the
perception of volumetric body size.
There could be a concern about the study being rather Declarations of interest
intrusive for a participant whose measurements had to be
taken with a tape measure. Future studies may take advan- None.
tage of a 3D body scanning (Stewart et al., 2012), with the
added benefit of recording accurately the actual size of par-
ticipant's body parts. Another issue that may be raised is the
difficulty with mentally adding up more measuring units for Acknowledgments
large body parts. However, this does not seem to be a concern
given that the magnitudes of misperception error were unre- This research was supported by a doctoral studentship from
lated with actual body size in this experiment. An alternative the Economic and Social Research Council, U.K. (ES/J500021/1),
method for investigating the 3D body size perception might be and the Welcome Trust/Birkbeck University ISSF funding
in virtual environments (Alcan ~ iz et al., 2000). Still, there is an (204770/Z/16/Z) to RS, and the European Research Council
important point to be made. To our knowledge, our study is Grant ERC-2013-StG-336050 under the FP7 to MRL.
one of the pioneer studies exploring in healthy adults the
representation of their 3D body size. As hinted in the term, the
body image would be largely conceived of and studied as a
Supplementary data
mental image of how the body would be seen from the outside.
Supplementary data to this article can be found online at
This study has shown that the research may actually benefits
https://doi.org/10.1016/j.cortex.2018.10.016.
from reducing the focus on this rather ‘allocentric’You can also read


