DISCUSSION PAPER SERIES - DP13724 (v. 8) Blockchain Characteristics and the Cross-Section of Cryptocurrency - Index of
←
→
Page content transcription
If your browser does not render page correctly, please read the page content below
DISCUSSION PAPER SERIES

                   DP13724
                     (v. 8)

  Blockchain Characteristics and the
   Cross-Section of Cryptocurrency
               Returns

 Siddharth Bhambhwani, Stefanos Delikouras and
               George Korniotis

            FINANCIAL ECONOMICS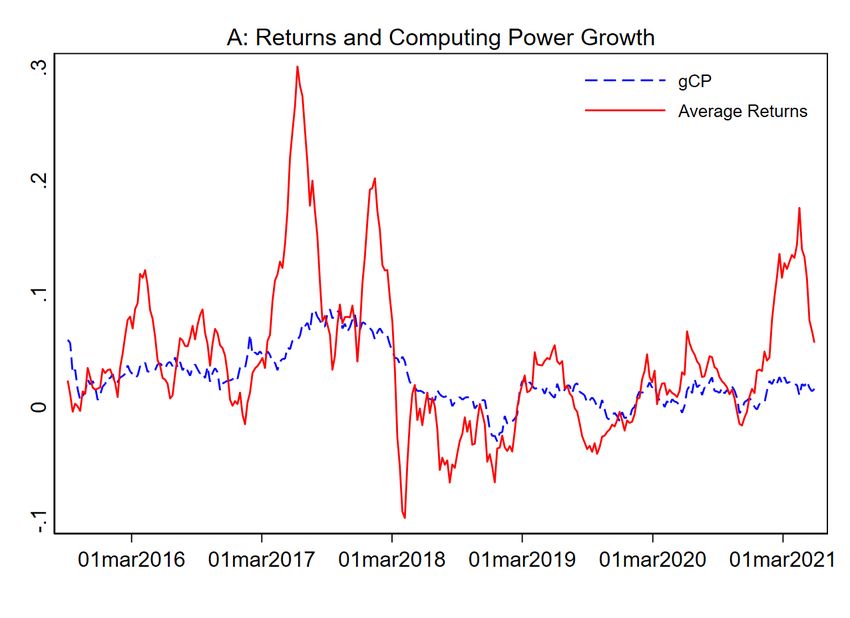
ISSN 0265-8003

Blockchain Characteristics and the Cross-Section of
             Cryptocurrency Returns
              Siddharth Bhambhwani, Stefanos Delikouras and George Korniotis

                                  Discussion Paper DP13724
                                  First Published 09 May 2019
                                   This Revision 23 July 2021

                             Centre for Economic Policy Research
                         33 Great Sutton Street, London EC1V 0DX, UK
                                   Tel: +44 (0)20 7183 8801
                                         www.cepr.org

This Discussion Paper is issued under the auspices of the Centre’s research programmes:

        Financial Economics

Any opinions expressed here are those of the author(s) and not those of the Centre for Economic
Policy Research. Research disseminated by CEPR may include views on policy, but the Centre
itself takes no institutional policy positions.

The Centre for Economic Policy Research was established in 1983 as an educational charity, to
promote independent analysis and public discussion of open economies and the relations among
them. It is pluralist and non-partisan, bringing economic research to bear on the analysis of
medium- and long-run policy questions.

These Discussion Papers often represent preliminary or incomplete work, circulated to encourage
discussion and comment. Citation and use of such a paper should take account of its provisional
character.

Copyright: Siddharth Bhambhwani, Stefanos Delikouras and George Korniotis
Blockchain Characteristics and the Cross-Section of
Cryptocurrency Returns
Abstract
We show that cryptocurrency returns relate to asset pricing factors derived from two blockchain
characteristics, growth in aggregate computing power and network size. Consistent with
theoretical models, cryptocurrency returns have positive risk exposures to these blockchain-based
factors, which carry positive risk prices. A stochastic discount factor with computing power and
network explains the cross-sectional variation in expected cryptocurrency returns at least as well
as models with cryptocurrency return-based factors like size and momentum. The explanatory
power of the blockchain factors also increases as the cryptocurrency market matures. Overall,
theoretically motivated factors are important sources of risk for cryptocurrency expected returns.
JEL Classification: E4, G12, G15
Keywords: Hashrate, network, Factor Analysis, GMM, Rolling Estimation
Siddharth Bhambhwani - smb337@miami.edu
University of Miami
Stefanos Delikouras - sdelikouras@bus.miami.edu
University of Miami
George Korniotis - gkorniotis@miami.edu
University of Miami and CEPR
Acknowledgements
We thank Nic Carter, Jacob Franek, Kevin Lu, and Tim Rice of Coinmetrics.io for their help with the data. We thank Ilona Babenka,
Michael Barnett, Thomas Bates, Dirk Baur, Tyler Beason, Gennaro Bernile, Hendrik Bessembinder, Sreedhar Bharath, Dario
Cestau, Indraneel Chakraborty, Andreas Charitou, Ilhan Demiralp, Evangelos Dioikitopoulos, Pedro Gete, Sara Holland, Allen
Huang, Alok Kumar, Petri Jylha, George Kapetanios, Irene Karamanou, Matti Keloharju, Laura Lindsey, Scott Linn, Matthijs Lof,
Andreas Milidonis, Dino Palazzo, George Nishiotis, Marios Panayides, Filippos Papakonstantinou, Simon Rottke, Yuri
Tserlukevich, Vahid Saadi, Christoph Schiller, Mark Seasholes, Sean Seunghun Shin, Denis Sosyura, Jared Stanfield, Bryan
Stanhouse, Luke Stein, Michael Ungeheuer, Jessie Wang, Tong Wang, Stavros Zenios, Zhuo Zhong as well as seminar
participants at Aalto University, Arizona State University, IE Madrid, King's College London, 2019 Luxembourg Asset Management
Summit, Miami Herbert Business School, University of Oklahoma, the 13th NUS Risk Management Institute Conference, the 2nd
UWA Blockchain, Cryptocurrency, and FinTech Conference, 2019 FIRN Melbourne Asset Pricing Meeting, the NFA 2019
Conference, Tokyo Institute of Technology, Kyoto University, and University of Cyprus for helpful comments. Andrew Burch,
Stanley Wai, and Irene Xiao provided excellent research assistance. All errors are our own.
Powered by TCPDF (www.tcpdf.org)Blockchain Characteristics and the Cross-Section of
Cryptocurrency Returns
Siddharth M. Bhambhwani∗
Stefanos Delikouras†
George M. Korniotis‡
July 23, 2021
Abstract
We show that cryptocurrency returns relate to asset pricing factors derived from two
blockchain characteristics, growth in aggregate computing power and network size.
Consistent with theoretical models, cryptocurrency returns have positive risk expo-
sures to these blockchain-based factors, which carry positive risk prices. A stochastic
discount factor with computing power and network explains the cross-sectional varia-
tion in expected cryptocurrency returns at least as well as models with cryptocurrency
return-based factors like size and momentum. The explanatory power of the blockchain
factors also increases as the cryptocurrency market matures. Overall, theoretically mo-
tivated factors are important sources of risk for cryptocurrency expected returns.
Keywords: Hashrate, Network, Factor Analysis, GMM, Rolling Estimation.
JEL Classification: E4, G12, G15
∗
Siddharth M. Bhambhwani, Hong Kong University of Science and Technology, email: acsidd@ust.hk
†
Stefanos Delikouras, University of Miami, email: sdelikouras@bus.miami.edu
‡
George M. Korniotis, University of Miami and CEPR, email: gkorniotis@bus.miami.edu
We thank Nic Carter, Jacob Franek, Kevin Lu, and Tim Rice of Coinmetrics.io for their help with the
data. We thank Ilona Babenka, Michael Barnett, Thomas Bates, Dirk Baur, Tyler Beason, Gennaro Bernile,
Hendrik Bessembinder, Sreedhar Bharath, Dario Cestau, Indraneel Chakraborty, Andreas Charitou, Ilhan
Demiralp, Evangelos Dioikitopoulos, Pedro Gete, Sara Holland, Allen Huang, Alok Kumar, Petri Jylha,
George Kapetanios, Irene Karamanou, Matti Keloharju, Laura Lindsey, Scott Linn, Matthijs Lof, Andreas
Milidonis, Dino Palazzo, George Nishiotis, Marios Panayides, Filippos Papakonstantinou, Simon Rottke,
Yuri Tserlukevich, Vahid Saadi, Christoph Schiller, Mark Seasholes, Sean Seunghun Shin, Denis Sosyura,
Jared Stanfield, Bryan Stanhouse, Luke Stein, Michael Ungeheuer, Jessie Wang, Tong Wang, Stavros Zenios,
Zhuo Zhong as well as seminar participants at Aalto University, Arizona State University, IE Madrid, King’s
College London, 2019 Luxembourg Asset Management Summit, Miami Herbert Business School, University
of Oklahoma, the 13th NUS Risk Management Institute Conference, the 2nd UWA Blockchain, Cryptocur-
rency, and FinTech Conference, 2019 FIRN Melbourne Asset Pricing Meeting, the NFA 2019 Conference,
Tokyo Institute of Technology, Kyoto University, and University of Cyprus for helpful comments. Andrew
Burch, Stanley Wai, and Irene Xiao provided excellent research assistance. All errors are our own.Introduction
Cryptocurrencies are a significant financial innovation. Yet, it is unclear which are the asset
pricing factors that determine their expected returns. On the one hand, most empirical
research focuses on the influence of investor sentiment and other non-fundamental factors
on cryptocurrency prices and returns.1 On the other hand, theory suggests that blockchain
characteristics such as computing power and network size are key determinants of cryptocur-
rency prices.2 However, there is little empirical work on the importance of these blockchain
fundamentals for the cross-section of cryptocurrency expected returns.3 To fill this gap, we
focus on aggregate computing power and aggregate network size and examine whether they
can price cryptocurrency expected returns.
Our analysis centers around two conjectures. First, we posit that aggregate computing
power and network size are fundamental indicators of the state of the cryptocurrency mar-
ket. Aggregate computing power proxies for the cumulative resources expended on mining
and relates to the overall reliability and security of cryptocurrency blockchains. Aggregate
network size captures the general adoption levels of cryptocurrencies. Therefore, these two
factors offer important insights about the state of the cryptocurrency market and should
affect expected returns of cryptocurrencies.
Second, we posit that the pricing power of these blockchain-based factors should increase
over time as the cryptocurrency market becomes more established. This conjecture follows
from Pástor and Veronesi (2003; 2006), who argue that valuation uncertainty is initially
high for new assets leading to price run-ups at the time of their introduction. As the assets
1
See Griffin and Shams (2020), Makarov and Schoar (2020), and Liu, Tsyvinski, and Wu (2021).
2
See Pagnotta and Buraschi (2018), Biais, Bisiere, Bouvard, and Casamatta (2019), Biais, Bisiere, Bou-
vard, Casamatta, and Menkveld (2020), and Cong, Li, and Wang (2020).
3
Exceptions include Liu and Tsyvinski (2020) who show that over the 2011 to 2018 period, Bitcoin’s
network comoves with average cryptocurrency returns while variables related to Bitcoin’s mining do not.
Liu and Tsyvinski (2020) proxy for Bitcoin mining activity using the price of Bitmain’s mining hardware
and the cost of electricity in the U.S. and China. In contrast to their paper, we use hashrates because they
are available for all Proof-of-Work cryptocurrencies and are measured at the daily level, thereby providing
better information about aggregate mining activity at a very high-frequency level. Biais et al. (2020) focus
on Bitcoin and highlight the importance of transaction benefits and network security. Pagnotta (2021) finds
that the prices of Bitcoin, Ethereum, and Litecoin are positively related to their hashrates.
1mature, this uncertainty dissipates and returns begin to line up with fundamentals.
We examine our hypotheses with a comprehensive set of asset pricing tests (Fama and
MacBeth, 1973; Cochrane, 2005, 2011) where aggregate computing power and network size
are the main asset pricing factors. The fact that computing power and network size are
endogenous economic variables does not invalidate our tests. We address this endogeneity
following the framework used in testing the pricing ability of theoretically-motivated factors
(Cochrane, 2005). For example, tests of the consumption CAPM treat aggregate consump-
tion, an endogenous variable, as given and examine whether aggregate consumption prices
the cross-section of expected equity returns. While we adopt this approach, we also test
the pricing performance of the two blockchain-based factors with cryptocurrencies whose
blockchain characteristics are not used in the construction of these factors.
Our sample period is from 9/4/2015 to 5/28/2021. The sample starts in September of
2015 since many important cryptocurrencies were introduced around that time. For this
period, we collect data on computing power (hashrates) and network size (number of unique
addresses transacting on a blockchain) for ten baseline currencies, i.e., Bitcoin, Ethereum,
Litecoin, Dash, Dogecoin, Vertcoin, Monero, Ripple, NEM, and Maidsafecoin. We select
these currencies because they are some of the largest currencies at the beginning of our
sample period comprising approximately up to 98% share of the market. They also have
reliable and vetted data on computing power and network size for the entire sample period.
Using this data, we create a balanced panel of cryptocurrencies and aggregate the growth
rates in computing power and network size across the ten baseline currencies. These two
blockchain characteristics are the main asset pricing factors in our empirical tests.
We structure our empirical analysis around the stochastic discount factor paradigm
(Cochrane 2005, 2011). Specifically, we first estimate factor models. The main factors are
the aggregate weekly growth rates of computing power (gCP ) and network size (gN ET ) of
the ten baseline currencies. Our goal is to show that the blockchain-based factors have pos-
itive risk exposures as advocated by existing theories (e.g., Pagnotta and Buraschi (2018)).
Following Liu and Tsyvinski (2020), the factor models also control for a cryptocurrency
2momentum factor, a cryptocurrency size factor, and Bitcoin’s return. Since Bitcoin is the
largest cryptocurrency, its return can proxy for cryptocurrency market-wide risk.
In the factor regressions, the test assets are 30 currencies. They include the ten baseline
currencies used to derive the computing power and network factors. We also use 20 additional
test cryptocurrencies whose blockchain fundamentals are not included in the gCP and gN ET
factors. Considering these 20 additional currencies addresses concerns related to possible
endogeneity biases inflating the significance of the blockchain-based factors. We select these
20 currencies because they have valid and vetted return data for our entire sample period.
For the factor regressions, we estimate two-factor models with the blockchain-based fac-
tors, three-factor models with the cryptocurrency return-based factors, and five-factor models
with all the factors. We find that the estimated exposures to the gCP and gN ET factors
are positive and statistically significant even after controlling for the cryptocurrency return-
based factors (i.e., Bitcoin’s return, size, and momentum). The positive betas on the gCP
and gN ET suggest that these factors are procyclical.
Next, we turn to cross-sectional tests based on regressions of expected cryptocurrency
returns on factor betas. We want to show that gCP and gN ET , as procyclical factors in
the cryptocurrency market, have positive risk prices and explain a significant portion of the
variation in expected cryptocurrency returns. Cross-sectional tests are important because
spurious factors can have significant betas in time series regressions but they usually have
no explanatory power in cross-sectional regressions of expected returns (Daniel and Titman
(1997); Lewellen, Nagel, and Shanken (2010)).
For our cross-sectional tests, we adopt the rolling window estimation approach of Fama
and MacBeth (1973) (FMB) because the cryptocurrency market has been evolving. We set
the rolling window to 156 weeks (i.e., approximately three years). For each period, we use
the Generalized Method of Moments (GMM) approach to estimate cross-sectional regressions
and obtain the factor risk prices. We opt for the GMM methodology because it estimates
the factor betas from the time series and simultaneously runs the cross-sectional regressions.
From the rolling cross-sectional regressions, we obtain a time series of estimated prices of
3risk. As in Fama and MacBeth (1973), we focus on the average prices of risk and find that
they are positive and significant for both gCP and gN ET .
The FMB results also show that the cross-sectional dispersion in expected cryptocurrency
returns is significantly related to the computing power and network factors. Specifically, these
two factors explain about 28% of the cross-sectional variation in expected returns for the
set of the 30 cryptocurrencies. This fit is comparable to the cross-sectional fit (about 22%)
of a model with Bitcoin’s return, the size factor, and the momentum factor. Further, the
explanatory power of the blockchain-based factors is not subsumed by the cryptocurrency
return-based factors. Specifically, a model with all five factors has a cross-sectional fit of
about 42%, while the computing power and network factors remain significant.
We also examine the cross-sectional fit of the factor models across time. We find that
the models that include the gCP and gN ET factors either have similar or higher cross-
sectional fit than the three-factor model with Bitcoin’s return, size, and cryptocurrency
momentum. We also find that the pricing ability of the blockchain-based factors improves
over time. This evidence suggests that as the market matures, the blockchain-based factors
become increasingly more important for the cross-section of cryptocurrency expected returns.
Overall, our findings are consistent with our conjecture that aggregate computing power and
network growth are important sources of risk for cryptocurrencies.
We conclude with various robustness tests. First, to ensure that Bitcoin’s fundamentals
are not driving the significance of the blockchain-based factors, we construct versions of the
computing power and network factors that exclude Bitcoin’s blockchain measures. Second,
we expand our sample of 30 test cryptocurrencies with an additional 22 currencies. Reli-
able data for these currencies are only available for a shorter time period (i.e., 1/6/17 to
5/28/21). In both robustness tests, we estimate FMB regressions using GMM. We find that
the computing power and network factors, as well as their Bitcoin-free versions, have positive
risk prices. They also explain a similar or a larger portion of the cross-sectional variation
in expected returns than models with the three cryptocurrency return-based factors (i.e.,
Bitcoin’s return, size and momentum).
4Third, we examine the robustness of the factor betas of the computing power and network
factors by expanding the set of control factors. Specifically, we estimate factor regressions
with Bitcoin’s return, the cryptocurrency size and momentum factors, as well as factors
based on Google searches, Reddit activity, aggregate trading volume, geopolitical risk, and
the three U.S. Fama-French equity factors. We also control for the lead and lag values of
gCP and gN ET as well as the lead and lagged returns of the respective cryptocurrencies.
We find that when controlling for these 16 additional factors, the estimated betas of gCP
and gN ET and their Bitcoin-free counterparts remain positive and statistically significant.
Our work makes several contributions to the literature. We are the first to use aggregate
blockchain characteristics in asset pricing tests and show that they are related to cryptocur-
rency returns. To the contrary, existing studies suggest that cryptocurrencies’ returns are
driven by investor sentiment (e.g., Cheah and Fry (2015)). This evidence is not surprising
since many studies focus on Bitcoin, which is susceptible to manipulation (e.g., Griffin and
Shams (2020)). For large cryptocurrencies, like Bitcoin, there are also price differences across
exchanges (Makarov and Schoar, 2020). Compared to this work, our goal is not to study a
handful of major cryptocurrencies or to examine price differences of a currency across dif-
ferent exchanges. Instead, we consider a larger set of currencies (52 in total) and examine
whether the aggregate blockchain factors are related to their average returns.
In a related paper, Liu et al. (2021) argue that cryptocurrency returns are explained
by factors related to a cryptocurrency market portfolio, a size factor, and a momentum
factor. These factors are return generated and are perceptible to the criticisms of Cochrane
(2011) and Harvey, Liu, and Zhu (2016) about the lack of economic interpretation of return-
generated factors. In contrast, we use asset pricing factors based on blockchain fundamentals,
which have theoretical foundations (e.g., Biais et al. (2020), Pagnotta (2021)). The pricing
ability of these blockchain-based factors holds after controlling for return-based factors such
as Bitcoin’s return, size, and momentum.
Further, Liu and Tsyvinski (2020) show that cryptocurrency returns are affected by
Bitcoin’s network but not by proxies related to Bitcoin’s production. Their main production
5proxies are the cost of electricity in the U.S. and China, and the prices of Bitmain Antminer,
a Bitcoin mining hardware. Our work is different along many dimensions. First, Liu and
Tsyvinski (2020) do not use hashrates to capture the resources expended for mining. Instead,
we use hashrates because they can be measured daily whereas electricity costs or hardware
prices are not available at high frequencies since they do not change in real time. Hashrates
are also available for all mineable currencies. Thus, aggregate hashrates provide broad
and accurate information about the current mining activity of the market. Furthermore,
hashrates are advocated by theoretical models as an important measure of blockchain security
(e.g., Pagnotta and Buraschi (2018), Pagnotta (2021), Prat and Walter (2021)).
Second, we go beyond Bitcoin and consider the blockchain characteristics of nine addi-
tional currencies. Third, Liu and Tsyvinski (2020) use data until 2018 while our analysis
extends to May 2021. Considering a more recent sample is important because before 2018
many new currencies emerged, which initially had high returns that are not representative
of expected returns.4 With post-2018 data, we capture a more mature period of the market
that is more informative about the long-term sources of risk.
Finally, our balanced-panel approach is different from the approach of Liu and Tsyvinski
(2020) who update their sample as currencies enter and exit from the market. However,
turnover in the universe of currencies is significant and not random. Currencies with small
market shares disappear as miners do not maintain their blockchains. Others are introduced
to capitalize on market upswings. Some disappear due to fraud, persistent hacks, or delistings
from multiple exchanges. Such non-random turnover creates biases not easily addressed
econometrically.5 Given the underlying econometric complexities, we opt for the balanced-
panel approach, which does not create biases in standard asset pricing tests.
Our findings are consistent with existing models for cryptocurrency prices. Pagnotta
and Buraschi (2018) link cryptocurrency prices to blockchain trustworthiness, defined as the
absence of fraud and protection from cyber-attacks, and network externalities, captured by
4
Figure 2 in Liu and Tsyvinski (2020) illustrates this pattern in returns before and after late 2017.
5
See Fitzgerald, Gottschalk, and Moffitt (1998), Hirano, Imbens, Ridder, and Rubin (2001), and Baltagi
(2008) for proposed remedies to sample attrition.
6the number of users. Sockin and Xiong (2020) note that the “trustless” nature of decentral-
ized networks contributes to their value. Biais et al. (2020) build a model connecting the
fundamental value of cryptocurrencies to transactional benefits and the risk of a hack. They
estimate their model with a structural econometric approach using data on Bitcoin.
Pagnotta (2021) sets up a model predicting that the price of proof-of-work currencies
should be related to their blockchain security, which can be captured by their hashrates.
He also finds that Bitcoin’s prices go through booms and busts that seem unrelated to
hashrate changes. Complementing the above papers, we capture blockchain trustworthiness
and security using computing power and transaction benefits using the size of the network.
In related research, Yermack (2017) argues that blockchain usage improves corporate
governance. Abadi and Brunnermeier (2018) study record-keeping via distributed ledgers and
Schilling and Uhlig (2019) study the monetary policy implications of Bitcoin’s production.
Biais et al. (2019) and Prat and Walter (2021) analyze the equilibrium behavior of miners.
Cong and He (2019) highlight how blockchains allow for efficient execution of contracts
and Chiu and Koeppl (2019) argue that blockchains improve the settlement of securities.
Easley, O’Hara, and Basu (2019) show that transaction fees paid to miners become more
important as more blocks are being mined. Foley, Karlsen, and Putniņš (2019) find that
before 2013 many of Bitcoin’s transactions were related to illegal activities. Howell, Niessner,
and Yermack (2019) and Gan, Tsoukalas, and Netessine (2021) study initial coin offerings.
Cong et al. (2020) relate the value of cryptocurrency tokens to their transactional demand.
Cong, He, and Li (2020) highlight the high energy costs of proof-of-work blockchains.
Alsabah and Capponi (2020) study proof-of-work protocols and find that the mining industry
has moved towards centralization as opposed to decentralization. Lastly, Härdle, Harvey,
and Reule (2020) provide a general overview of cryptocurrencies. The above studies mostly
focus on micro-level aspects of the cryptocurrency market. In contrast, we adopt a more
aggregate approach and examine the determination of the cross-section of cryptocurrency
expected returns using aggregate blockchain-based factors.6
6
In other related work, Chod, Trichakis, Tsoukalas, Aspegren, and Weber (2020) and Cui, Gaur, and Liu
(2020) examine how blockchains can improve supply-chains. Tsoukalas and Falk (2020) study the optimality
7The rest of the paper is organized as follows. Section 1 describes the data. Sections 2
and 3 respectively present the asset pricing factors and the asset pricing paradigm we use.
Section 4 reports results from factor regressions and Section 5 presents the cross-sectional
analysis. Section 6 includes robustness tests and Section 7 concludes the paper.
1 Data Description and Summary Statistics
This section describes the data and reports summary statistics for the main variables.
1.1 Balanced Panel Approach and Data Reliability
In our empirical analysis, we adopt a balanced-panel approach. Specifically, the sample starts
on 9/4/2015 since many cryptocurrencies had been introduced by the middle of 2015. The
sample ends on 5/28/2021. Our sample is long enough to allow for meaningful estimations
of time-series factor regressions. Further, it includes enough cryptocurrencies to allow for
meaningful estimations of the cross-sectional regressions of expected cryptocurrency returns.
Because the cryptocurrency market is new, we carefully construct our sample only using
high quality data. Data quality is a major concern because turnover in the universe of
cryptocurrencies is significant and not random. Currencies with small market shares typically
disappear. Other get delisted due to fraud or persistent hacks.
To illustrate the high volatility in the sample of cryptocurrencies, we describe how the
sample of the top 100 currencies, reported by Coinmarketcap at the beginning of our sample
(September 4, 2015) has changed. Out of the top 100 currencies on September 4, 2015,
Coinmarketcap stopped tracking 32 of them (as of May 28th, 2021), which suggests that
they were either defunct, fraudulent, or they had negligible trading volume. The rank of
of token-weighted voting. Iyengar, Saleh, Sethuraman, and Wang (2020) analyze the welfare implications of
blockchain adoption while Roşu and Saleh (2021) and Saleh (2021) study Proof-of-Stake blockchains. Our
work also complements theoretical (Weber, 2016; Athey, Parashkevov, Sarukkai, and Xia, 2016; Huberman,
Leshno, and Moallemi, 2019; Jermann, 2021; Routledge, Zetlin-Jones, et al., 2018), empirical (Wang and
Vergne, 2017; Stoffels, 2017; Mai, Shan, Bai, Wang, and Chiang, 2018; Auer and Claessens, 2018; Borri, 2019;
Borri and Shakhnov, 2019; Hu, Parlour, and Rajan, 2019), and other work on cryptocurrencies (Corbet,
Lucey, Urquhart, and Yarovaya, 2019; Shanaev, Sharma, Ghimire, and Shuraeva, 2020).
8many of the remaining 68 dropped significantly with 18 dropping below rank 100 and 38 even
dropping below rank 1,000. Out of the remaining 12 currencies, three of them are stablecoins
that are linked 1:1 to the U.S. Dollar or the Chinese Yuan and are therefore excluded from our
asset pricing tests. The remaining nine are all currently in the top 100 and are in our sample
along with Vertcoin, which is currently ranked around 506. To minimize biases related to
such high sample turnover, we adopt a balanced-panel approach and choose cryptocurrencies
for which we can obtain reliable and vetted data for our entire sample period.
The source of the original cryptocurrency data is also important since many exchanges are
unreliable and report manipulated data.7 For instance, Coinbase, the only publicly-traded
exchange, in 2015 and 2016 primarily listed only 5 currencies (Bitcoin, Litecoin, Ethereum,
Ripple, and Dash). Today, Coinbase only lists 54 currencies (exclusive of stablecoins), most
of which were added only very recently in late 2020 and early 2021.
To ensure high data quality, we obtain data from Coinmetrics.io. This data provider
does not report the blockchain characteristics of currencies that are fraudulent or defunct.
It also reports price information from the most reputable exchanges. Specifically, it uses 35
criteria to filter out illiquid or unreliable exchanges. Coinbase, Kraken, and Bittrex are some
of the exchanges used by Coinmetrics.io. Exchanges like CoinBene, OkEX, IDAX, Exrates,
and BitForex, which have been found to report suspicious volume data, are not part of our
sample. The exchanges selected by Coinmetrics.io are similar to those in Makarov and Schoar
(2020). Because of the strict criteria imposed, Coinmetrics reports data for a smaller sample
of currencies compared to other data providers. For example, Coinmarketcap, another data
provider used by existing studies (e.g., (Liu and Tsyvinski, 2020; Liu et al., 2021)), generally
has not imposed strict selection criteria on the exchanges from which it sources data or
cryptocurrencies it follows. For this reason it reports data on over 10,000 cryptocurrencies
(as of May 28, 2021).
Our second source of data is Bittrex, which is one of the most trusted exchanges.8 We
7
See Bitwise’s report to the SEC at https://static.bitwiseinvestments.com/Research/Bitwise-Asset-
Management-Analysis-of-Real-Bitcoin-Trade-Volume.pdf.
8
See the list provided by Bitwise Asset Management at https://www.bitcointradevolume.com/ and a list
by FTX, a cryptocurrency derivatives exchange, at https://ftx.com/volume-monitor.
9use Bittrex because it has historically listed plenty of cryptocurrencies compared to other
top U.S. exchanges. In 2015, for example, Bittrex listed over 100 cryptocurrencies, of which
30 were still present as of May 28th, 2021, the last day of our sample. For comparison,
Coinbase and Gemini, two regulated U.S.-based crypto-exchanges, only listed the top 3
cryptocurrencies in 2015.
Overall, we focus on a select sample of currencies that are neither frauds nor are defunct
and have reliable data for our entire sample period. This is different from other studies (Liu
and Tsyvinski, 2020; Liu et al., 2021) that use all the cryptocurrencies listed on sources such
as Coinmarketcap. Our approach is similar to traditional asset pricing studies with equity
data that exclude stocks that were delisted, were thinly traded, or had very low prices.
1.2 Baseline Cryptocurrencies
We construct our blockchain-based asset pricing factors using ten baseline currencies. The
mineable currencies in the baseline sample are Bitcoin, Ethereum, Litecoin, Dash, Dogecoin,
Vertcoin, and Monero. The non-mineable currencies or ‘tokens’ (Cong et al., 2020) are Ripple
(XRP), NEM, and Maidsafecoin.
These currencies are among the ten largest ones in terms of market capitalization at the
beginning of our sample period (9/4/2015) that also have reliable and vetted data on prices
and blockchain characteristics for our entire sample period (9/4/2015 to 5/28/2021). Specif-
ically, they constitute up to 98% of the market capitalization of the top 30 cryptocurrencies
during our sample period (see Table 1).9 They also span a wide cross-section of return
variation.10 Given their size and consistent presence in the market, the evolution of their
blockchain characteristics is a reliable indicator of the state of the cryptocurrency market.
9
We calculate their capitalization relative to the top 30 cryptocurrencies as the aggregate number of
cryptocurrencies has continuously been expanding from about 600 on September 4th, 2015 to over 10,000 on
May 28th, 2021. The aggregate capitalization of currencies outside the top-30 has historically been relatively
small comprising around 1-5% of the aggregate market.
10
See Table 2 and Panel A of Table A2 of the Appendix.
101.3 Blockchain Characteristics
In this section, we describe the two blockchain-based characteristics, aggregate computing
power and network size, which we compute using the sample of ten baseline cryptocurrencies.
1.3.1 Computing Power, Resources, and Security
Computing power is measured in megahashes (106 hashes). We obtain computing power
data for seven baseline cryptocurrencies from Coinmetrics.io. There is no data on com-
puting power for Ripple (XRP), NEM (XEM), and Maidsafecoin (MAID) since they are
non-mineable currencies that do not rely on the Proof-of-Work mining model used by mine-
able currencies. We construct the weekly growth rates of computing power by taking the
first differences of the log values of the hashrates between consecutive Fridays. To reduce
the influence of outliers, we winsorize the growth rates at the 1% and 99% levels, consistent
with Liu and Tsyvinski (2020).
Computing power is an important blockchain characteristic of Proof-of-Work mineable
currencies as it affects the reliability and security of their blockchains. For instance, when
computing power is high, miners are expending plentiful resources to efficiently and securely
record transactions. Further, a blockchain can be hacked if rogue miners amass more than
50% of the existing computing power. This is highly improbable for cryptocurrencies with
high computing power like Bitcoin (Kroll, Davey, and Felten, 2013; Eyal and Sirer, 2018).
We also treat computing power as a sufficient statistic for the resources expended on
operating a blockchain. Consistent with our intuition, De Vries (2018) and Saleh (2021) note
that the annual energy consumption of the computational resources spent on mining Bitcoin
is comparable to that used by countries such as Austria and Ireland. Even if computing power
is a proxy for expended cryptomining resources, detailed data on the real resources expended
by miners (e.g., electricity, hardware costs) is not available for all cryptocurrencies. To the
contrary, accurate hashrate (i.e., computing power) data is available for all the baseline
mineable cryptocurrencies in our sample.
111.3.2 Network Size and Adoption Levels
Another important characteristic of a blockchain is the size of its network, which is related
to the number of users of the blockchain. Analogous to established fiat currencies that are
accepted by a large number of entities as a means of transaction, a large network is indicative
of greater adoption of the cryptocurrency. A large number of unique blockchain users is also
suggestive of enhanced liquidity of the respective cryptocurrency.
Network size is the number of unique active addresses that transact on the blockchain.
We obtain this data from Coinmetrics.io.11 In the Coinmetrics data, active addresses with
multiple transactions are not double-counted. We construct weekly network growth rates by
taking the first differences of the log values of the unique active addresses between consecutive
Fridays. We winsorize these first differences at the 1% and 99% levels.
An alternative measure of the adoption level of a blockchain is the number of daily
transactions. However, this measure magnifies the role of a few highly active addresses, such
as exchanges that conduct a large number of transactions on a daily basis when receiving
or sending cryptocurrencies. We acknowledge that the number of unique active addresses
is also not a perfect measure of cryptocurrency adoption since a portion of active addresses
arises from multiple transactions meant to obfuscate the movements of funds. Nevertheless,
we use this measure because it is available for all the baseline currencies (excluding Monero).
1.4 Cryptocurrency Test Assets
The sample of test assets includes 30 currencies. These are the ten baseline currencies, from
which we derive the blockchain-based factors, and 20 additional cryptocurrencies, whose
blockchain characteristics are not included in the blockchain-based factors. Using test assets
whose blockchain characteristics are not included in the blockchain-based factors should help
alleviate endogeneity concerns.
We report the list of the 20 additional currencies in Panel B of Table A2 of the Appendix.
11
We do not use the network size of Monero because it masks transactions across multiple addresses, which
dilutes the true address count (Narayanan, Bonneau, Felten, Miller, and Goldfeder, 2016).
12These currencies have reliable price data on the Bittrex exchange for our entire sample period
from 9/4/15 to 5/28/21. To be included in the sample, we also require that their market
capitalization rates are at least 50,000 USD at the beginning of the sample period. We use
a 50,000 USD filter because as of September 4th, 2015, there were only 27 cryptocurrencies
with market capitalizations greater than USD 1 million and only about 15 of them were listed
on Bittrex. Further, in Section 6.2, we use another 22 currencies (i.e., 52 cryptocurrencies
in total), whose return data is available for a shorter time period (1/6/2017 to 5/28/2021).
1.5 Cryptocurrency Return Data
We compute weekly returns for all the baseline 10 cryptocurrencies using their daily prices.
We obtain USD-denominated daily prices from Coinmetrics.io, which collects prices from
exchanges worldwide and weights them by the trading volume of each exchange. For the
additional 20 cryptocurrencies in our sample of test assets, we obtain their end-of-day prices
from Bittrex.12
We use the daily prices to compute weekly returns by cumulating the daily returns of
7-day periods ending on Fridays. We use weekly returns to mitigate any day-of-the-week
effects (e.g., Biais et al. (2020)) and problems with outliers. We set the end of the 7-day
period to Friday following the Friday convention in the weekly Fama-French factors.
1.6 Summary Statistics
The main variables in our tests are weekly cryptocurrency returns and growth rates of com-
puting power and network size. We report their descriptive statistics in Table 2. According to
Panel A, the baseline cryptocurrencies have positive average returns. They also demonstrate
significant return fluctuations as their standard deviations are larger than their respective
means and medians. This finding is not surprising given that cryptocurrencies are a new
asset class. For instance, Pástor and Veronesi (2003) find that the return volatilities of young
12
For most currencies on Bittrex, we obtain their BTC-denominated prices, which we multiply by Bitcoin’s
U.S.D. value for the same day-end to obtain their USD-equivalent price.
13firms are much greater than their average returns. The growth rates of computing power
and network also have standard deviations that are greater than their respective means.
We offer additional summary statistics for the extended samples of 20 and 22 currencies
in Panels B and C of Table A2 of the Appendix, respectively. These statistics show that the
additional test assets include a wide range of currencies in terms of size, average returns, and
return volatilities. To ensure that our test assets are not highly correlated, we report in Table
A3 of the Appendix the correlations among the returns of the ten baseline cryptocurrencies
along with their minimum, average, and maximum correlations with the extended set of 20
cryptocurrencies. These correlations are not excessively high ranging from 0.03 to 0.54.
2 Asset Pricing Factors
Our analysis centers around two blockchain-based factors and three cryptocurrency return-
based factors, which we describe next.
2.1 Blockchain-Based Factors
The blockchain factors are based on rank-weighted averages of the growth rates of computing
power and network size of the ten baseline currencies.13 We denote the average growth in
computing power and network size by gCP and gN ET , respectively. We use rank-weighted
averages to ensure that the factors are not dominated by the largest currencies. The more
traditional value-weighted approach implies that our aggregate factors would simply be cap-
turing the CP and NET growth of BTC that dominates the market in terms of capitalization.
Hence, the value-weighted approach ignores the blockchain characteristics of smaller cryp-
tocurrencies that are important to describe the overall state of the cryptocurrency market.
Liu and Tsyvinski (2020) find that Bitcoin’s network is related to cryptocurrency returns
while its computing power is not. To verify that our results are not affected by Bitcoin’s
13
For example, for computing power, we rank the seven Proof-of-Work currencies with computing power
using their capitalization rates as of the prior week. We assign ranks 1 to 7 to the currencies with the lowest
to highest capitalization. We transform the ranks into weights and compute rank-weighted averages.
14computing power and network size, we also construct factors that exclude the blockchain
measures of Bitcoin. We denote the factors that exclude Bitcoin’s computing power and
network growth by gCP \ BT C and gN ET \ BT C, respectively.
2.2 Cryptocurrency Return-Based Factors
We consider three cryptocurrency return-based factors suggested by the literature (e.g., Liu
and Tsyvinski (2020), Liu et al. (2021)). The first one is the return of Bitcoin (BTC),
which is the most prominent cryptocurrency. It constitutes 48% to 85% of the aggregate
market capitalization of cryptocurrencies (see Table 1). Because of its large size, Bitcoin
is a good proxy for the cryptocurrency market factor of Liu et al. (2021).14 The second
cryptocurrency return-based factor is a size factor (Size) constructed following Liu et al.
(2021). The third one is a momentum factor (M om) constructed following Jegadeesh and
Titman (1993). Detailed definitions of these factors are in Table A1 of the Appendix.
2.3 Descriptive Statistics and Correlations
Table 3 reports summary statistics and correlations for the various asset pricing factors. In
the case of the blockchain-based factors, the average weekly growth in aggregate computing
power (gCP ) is 0.025 with a standard deviation of 0.055. The average weekly growth in
aggregate network size (gN ET ) is 0.006 with a standard deviation of 0.126. We also find
that gCP is almost orthogonal to gN ET with a correlation of 0.07, which suggests that the
two factors capture different aspects of the cryptocurrency market.
3 Asset Pricing with Aggregate Blockchain Factors
With our sample of factors and test currencies, we examine whether aggregate computing
power and network growth are important asset pricing factors for cryptocurrency returns.
14
These authors note that the return of Bitcoin exhibits similar statistical properties with the cryptocur-
rency market.
153.1 Stochastic Discount Factor
We frame our tests within the stochastic discount factor (SDF) paradigm. Under general
conditions, there exists an SDF Mt , which can price the returns of any asset i, Ri,t . That is,
E Ri,t Mt = 1. (1)
This pricing relationship dates back to Rubinstein (1976), Lucas (1978), Ross (1978), Har-
rison and Kreps (1979), and Hansen and Richard (1987). Tirole (1985) also finds a similar
SDF representation when pricing fiat money. Biais et al. (2020) extend the model of Tirole
(1985) to include a cryptocurrency. Moreover, the pricing equation (1) implies that the
theoretical expected returns are related to the covariances between returns and the SDF:
E Ri,t = 1 − Cov(Ri,t , Mt ) /E Mt . (2)
The functional form of the SDF is dictated by investor preferences. It also depends on
investor portfolio and consumption decisions and it reflects the evolution of the marginal
utility of total wealth. Since the preferences for cryptocurrency investors are unobservable,
we cannot pin down the functional form of Mt and directly estimate the pricing equation
(2). Therefore, we follow Cochrane (2005, 2011) and assume that Mt is a linear function of
observable factors. The factors are aggregate economic indicators that affect the portfolio
decisions and total wealth of investors. Specifically, Mt is defined as
Mt = 1 − (ft − E[ft ])0 γ, (3)
where ft are factors centered around their means and γ is the vector of SDF parameters.
The linear SDF in equation (3) implies that the pricing model (2) is:
E Ri,t = 1 + Cov Ri,t , (ft − E[ft ])0 γ = 1 + E Ri,t (ft − E[ft ])0 γ.
(4)
Multiplying and dividing equation (4) by the covariance matrix of the factors, E (ft −
E[ft ])(ft − E[ft ])0 , we obtain the beta representation of the pricing equation:
E Ri,t = 1 + βi0 λ.
(5)
−1
Above, βi0 = E Ri,t (ft − E[ft ])0 E (ft − E[ft ])(ft − E[ft ])0
is the vector of factor betas
16= E (ft − E[ft ])(ft − E[ft ])0 γ is the vector of risk prices.
for cryptocurrency i and λ
3.2 Beta Pricing Model and Cryptocurrency Expected Returns
The pricing equation (5) is the basis of our empirical tests. In our set up, the factors ft
include the aggregate computing power and aggregate network growth rates. We conjecture
that these factors affect the cryptocurrency SDF because according to existing theoretical
models they should be positively correlated with the wealth of cryptocurrency investors.
Specifically, Pagnotta and Buraschi (2018) and Biais et al. (2020) predict a positive relation-
ship among computing power, network size, and prices. Therefore, the wealth of the average
cryptocurrency investor should comove with aggregate computing power and network size.
In this setting, investors require high premia for cryptocurrencies whose returns follow
aggregate computing power and network growth. That is, risky cryptocurrencies are the ones
whose returns covary with the aggregate blockchain characteristics. The relation between
risk premia and the covariances with aggregate blockchain characteristics should hold for
mineable and non-mineable currencies, even if the latter do not require the consumption
of computing power for mining. As long as aggregate computing power affects the overall
wealth of cryptocurrency investors, the SDF paradigm predicts that aggregate computing
power should impact the risk premia of all currencies, even the non-mineable ones.15
Theoretical models (e.g., Biais et al. (2019), Biais et al. (2020)) also suggest that comput-
ing power and network size should be procyclical factors. Therefore, the blockchain factors
should have positive exposures (β 0 s) and positive risk prices (λ’s) in the pricing equation
(5). Furthermore, for the blockchain factors to be valid asset pricing factors they should ex-
plain a significant portion of the cross sectional variation in expected cryptocurrency returns
(Daniel and Titman (1997); Lewellen et al. (2010)). We examine these predictions next.
15
This is a reasonable assumption because the development of mining and blockchain technology can
have positive externalities for non-mineable currencies. For example, greater development in a mineable
cryptocurrency like Bitcoin can allow for batches of transactions using non-mineable cryptocurrencies like
Ripple to be more securely aggregated and settled on Bitcoin’s blockchain. Therefore, the growth in com-
puting power of a mineable currency can improve the transaction benefits of non-mineable currencies, which
ultimately increases the value of non-mineables.
174 Factor Regressions and Risk Exposures
In this section, we present the results of our factor regressions.
4.1 Graphical Comovement Evidence
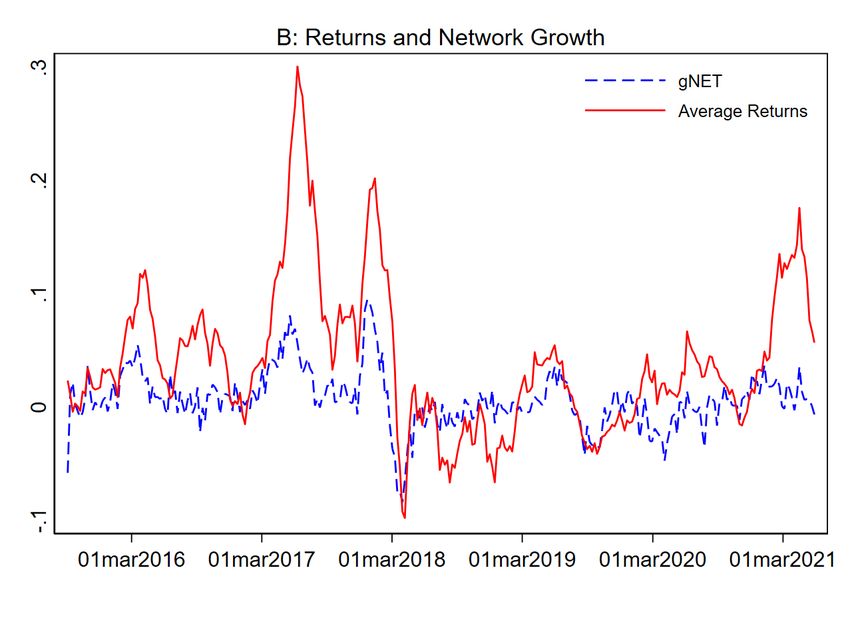
To set the stage for the factor regressions, we first provide some graphical evidence of co-
movement between returns and the blockchain-based factors. Specifically, Figure 1 plots
12-week moving averages of the returns of the 30 test assets and the aggregate growth rates
of computing power and network. Panel A shows the graph for gCP and Panel B reports
the plot for gN ET . In these figures, gCP and gN ET follow closely the average returns of
the 30 cryptocurrencies. This pattern suggests that the gCP and gN ET factors should have
positive beta estimates in the factor regressions.
4.2 Factor Model Estimates
We use the 30 test assets and estimate various panel factor regressions, which we report
in Table 4. We estimate three-factor models with the cryptocurrency return-based factors
and two-factor models with the blockchain-based factors. In the three-factor models in
column (1), we find that Bitcoin’s return and the cryptocurrency size factor are statistically
significant. In particular, the coefficient on Bitcoin’s return is 0.84 (t-statistic = 11.00)
and the coefficient on the size factor is 0.21 (t-statistic = 1.94). Momentum effects are not
significant in our sample.
More importantly, in the two-factor models in column (2), we find that the exposures
of the gCP and gN ET factors are statistically significant at the 1% level. In particular,
the coefficients on gCP and gN ET are 0.65 (t-statistic = 3.92) and 0.34 (t-statistic =
5.13), respectively. We document similar results in column (3) when using the gCP \ BT C
and gN ET \ BT C factors, which are versions of gCP and gN ET that exclude Bitcoin’s
computing power and network growth.
18To ensure that the significance of the gCP and gN ET factors is unrelated to the return-
based factors, we estimate five-factor models with all the factors. We report these results
in columns (4) to (5) of Table 4. We find that the estimates of the two blockchain factors
remain statistically significant. In sum, the computing power and network factors comove
with cryptocurrency returns and their significance is not affected when controlling for the
cryptocurrency return-based factors.
5 Expected Returns and Prices of Risk
In the next set of tests, we estimate cross-sectional regressions of expected cryptocurrency
returns on factor betas, which are estimated from the time series. We implement cross-
sectional tests because spurious factors can have significant beta estimates in time series
factor regressions but they usually have poor cross-sectional fit (Daniel and Titman (1997);
Lewellen et al. (2010)). For example, Daniel and Titman (1997) suggest that the covariance
structure of returns with the true asset pricing factors should line up with the average returns
of the test assets. Cross-sectional tests precisely focus on estimating the relation between
betas and average returns.
5.1 Rolling Fama-MacBeth Tests
We conduct cross-sectional tests following the methodology of Fama and MacBeth (1973)
(FMB). Fama and MacBeth estimate rolling regressions by allowing for the risk-return trade-
off to evolve across time. The FMB approach is appropriate for our analysis because the
cryptocurrency market is relatively new and constantly evolving. For example, until 2018,
the cryptocurrency market was in a ‘fledgling’ state. As such, the price dynamics at the
beginning of our sample are quite different from the later part. In particular, cryptocurrency
prices were generally increasing before 2018, with newly introduced currencies often having
very high returns in the first weeks of trading. These return patterns are depicted in Figure
2 of Liu and Tsyvinski (2020). Their figure shows that the returns of their cryptocurrency
19market factor were continuously increasing until the end of 2017 and then shifted downwards
around early 2018, reflecting a significant change in the cryptocurrency market. The FMB
approach can account for these changes in market conditions by allowing the factor betas
and prices of risk to vary over time.
5.2 FMB via GMM
To implement the FMB methodology, we follow Cochrane (2005) and use the following GMM
system:
E Rt − α − β(ft − E[ft ])
I 0N (K+1)×N
N (K+1) × E Rt − α − β(ft − E[ft ]) ⊗ (ft − E[ft ])
= A × gT = 0. (6)
0K×N (K+1) β0
E Rt − 1 − βλ
Above, N is the number of cryptocurrency test assets and K (K < N ) is the number of
factors. The matrix A is a N (K + 1) + K × N (K + 2) weighting matrix and gT is the
N (K + 2) × 1 vector of moment conditions, which are functions of α, β, and λ. The vector
α is the N × 1 vector of time series alphas, β is the N × K matrix of time series betas, and
λ is the vector of the K risk prices.
The first two sets of moments in gT estimate the time series alphas and betas, respectively.
The last set of moments runs the cross-sectional regression of expected returns on factor betas
to estimate the prices of risk. The GMM system is over-identified since the first N × (K + 1)
conditions exactly identify the N time series alphas and the N × K time series betas, while
the final N moments identify the K prices of risk.
We embed the GMM system in the FMB estimation. In particular, we set the rolling
time window to 156 weeks, i.e., approximately three years. The window is updated weekly
resulting in 145 cross-sectional regressions. The estimation window is long enough to pro-
vide reliable estimates of the factor exposures but short enough to enable us to estimate a
sufficiently large number of cross-sectional regressions. For each window, we solve the GMM
system of equation (6) that simultaneously estimates factor exposures and prices of risk. The
20rolling estimation yields a time series of risk estimates λt . We follow Fama and MacBeth
(1973) and report the average risk estimate λ̄. We compute the standard error of λ̄ following
the Newey and West (1987) variance correction.16
The GMM approach is an improvement over the original two-step methodology of Fama
and MacBeth (1973), which was based on ordinary least square (OLS) regressions (Cochrane,
2005). Fama and MacBeth (1973) first run OLS time series regressions of test asset on factors
to obtain the β’s. Next, they separately estimate a series of repeated cross-sectional OLS
regressions of average returns on factor betas to identify the λ’s. Instead, the GMM approach
simultaneously estimates the time series and cross-sectional regressions and accounts for
the fact that the β’s, i.e., the independent variables in the cross-sectional regressions, are
generated regressors.
5.3 FMB Estimation Results
We estimate the GMM system with the main factors from our analysis in Section 4. These
factors are the computing power and network factors (gCP and gN ET ) along with their
Bitcoin-free versions (gCP \ BT C and gN ET \ BT C). We also control for the cryptocur-
rency return-based factors: Bitcoin’s return (BT C), the cryptocurrency size factor (Size),
and cryptocurrency momentum factor (M om). We estimate two-factor models with the
blockchain-based factors, three-factor models with the return-based factors, and five-factor
models with all the factors. We tabulate the FMB results in Table 5.
We find that the risk-price estimates for M om are insignificant across all models. In con-
trast, all the remaining factors have positive and statistically significant risk-price estimates.
Moreover, in the five-factor models in columns (4) and (5), controlling for the return-based
factors has almost no impact on the statistical significance of the risk-price estimates of
computing power and network.
We also document that the two-factor models with the blockchain-based factors explain
a significant portion of the variation in expected returns (about 28%). Their fit is marginally
16
In the variance correction, we use 40 lags because the price of risk estimates are persistent.
21better than that of the three-factor model with the BT C, Size, and M om factors (about
22%). This finding is important since we are comparing two fundamentals-based factors,
which have full economic interpretation, against three return-generated factors. The five-
factor models have the highest fit (about 42%), which suggests that the pricing power of the
blockchain-based factors is almost orthogonal to that of the return-based factors.
We further examine the fit of the various models in Figure 2. The figure presents the
theoretically-implied expected returns (1 + β 0 λ) against sample average returns, averaged
across the 145 rolling regressions. The figure confirms that the two blockhain-based factors
(gCP and gN ET in Panel A) can explain the cross-section of cryptocurrencies just as well
as the three return-generated factors (Bitcoin, size, momentum in Panel B). Further, the
specification that combines all five factors (Panel C) performs the best.
5.4 Time-Variation in Model Fit
Over our sample period, the cryptocurrency market has been evolving from a fledgling state
pre-2018 to a more established market post-2018. This evolution should affect the explana-
tory power of the asset pricing models. This intuition follows from Pástor and Veronesi
(2003, 2006) who argue that valuation uncertainty is elevated for new assets, which can lead
to price run-ups at the time of their initial public offerings. With time, returns begin to
line up with fundamentals because valuation uncertainty dissipates as investors get access
to more information about the new assets. Overall, the pricing ability of the aggregate
blockchain measures should strengthen as the market matures.
We assess the fit of the models across our sample period in Figure 3, where we plot
the time series of adjusted-R2 ’s from the 145 cross-sectional rolling regressions. The figure
shows that the explanatory power of the models consistently increases across time. After July
2019, the model with the two blockchain-based factors almost always has higher adjusted-
R2 ’s than the three-factor model with BT C, Size, and M om. Since January 2021, the
two specifications exhibit similar cross-sectional performance. This is probably due to the
extreme fluctuation of cryptocurrency prices during the most recent period (i.e., January,
22You can also read