SciGRID_gas: The raw INET data set - Release 1.0 J.C. Diettrich & A. Pluta & W. Medjroubi - eLib
←
→
Page content transcription
If your browser does not render page correctly, please read the page content below
SciGRID_gas: The raw INET data set
                                    Release 1.0

        J.C. Diettrich & A. Pluta & W. Medjroubi

                                       Sep 07, 2020
CONTENTS
1 Introduction 7
1.1 Project information . . . . . . . . . . . . . . . . . . . . . . . . . . . . . . . . . . . . . . . . . . . . 7
1.2 Background . . . . . . . . . . . . . . . . . . . . . . . . . . . . . . . . . . . . . . . . . . . . . . . . 8
1.3 Project goal . . . . . . . . . . . . . . . . . . . . . . . . . . . . . . . . . . . . . . . . . . . . . . . . 9
1.4 Document overview . . . . . . . . . . . . . . . . . . . . . . . . . . . . . . . . . . . . . . . . . . . 10
2 Data structure 11
2.1 Data structure description . . . . . . . . . . . . . . . . . . . . . . . . . . . . . . . . . . . . . . . . 11
2.1.1 Terminology . . . . . . . . . . . . . . . . . . . . . . . . . . . . . . . . . . . . . . . . . . 11
2.2 Summary . . . . . . . . . . . . . . . . . . . . . . . . . . . . . . . . . . . . . . . . . . . . . . . . . 16
3 Data sources 17
3.1 Non-OSM data . . . . . . . . . . . . . . . . . . . . . . . . . . . . . . . . . . . . . . . . . . . . . . 18
3.2 The InternetDaten (INET) data set . . . . . . . . . . . . . . . . . . . . . . . . . . . . . . . . . . . . 20
3.2.1 Overview of the INET data set . . . . . . . . . . . . . . . . . . . . . . . . . . . . . . . . . 20
3.2.2 Origin of the data . . . . . . . . . . . . . . . . . . . . . . . . . . . . . . . . . . . . . . . . 22
3.2.3 INET CSV file description . . . . . . . . . . . . . . . . . . . . . . . . . . . . . . . . . . . 22
3.2.4 INET data density . . . . . . . . . . . . . . . . . . . . . . . . . . . . . . . . . . . . . . . . 26
3.2.5 Copyright and disclaimer for the INET data set . . . . . . . . . . . . . . . . . . . . . . . . 29
3.3 Data summary . . . . . . . . . . . . . . . . . . . . . . . . . . . . . . . . . . . . . . . . . . . . . . 31
3.4 Summary . . . . . . . . . . . . . . . . . . . . . . . . . . . . . . . . . . . . . . . . . . . . . . . . . 31
4 Appendix 33
4.1 Glossary . . . . . . . . . . . . . . . . . . . . . . . . . . . . . . . . . . . . . . . . . . . . . . . . . 33
4.2 Unit conversions . . . . . . . . . . . . . . . . . . . . . . . . . . . . . . . . . . . . . . . . . . . . . 35
4.3 References for INET data set . . . . . . . . . . . . . . . . . . . . . . . . . . . . . . . . . . . . . . 35
4.4 Location name alterations . . . . . . . . . . . . . . . . . . . . . . . . . . . . . . . . . . . . . . . . 42
4.5 Country name abbreviations . . . . . . . . . . . . . . . . . . . . . . . . . . . . . . . . . . . . . . . 42
4.6 Acknowledgement . . . . . . . . . . . . . . . . . . . . . . . . . . . . . . . . . . . . . . . . . . . . 43
Bibliography 45
iii
SciGRID_gas: The raw INET data set, Release 1.0

How to cite

J.C. Diettrich, A. Pluta, W. Medrjoubi
SciGRID_gas: The raw INET data set
DLR Institute for Networked Energy Systems
Germany
doi: 10.5281/zenodo.3980893

Impressum

DLR Institute for Networked Energy Systems
Carl-von-Ossietzky-Str. 15
26129 Oldenburg
Germany
Tel.: +49 (441) 999 060

CONTENTS                                                                                  1
SciGRID_gas: The raw INET data set, Release 1.0

2                                                 CONTENTS
LIST OF FIGURES
2.1 Data structure for the SciGRID_gas data set . . . . . . . . . . . . . . . . . . . . . . . . . . . . . . . 12
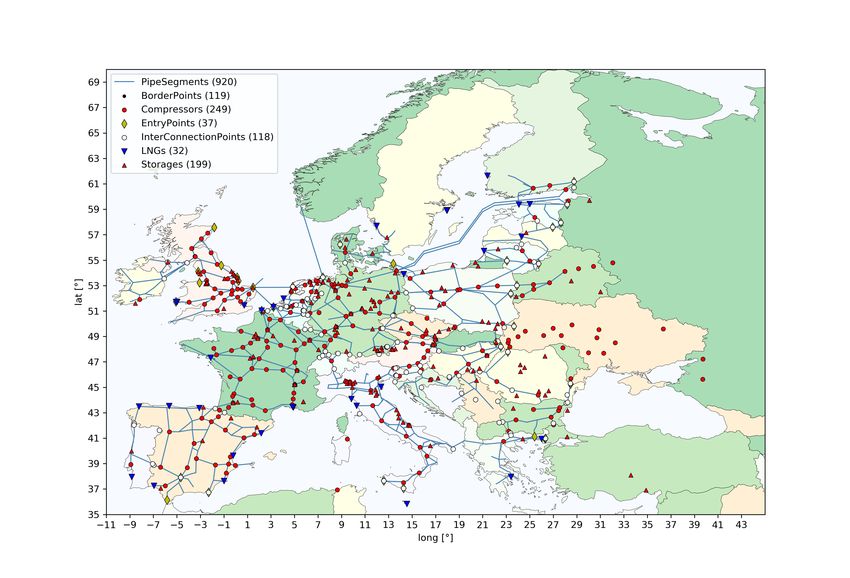
3.1 Map of the INET data set. The legend contains the number of elements for each component. . . . . . 21
3.2 Screenshot of part of the Wikipedia page for the pipeline JAGAL. . . . . . . . . . . . . . . . . . . . 22
3SciGRID_gas: The raw INET data set, Release 1.0 4 List of Figures
LIST OF TABLES

3.1   INET component summary. . . . . . . . . . . . . . . . . . . . . . . . . . . .                                                                      .   .   .   .   .   .   .   .   .   .   .   .   .   20
3.2   INET PipeSegments data density . . . . . . . . . . . . . . . . . . . . . . . .                                                                     .   .   .   .   .   .   .   .   .   .   .   .   .   27
3.3   INET Compressors data density . . . . . . . . . . . . . . . . . . . . . . . .                                                                      .   .   .   .   .   .   .   .   .   .   .   .   .   27
3.4   Summary for the attribute “exact” of component Nodes of the INET data set.                                                                         .   .   .   .   .   .   .   .   .   .   .   .   .   28
3.5   INET Nodes data density . . . . . . . . . . . . . . . . . . . . . . . . . . . .                                                                    .   .   .   .   .   .   .   .   .   .   .   .   .   28
3.6   INET BorderPoints data density . . . . . . . . . . . . . . . . . . . . . . . .                                                                     .   .   .   .   .   .   .   .   .   .   .   .   .   28
3.7   INET InterConnectionPoints data summary . . . . . . . . . . . . . . . . . .                                                                        .   .   .   .   .   .   .   .   .   .   .   .   .   29
3.8   INET LNGs data density . . . . . . . . . . . . . . . . . . . . . . . . . . . .                                                                     .   .   .   .   .   .   .   .   .   .   .   .   .   29

4.1   Dataset abreviations   .   .   .   .   .   .   .   .   .   .   .   .   .   .   .   .   .   .   .   .   .   .   .   .   .   .   .   .   .   .   .   .   .   .   .   .   .   .   .   .   .   .   .   .   33
4.2   Glossary (A) . . . .   .   .   .   .   .   .   .   .   .   .   .   .   .   .   .   .   .   .   .   .   .   .   .   .   .   .   .   .   .   .   .   .   .   .   .   .   .   .   .   .   .   .   .   .   34
4.3   Glossary (B) . . . .   .   .   .   .   .   .   .   .   .   .   .   .   .   .   .   .   .   .   .   .   .   .   .   .   .   .   .   .   .   .   .   .   .   .   .   .   .   .   .   .   .   .   .   .   35
4.4   Unit conversions .     .   .   .   .   .   .   .   .   .   .   .   .   .   .   .   .   .   .   .   .   .   .   .   .   .   .   .   .   .   .   .   .   .   .   .   .   .   .   .   .   .   .   .   .   35
4.5   Country codes . . .    .   .   .   .   .   .   .   .   .   .   .   .   .   .   .   .   .   .   .   .   .   .   .   .   .   .   .   .   .   .   .   .   .   .   .   .   .   .   .   .   .   .   .   .   43

                                                                                                                                                                                                             5
SciGRID_gas: The raw INET data set, Release 1.0 Summary The goal of SciGRID_gas is to develop methods to create an automated process that can generate a gas transmission network data set for Europe. Gas transmission networks are fundamental for simulations by the gas transmission modelling community, to derive major dynamic characteristics. Such simulations have a large scope of application, for example, they can be used to perform case scenarios, to model the gas consumption, to minimize leakages and to optimize overall gas distribution strategies. The focus of SciGRID_gas will be on the European transmission gas network, but the principal methods will also be applicable to other geographic regions. Data required for such models are the gas facilities, such as compressor stations, LNG terminals, pipelines, etc. One needs to know their locations, in addition to a large range of attributes, such as pipeline diameter and capacity, com- pressor capacity, configuration, etc. Most of this data is not freely available. However throughout the SciGRID_gas project it was determined, that data can be found and grouped into two fundamental different groups: a) OSM data, and b) non-OSM data. The OSM data consists of geo-referenced facility data that is stored in the OpenStreetMap (OSM) data base, and is freely available. However, the OSM data set currently contains hardly any other information than the location of the facilities. The Non-OSM data set can fill some of those gaps, by supplying information such as pipeline diameter, compressor capacity and more. Part of the SciGRID_gas project is to mine and collate such data, and combine it with the OSM data set. In addition heuristic tools are required to fill data gaps, so that a complete gas network data set can be generated. This document here describes the so called “InternetData” data set (INET), which is one of the fundamental building blocks of the SciGRID_gas project. The INET data set is the first data set to be published as part of the SciGRID_gas project. This document explains the origin and structure of the data set. In this document, the chapter “Introduction” will supply some background information on the SciGRID_gas project, followed by the chapter “Data structure”, which gives a detailed description of the data structure that is being used in the SciGRID_gas project. Chapter “Data sources” describes the INET data sets. The appendix contains a glossary, references, location name alterations convention and finishes with the table of country abbreviation. 6 List of Tables
CHAPTER

                                                                                                              ONE

                                                                                          INTRODUCTION

SciGRID_gas is a three-year project funded by the German Federal Ministry for Economic Affairs and Energy
[BMWi20] within the funding of the 6. Energieforschungsprogramm der Bundesregierung [BMWi11].
The goal of SciGRID_gas is to develop methods to generate and provide an open-source gas network data set and code.
Gas transmission network data sets are fundamental for the simulations of the gas transmission within a network. Such
simulations have a large scope of application, for example, they can be used to preform case scenarios, to model the
gas consumption, to detect leaks and to optimize overall gas distribution strategies. The focus of SciGRID_gas will
be the generation of a data set for the European Gas Transmission Network, but the principal methods will also be
applicable to other geographic regions.
Both the resulting method code and the derived data will be published free of charge under appropriate open-source
licenses in the course of the project. This transparent data policy shall also help new potential actors in gas trans-
mission modelling, which currently do not possess reliable data of the European Gas Transmission Network. It is
further planned to create an interface to [MMK16] or heat transmission networks. Simulations on coupled networks
are of major importance to the realization of the German Energiewende. They will help to understand mutual influ-
ences between energy networks, increase their general performance and minimize possible outages to name just a few
applications.
This project was initiated, and is managed and conducted by DLR Institute for Networked Energy Systems.

1.1 Project information

    • Project title: Open Source Reference Model of European Gas Transport Networks for Scientific Studies on
      Sector Coupling (Offenes Referenzmodell europäischer Gastransportnetze für wissenschaftliche Untersuchun-
      gen zur Sektorkopplung)
    • Acronym: SciGRID_gas (Scientific GRID gas)
    • Funding period: January 2018 - December 2020
    • Funding agency: Federal Ministry for Economic Affairs and Energy (Bundesministerium für Wirtschaft und
      Energie), Germany
    • Funding code: Funding Code: 03ET4063
    • Project partner: DLR Institute for Networked Energy Systems

                                                                                                                    7
SciGRID_gas: The raw INET data set, Release 1.0
1.2 Background
As of today, only limited data of the facilities of the European Gas Transmission Networks is publicly available, even
for non-commercial research and related purposes. The lack of such data renders attempts to verify, compare and
validate high resolution energy system models difficult, if not impossible. The main reason for such sparse gas facility
data is often the unwillingness of transmission system operators (TSOs) to release such commercially sensitive data.
Regulations by EU and other lawmakers are forcing the TSOs to release some data. However, such data is sparse, and
too often not clearly understandable for non-commercial operators, such as scientists.
Hence, details of the gas transmission network facilities and their properties are currently only integrated in in-house
gas transmission models which are not publicly available. Thus, assumptions, simplifications and the degree of ab-
straction involved in such models are unknown and often undocumented. However, for scientific research those data
sets and assumptions are needed, and consequently the learning curve in the construction of public available network
models is rather low. In addition, the commercially sensitivity also hampers any (scientific) discussion on the under-
lying modelling approaches, procedures and simulation optimization results. At the same time, the outputs of energy
system models take an important role in the decision making process concerning future sustainable technologies and
energy strategies. Recent examples of such strategies are the ones under debate and discussion for the Energiewende
[BundesregierungDeutschland20] in Germany.
In this framework, the SciGRID_gas project initiated by the research centre DLR Institute of Networked Energy Sys-
tems in Oldenburg aims at building an open source model of the European Gas Transmission network. Releasing
SciGRID_gas as open-source is an attempt to make reliable data on the gas transmission network available. Appro-
priate (open) licenses attached to gas transmission network data ensures that established models and their assumptions
can be published, discussed and validated in a well-defined and self-consistent manner. In addition to the gas trans-
mission network data, the Python software developed for building the model SciGRID_gas are published under the
GPLv3 license.
The main purpose of the SciGRID_gas project is therefore to open the door to new gas transmission network models
and innovative ideas in energy system modelling by providing freely available and well-documented data on the
European gas transmission network.
The input data itself is based on data available from openstreetmap.org (OSM) under the Open Database License
(ODbL) as well as Non-OSM data gathered from different sources, such as Wikipedia pages, fact sheets from TSOs
or even newspaper articles.
The main workload of this project is to:
• retrieve the OSM and Non-OSM data sets for the gas infrastructure
• merge all available data sets
8 Chapter 1. IntroductionSciGRID_gas: The raw INET data set, Release 1.0
• build a gas transmission component data set
• generate missing data using heuristic methods
• remove all gas facilities, that are not connected to pipelines.
The first step of the project was to collate a Non-OSM data set by searching the web for metadata that will be useful
for the project. This included information, such as pipelines, compressors, LNG terminals, and their attributes, such
as diameters, capacities, etc.
Here the first single data source will be introduced, the InternetDaten data set (INET). At later stage, descriptions of
other data sources will follow, and will be made available on the project webpage.
This multi-stage release will allow us to easily and effectively incorporate feedback from potential users during the
lifetime of the project. Those releases can be downloaded from the SciGRID_gas webpage with documentation, and
can be seen as a snapshot of the current research project state.
Further information on the project can be found on the SciGRID_gas web page: https://www.gas.scigrid.de/pages/
imprint.html.
The web page is maintained throughout the project lifetime, and will contain information on:
• General project information
• Contact details
• Presentations
• Bug/data fixes
• Data, code and documentation releases
• Publications.
As part of the SciGRID_gas webpage, one can also sign up to the SciGRID_gas newsletter by sending an email to
news.gas-subscribe@scigrid.de
1.3 Project goal
The overall goals of the SciGRID_gas project are:
• Data output: Creation of customisable gas transmission network data sets.
• Open source: Any one can download the data, make changes to it, pass it on to others, or even use it in
commercial projects, as long as the SciGRID_gas project is mentioned as the original source of the data (CC
by).
• Application: The outcome of the project can be used for a variety of scientific applications (e.g. sector coupling,
entry-exit models, etc.).
• Transparency: The Python code, the documentation and the data (that can be passed on under copyright li-
cences) is supplied.
• Extendability: Every user can extend the software code to their needs. However, we would encourage users to
update and maintain the original git-repository and documentation for others.
• Feedback: Through constant data releases, it is hoped that the output data set will improve in quality and
quantity by constantly incorporating feedback from the research community.
1.3. Project goal 9SciGRID_gas: The raw INET data set, Release 1.0 1.4 Document overview This is an overview of this SciGRID_gas documentation, as this will help the user to better understand the overall project, its aims and the steps that were taken to obtain/model the resulting data set. SciGRID_gas has been coded in Python, and hence, with that came the overall data structure that was selected for the project. As this is the most fundamental aspect for anyone wanting to use the data and the code, it is described first. In the chapter Data Structure we define the terms Components, Elements, and Attributes. We also give an overview on the internal workings of the SciGRID_gas source code. A fundamental building block for the SciGRID_gas project is the data itself. Overall, we have classified the data into two groups: OSM and non-OSM data. The chapter Data Sources contains background information on InterDaten (INET) data set only. Information is supplied, such as how the data was collated and how it was implemented into the SciGRID_gas data sets structure. In addition, an overview of the extent of the data will also be given for the data, e.g. the number of elements or the list of attributes that the data contains. The document also contains the chapter Appendix that contains sub-sections, such as Glossary, References, etc. 10 Chapter 1. Introduction
CHAPTER

                                                                                                                  TWO

                                                                                         DATA STRUCTURE

A well designed and documented data structure is fundamental in any large scale project. Good data structure in
combination with tools, based on algorithms, improve the performance of any project output.
This structure needs to represent the gas flow facilities as good as possible, Hence, it needs to include components,
such as pipelines, compressors, etc. A finite number of components have been identified, that are required as building
blocks of a gas network. In addition each component will contain attributes, such as pipeline diameter, maximal
operating pressure, maximal capacity, number of turbines etc.
It is anticipated, that the adopted data structure can be implemented in different types of gas flow models and will be
used by the research community for topics, such as sector coupling or identifying gas transmission bottlenecks.
Within the SciGRID_gas project, the structure of the data model is part of classes defined within the Python code. Al-
terations may occur over the duration of the project, but it is envisaged, that those will be small, and that compatibility
will be assured.
The goal of this section is to describe in details the data structure that has been adopted and implemented into the
Python code. This will be important in understanding other aspects of this document, such as exporting the data into
CSV files or generating missing values.
Prior to the description of the data structure, the overall pathway of the data flow within the SciGRID_gas project will
be explained, as it is believed, that such overview will help the reader.

2.1 Data structure description

This section contains information about the SciGRID_gas data structure, the format, and the code that can be used to
import publicly available data into the project, so that it can be used in subsequent steps. Paramount for an understand-
ing of the data structure is a good understanding of the terminology used throughout this section and the document in
general. Hence, terminology will be introduced in the following sub-section.

2.1.1 Terminology

Throughout this document certain terms will be used, which will be described below and summarized as a picture in
Figure 2.1.

                                                                                                                        11
SciGRID_gas: The raw INET data set, Release 1.0
Figure 2.1: Data structure for the SciGRID_gas data set
12 Chapter 2. Data structureSciGRID_gas: The raw INET data set, Release 1.0 Gas transmission network The term “gas transmission network” describes the physical gas transmission grid. This does not include the distri- bution of gas through gas distribution companies, but includes the long distance transmission of gas from producer countries to consumer countries, as carried out by the Transmission System Operators (TSO) [Wik20g]. Gas component data set The term “gas component data set” is used for all raw data of objects/facilities that have been loaded using Sci- GRID_gas tools into a Python environment. Gas component data sets are used as input into our SciGRID project. Several data sources can be loaded as gas component data sets, and then combined into a single gas component data set. However, not all elements (e.g. compressors) must be connected to pipelines, Hence, such a data set is referred to as a “gas component data set”, and the emphasis is on the term component. Gas network data set A “gas component data set” can be converted into a “gas network data set”, by connecting all non-pipeline elements to nodes and all nodes are connected to pipelines, and as part of the process all network islands have been connected or removed, resulting in a single network. Therefore the network contains nodes and edges which are coherently connected, and all objects with the exception of pipelines are associated with nodes in this network, whereas pipelines are associated with edges. Hence, the emphasis here is on the term network. Component There are several component types in a gas transmission network, such as compressors, LNG terminals, or pipelines. In Figure 2.1 they are coloured red. Hence, whenever the word “component” is mentioned, it refers to one of these components. There are roughly a dozen different components that will form a gas network data set. They will be briefly explained below. Element The term “element” refers to individual facilities, e.g. the LNG Terminal in Rotterdam, or the compressor in Radeland. In Figure 2.1 they are coloured blue. The first one is an element of the component LNG terminals, whereas the second one is an element of the component compressors. Hence, many elements make up a component. However, all elements are referring to different facilities by default. This means in a single network, one cannot have two elements of a component describing the same facility. The structure of elements is described below. Attribute “Attribute” is a term that is being used for the individual labels of the values that are associated with the elements. Examples for this term are gas “pipeline diameter”, “maximum capacity”, “max gas pipeline pressure”, to name just a few and in Figure 2.1 they are coloured yellow. Overall there will be several hundred attributes in the SciGRID_gas project. However, the same attributes can occur in more than one component, e.g. “max flow capacity” exist for pipelines and also for compressors. Throughout the project, we have tried to keep the units of such attributes the same, so that there is no unit conversion required. 2.1. Data structure description 13
SciGRID_gas: The raw INET data set, Release 1.0

Attribute value

Each attribute has a value, most likely a number or a string. In Figure 2.1 they are coloured black. While boolean
(True/False) is also allowed, more likely a “1” will stand for True and “0” for False. However, some attribute values
might not be given in the data source, therefore a no value attribute value does exist. In the Python code it is termed
None.
The Figure 2.1 depicts the relationships between the terms “gas data set”, “component”, “element”, “attribute”, and
“attribute value”. As can be seen, a single gas data set consists of several components, where each component contains
several elements, and each element has several attributes, which each come with a value, where “None” stands for
unknown value. The heuristic processes described in this document at a later stage will fill those “None” values with
generated values.

Gas component types

A gas transmission network consists of different components, such as pipelines, compressors, etc. For the Sci-
GRID_gas project a hand-full of components have been implemented, and will be described here briefly:
     • Nodes: In a gas network, gas flows from one point to another point, which are given through their coordinates.
       All elements of all other components (such as compressor stations and power plants) have an associated node,
       which allows for the geo-referencing of each element. Overall the term “nodes” will be used throughout this
       document, as it aligns with graph theory aspects.
     • PipeLines: PipeLines are one of the main components of the gas pipeline network. PipeLines allow for the
       transmission of the gas from one node to another. However, each pipe is unique. They might have different
       diameter, capacity or max pressure. In addition, a single PipeLines element can connect several nodes. Therefore
       it could go from “Radeland” to “Bottrub” and then follow on to “Frankfurt”. However, PipeLines do not need
       to connect more than 2 nodes, but can. The order of those nodes is important, and indicates the flow direction.
     • PipeSegments: PipeSegments are almost identical to PipeLines, However, are only allowed to connect two
       nodes. Thus they have one start node and one end node, and are not passing via other nodes or other component
       elements in between, such as compressors or LNG terminals. Hence, any pipeline can easily be converted to
       multiple pipe-segments.
     • Compressors: Compressor represent compressor stations, which are important. Gas travelling through the gas
       pipeline loses pressure due to friction on the pipeline walls and other factors. This will reduce the throughput
       of the gas amount. Hence, every so often (~ every 150 km), a compressor station is required, which increases
       the pressure of the gas, and Hence, allows the gas to flow through the gas pipeline. A gas compressor station
       contains several gas compressors units (turbines). Knowing the individual gas turbines is of an advantage, as
       those turbines can be combined in different ways, such as in series, or parallel, or combinations of those two
       options.
     • LNGs: (LNG terminals and LNG storages) Some of the gas, which is being used throughout Europe, is supplied
       via ships to LNG terminals and LNG storage facilities. (From here onwards the acronym “LNGs” will be used
       instead “LNG terminals and LNG storage facilities”.) As the transmission of gas would be extremely inefficient
       due to its volume, the gas state is changed to the liquid form (LNG gas), and then shipped. Ships arriving in
       Europe need special LNG terminals that can store LNG gas and subsequently re-gasify it. The storage and
       re-gasification of the gas are combined in the LNGs component and need to be part of any gas network for
       Europe.
     • Storages: Part of the gas network will be gas storages. Gas storages are being used as gas pipeline capacities
       or gas production capacities might not be able to cover high demand periods, such as during the winter. Hence,
       large gas storage units are being filled during the summer periods while the overall demand is low, and if
       capacities of net supply allow it. This gas is then used during the winter period, and can compensate for
       shortcomings of the gas network or gas supply. Almost every country has their own gas storage units, ranging
       from smaller units to compensate for daily fluctuations to larger units, which compensate seasonal fluctuations.
       For the SciGRID_gas model the larger seasonal storage units are of more importance than the smaller ones,

14                                                                                      Chapter 2. Data structure
SciGRID_gas: The raw INET data set, Release 1.0
as we are interested in the transmission gas pipeline network. However, any gas storage can be added and
implemented into the gas network data set.
• Consumers: Part of the gas pipeline network is the knowledge of gas demand. Gas is added to the network at
LNG terminals and European boundary cross border points. One type of users is the gas power plants. These
can be added to the SciGRID_gas model, as this will specify local gas demand. In addition other consumers,
such as city gas providers and large industries can also be added to the network data set.
• Production: These can be wells inside a country where gas is pumped out of the ground. Most of the gas used in
Europe comes from outside of the EU, However, there are several smaller gas production sites scattered through
Europe.
• BorderPoints: BorderPoints are cross border points (between different countries), which are mostly for the
purpose of accounting the gas flow. Most large gas pipelines have cross border stations, e.g. Ellund (lat/long:
54.80181, 9.289079) at the border between Germany and Denmark, with gas facilities on both sides of the
border.
• EntryPoints: These are special border points, as they are at the borders of the European Union and will be the
gas entry points for the SciGRID_gas model data set.
• InterConnectionPoints: These are points between gas transmission operators, and will be found mainly within
Europe, in particular at country borders. However, they can also be found within a single country, if there is
more than one gas transmission operator.
Element structure
As described above, elements are describing individual facilities, such as compressors or LNG terminals. However,
the overall structure of those elements is the same for all elements of all components. The overall structure of those
elements is described in the following part:
• id: A string, that is the ID of the element, and must be unique.
• name: A string that is the name of the element, such as “Compressor Radeland”.
• source_id: A list of strings that are the sources of the element. As several elements from different sources could
have been combined in a single element, one might need to know which are the original ids of the original
sources.
• node_id: This is the ID of a geo-referenced point to which an element of the network is associated to. For a
compressor, this will be just a single node_id, however, for a gas pipeline, that starts at one point and finishes at
a different point, this entry would be a list of at least two node_id values.
• lat: This is the latitude value of an element. For pipelines,*lat* is a list of latitude values if known. The geo-
referenced projection of the element that is being used in the SciGRID_gas project is: World Geodetic system
1984 (epsg:4326).
• long: The longitude, analogue to lat.
• country_code: This is a string indicating the official 2-digit country code (Alpha-2 code, see Chapter 4.5 for
list of countries and their code). It represents the location of the element. As pipelines can pass through more
than one country, the country code for pipes is the list of country codes of the countries the pipeline is passing
through.
• comment: This is an arbitrary comment that is associated with the element.
• tags: This dictionary is reserved for OpenStreetmap data. It contains all associated key:value-pairs of an Open-
StreetMap item.
In addition, there are three further groups of attributes to each element. Throughout the SciGRID_gas project, they
have been coded as “dictionaries”. They are called:
2.1. Data structure description 15SciGRID_gas: The raw INET data set, Release 1.0
• param
• method
• uncertainty.
The structure within each dictionary is the same, However, their meaning is different. First of all the dictionary param
(short for “parameter”) contains a list of attributes and their values. This list of attributes will be different for each
component. For the component PipeLines they might be pipeline diameter, max pipeline pressure, and max pipeline
capacity. For the component Compressors they might be , such as number of turbines, overall turbine power, energy
source of turbine and more.
So the other two attribute dictionaries are method and uncertainty. Each of those two dictionaries contains exactly the
same list of attributes as the param dictionary. However, their attribute values reflect the name of the dictionary. E.g.
the attributes in the dictionary method contain the information on the method used to derive the attribute value that is
stored in the*param* dictionary. Here methods of value generation can include heuristic methods names (in form of
strings) that have been implemented in the SciGRID_gas project. However, if attribute values are not being generated
by the SciGRID_gas project, but originate from one of the input data sources, then the attribute values in the method
dictionary is set to “raw”.
Similar is the content of the uncertainty dictionary. It contains information on the uncertainty of the attributes from
the param dictionary of that component. Again all attributes listed in the param dictionary are also present in the
uncertainty dictionary. The attribute values here reflect the uncertainty of the attribute. Here, it is assumed, that
attributes with a method of “raw” have an uncertainty of zero. Only for those attributes, which were generated during
heuristic SciGRID_gas methods an uncertainty larger than zero will be specified.
2.2 Summary
The SciGRID_gas software is designed to construct a gas transmission network data set form different open source gas
component data sets. The gas transmission data set needs to be available and stored in a precise and predefined way,
which was described in this section. We have identified several component-types of a gas transmission network grid,
like pipelines, compressor stations, LNG-terminals, etc. Each specific facility that falls under such a component is
considered an element of that component. Each element is described by a list of attributes and correspondent attribute
values.
16 Chapter 2. Data structureCHAPTER
THREE
DATA SOURCES
Two thirds of the gas used in Europe is imported from non-EU states, and all gas required for the consumption needs
to be distributed through the existing gas transmission pipelines in Europe. In the future gas consumption might rise,
leading to additional pressure on the current infrastructure. In addition, gas facilities could play a vital role in reducing
CO2 emission, as excess electricity could be converted to gas, that could be stored and transmitted throughout Europe
with the existing gas network. Hence, a reliable network data set for the European transmission network is essential.
The data required for such models ranges from pipeline diameter, gas pressure within the pipeline, actual pipeline
length, pipeline capacity, and underground storage volume to name just a few.
However, such data is the property of the transmission system operators (TSOs) and is therefore generally not freely
available in the form and depth that is required for modelling purposes. The major reason for the difficulty of obtaining
of such data is that most of the gas network infrastructure, namely pipelines, is buried underground. Thus a pipeline
diameter is hard to estimate locally. In addition, almost all of the data is commercially sensitive.
However, there is a public drive to gather such data and subsequently make it available. The major platform through
which this is occurring is the Open Street Map database [Hel18]. OSM is a geo-referenced database through which
people can supply geo-referenced information on all man-made and natural structures, ranging from mountains to
buildings. To achieve this, people throughout the world wander the globe and geo-reference everything that they can
find. This also includes gas-pipeline markers, compressor stations or LNG terminals. However, the major problem
remains that one cannot measure or estimate the diameter of the underground pipelines, or the number and size of the
compressor turbines, as compressors are within buildings, which are fenced off. Hence, such information is hardly
supplied to the OSM platform.
Nevertheless, some data is made available by gas transmission network operators, through different channels.
E.g. information on the size and number of compressors could be made public through a press release,
as part of a refurbishment. An example is given below (https://www.maz-online.de/Lokales/Teltow-Flaeming/
Neue-Verdichterstation-entsteht-in-Radeland):
“Die Eugal-Pipeline dient dazu, Gas aus der neuen Ostseepipeline Nord Stream 2 bis zur tschechischen
Grenze zu leiten. 275 Kilometer von ihr verlaufen in Brandenburg. Grundsätzlich soll die neue Leitung
parallel zur bestehenden Opal-Pipeline gebaut werden.”
In addition some information can be found on company web pages, (https://www.open-grid-europe.com/
cps/rde/SID-752BB6B5-E0A975F2/oge-internet-preview/hs.xsl/NewsDetail.htm?rdeLocaleAttr=en&newsId=
50190C3B-E14F-4685-9E64-E40EEAB57A28):
Open Grid Europe (OGE) is investing roughly EUR 150 million at its compressor station in Werne to
improve the security and flexibility of energy supply for North Rhine-Westphalia and Germany. The
upgrade of the station, which is one of the hubs of the pipeline network, will allow gas flows to be
switched (reversed) from north to south and south to north. In addition, OGE is preparing the station
for the upcoming transition from L- to H-gas. Through this fitness programme, the station’s transmission
capacity will increase by about 500,000 to 6.5 million m3 /h, which is equivalent to the annual consumption
of more than 2,100 single-family homes. The project, which is due for completion at the end of 2018, is
fully on track.”
17SciGRID_gas: The raw INET data set, Release 1.0
The data available can be separated into two different groups:
• OSM data: Data can be found in the OSM data base. OSM data is well geo-referenced, but contains little meta-
information (information on the facility attributes, such as pipeline diameter or pipeline capacity). OSM data is
very helpful to obtain accurate routes of pipelines.
• Non-OSM data: Non-OSM data have in general lower geographical accuracy but contain a lot of meta-
information. Unfortunately, such information is only known for a few facilities. One exception to this rule
are shapefiles from TSOs. They are rare, but well geo-referenced. However, the resolution of the meta informa-
tion can vary from TSO to TSO.
One of the main challenges for SciGRID_gas is that, gas transmission data is incomplete and accumulated from
different sources. Also such different sources can have different properties for one and the same facility. Hence, it
is important to know, which data set supplies which information. Hence, this chapter here will introduce the relevant
data sets (e.g. INET), starting off with the components, the elements for each component and then the attributes for
each element.
3.1 Non-OSM data
Non-OSM data includes data from internet research, TSO press releases, TSO transparency platform, TSO public data,
national open-source gas network data sets1 , etc.
Some of the TSO information had to be made available due to EU-regulations. Other information has been made
public as part of a company’s self presentation and advertisement. The information used by the SciGRID_gas project
focuses on:
• the quality of the data
• the format of the data
• the level of representation of the data
• and the copyright restrictions on the data.
In addition, each data source is unique. Source specific tools need to be developed, so that all data sources can be
made accessible for the SciGRID_gas project in the format as described in later chapter releases.
A significant portion of the project was spent on finding non-OSM data sets . Further data sources might be available,
but unknown to the authors. If the authors are made aware of additional sources, the project will try to incorporate
those, as this would only increase the depth of the data available and increase the applicability of the gas network data
set and model.
Non-OSM data sources are very specific, addressing only certain aspects of the entire gas infrastructure. E.g. the GIE
[GasIEurop20] data set supplies information on the daily gas flow in and out of gas storages in LNG terminals. How-
ever, they fall short on specifying the fundamental information of the actual physical location. Other data sets, such as
the LKD [FMWP+17] data set is quite detailed in respect of pipelines, compressors and consumptions, however, only
available for Germany.
Hence, the main task is to look closely at each data source, distil which data attribute values can be used, how it can be
downloaded and incorporated into our SciGRID_gas model, and identify the copyright restrictions on the data source.
Due to copyright regulations, there are roughly two groups of data:
• Non copyright restrictive data (N-CRRD): here the copyright does not restrict the download, use and distribution
of the data.
• Copyright restrictive data (CRRD): here the data can be downloaded and used internally, but not re-distributed
to others.
1 An entire gas network data set is only available from the UK, see https://www.nationalgridgas.com/land-and-assets/network-route-maps’.
18 Chapter 3. Data sourcesSciGRID_gas: The raw INET data set, Release 1.0
The following is a list of the data sources that will be used throughout the project and an indication into which group
of copyright restriction they fall:
• OSM (https://www.openstreetmap.org) (N-CRRD)
• GB (https://www.nationalgridgas.com/land-and-assets/network-route-maps) (CRRD)
• NO (https://www.npd.no/en/about-us/information-services/available-data/map-services/) (N-CRRD)
• LKD (https://tu-dresden.de/bu/wirtschaft/ee2/forschung/projekte/lkd-eu) (N-CRRD)
• ENTSOG (https://transparency.entsog.eu/) (CRRD)
• EMap (https://www.entsog.eu/sites/default/files/2020-01/ENTSOG_CAP_2019_A0_1189x841_FULL_401.
pdf) (CRRD)
• GIE (https://www.gie.eu/) (N-CRRD)
• GSE (https://www.gie.eu/index.php/gie-publications/databases/storage-database) (N-CRRD)
• IGU (https://www.igu.org/) (CRRD)
• GasLib (http://gaslib.zib.de/) (N-CRRD)
• INET (see Refs_InternetData) (N-CRRD).
Each data set and source comes with a different copyright regulation. The copyright can be rather non-restrictive
(e.g. INET) or can be restrictive (IGU). It is attempted to use only freely available data, so that such data can be
re-distributed. In more restrictive data cases (IGU, GB), it is not allowed to download the data and distribute it to
others. However, it is allowed to let other potential users know of the location of such data and supply them with tools,
that allow them to carry out the same data download and subsequent incorporation of the data into a gas network data
set.
Note:
In case that other users are aware of other data sources, that might be useful to this project, please get in touch and
supply us with a brief description of the data and the location of such data, so that additional tools can be developed
to incorporate the data in this project. Please use the following email address: developers.gas(at)scigrid.de
3.1. Non-OSM data 19SciGRID_gas: The raw INET data set, Release 1.0
3.2 The InternetDaten (INET) data set
This section contains information on the content and nature of the so called InternetDaten data set (INET), how this
data was generated, its format, and the tools that have been designed to import the INET into the SciGRID_gas project.
The INET data set is a special data set, as it was collated from many www sources and the information has been
collated into CSV files. Please note, that throughout the project, the separator within CSV files will need to be “;”.
This section here will give an overview on the INET, its components and how the data is stored in INET specific CSV
files. Further the processing of the data into Python will be described.
Prior to the description of those processes, a general overview of the INET data set is given first, so that the reader gets
a better understanding of the size and depth of the data.
3.2.1 Overview of the INET data set
The INET data set contains geographical and meta information on gas facilities that were found through Internet
searches. The data originated from www pages, such as Wikipedia, gas transmission system operators, fact sheets
and press releases and more. Hence, most of the data had to be extracted manually out of text pages. To make this
data available throughout the project, the data is being stored in CSV files. This also allows others to add additional
properties and values to the INET data set at any stage. Tools have been written to load the INET from those CSV files
and make them accessible throughout the project1 .
The Table 3.1 summarises the number of elements for each component that has been found so far. However, this does
not imply that there is no missing data. In contrary, this data set comes with a lot of missing data:
Table 3.1: INET component summary.
Component Name Count
BorderPoints 119
Compressors 249
ConnectionPoints 0
Consumers 0
EntryPoints 37
InterConnectionPoints 118
LNGs 32
Nodes 907
PipeSegments 920
Production 0
Storages 199
In addition, a map (see Figure 3.1) visualizes these components for Europe in the figure below.
1 These tools will be made available during an upcoming release, where the INET data set will be jointly released with the GIE data set most
likely through our project web page.
20 Chapter 3. Data sourcesSciGRID_gas: The raw INET data set, Release 1.0
Figure 3.1: Map of the INET data set. The legend contains the number of elements for each component.
3.2. The InternetDaten (INET) data set 21SciGRID_gas: The raw INET data set, Release 1.0
3.2.2 Origin of the data
As has been stated before, the resulting INET data set originated from text sources found on the www. Here, for the
pipeline JAGAL [Wik20h] an example from a Wikipedia page is given (https://en.wikipedia.org/wiki/JAGAL):
Figure 3.2: Screenshot of part of the Wikipedia page for the pipeline JAGAL.
As one can see, some information is given, such as location name of the compressor (Mallnow), total pipeline length
(338 km), pipeline diameter (1200 mm) and maximum pipeline capacity (24 billion m3 a−1 ). This is the information
that is manually extracted from such pages and put into the CSV files. Other sources of such data are: gas facility
operator press releases, fact sheets and other documents, newspaper articles, federal departmental web pages etc.
To collate the data in an orderly manner, a system of CSV files has been created and will be described below.
3.2.3 INET CSV file description
Each component of the INET data set is represented by a single CSV file. Each of those files has a single header
line, and it is very important to know, that entries in the first line should only be changed if one knows, what one is
doing, as the first row labels (the actual words) are imported and used as variable names in the SciGRID_gas project
Python programs. Hence, if certain labels would be missing, the program would fail. In addition, each label needs to
be unique within each file. It is advised to incorporate the units of the attributes into the label name, where possible.
Nodes.csv file
This is a unique file, and contains information on the nodes of the INET data set. Nodes are such entities, to which
and from where pipelines can run, or to which other facilities can be associated to. Nodes supply information on a
location including its name, its latitude and longitude, and the country in which it is located. Additionally, they supply
information on how exact is the location of the node could be determined. The nodes component data is supplied to
the SciGRID_gas data model only via a single CSV file.
• id: This is a unique id of a node of type string. Most likely this will be the name of an element. White spaces
are allowed in this string.
• comment: Here the user can place additional information on the location node.
• country: Here the user needs to write the 2 letter abbreviation of the country, in which this node is located (see
Table 4.5 for a list of country codes used).
• lat: This is a number of the best estimate of the latitude of the location. Best latitude value (and long value)
were attempted to be generated by using metadata of the facility node and satellite maps. Using the satellite
data, address information etc., it was tried to visually find the facility of the node.
22 Chapter 3. Data sourcesSciGRID_gas: The raw INET data set, Release 1.0
• long: This is the corresponding best estimate of the longitude of the location derived during the same process as
described under Lat.
• node_id: This is an identifier of a node.
• source_id: This is a unique identifier describing the source of the element. Here INET is the abbreviation for
InternetDaten. Hence, all elements originating from the INET data set starts with the letters INET.
• name: A string containing the name of the location. It is allowed to contain white spaces.
• exact: This is a number in the range of 1 to 5, indicating how accurate the lat/longs were supplied for each node.
Options are as follow:
– “1”: The exact location of this node is known, as one was able to verify the facility through satellite data.
– “2”: Here the lat/long is not known exactly, however one assumes that the location is within a small region
(e.g. Krummhörn), Hence, not being much larger than 10 km.
– “3”: Here so little is known about the exact location, and one only knows, that the location is within a large
region (e.g. Hamburg). Hence, the actual location could be out by 10 km or more but less than 100 km.
– “4”: Here so little is known about the exact location, and one only knows, that the location is within a state
(e.g. Niedersachsen). Hence, the actual location could be out by 100 km or more but less than 1000 km.
– “5”: Here so little is known about the exact location, and one only knows, that the location is within a
country (e.g. Ukraine). Hence, the actual location could be out by 1000 km or more.
All other components need two files, the location file and the metadata file, which will be described next.
Compressor CSV meta file
The compressor file (“Compressors.CSV”) contains all the metadata for all known compressor stations.
In addition to the seven mandatory columns introduced above, the following columns are currently implemented, and
contain the following data:
• end_year: Integer number of the year, when the operation of this element stopped. If it contains a value of
“None”, than it is still operational.
• start_year: Integer number of the year, when the operation of this element started. If it contains a value of
“None”, then this year is not known.
• operator_name: This is a string, containing the name of the operator of the compressor station.
• pipe_name: This is a string containing the label of the pipeline that the compressor is connected to.
• source: Information on where the information of this element originated from.
• is_H_gas: This is a boolean, indicating if the gas is of high calorific gas type (“1”) or of low calorific gas (“0”).
• max_cap_M_m3_per_h: This is a number, which is the overall capacity of gas that can be compressed by the
compressor station. Values need to be supplied in units of [Mm3 /h].
• max_pressure_bar: This is a number, which is the maximum pressure that the gas can be compressed to. Values
need to be supplied in units of [bar].
• max_power_MW: This is a number, which is the sum of the power of all compressor units that are installed at
the compressor station. Values need to be supplied in units of [MW].
• num_turb: This is the number of compressor turbines installed at the compressor facility. This number is
including the reserve turbine unit.
• turbine_fuel_isGas_1: This is a boolean, indicating if the turbine is powered by gas (“1”), or by electric (“0”).
3.2. The InternetDaten (INET) data set 23SciGRID_gas: The raw INET data set, Release 1.0
• turbine_type_1: This is a string containing additional information on the type of turbine unit, e.g. name of the
turbine.
• turbine_power_1: This is a number, indicating the power of the turbine unit. The value needs to be supplied in
units of [MW].
• turbine_fuel_isGas_2: This is the information for the second turbine unit. Same as for turbine_fuel_isGas_1
applies. Currently up to 6 individual units can be stored in the database, Hence, the last digit in the identifier
can be as large as 6.
• turbine_type_2: This is the information for the second turbine unit. Same as for turbine_type_1 applies. Cur-
rently up to 6 individual units can be stored in the database, Hence, the last digit in the identifier can be as large
as 6.
• turbine_power_2: This is the information for the second turbine unit. Same as for turbine_power_1 applies.
• ...
• turbine_power_6: This is a number, indicating the power of the sixth turbine unit. The value needs to be
supplied in units of [MW].
LNG CSV meta file
The LNG terminal metafile (“LNGs.CSV”) contains all the metadata for the LNG terminals.
Next to the above described first seven columns the following columns are currently implemented, and contain the
following data:
• end_year: Integer number of the year, when the operation of this element stopped. If it contains a value of
“None”, then it is still operational.
• start_year: Integer number of the year, when the operation of this element started. If it contains a value of
“None”, then this year is not known.
• source: Information on where the information of this element originated from.
• max_workingGas_M_m3: This is a number, indicating the maximum amount of liquid gas that can be stored,
after having been brought in by ship. Values need to be supplied in units of [Mm3 ]
• max_cap_store2pipe_M_m3_per_a: This is a number, indicating the maximum amount of gas that can leave the
LNG terminal. This gas is in gas phase. Values need to be supplied in units of [Mm3 /a]
BorderPoints CSV meta file
The metafile for * BorderPoints * elements (“BorderPoints.CSV”) contains all the metadata for each border point.
Next to the above described first seven columns the following columns are currently implemented, and contain the
following data:
• pipe_name: This is a string, the name of the pipe that is passing the border point.
• end_year: Integer number of the year, when the operation of this element stopped. If it contains a value of
“None”, then it is still operational.
• start_year: Integer number of the year, when the operation of this element started. If it contains a value of
“None”, then this year is not known.
• source: Information on where the information of this element originated from.
24 Chapter 3. Data sourcesSciGRID_gas: The raw INET data set, Release 1.0
EntryPoints CSV meta file
The metafile for EntryPoints elements (“EntryPoints.CSV”) contains all the metadata for entry points of gas pipelines
into Europe.
Next to the above described first seven columns the following columns are currently implemented, and contain the
following data:
• end_year: Integer number of the year, when the operation of this element stopped. If it contains a value of
“None”, then it is still operational.
• start_year: Integer number of the year, when the operation of this element started. If it contains a value of
“None”, then this year is not known.
• source: Information on where the information of this element originated from.
InterConnectionPoints CSV meta file
The InterConnectionPoints metafile (“InterConnectionPoints.CSV”) contains all the metadata for interconnection
points between the different operators within Europe.
Next to the above described first seven columns the following columns are currently implemented, and contain the
following data:
• end_year: Integer number of the year, when the operation of this element stopped. If it contains a value of
“None”, then it is still operational.
• start_year: Integer number of the year, when the operation of this element started. If it contains a value of
“None”, then this year is not known.
• source: Information on where the information of this element originated from.
• pipe_name: This is a string, the name of the pipe that is passing the border point.
Storages CSV meta file
The metafile “Storages.CSV” contains all the metadata for gas storage within Europe.
Next to the above described first seven columns the following columns are currently implemented, and contain the
following data:
• access_regime: String indicating the access of the storage facility, TPA or not TPA (nTPA), and could be used
for heuristic processes at a later stage.
• end_year: Integer number of the year, when the operation of this element stopped. If it contains a value of
“None”, then it is still operational.
• start_year: Integer number of the year, when the operation of this element started. If it contains a value of
“None”, then this year is not known.
• store_type: This is a string, indicating the type of storage, such as “Leeres Gas Feld” (empty gas field), “Salz
Kaverne” (salt cavern) etc.
• source: Information on where the information of this element originated from.
• is_H_gas: This is a boolean, that indicates if the gas is of high calorific nature (“1”) or of low calorific nature
(“0”).
• is_onShore: this is a number, indicating if this gas store is on land or not. Options are “1” and the gas store is
on land, whereas the second option “0” indicates, that the gas store is not on land, Hence, will be off shore.
3.2. The InternetDaten (INET) data set 25SciGRID_gas: The raw INET data set, Release 1.0
• operator_name”: String, containing the name of the operator.
• max_workingGas_M_m3: A number indicating the maximum amount of gas that can be stored and worked with
in that gas field. Values need to be supplied in units of [Mm3 ].
• max_cap_store2pipe_M_m3_per_d: A number indicating the maximum amount of gas that can move from the
gas store into a gas pipe. Values need to be supplied in units of [Mm3 d−1 ].
• max_cap_pipe2store_M_m3_per_d: A number indicating the maximum amount of gas that can move from the
gas pipeline into a gas store. Values need to be supplied in units of [Mm3 d−1 ].
PipeSegments CSV meta file
The metafile “PipeSegments.CSV” contains all the metadata for gas pipe lines within Europe.
Next to the above described first seven columns the following columns are currently implemented, and contain the
following data:
• is_bothDirection: This is a boolean with value of ‘1’ or ‘0’. If set to ‘1’, then the gas pipeline can be operated
in both directions, whereas if set to ‘0’, then the gas can only flow from the start point to the end point. Hence,
here the order of the point_lables in the pipes file is important.
• length_km: This is the overall length of the pipeline, and NOT of the segment. The value needs to be supplied
in units of [km].
• diameter_mm: This is the diameter of the pipe in units of [mm].
• max_pressure_bar: This is the maximum pressure of the gas within the gas pipeline in units of [bar].
• max_cap_M_m3_per_d: This is the maximum annual gas volume that the pipe can transmit in units of [Gm3/d].
• num_compressor: This is the number of compressors along the pipeline.
• end_year: Integer number of the year, when the operation of this element stopped. If it contains a value of
“None”, then it is still operational.
• is_H_gas: This is a boolean, that indicates if the gas is of high calorific nature (“1”) or of low calorific nature
(“0”).
• source: Information on where the information of this element originated from.
• lat_mean: Average mean latitude value of the pipe-segment.
• lat_mean: Average mean longitude value of the pipe-segment.
3.2.4 INET data density
Now that the structure of the INET has been described in detail above, the “data density” of data will be presented.
Here “data density” is defined as follow: it is the ratio of the number of usable (not missing, e.g. filled or raw values)
attribute values over the number of all elements of the component. Supposedly the INET would have two LNG
terminals. One of the facilities has a storage volume, whereas the other one does not. Hence, the data density would
be 50% for the attribute storage volume. Here, the data density for the most relevant attributes will be given next for
all components. At a later stage, missing values might be estimated through heuristic processes, to complete the data
set.
26 Chapter 3. Data sourcesYou can also read