Energy and Water Monitoring Report for 2019 - Commission for Regulation of Utilities
←
→
Page content transcription
If your browser does not render page correctly, please read the page content below
An Coimisiún um Rialáil Fóntais Commission for Regulation of Utilities

               An Coimisiún um Rialáil Fóntais
               Commission for Regulation of Utilities

              Energy and Water
              Monitoring Report for 2019

                Information Paper
                Reference:      CRU20089                                 Date Published:   14/08/2020
              www.cru.ie

                                                                                                        0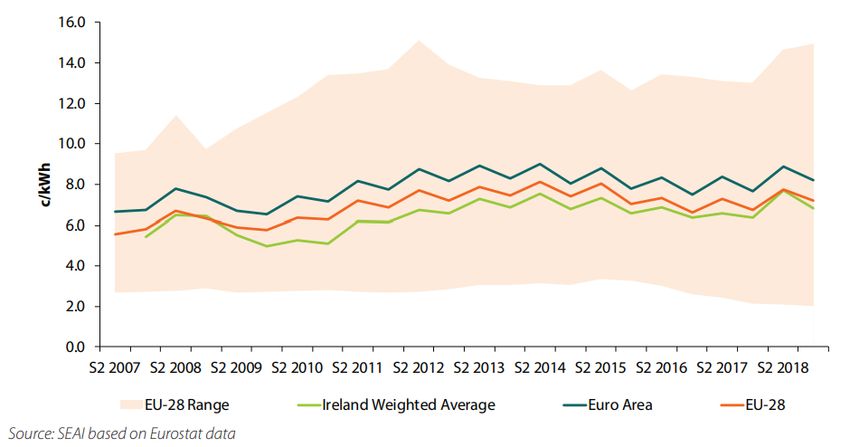
An Coimisiún um Rialáil Fóntais Commission for Regulation of Utilities

CRU Mission Statement
The CRU’s mission is to protect the public interest in Water, Energy and Energy Safety.
The CRU is guided by four strategic priorities that sit alongside the core activities we undertake to
deliver on the public interest. These are:

    •       Deliver sustainable low-carbon solutions with well-regulated markets and networks
    •       Ensure compliance and accountability through best regulatory practice
    •       Develop effective communications to support customers and the regulatory process
    •       Foster and maintain a high-performance culture and organisation to achieve our vision

Public/Customer Impact Statement
The purpose of this report is to provide consumers, industry and other interested stakeholders with
relevant information on the development of competition in the electricity and gas retail markets, an
overview of the key developments in the water sector and the work of the CRU Customer Affairs
Team in providing a free dispute resolution service to customers.
Market monitoring forms an important part of the CRU’s activities. The information gleaned through
market monitoring helps to inform new policy and aids in the assessment of existing regulations.
The information and analysis provided in this report aims to provide insight into how the electricity
and gas retail markets are functioning and how water services are developing and to highlight any
specific issues that may need to be addressed. As well as information gathered through the
electricity and gas market monitoring framework, the report draws on additional information from
a number of key sources including CRU decision papers, stakeholder inputs, industry discussions,
audit findings and the CRU’s consumer survey.

This document is divided into three main sections, customer engagement and protection, energy
prices, and sectoral developments. Each section aims to give an overview of changes over 2019
period.

For any queries on this report please contact:
    •       retaildata@cru.ie for Electricity and Gas
    •       watercustomers@cru.ie for Water

Revisions
  Version          Published     Update
        1         14/08/2020     Report published

                                                                                                    1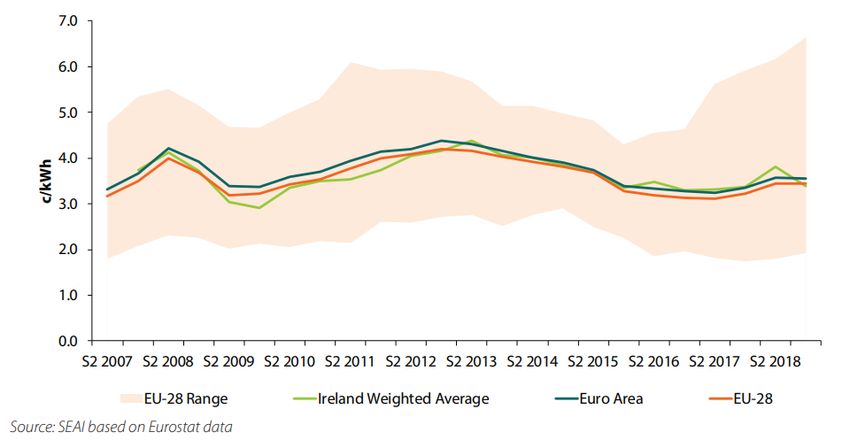
An Coimisiún um Rialáil Fóntais Commission for Regulation of Utilities

Executive Summary – Key Messages
CUSTOMER ENGAGEMENT AND PROTECTION
    •   In 2019, energy suppliers received complaints from 0.9% of their electricity customers
        (22,145 complaints) and from 1.2% of their gas customers (8,156 complaints).
    •   In 2019, Irish Water received 68 domestic customer complaints for every 10,000
        customers, which is a 0.58% complaint rate.
    •   Irish Water had fewer open complaints at the end of 2019 (357 complaints) compared
        to the number of open complaints at the end of 2018 (610 complaints).
    •   In 2019, there were less interruptions to water supply, with a year-on-year decrease in
        planned interruptions of 18% and a year-on-year decrease in unplanned interruptions
        of 31%.
    •   In 2019, Irish Water issued Boil Water Notices for water supplies which served a
        combined population of over 1.3 million people (driven by two large-scale incidents at
        the Leixlip water treatment plant in late 2019, which affected over 600,000 people on
        both occasions) and Water Restriction Notices for water supplies which served a
        combined population of over 8,000 people.
    •   In 2019, the electricity switching rate was 13.5% and the gas switching rate was 17.7%.
        Of total switches, 31% were dual fuel switches.
    •   According to the Monitoring Report on the Performance of European Retail Markets in
        2018 published by CEER in November 2019, in 2018 Ireland had the fifth highest
        external switching rate for domestic electricity customers of 14.2%, while in gas it had
        the second highest external switching rate of 20.5% for domestic customers across
        European countries reported on.
    •   The total number of switches completed in the electricity market in 2019 was 323,566.
        This represents a decrease of 2.5% from 2018, when 331,900 customers switched.
    •   The total number of switches completed in the gas market in 2019 was 124,698. This
        represents a decrease of 9.1% from 2018, when 137,125 customers switched.
    •   In addition to switches between suppliers, approximately 10% of electricity customers
        and 12% of gas customers renegotiated their contracts with their current supplier in
        2019. These figures represent a 15% and 30% increase from 2018 in electricity and
        gas respectively.
    •   In total, therefore, 25% of electricity and 29% of gas of customers looked for a better
        energy plan in 2019 through either switching supplier or renegotiating with their current
        supplier.
    •   If a customer had switched to the best available discount tariff each year for the past 4
        years they could, over the course of the 4 years, potentially have saved up to: €726 on
        electricity; €494 on gas; and €1,343 on dual fuel.
    •   In 2019, the average price differential, and thus potential savings, for a domestic
        customer switching from a standard tariff to a discounted tariff was €207 for a domestic
        electricity customer, €170 for a domestic gas customer and €401 for a domestic dual
        fuel customer.
    •   At the of 2019, 11% of total electricity and 13% of total gas customers were in arrears
        and 0.5% of domestic electricity customers and 0.3% of domestic gas customers were
        on payment plans.
    •   On average more payment plans are completed by electricity and gas customers than
        broken (Electricity: 60% completed: 40% broken. Gas: 64% completed: 36% broken).

                                                                                                    2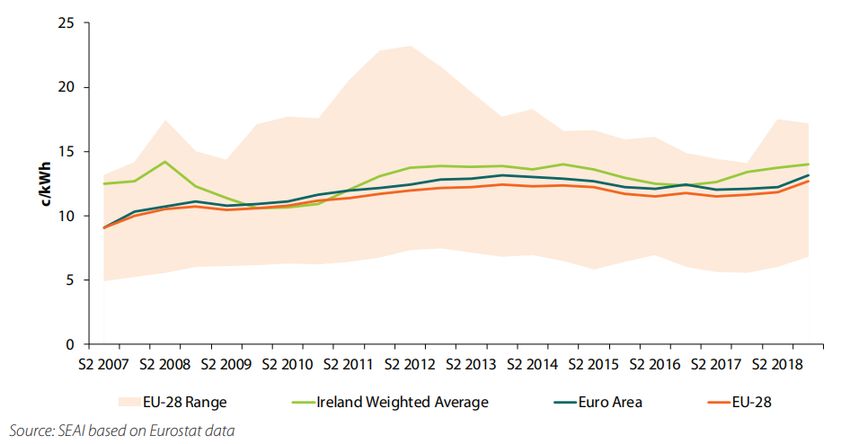
An Coimisiún um Rialáil Fóntais Commission for Regulation of Utilities

       •    In 2019, there were 2,031 new PAYG financial hardship meters installed for electricity
            and 415 for gas. In electricity this represents a 9% decrease from 2018 when 2,228
            were installed, and in gas this represents a decrease of 44% from 2018 when 744 were
            installed.
       •    NPA disconnections of customers increased by 4% in electricity by 40% in gas in 2019
            compared to 2018. The total number of NPA disconnections in 2019 was 5,008 for
            electricity and 2,424 for gas, representing 0.2% of all electricity and 0.3% of all gas
            customers in Ireland.
       •    At the end of 2019 there were 15,093 electricity smart meters installed.

ENERGY PRICES
       •    Estimated annual bills (EABs) across suppliers’ standard plans increased from 2018 by
            an average of 2.4% in electricity and 1.5% in gas in 2019, while EABs across suppliers’
            best discounted plans decreased by an average of 4.6% in electricity and 3.9% in gas1.
       •    Three suppliers announced price increases in the first half of 2019, based on increased
            wholesale costs incurred in previous periods. At the end of Q3 2019, one supplier
            announced a second price change within the year, which involved a price increase in
            electricity and a price decrease in gas.
       •    At the end of 2019, Iberdrola offered the cheapest available standard electricity plan
            with an EAB of €9432. Energia offered the cheapest available discount plan for
            electricity at the end of 2018 with an EAB of €830.
       •    At the end of 2019, Iberdrola offered the cheapest available standard plan for gas with
            an EAB of €796. Flogas offered the cheapest available discount plan for gas at the end
            of 2019 with an EAB of €671.
       •    At the end of 2019, Energia offered the cheapest available dual fuel plan with an EAB
            of €1,495.
       •    Comparing Ireland’s energy prices to other European countries, in semester 1 of 2019
            (January - June 2019), the average price in Ireland for domestic electricity consumption
            band DC was 7% above the Euro Area average. For domestic electricity consumption
            band DD, Ireland was 2% below the Euro Area average. The average price in
            consumption band DC decreased from semester 2 2018 to semester 1 2019 by 4.6%
            and the average price in consumption band DD decreased by 4.4%.
       •    The average price for the main domestic gas consumption band (D2) in Ireland was 4%
            below the Euro Area average. The average price in consumption band D2 decreased
            from semester 2 2018 to semester 1 2019 by 10.2%.
       •    On average the wholesale price of gas was 41% lower in 2019 compared to 2018 and
            the wholesale price of electricity was 21% lower in 2019 compared to 2018, with most
            of these increases occurring during the first half of the year.

1
    Just Energy is not included in the calculations as it had increased its prices before leaving the market at the end of 2019.
2
    All figures for domestic energy retail bills are inclusive of VAT.
                                                                                                                                   3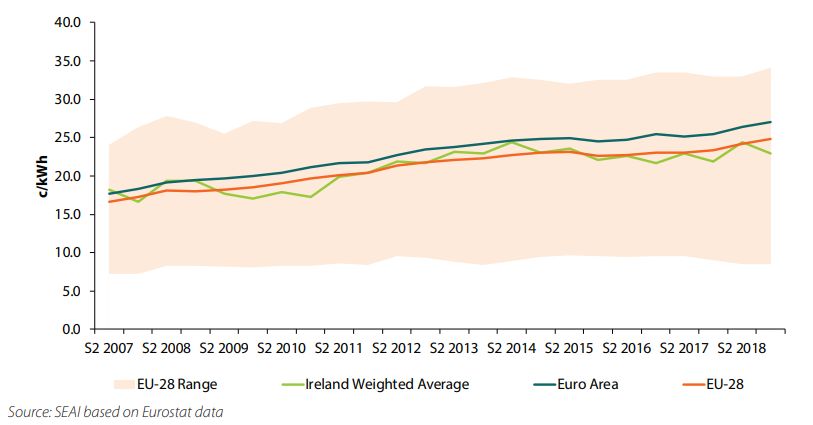
An Coimisiún um Rialáil Fóntais Commission for Regulation of Utilities

SECTORAL DEVELOPMENTS IN ENERGY AND
WATER
    •   During 2019 two new suppliers entered the energy markets and one supplier left.
    •   There were 11 active suppliers in the domestic electricity market and 9 active suppliers
        in the domestic gas market, while 8 suppliers offered dual fuel.
    •   In Q4 2019, Electric Ireland held the greatest domestic electricity market share with
        48.2% of total consumption. The remaining key suppliers in the domestic electricity
        market are Bord Gáis Energy with 17.99% market share by consumption in Q4 2019,
        followed by SSE Airtricity with 12.65%, Energia with 9.25%, PrePayPower with 6.87%,
        Panda Power with 2.5% and Pinergy with 1.29%.
    •   In the non-domestic markets Electric Ireland remained the largest electricity supplier in
        terms of consumption in the small business, and medium business market segments in
        2019. Electric Ireland held the second largest share in the LEU market, with SSE
        Airtricity being the largest supplier in this segment.
    •   In Q4 2019 Bord Gáis Energy held the greatest market share in the domestic gas
        market with 43.8% of the market by customer numbers. This was followed by Electric
        Ireland with 21.4%, SSE Airtricity with 12.3%, Energia with 9.1%, PrePay Power with
        7.2% and Panda Power with 1.56%.
    •   In the non-domestic markets Bord Gáis Energy remained the largest supplier in terms
        of customer numbers in the IC, medium-sized non-domestic gas and LDM gas market
        segments, while it is the third biggest supplier in the DM market segment with Energia
        having the largest share in this market segment followed by Electric Ireland.
    •   In 2019, Irish Water provided water services to nearly 1.8 million customers, with an
        average daily water demand of nearly 1,700 million litres of water.
    •   In 2019, the average daily amount of unaccounted for water, which includes water
        losses due to leaks, was 712 million litres, a reduction from 782 million litres in 2018.
    •   In 2019, the average annual household water demand was approximately 128,700 litres
        (353 litres per day) and the median was 96,000 (263 litres per day). Households with
        water use in the top 1% (approximately 15,000 households), accounted for nearly 15%
        of total household demand.

                                                                                                    4
An Coimisiún um Rialáil Fóntais Commission for Regulation of Utilities
Table of Contents
CRU Mission Statement ........................................................................................... 1
Public/Customer Impact Statement ........................................................................ 1
Executive Summary – Key Messages..................................................................... 2
Glossary of Terms and Abbreviations.................................................................... 8
1. Introduction ...................................................................................................... 10
1.1 Background .............................................................................................................. 10
1.1.1 The Commission for Regulation of Utilities ............................................................... 10
1.1.2 Objectives of this Report .......................................................................................... 10
1.1.3 Related Documents .................................................................................................. 10
CUSTOMER ENGAGEMENT AND PROTECTION ................................................. 11
2. Energy and Water Customer Care .................................................................. 11
2.1 Customer Complaints to Energy Suppliers ............................................................... 11
2.2 Customer Complaints to Irish Water........................................................................ 12
2.3 CRU Customer Care Statistics................................................................................... 13
2.3.1 Customer Contacts ................................................................................................... 13
2.3.2 Customer Complaints ............................................................................................... 15
3. Audits of Compliance ...................................................................................... 18
3.1 Audits of Compliance for Energy Suppliers .............................................................. 18
3.2 Audits of Compliance for Irish Water ....................................................................... 18
4. Water Customer Activity ................................................................................. 20
4.1 Quality of Service ..................................................................................................... 20
4.1.1 Interruptions to Water Supply .................................................................................. 20
4.1.2 Boil Water Notices .................................................................................................... 21
4.1.3 Water Restriction Notices ......................................................................................... 21
4.2 First Fix Free Scheme ............................................................................................... 22
4.3.1 Number of Leak Repairs............................................................................................ 22
4.3.2 Water Saved Due to Leak Repairs ............................................................................. 23
5. Energy Consumer Survey ............................................................................... 24
6. Electricity and Gas Customer Switching and Renegotiations ..................... 26
6.1 Electricity and Gas Switching ................................................................................... 26
6.2 Renegotiations of Contracts/Tariffs ......................................................................... 29
5An Coimisiún um Rialáil Fóntais Commission for Regulation of Utilities
6.3 Potential Cost Savings from Switching ..................................................................... 30
7. Energy Bill Management ................................................................................. 34
7.1 Energy Arrears and Payment Plans .......................................................................... 34
7.2 Energy Pay as You Go Financial Hardship Meters .................................................... 36
7.3 Energy Disconnections for Non-Payment of Account .............................................. 38
8. Energy Smart Meters ....................................................................................... 41
ENERGY PRICES .................................................................................................... 42
9. Retail Energy Prices ........................................................................................ 42
9.1 Calculation of Estimated Annual Bills ...................................................................... 42
9.2 Average Estimated Annual Bills Across Suppliers .................................................... 44
9.3 Estimated Annual Bills Over Time ............................................................................ 47
9.4 Electricity and Gas Prices in a European Context ..................................................... 49
10. Wholesale Energy Prices ................................................................................ 52
10.1 Wholesale Gas Prices ............................................................................................... 52
10.2 Wholesale Electricity Prices ..................................................................................... 52
10.3 Correlation of Wholesale Gas and Electricity Prices ................................................ 53
SECTORAL DEVELOPMENTS ............................................................................... 55
11. Energy Market Developments......................................................................... 55
12. Electricity Market ............................................................................................. 58
12.1 Domestic Electricity Market Share ........................................................................... 59
12.2 Small-Sized Business Electricity Market Share ......................................................... 61
12.3 Medium-Sized Business Electricity Market Share .................................................... 63
12.4 Large Energy Users (LEUs) Electricity Market Share ................................................. 64
10.4 Electricity Market Concentration ............................................................................. 66
13. Gas Market ....................................................................................................... 67
13.1 Domestic Gas Market Share..................................................................................... 68
13.2 Industrial and Commercial (IC) Gas Market Share ................................................... 70
13.3 Medium-Sized Non-Domestic Gas Market Share ..................................................... 72
13.4 Daily Metered (DM) Market Share .......................................................................... 73
13.5 Large Daily Metered (LDM) Market Share ............................................................... 75
10.5 Gas Market Concentration ....................................................................................... 76
14. Water Sector..................................................................................................... 77
14.1 Irish Water Customer Base ...................................................................................... 77
6An Coimisiún um Rialáil Fóntais Commission for Regulation of Utilities
14.1.1 Irish Water Customer Breakdown ............................................................................. 77
14.1.2 Irish Water Customer Trends .................................................................................... 78
14.2 Water Consumption................................................................................................. 78
14.2.1 Water Demand Breakdown ...................................................................................... 78
14.2.2 Domestic Usage ........................................................................................................ 79
15. Conclusion ....................................................................................................... 82
APENDICES ............................................................................................................ 83
Appendix 1 .............................................................................................................. 83
Electricity and Gas Prices in a European Context................................................................ 83
Annex 1 ................................................................................................................... 87
Overview of Business Electricity Pass Through Costs and Charges for 2018/19 ................. 87
Annex 2 ................................................................................................................... 88
Overview of Gas Pass Through Costs and Charges for 2018/19 .......................................... 88
7An Coimisiún um Rialáil Fóntais Commission for Regulation of Utilities
Glossary of Terms and Abbreviations
Abbreviation or Term Definition or Meaning
AQ Annual Quantity
BWN Boil Water Notice
CEER Council of European Energy Regulators
CCT CRU Customer Care Team
CRU Commission for Regulation of Utilities
DAM Day Ahead Market
DM Daily Metered
DUoS Distribution Use of System
EAB Estimated Annual Bill
GNI Gas Networks Ireland
GPRN Gas Point Registration Number
GPRO Gas Point Registration Operator
GWh Gigawatt hours
HHI Herfindahl-Hirschman Index
IC Industrial and Commercial
kWh Kilowatt hours
LDM Large Daily Metered
LEU Large Energy Users
8An Coimisiún um Rialáil Fóntais Commission for Regulation of Utilities
Ml/d Millions of litres per day
MPRN Meter Point Registration Number
MRSO Meter Registration System Operator
MWh Megawatt hours
NDM Non-Daily Metered
NBP National Balancing Point
NPA Non-Payment of Account
NSMP National Smart Metering Programme
PAYG Pay As You Go
PSO Public Service Obligation
SEAI Sustainable Energy Authority of Ireland
SEM Single Electricity Market
SME Small and Medium Sized Enterprises
SPC Supply Point Capacity
TUoS Transmission Use of System
UR Utility Regulator
WRN Water Restriction Notice
WTP Water Treatment Plant
9An Coimisiún um Rialáil Fóntais Commission for Regulation of Utilities
1. Introduction
1.1 Background
1.1.1 The Commission for Regulation of Utilities
The Commission for Regulation of Utilities (CRU) is Ireland’s independent energy and water
regulator. The CRU was established in 1999 and now has a wide range of economic, customer
protection and safety responsibilities in energy. The CRU is also the regulator of Ireland’s public
water and wastewater system. Our mission is to regulate water, energy and safety in the public
interest.
Further information on the CRU’s role and relevant legislation can be found on the CRU’s website
at www.cru.ie.
1.1.2 Objectives of this Report
The purpose of this report is to provide consumers, industry and other interested stakeholders with
relevant information on the development of competition in the electricity and gas retail markets, an
overview of the key developments in the water sector and the work of the CRU Customer Affairs
Team in providing a free dispute resolution service to customers.
This report analyses trends in a number of key indicators, including prices, consumption, customer
numbers, internal and external switching, pay-as-you-go meters, and disconnections for non-
payment of account, and outlines the key developments in the retail electricity and gas markets.
Additionally, the report presents information on Irish Water’s customer base, excess use of water,
billing, first fix scheme, and quality of service, and customer complaints and contacts received by
the CRU Customer Affairs Team against energy suppliers and network companies, and Irish
Water.
The primary sources of data in this report are: Meter Registration System Operator (MRSO) - ESB
Networks, Gas Point Registration Operator (GPRO) - Gas Networks Ireland (GNI), energy
suppliers, Irish Water, and the CRU Customer Affairs Team.
1.1.3 Related Documents
Information on the CRU’s role and relevant legislation can be found on the CRU’s website at
www.cru.ie
10CUSTOMER ENGAGEMENT AND PROTECTION
CUSTOMER ENGAGEMENT AND
PROTECTION
2. Energy and Water Customer Care
Summary of Section
• This section contains information on the number of customer complaints received by
energy suppliers, Irish Water and the CRU Customer Affairs Team.
• Complaints are defined as a customer’s expression of dissatisfaction and refer to the
number of valid or invalid complaints made to the supplier regardless of form - letter,
email, phone call, in person - during the reporting period. Only complaints requiring
some form of explicit follow-up are included (i.e. where follow-up is required whether
requested or not). Where a complaint has been resolved in the same reporting period
as it had been raised, it is still included in this indicator.
• In 2019, energy suppliers received complaints from 0.9% of their electricity customers
(22,145 complaints) and from 1.2% of their gas customers (8,156 complaints).
• In 2019, Irish Water received 68 domestic customer complaints for every 10,000
customers, which is a 0.58% complaint rate.
• Irish Water had fewer open complaints at the end of 2019 (357 complaints) compared
to the number of open complaints at the end of 2018 (610 complaints).
2.1 Customer Complaints to Energy Suppliers
The CRU monitors three sources of energy customer complaints data: customer complaints
received by suppliers, statistics from the CRU Customer Care Team (see section 2.3), and the
CRU Consumer Survey (see section 5).
The CRU collects data from suppliers on a yearly basis concerning the number of complaints they
received from customers. The table below shows that suppliers received complaints from 1.3% of
their customers in 2019. On average more complaints are received from gas customers in
comparison to electricity. Overall, there is a small difference between domestic and non-domestic
complaint rates, with the rate of complaints for both gas and electricity being slightly lower for non-
domestic customers.
Number of % of total
Market Segment Total customers
complaints customers
Domestic Electricity 20,118 2,099,559 1.0%
Non-Domestic Electricity 2,027 290,837 0.7%
Domestic Gas 7,948 678,766 1.2%
Non-Domestic Gas 208 27,103 0.8%
Dual Fuel 8,476 - -
Total 38,777 3,096,265 1.3%
Table 1: Complaints to Energy Suppliers in 2019 per Customer Category
The figure below shows the number of complaints per 10,000 customers. On average more
complaints are received from gas customers in comparison to electricity customers. Domestic
customers in both electricity and gas, raise on average more complaints with their energy supplier
11CUSTOMER ENGAGEMENT AND PROTECTION
compared to non-domestic customers. Between 2015-2019 there was a year-on-year increase in
the number of complaints per 10,000 domestic electricity customers. The number of complaints
per 10,000 customers was more variable for the other segments - domestic gas and non-domestic
electricity and gas - over the same period.
140
120
100
80
60
40
20
0
Domestic Non-Domestic Total Domestic GasNon-Domestic Total Gas
Electricity Electricity Electricity Gas
2015 2016 2017 2018 2019
Figure 1: Complaints to Energy Suppliers per 10,000 Customers
2.2 Customer Complaints to Irish Water
Irish Water is obliged to report to the CRU on the number and type of domestic complaints it
receives, in accordance with the CRU-approved Domestic Customer Handbook. Currently, Irish
Water does not report non-domestic customer complaints data in this format to the CRU. However,
this is expected to begin later this year and the CRU plans to include this data in future iterations
of this report.
Most complaints received by Irish Water tend to be in customer operations matters including
blockages, reduced water pressure and flooding.
The table below shows the number of domestic customer complaints per 10,000 customers and
the number of complaints as a percentage of total customers. In 2019 there were 68 customer
complaints for every 10,000 customers, which is a 0.58% complaint rate. The number of complaints
is below those seen in the electricity and gas sectors. However, complaints in the water sector are
not as comparable to the electricity and gas sectors, as there is no retail competition or billing of
domestic customers.
Customer category 2017 2018 2019
Complaints per 10,000 customers 113 64 68
Customer Complaint % 0.64% 0.68% 0.58%
Table 2: Complaints to Irish Water per 10,000 Customers
The figure below provides a further breakdown of domestic customer complaints over time. It
highlights that in 2019 Irish Water experienced its lowest level of new customer complaints since
it began collecting this data. Irish Water closed more complaints than were created resulting in less
12CUSTOMER ENGAGEMENT AND PROTECTION
complaints being open at the end of 2019 (357) than there were open at the end of 2018 (610). In
addition, the number of complaints which took more than 60 days to resolve were reduced.
12000
1083110610
10278
10000 9230 9479
Number of complaints
8000
6000
4000
2000
756 610 567 357
391
n/a n/a
0
2017 2018 2019
Complaints created during year Complaints closed
Complaints closed > 60 days Complaints open at end of year
Figure 2: Customer Complaints to Irish Water
2.3 CRU Customer Care Statistics
2.3.1 Customer Contacts
A customer contact is any call, email (including webform) or letter received by the CRU’s Customer
Care Team (CCT).
The figure below displays the total number of customer contacts received by the CCT each quarter
(for the past five quarters) per energy supplier.
1000
900 49
40
800 48
52 29
41
Number of contacts
700 97 28
91 133
600 37 57
79 100 118 77
99
500 70 79
70
400 244 239
253 221
300 209
200
262 272 230
100 206 206
0
Q4 2018 Q1 2019 Q2 2019 Q3 2019 Q4 2019
Iberdrola Just Energy Panda Flogas Pinergy
PrePayPower Energia Airtricity BGE Electric Ireland
Figure 3: Volume of Customer Contacts Logged Against Each Energy Supplier
13CUSTOMER ENGAGEMENT AND PROTECTION
Account problems and billing issues continue to account for the largest percentage of issues
brought to the CCT by energy customers; 54% in Q4 2019. Of the billing issues reported; high
bills, inaccurate bills, catch up bills (stemming from a history of estimated readings), change in
tariff, debt collection and problems associated with level pay plans were among the main problems
outlined by customers. Marketing and Sign Up accounted for 12% of customer contacts while
Customer Service accounted for 8%. Pay as you go (PAYG) issues also accounted for 8% of
contacts in Q4 2019. The percentage of switching contacts overall (combined for electricity and
gas) decreased from 7% in Q3 2019 to 6% in Q4 2019.
The remaining 18% of contacts consisted of varied issues.
Top 5 Contact Types - Energy Suppliers (Combined) Q4 2019
1 Billing 39%
2 Account Problems 15%
3 Marketing & Sign-up 12%
4 Customer Service 8%
5 PAYG issues 8%
Table 3: Breakdown of key issues logged against each energy supplier via customer
contacts
The figure below displays the volume of customer contacts received in relation to ESB Networks
(ESBN) and Gas Networks Ireland (GNI). It is important to consider that ESBN has a much greater
customer base that that of GNI.
ESBN GNI
80 74 74
70 69
70
60
60
No. of contacts
50
40
30 30
30 24
19 21
20
10
0
Q4 2018 Q1 2019 Q2 2019 Q3 2019 Q4 2019
Figure 4: Volume of Customer Contacts Logged Against Each Energy Network Company
The main drivers for contacts in relation to ESBN included; quality of supply (voltage and outages),
connection issues (fees, timelines) and metering issues (meter faults, disputed meter readings
etc).
Top 3 Contact Types - Electricity Networks Q4 2019
1 Quality of Supply 28%
2 Connection Issues 24%
3 Meter Issues 21%
Table 4: Breakdown of key issues logged against ESBN via customer contacts
14CUSTOMER ENGAGEMENT AND PROTECTION
The key issues reported by GNI customers included; meter issues (mainly meter tampering),
connection issues and disconnection procedures
Top 3 Contact Types - Gas Networks Q4 2019
1 Meter Issues 38%
2 Connection Issues 24%
3 Disconnection 10%
Table 5: Breakdown of key issues logged against GNI via customer contacts
The figure below illustrates the number of contacts received each quarter in relation to Irish Water.
90
81
80 73 72
68
70
No. of contacts
60 56
50
40
30
20
10
0
Q4 2018 Q1 2019 Q2 2019 Q3 2019 Q4 2019
T
Figure 5: Volume of Customer Contacts Logged Against Irish Water
Connections featured as the key issue for Irish Water customers and represented 30% of water
related contacts in Q4 2019. Other key issues included billing and account issues, customer
service, and leaks.
Top 5 Contact Types - Irish Water Q4 2019
1 Connections 30%
2 Billing 21%
3 Account Problems 21%
4 Customer Service 5%
5 Leaks 5%
Table 6: Breakdown of key issues logged against Irish Water via customer contacts
2.3.2 Customer Complaints
The data below looks at complex complaints which were logged by the CRU. A complex complaint
is a complaint referred to the CRU for dispute resolution after it has exhausted the internal
supplier/network operator/Irish Water complaints procedure. Further information on Complex
Complaints will be available in the Customer Care Team Annual Report for 2019 which will be
published at the end June/early July 2020.
The figure below displays the volume of complex complaints logged each quarter in relation to
energy suppliers. Complaints logged against energy suppliers decreased significantly towards the
latter stages of 2019.
15CUSTOMER ENGAGEMENT AND PROTECTION
80
70
60
50
40
30
20
10
0
Q4 2018 Q1 2019 Q2 2019 Q3 2019 Q4 2019
Figure 6: Volume of Complex Complaints Logged Against Each Energy Supplier
The problem profiles (complaint categories) of complaints logged against energy suppliers mainly
relate to billing issues such as bill shocks/catch up bills, level pay plans, arrears and general billing
errors. Other key issues include account problems, disconnections, switching errors, high
charges/tariffs, contract disputes and issues regarding marketing and sign up.
The figure below displays the volume of complex complaints logged against the energy network
companies.
12
ESBN GNI
10
8
6
4
2
0
Q4 2018 Q1 2019 Q2 2019 Q3 2019 Q4 2019
Figure 7: Volume of Complex Complaints Logged Against Each Energy Network Company
The volume and type of complaints logged against the two energy network companies (ESB
Networks and Gas Networks Ireland) remains relatively low.
Complaints against ESBN related to quality of supply, network/sitework charges, customer service,
metering issues and connections. GNI complaints related to meter issues (tampering, faulty
meters), disconnections and customer service.
Overall, the level of Irish Water complaints escalated to CRU remains low relative to Irish Water’s
customer base. Complaints mainly relate to problems with customer accounts, customer service,
connection charges, and billing issues.
16CUSTOMER ENGAGEMENT AND PROTECTION
12
10
8
6
4
2
0
Q4 2018 Q1 2019 Q2 2019 Q3 2019 Q4 2019
Figure 8: Volume of Complex Complaints Logged Against Irish Water
17CUSTOMER ENGAGEMENT AND PROTECTION
3. Audits of Compliance
3.1 Audits of Compliance for Energy Suppliers
The CRU regularly conducts audits of compliance to ensure that suppliers are meeting their
regulatory obligations. The CRU’s Supplier Handbook sets out the minimum service requirements
that suppliers must adhere to in their dealings with energy customers. It comprises of individual
Codes of Practice that cover all key areas of customer-supplier interaction, including: billing,
disconnections, marketing, vulnerable customers and PAYG meters. These rules are in place to
ensure that customers enjoy a high standard of protection in their dealings with licensed suppliers
and are in line with the CRU’s legislative duties3.
In Q4 2019 the CRU audited suppliers’ adherence to the rules relating to the Codes of Practice for
Customer Sign-up for domestic and non-domestic customers.
Overall, the 2019 audit found a good level of compliance with only a small number of areas
requiring remedial actions.
• Eleven suppliers (both domestic and non-domestic) were subject to audit. These suppliers
included BE Energy, Bord Gáis Energy, Electric Ireland, Energia, Flogas, Go Power,
Naturgy, Panda Power, Pinergy, PrepayPower and SSE Airtricity.
• Seven suppliers (Bord Gáis Energy, Energia, Go Power, Naturgy, Panda Power,
PrepayPower, SSE Airtricity) were considered to have demonstrated full audit compliance.
• Four suppliers (BE Energy, Electric Ireland, Flogas, Pinergy) were requested to undertake
remedial actions. These actions where requested for the following five reasons:
o Ambiguous wording in example Welcome Letter.
o Inconsistency between deposit amounts stated in different documents.
o Inconsistency between how the number of days in cooling off period are presented
o Certain marketing SMS did not contain an easy method of unsubscribing.
o Conflicting information regarding winter disconnections.
• All areas requiring remedial actions were in regard to domestic customers, and at the time
of publication of the audit report in March 2020 all remedial actions have been completed by
suppliers, as requested.
The 2019 annual audit of compliance for electricity and gas suppliers can be found on the CRU
website.
3.2 Audits of Compliance for Irish Water
In its role as economic regulator of water, the CRU aims to protect the interests of customers by
monitoring the performance of Irish Water in delivering its services which includes service incidents
such as Boil Water Notices (BWN).
In October and November 2019 two separate BWNs related to issues with the operation of the
Leixlip Water Treatment Plant were issued to Irish Water customers, impacting on over 600,000
customers. Due to the large number of customers affected by these BWNs, the CRU has
conducted an audit on Irish Water’s levels of compliance with its obligations with regard to
customer service and customer protection during a BWN. The CRU reviewed the suite of BWN
obligations on Irish Water as set out in the Domestic and Non-Domestic Customer Handbooks.
3
S.I. No. 452 of 2004 European Communities (Internal Market in Natural Gas)
S.I. No. 60 of 2005 (Electricity) European Communities (Internal Market in Electricity)
18CUSTOMER ENGAGEMENT AND PROTECTION
Overall, this audit found that Irish Water complied with the majority of its obligations in relation to
BWNs, where 28 of the 34 individual BWN requirements assessed across both the Domestic and
Non-Domestic Customer Handbooks were completed in full.
In the course of the audit the CRU also identified two other incidents of non-compliance with
handbook requirements. A summary of the main findings is set out below.
• Anticipated Duration of the BWN
Finding 1 – Irish Water was not in compliance with Section 5.2.3 of the Domestic and Non-
Domestic Customer Handbooks which require it to highlight the anticipated duration of the
notice.
• Complaints Process
Finding 2 – Irish Water was not in compliance with sections 10.2.1 of the Domestic Customer
Handbook and Section 9.2.1 of the Non-Domestic Customer Handbooks which require it to
provide an easy process for customers/potential customers to use when they are
experiencing difficulties with their water/wastewater service supply and wish to make a
complaint to Irish Water.
• Additional Requirements of Vulnerable Customers
Finding 3 – Irish Water was not in compliance with Section 8.3.5 of the Domestic Customer
Handbook as it did not contact the specified Vulnerable Customers directly to ascertain what
extra requirements they might have in relation to the BWN.
Finding 4 - Irish Water was also not in compliance with Section 8.4.3 of the Domestic
Customer Handbook as it did not contact the specified Vulnerable Customers directly to
ascertain whether they require assistance to access alternative supplies.
• Digital Maps of BWN Areas
Finding 5 – Irish Water was not in compliance with Sections 5.1.2 of the Domestic and Non-
Domestic Customer Handbooks as information provided in digital maps regarding areas
where BWNs apply was neither accurate nor easy to understand.
Based on these findings, Irish Water was required to undertake remedial actions. At the time of
publication of the Audit of Compliance Information Paper, Irish Water had completed two of the
three required remedial actions in relation to the findings of non-compliance. The completion of the
outstanding action to address the digital online maps requires internal work by Irish Water which
was impacted by the COVID-19 restrictions.
The CRU also identified two other issues in the course of the audit which were noted as significant
but not deemed to be instances of non-compliance. These included a website outage which
impacted customer communication and a delay in issuing non-domestic bills. Irish Water is
required to submit a statement of billing compliance regarding rebates on non-domestic customer
bills. This is to be submitted to the CRU no later than 31st July 2020 when all relevant billing cycle
rebates should have been completed. This is to ensure that the customer rebates for BWNs are
provided in line with the requirements of the CoP on Billing for Non-Domestic Customers (in
particular Requirement 7.1.4).
The CRU will continue to monitor Irish Water’s compliance with its legislative obligations as set out
in the Customer Handbooks as part of its scheduled regulatory compliance work programme. This
will include quarterly spot checks, an annual audit and investigating any ad hoc issues should they
arise.
The full report of the Irish Water Compliance Audit of the Leixlip Water Treatment Plant Boil Water
Notices is available on the CRU website.
19CUSTOMER ENGAGEMENT AND PROTECTION
4. Water Customer Activity
Summary of Section
• This section contains information on Irish Water’s supply of water to customers and its
engagement with customers under the First Fix Scheme.
• In 2019, there were less interruptions to water supply, with a year-on-year decrease in
planned interruptions of 18% and a year-on-year decrease in unplanned interruptions
by 31%.
• In 2019, Irish Water issued Boil Water Notices for water supplies which served a
combined population of over 1.3 million people and Water Restriction Notices for water
supplies which served a combined population of over 8,000 people.
• In the first half of 2019, Irish Water has completed 2,819 repairs under the First Fix
Scheme and customers have completed 1,252. These repairs are estimated to save 12
million litres of water per day on a combined basis.
4.1 Quality of Service
Irish Water is responsible for providing safe, reliable and clean drinking water to all of its customers.
The following metrics give an indication of how Irish Water is performing in this regard.
4.1.1 Interruptions to Water Supply
The figure below provides information on the number of interruptions to domestic and non-
domestic customers’ water supply. Irish Water reports to the CRU on both the number of planned
and unplanned interruptions. An unplanned interruption is where water supply is unexpectedly and
temporarily stopped. There are roughly 10,000 interruptions each year. As highlighted by the figure
below there was a drop in the number of unplanned interruptions, decreasing by 31% to 7,311 in
2019 from 10,593 in 2018. There was also an 18% drop in the number of planned interruptions
with 850 in 2019, down from 1,032 in 2018.
14,000
12,000
1,032
number of interruptions
10,000
298
8,000 850
6,000
10,593
9,218
4,000 7,311
2,000
0
2017 2018 2019
Number of unplanned interruptions Number of planned interruptions
Figure 9: Number of planned and unplanned interruptions to customer water supplies
20CUSTOMER ENGAGEMENT AND PROTECTION
4.1.2 Boil Water Notices
A boil water notice (BWN) is a formal notice issued to all properties in an area advising that drinking
water from the public mains is not safe to drink unless it is boiled and cooled beforehand. The table
below provides information on the population served by supplies with a BWN in place.
2015 2016 2017 2018 2019
Population served by supply
22,699 98,431 17,970 97,559 1,304,860
placed on a BWN during the year
Population served by supply with
37,091 101,890 23,291 96,689 1,289,661
a BWN lifted during the year
Population served by supply with
8,799 5,340 19 899 16,098
a BWN at year end
Table 7: Population served by supply with a boil water notice in place
At the end of 2019, Irish Water reported that a population of 16,098 was being served by 18
supplies with a BWN in place. This was an increase on the 899 served by supplies with a BWN at
the end of 2018. In addition, there was an increase in the population served by supplies placed on
BWNs during the year, with over 1.3 million affected. Typically, BWNs are issued due to a variety
of reasons including inadequate disinfection, monitoring results failures, source contamination and
adverse weather conditions. The main driver for the large population affected by BWNs in 2019
were the two separate BWNs related to issues with the operation of the Leixlip Water Treatment
Plant (WTP) in October and November 2019 impacting over 600,000 customers on both occasions.
Due to the large number of customers affected by these BWNs, the CRU has conducted an audit
on Irish Water’s levels of compliance with its obligations regarding customer service and customer
protection during a BWN. The CRU published this audit on its website in April 2020 (CRU/20/052).
4.1.3 Water Restriction Notices
A water restriction notice (WRN) is an instruction issued to the public if the water supply within a
certain area is not guaranteed to be at the quality standards required by the European Union
Drinking Water Regulations 2014 and either not safe to drink or use, as boiling it will have no effect
on removing the contaminant. There are several different types of water restriction notices that
may be issued e.g. Do Not Consume Notices are issued where water should not be used for
drinking or cooking but can be used for personal bathing or household cleaning activities etc.
2015 2016 2017 2018 2019
Population served by supply
1,027 54 212 20,624 8,409
placed on a WRN during the year
Population served by supply with
651 188 347 20,190 9,104
a WRN lifted during the year
Population served by supply with
4,219 4,085 3,950 4,384 3,689
a WRN at year end
Table 8: Population served by supply with a water restriction notice in place
At the end of 2019, the population served by supplies with a WRN in place was 3,689, which is
lower than previous years. However, 2019 also saw the second highest population, 9,104, served
by supplies placed on a water restriction during the year. Water restriction notices can be caused
by contamination of the source and problems with chlorine dosing. Some supplies may be affected
by lead due to the presence of lead pipework on the customer side. Irish Water’s Lead in Drinking
Water Mitigation Plan aims to reduce the supplies affected by this issue. The goal of the Mitigation
Plan is the removal of all lead pipework.
21CUSTOMER ENGAGEMENT AND PROTECTION
4.2 First Fix Free Scheme
Irish Water produces 1.7 billion litres of treated water per day, but nearly half of this is lost through
leaking pipes. Irish Water estimate that 20% to 30% of water losses are through customer side
leakage.
To help address this, in August 2015 the CRU approved Irish Water’s First Fix Scheme. This
provides qualifying customers with free leak investigation and repair to their external supply pipe,
thus enabling greater water conservation. Irish Water identifies and prioritises the most significant
leaks first.
The CRU monitors the operation of the scheme through quarterly reports submitted by Irish Water.
These include details of number of repairs completed and litres of water saved.
Later this year, the CRU plans to consult on proposed changes to the scheme which would expand
its scope to make it available to a greater number of customers. As part of this consultation, the
CRU will review the operation of the first fix scheme to date and assess its effectiveness as a
leakage reduction measure over the past six years.
4.3.1 Number of Leak Repairs
The figure below shows the number of leak repairs completed by Irish Water under the First Fix
Scheme and by customers upon being notified of a leak by Irish Water under the scheme. At
present Irish Water has only reported data for the first half of 2019 (2019 H1). In 2019 H1, Irish
Water completed 2,819 repairs and customers completed 1,252. Based on the number of repairs
seen in 2019 H1, the CRU estimates that for the whole of 2019 the number of customer repairs
should remain relatively stable compared to 2018 while the number of repairs carried out by Irish
Water should increase compared to 2018, if the observed trends continue. The graph below
highlights a reduction in both Irish Water and customer leak repairs from 2016 to 2017, caused by
Irish Water’s temporary postponement on the issuance of leakage notice letters to customers.
Since recommencement in Q3 2017 the number of repairs carried out by Irish Water returned to
previous levels. However, the number of customer repairs have remained lower than the levels
seen in 2015 and 2016. This could be due to a range of factors, such as typically higher levels of
customer engagement at outset of the initiative, Irish Water issuing a lower number of notice letters,
and a reduced incentive for customers to fix leaks since the removal of domestic charges.
25,000
Irish Water Repairs Completed
20,000 Customer Repairs Completed
Number of repairs
15,000
10,000
5,000
0
2015 2016 2017 2018 2019 H1
Figure 10: Number of repairs completed by Irish Water and customers under the First Fix
Free Scheme.
22CUSTOMER ENGAGEMENT AND PROTECTION
4.3.2 Water Saved Due to Leak Repairs
The figure below shows water savings as a result of the above repairs. The volume of water saved
is presented in millions of litres per day (Ml/d). The blue and orange bars distinguish between the
water savings due to Irish Water (blue) and customer savings and should be viewed against the
left vertical axis. The blue area in the background presents the cumulative water savings, estimated
by Irish Water, due to both types of repairs and should be viewed against the right axis. The
cumulative illustration indicates that approximately 150 Ml/d of water is being saved every day due
to these repairs. To put that in perspective the average daily household use is approximately 342
litres4, which indicates that the daily savings now equate to the daily use of approximately 440,000
households.
30 160
Annual water savings (Ml/day)
Cumulative water savings (Ml/day)
140
25
120
20
100
15 80
60
10
40
5
20
0 0
2015 2016 2017 2018 2019 H1
Cumulative water savings (Ml/day) Savings from IW Repairs (Ml/day)
Savings from Customer Repairs (Ml/day)
Figure 11: Water savings in millions of litres per day due to repairs completed by Irish
Water and customers under the First Fix Scheme.
4
Calculated by the CRU in its 2017 Advice to the Minister paper (CRU/17/339)
23CUSTOMER ENGAGEMENT AND PROTECTION
5. Energy Consumer Survey
Each year the CRU conducts a survey of the residential and Small and Medium Sized Enterprises
(SME) electricity and gas markets in Ireland to measure consumer engagement, experiences and
attitudes. The purpose of the survey is to provide additional consumer-based insights to the market
monitoring activities of the CRU, to contribute to consumer protection polices and codes of practice
for energy suppliers and to further empower customers in the competitive energy market.
This research has been ongoing since 2011 and provides an insight to the changes which have
occurred since then, as well as providing a more detailed update on attitudes in 2019. The 2019
research was conducted by Behaviour & Attitudes and The Research Perspective under the
direction of the CRU.
It is evident from the results of the survey that a number of factors influence customer’s perceptions
of and engagement in the respective energy markets. These factors include, inter alia, satisfaction
with suppliers, understanding of bills and the associated calculation of cost for both electricity and
gas consumed, market knowledge and the capability to easily evaluate offers from alternative
suppliers and finally the switching process and how easy customers find the comparison of tariffs.
Customers in both the residential and SME energy markets report a high level of satisfaction with
the service from their suppliers, with Overall Satisfaction scores of 88% and 89% in the residential
market and 82% and 85% respectively for electricity and gas in the SME market. In both markets
these scores show remarkable stability, reflected in the satisfaction scores, notwithstanding
changes in pricing and variations in service.
It is clear that more work needs to be done to motivate customers’ engagement in the market, for
both residential and SME customers. While awareness of competitors in the market has increased,
in particular for more recent entrants to the markets, close to 30% of residential and between 20%
and 30% of SME customers are passive in terms of awareness of offers from other suppliers.
Finding a way to motivate customers to consider other offers is dependent on their having the
capability to understand and compare alternatives. At present, between 26% and 30% of
residential customers and 33% and 36% of SME respondents indicate they have a good
understanding of and ability to compare offers in the electricity and gas markets.
Switching rates are showing improvement with 19% of residential electricity customers and 17%
of residential gas customers indicating they switched in the past 12 months and reducing
proportions who indicate they have never switched (49% electricity and 55% gas). In the case of
the SME market 29% of electricity customers and 22% of gas customers switched in the past 12
months, with the totals for never having switched now at 28% for electricity and 34% for gas. This
shows considerable improvement in terms of engagement and it is supported by the ease with
which customers perceive the process and their experience of the outcome. In the case of the
residential market, the switching process is receiving improved scores with 87% and 92%
respectively satisfied with the overall ease of switching and improved assessments of the
outcomes across all the metrics. Similarly, in the case of the SME market, ease of switching also
improved with 91% of SME’s in electricity and 87% of SME’s in the gas market reporting improved
satisfaction with the ease of the switching process, and improvement reported across almost all
the outcome metrics.
It is important to remain aware that those who switched supplier in the past 12 months tend to be
very focused on price savings and are clear that that there is price differentiation in the market. By
the same token, those who have never switched are likely to be less aware of price differences
between suppliers and of differentiated offers, and as such are unlikely to understand that the
benefits of switching supplier. The improvement in the switching highlights that barriers to switching
are becoming less significant and the ease with which a customer can switch is improving, but that
is the case for those who have switched. It is worth recalling that circa 50% of the residential market
24CUSTOMER ENGAGEMENT AND PROTECTION
and close to 25% of the SME market have never switched, and the challenge remains to ensure
there are no structural or process barriers remaining which discourage that segment from
switching.
This is more important in regard to the future success of smart meters in empowering residential
and SME customer manage their energy consumption and associated cost to best effect. If
customers are aware of their consumption and cost thereof, they will be more likely to appreciate
the value of a smart meter in enabling them to manage these aspects of their domestic and
business affairs. In the 2019 measurement, it is clear that there is an appetite for smart meters
with 65% and 73% of residential electricity and gas customers respectively indicating interest in
getting a smart meter and 75% of SME’s in the electricity market indicating interest in having a
Time of Use tariff and furthermore 85% interested in viewing daily electricity usage.
More information on the background and result of the 2019 survey can be found on the CRU
website.
25You can also read