Diverse paradigms of residential development inform water use and drought-related conservation behavior - IOPscience
←
→
Page content transcription
If your browser does not render page correctly, please read the page content below
LETTER • OPEN ACCESS

Diverse paradigms of residential development inform water use and
drought-related conservation behavior
To cite this article: Kimberly J Quesnel et al 2020 Environ. Res. Lett. 15 124009

View the article online for updates and enhancements.

                                This content was downloaded from IP address 46.4.80.155 on 21/12/2020 at 15:27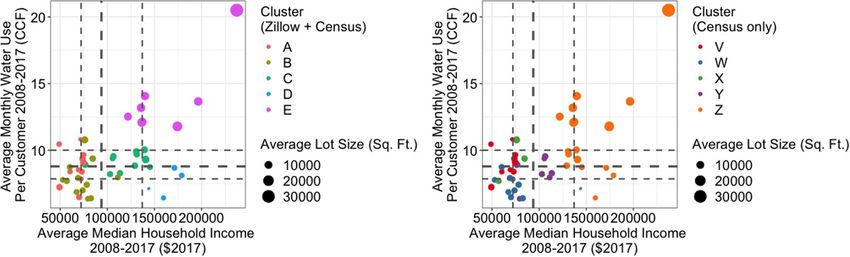
Environ. Res. Lett. 15 (2020) 124009 https://doi.org/10.1088/1748-9326/abb7ae
Environmental Research Letters
LETTER
Diverse paradigms of residential development inform water use
OPEN ACCESS
and drought-related conservation behavior
RECEIVED
21 February 2020 Kimberly J Quesnel1,2,3, Saahil Agrawal4 and Newsha K Ajami2,3
REVISED 1
7 August 2020 Blue Forest Conservation, 2716 6th Ave, Sacramento, CA 95818, United States of America
2
Stanford Woods Institute for the Environment, Stanford University, 473 Via Ortega, Stanford, CA 94305, United States of America
ACCEPTED FOR PUBLICATION 3
11 September 2020
Bill Lane Center for the American West, Stanford University, 473 Via Ortega, Stanford, CA 94305, United States of America
4
Department of Management Science and Engineering, Stanford University, 475 Via Ortega, Stanford, CA 94305,
PUBLISHED
United States of America
18 November 2020
E-mail: newsha@stanford.edu
Original content from Keywords: urbanization, water demand, water conservation, clustering
this work may be used
under the terms of the Supplementary material for this article is available online
Creative Commons
Attribution 4.0 licence.
Any further distribution
of this work must Abstract
maintain attribution to
the author(s) and the title Widespread urbanization has led to diverse patterns of residential development, which are linked
of the work, journal
citation and DOI.
to different resource consumption patterns, including water demand. Classifying neighborhoods
based on urban form and sociodemographic features can provide an avenue for understanding
community water use behaviors associated with housing alternatives and different residential
populations. In this study, we leveraged built environment data from the online real estate
aggregator Zillow to develop neighborhood typologies and community clusters via a sequence of
unsupervised learning methods. Five distinct clusters, spatially segregated despite no geospatial
inputs, were associated with unique single-family residential water use and conservation patterns
and trends. The two highest-income clusters had divergent behavior, especially during and after a
historic drought, thus unraveling conventional income–water use and income–water conservation
relationships. These clustering results highlight evolving water use regimes as traditional patterns
of development are replaced with compact, water-efficient urban form. Defining communities
based on built environment and sociodemographic characteristics, instead of sociodemographic
features alone, led to 3% to 30% improvements in cluster water use and conservation cohesion.
These analyses demonstrate the importance of smart development across rapidly urbanizing areas
in water-scarce regions across the globe.
1. Introduction versus suburban communities (Breyer and Chang
2014), infill development (Sanchez et al 2020), chan-
Today, 55% of the world’s population lives in urban ging building and landscaping codes (Brelsford and
areas with the percentage expected to grow to 68% Abbott 2017, Garcia and Islam 2019), and nontradi-
by 2050 (United Nations Department of Economic tional housing arrangements (Barnett et al 2019) can
and Social Affairs Population Division 2019). As res- also lead to heterogeneous residential water use beha-
idents move away from rural areas and into cities, vior, which has direct implications for water resources
suburbs, and towns, many different patterns of resid- management.
ential development and urban form are emerging, in Simultaneously, sociodemographic characterist-
turn affecting urban system sustainability (Jabareen ics like income and education levels often explain
2006, Pandit et al 2017, Pickett and Zhou 2015). Vari- variations in residential water use (Schleich and
ations in population density, housing structures, and Hillenbrand 2009, Shandas and Parandvash 2010,
neighborhood configurations are linked to different House-Peters and Chang 2011, Brelsford and Abbott
energy use patterns, transportation behaviors, and 2017, Quesnel and Ajami 2017, Fan et al 2017).
public health outcomes (Berrigan and Troiano 2002, Together, built environment and social features
Ewing and Rong 2008, Güneralp et al 2017, Stokes provide the building blocks for defining neighbor-
and Seto 2019). Housing features including urban hoods and communities for urban water demand
© 2020 The Author(s). Published by IOP Publishing Ltd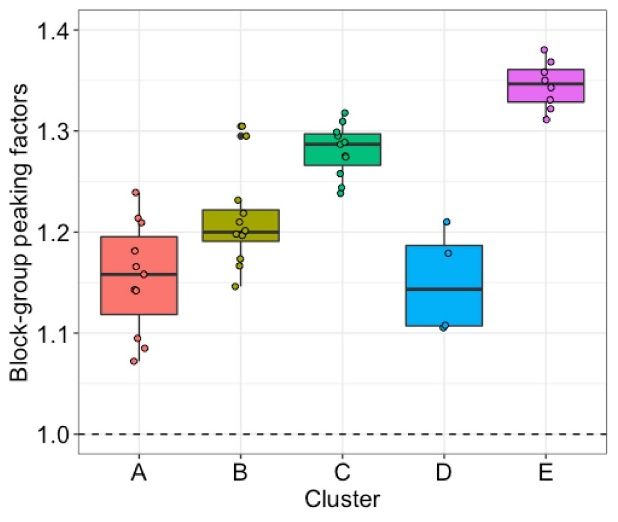
Environ. Res. Lett. 15 (2020) 124009                                                               K J Quesnel et al

assessment and planning (Jackson-Smith et al 2016,        less than $40 000 (including several block-groups
Stoker et al 2019), which in turn dictate water supply    classified as Disadvantaged Communities) to over
and infrastructure investment decisions at city to        $220 000. The San Francisco Bay Area represents a
neighborhood scales (House-Peters and Chang 2011,         region with varied and evolving water supply and
Stoker and Rothfeder 2014, Gurung et al 2016).            demand regimes, making it a particularly valuable
These characteristics are also critical for understand-   place to study urban water with lessons for other
ing water conservation behavior during drought            growing, semi-arid and arid regions across the West-
(Fielding et al 2012, Polebitski and Palmer 2013, Mini    ern U.S. and the world (Gonzales and Ajami 2017b).
et al 2015), when strategic resource management is        In our study, we focused specifically on single-family
particularly critical.                                    residential water use, which accounts for 65% of Cali-
     Grouping residential customers for water             fornia’s urban water use (California Department of
resources planning and management requires link-          Water Resources 2016) and about half of Redwood
ing bottom–up, household-level data about the built       City’s potable use (City of Redwood City 2015). Red-
environment with top–down Census block-group              wood City demand is seasonal, with higher use in the
or tract scale features. Built environment and social     summer due to landscape irrigation.
data can also be acquired through customer sur-               Our research takes place over a 10-year period
veys (Randolph and Troy 2008, Harlan et al 2009,          from 2008–2017 which included two historic
Willis et al 2013, Hannibal et al 2018), but these can    droughts and an economic recession. In particular,
be expensive, time-intensive, and limited in scope.       the 2012–2016 drought was one of the most severe
Some researchers have successfully accessed assessor      in California’s history (U.S. Geological Survey: Cali-
records on homes and parcels (for example: Chang          fornia Water Science Center 2018). The drought was
et al 2017, Brelsford and Abbott 2017), but this data     not only exceptional hydrologically, but also in terms
is generally challenging to obtain in bulk, digitized     of state and local political actions, public awareness,
formats and must be acquired on a city-by-city or         and news media coverage that led to high drought
county-by-county basis. Around the US, a few agen-        saliency and has been associated with high conserva-
cies have moved to publicly available digital records     tion rates (Quesnel and Ajami 2017, Gonzales and
like New York’s Primary Land Use Tax Lot Output           Ajami 2017a, Bolorinos et al 2020). This historic
(PLUTO) database, which can be used for building-         drought provides an important setting for examining
level water demand studies (Kontokosta and Jain           not only the drivers of water conservation, but also
2015), although these are not yet common.                 rebound once mandatory restrictions were lifted and
     New websites like Zillow, Redfin, or Trulia that     the drought was declared over (Gonzales and Ajami
aggregate and digitize records from multiple sources,     2017a, Bolorinos et al 2020). Evaluating water con-
including public agencies, offer the possibility to       servation during the 2012–2016 drought, an extreme
overcome this historic obstacle, but these sources have   event more likely to occur in the future, provides an
yet to be leveraged as a tool for analyzing urban water   opportunity to evaluate changing residential water
use. Together with Census information, this hous-         use behavior across customers under escalating cli-
ing data can be used as an alternative to traditional     matic and policy regimes.
sources to develop a holistic depiction of communit-
ies within a city, a spatial-scale which provides the     2. Methods
granularity of within-city information while being
more practical than customer-level analyses. This         2.1. Data and data integration
research aims to demonstrate the value of combining       The first step in our analysis was to gather, pro-
data on single-family residential housing features and    cess, and integrate multiple data sources using text-
urban form from Zillow with Census data to identify       matching algorithms, geocoding, and common iden-
residential community groupings. In turn, these clas-     tifiers. We aggregated and averaged (1) parcel-level
sifications can help water resource decision-makers       housing information from Zillow (Zillow 2017) to
better understand their customers’ water use beha-        define the built environment and (2) Census block-
vior, design optimal conservation policies, and plan      group level demographic information from the U.S.
for future resources needs and allocation.                Census and American Community Survey (Simply-
     We performed our analysis within a single            Analytics 2017) to quantify social structure at the
utility—exploring high-resolution data within a           block-group level, the smallest spatial scale of Census
small area to gain insights into behavior not pos-        information. Our final database included 14 features
sible at more aggregated scales while discovering         (7 from Zillow and 7 from the U.S. Census), centered
information that can be applied in a broader context.     and scaled, averaged at the block-group level (n = 46)
Our study area, the City of Redwood City (Redwood         which were spatially distributed throughout the ser-
City) is situated on the San Francisco Bay penin-         vice area. We calculated average monthly customer-
sula in California and represents a microcosm of          level water use for each block-group from 2008–2017.
diversity—in 2017, block-group level median house-        See the supplemental information for more detailed
hold income within the service area ranged from           information on the input data, our cleaning, filtering,

                                             2
Environ. Res. Lett. 15 (2020) 124009 K J Quesnel et al
and combining procedures, and the final characterist- added value of incorporating built environment fea-
ics of the database. tures in neighborhood analyses. In this case, we iden-
tified an elbow at 3 PCs which were then used for
2.2. Principal component analysis and hierarchical clustering. Based on the intra-cluster inertial plot and
clustering values, we determined that five clusters was again the
From our final database, we generated community optimal solution (see supplemental information).
clusters through a sequence of unsupervised learning
methods. The built environment and sociodemo- 2.3. Water use and conservation comparative
graphic features were highly correlated which analyses
prompted us to employ a dimensionality reduction We evaluated cluster water use and conservation
technique. We performed principal component ana- quantities and trends to evaluate how different res-
lysis (PCA) to transform the features into a set of lin- idential neighborhood typologies are linked to water
early uncorrelated variables, thereby compressing our demand. Monthly block-group water use and sum-
data into a smaller number of variables that explain mer monthly block-group water use distributions
most of the variation in the feature space and making within each cluster were not normal (Shapiro–Wilks
the clustering simpler and more intuitive. Transform- test, all 10 tests p < 0.05), thus we used the nonpara-
ing a set of correlated features into principal compon- metric Kruskal–Wallis test to statistically compare
ents (PCs) to better understand customer profiles water use distributions between community clusters.
has been used across resource sectors, including in Tests for (1) all months and (2) summer months were
water demand analyses both for load shape cluster- significant (p < 0.05) indicating that water use dis-
ing (Cominola et al 2019) and in regression models tributions across groups were not statistically similar.
(Polebitski and Palmer 2013). We made a scree plot To tease out individual group differences, we used
to determine the optimal number of PCs to retain for Dunn’s post-hoc test with the Benjamini–Hochberg
clustering and identified an elbow at the 5th compon- method of adjusting p-values to minimize false dis-
ent. These five PCs together represented 89.6% of the covery rates.
variance in the data (see supplemental information We examined block-group water conservation
(https://stacks.iop.org/ERL/15/124009/mmedia)). and rebound between 2014 and 2017, a drought
The PCs were then used as inputs into our clus- stress-test, which provides insight into how com-
tering algorithm to organize the block-groups into munities react to an external system shock, to cap-
communities. We used the hierarchical clustering ture changes in water use related to extreme drought,
on principal components (HCPC) method (Husson political actions, and local policies within Redwood
et al 2010), which is a combination of partitional and City (table 1). In January 2014, the California Gov-
hierarchical clustering. First, a hierarchical cluster- ernor declared a drought state of emergency and
ing procedure is performed using Ward’s criterion called for voluntary water reductions across the state
based on the Euclidean distance. The tree is manu- (California State Water Resources Control Board
ally or optimally cut to form an initial set of clusters. 2014). As the drought progressed, the state issued
Then a partitional clustering method, in this case k- a resolution calling for conserving potable outdoor
means, is applied to improve the initial groupings water use (California State Water Resources Con-
obtained from the hierarchical clustering. We applied trol Board 2014) which coincided with Redwood
HCPC to the 46 block-groups and their values for City implementing outdoor water use restrictions for
the first five PCs. Based on the intra-cluster iner- single-family residential customers. Customers were
tial plot and values, we determined that five clusters limited to 2–day a week outdoor watering where res-
was the optimal solution (see supplemental inform- idential addresses ending with odd numbers were
ation). We performed PCA and HCPC using the allowed to water on Monday and Thursday and with
Factominer package in R (Lê et al 2008). We classi- even numbers water on Tuesday and Friday. Follow-
fied a feature as important to a principal component ing a statewide drought declaration in April 2015,
(PC) based on its contribution: if each variable uni- June 2015 brought state-level mandatory water use
formly contributed to each PC, the expected value restrictions where Redwood City was mandated to
would be (1 feature)/(14 total features)∗ 100 = 7%, achieve 8% overall savings (California State Water
and we used this 7% cutoff for a feature to Resources Control Board 2018); however, the city
be considered important for a PC (Kassambara did not change their single-family residential irriga-
2017). tion policy, only the level of enforcement. The out-
We repeated our principal component and clus- door water use restriction ended in June 2016 when
tering procedure without the Zillow data, using only the mandatory conservation regulations ended and a
the 7 Census features to generate community clusters. state-wide call for ‘self-certified conservation goals’ at
By creating a ‘counterfactual’ scenario in which urban which time Redwood City set their goal to 0% (Cali-
environment information is not available, we could fornia State Water Resources Control Board 2018).
compare water use distributions to determine the The drought was declared over in April 2017.
3Environ. Res. Lett. 15 (2020) 124009 K J Quesnel et al
Table 1. Drought policy timeline.
Ending Local policy for single-family Statewide policies and
Starting month month residential customers sentiment
January 2014 July 2014 Call for voluntary
conservation
August 2014 May 2015 Outdoor water use
restrictions
2 d a week watering restriction
June 2015 May 2016 First mandatory urban
water use restrictions
June 2016 April 2017 ‘Self-certified’ conserva-
tion goals
May 2017 December 2017 Drought declared over
We calculated monthly block-group absolute and segregation provides evidence for both geograph-
relative (percentage) water conservation rates com- ical sorting of people into similar networks and
pared to the same month in 2013 in order to fol- community-scale urban planning while showing the
low California’s statewide drought mandate require- effectiveness of clustering by built environment and
ments (California State Water Resources Control social features. This kind of spatial grouping also
Board 2015). The absolute and relative block-group paves the way for neighborhood-level distributed
level conservation rate distributions had similar fea- water system integration, for example decentral-
tures as the water use distributions (were not nor- ized water recycling infrastructure and geospatially
mal, Shapiro–Wilks test, all 10 tests p < 0.05; were not tailored customer outreach (Gurung et al 2016).
statistically similar, Kruskal–Wallis test, both tests, The features of each cluster can be examined
p < 0.05) so we deployed the same statistical testing by spider plots of feature value z-scores (figure 1)
procedures for the group comparisons. We compared and average feature values (table 2). Cluster A
conservation rate distributions between clusters for is comprised of 11 block-groups and formed by
each of the five distinct policy periods. block-groups/neighborhoods with generally low-
To investigate the importance of the built envir- income, high-density families with many people
onment in grouping customers for water use analyses, per household. Cluster B is made up of 12 block-
we also created clusters trained only using Census groups and is the most similar to Cluster A in
data. We compared cluster cohesion, or within cluster that neighborhoods in this community represent
sum of squares (WCSS), between the two solutions for lower income customers. However, unlike Cluster
four different water-related variables: water use, water A, block-groups are linked to nonfamily renters
use with seasonality removed, absolute water conser- with bigger household sizes. Cluster C is made
vation, and percent water conservation, which were up of 11 block-groups and represents the aver-
not inputs into the clustering algorithms: age of Redwood City across the social and built
environment.
∑∑( )2
An especially interesting result is the division
x−−
x (1) of high-income customers into two distinct groups.
i
i x∈Cj
Cluster D and Cluster E both contain block-groups
with high positive values in PC1, representing afflu-
where the Euclidean distance is calculated between ent, highly educated neighborhoods with bigger
each point x and the mean −x in cluster i and then houses. Cluster D, containing 4 block-groups, how-
squared and summed across all clusters. A smaller ever, represents an area with younger residents living
WCSS indicates tighter cohesion and thus a clustering in newer houses on smaller lots with more people per
result that is more useful for water use and conserva- household. These characteristics are in contrast to the
tion analyses. community of Cluster E, containing 8 block-groups,
which is dominated by older houses on large lots with
3. Results less people per household.
Aerial imagery provides evidence for these neigh-
3.1. Neighborhoods, communities and their borhood typologies (figure 1). For example, these pic-
characteristics tures show dense development for Clusters A, B, and
Five residential community clusters emerged from D, although the development in Cluster D shows a
our analyses. One important outcome is that planned community with shared instead of individual
although no geospatial inputs i.e. location coordin- lawns. Imagery from Clusters C and E both show
ates were introduced into our model, the clusters spaced out single-family residential properties. The
were separated into spatially distinct groups (see sup- lots in Cluster E are substantially larger than those in
plemental information). This unprompted spatial Cluster C, however, and most include lawns.
4Environ. Res. Lett. 15 (2020) 124009 K J Quesnel et al
Table 2. Mean cluster block-group built environment and sociodemographic features.
Cluster A Cluster B Cluster C Cluster D Cluster E
Built environment Lot size in sq. ft. 5589 6230 6901 4744 14 646
features (Zillow) # of units > 1 0.2 0.4 0.0 0.0 0.0
Year built 1942 1949 1958 1993 1961
# of rooms 6.0 6.7 6.6 8.4 7.5
# of bathrooms 1.5 2.0 2.1 2.7 2.5
Property value $ 195 134 $ 326 532 $ 369 167 $ 407 987 $ 555 136
Home value $ 200 919 $ 266 207 $ 313 947 $ 392 823 $ 450 988
Sociodemographic Median household 3.8 2.7 2.8 3.0 2.9
features (US size
Census)
% renter occupied 67% 69% 21% 36% 12%
Population density 16 373 14 990 7382 8805 4035
per sq. mile
% nonfamilies 12% 21% 15% 15% 12%
% population 7% 11% 18% 10% 20%
older than 65
% college educated 16% 31% 50% 71% 56%
or higher
Median household $ 67 020 $ 74 365 $ 120 134 $ 163 456 $ 159 980
income ($2017)
Figure 1. Spider plots of cluster characteristics and aerial imagery from Google Maps showing example typologies of urban form.
Spider plot values are based on z-scores of averaged block-group features and each line represents one block-group in the cluster.
Z-scores are calculated as the value of each block-group’s feature minus the group mean of the feature divided by the group
standard deviation of the feature. Map image attribution: Imagery ©2020 CNES/Airbus, Maxar Technologies, U.S. Geological
Survey, Map data ©2020 Google.
3.2. Community clusters and their water use (Polebitski and Palmer 2010) for each block-group as
the ratio of average monthly water use in the summer
What do these neighborhood clusters mean for water months divided by average monthly water use in the
use patterns and trends? A cycle plot shows aver- winter months (figure 2(B), table 3). All block-groups
age monthly water use within each cluster for the have average peaking factors greater than 1, indicat-
entire 2008–2017 time period (figure 2(A)) with aver- ing at least some outdoor water use within all single-
age water use and summer water use values presen- family neighborhoods throughout the city. Addi-
ted in table 3. To better understand the seasonality tionally, block-group peaking factors within each
shown in the cycle plot, we calculated peaking factors cluster were not widely distributed, demonstrating
5Environ. Res. Lett. 15 (2020) 124009 K J Quesnel et al
the link between neighborhood typologies and out- aerial imagery (figure 1), we found that within the
door water use. high-income neighborhoods of Cluster D, many areas
We present boxplots within violin plots, which are have substituted individual lawns for community
boxplots with rotated kernel density shapes, to visu- or homeowner’s association lawns. While water was
alize average monthly and average monthly summer still being used for outdoor irrigation around these
water use by customers in block groups within each houses, water use for shared lawns is not included
cluster (figures 2(C) and (D)). Statistically, eight of in this study. Water use decisions made at the indi-
the ten water use distribution comparisons were sig- vidual homeowner (or renter) level are fundament-
nificantly different (supplemental information) while ally different than those made by homeowner associ-
all ten summer water distribution comparisons were ations and landscape professionals. In addition, many
significantly different (supplemental information), of these shared lawns are being irrigated with recycled
indicating overall different water use among the water, making them one avenue for more efficient
clusters. The two comparisons that were not statist- green spaces in urban settings (Quesnel and Ajami
ically different were between Clusters A and C and 2019).
between Clusters B and D. The cycle plot sheds light Finally, customers in Cluster E had the highest
on these connections. Clusters B and D do in fact average water use and highest average summer water
show similar seasonal use, in contrast to Clusters use, including the highest mean peaking factor of
A and C, where Cluster A, with older houses and 1.35, compared to the other cluster communities,
more residents per household, has higher winter use which can at least be partially explained by the large
and Cluster C, with more homeowners (compared to lots and large houses. Notably, Cluster E contains one
renters) and bigger lot sizes, has higher summer use. outlier block-group which has substantially higher
Block-groups in Cluster A had medium monthly income, water use, and lot sizes compared to the rest
and summer monthly water use compared to the of the service area and the other block-groups in the
other clusters and the lowest average peaking factor cluster. The other six block-groups within Cluster E
of 1.15 (a value shared by Cluster D). Cluster A do, however, have the next highest water use pro-
is also the lowest income community, with high files, thus still representing a cohesive high water-use
density housing, the most people per household, group.
and mostly renters. The other low-income, majority
renter community, Cluster B, had a similar mean 3.3. Water conservation and rebound
summer water use but lower winter water use and Customers were able to achieve high conservation
therefore a slightly higher peaking factor of 1.21. rates, especially as the drought progressed (table 4,
This divergence could be due to a higher percentage figure 3). During the voluntary conservation period
of families, more people per household, and more in the first half of 2014, customers in each cluster con-
multi-unit (although still considered single-family served at similar relative rates, with average cluster
residential) buildings in neighborhoods that define monthly block-group savings between 6%–12% com-
Cluster A compared to Cluster B. Cluster C, the aver- pared to 2013 across the service area. As the drought
age of the service area across most features, exhib- progressed and statewide outdoor water use restric-
its the second highest monthly water use, summer tions were coupled with local watering policies, aver-
monthly water use, and peaking factor of 1.28, indic- age cluster monthly block-group savings increased to
ating room for increased outdoor conservation and 14%–23% compared to 2013. Throughout these first
efficiency. Interestingly, Clusters C and D have simil- two policy periods, the three lower water use clusters
arly low winter water use to that of Cluster B, pointing A, B, and D had similar absolute savings while the two
towards indoor efficiency within these higher-income higher water use clusters C and E conserved in parallel
groups. and had the highest relative savings.
Cluster D had the lowest summer water use and In spring 2015, mandatory water use restric-
also the lowest peaking factor of 1.15. If we only tions were implemented across the state which led to
examined block-group demographics, this would be peak drought awareness during the 2014–2017 period
a surprising result as neighborhoods in this com- (Bolorinos et al 2020). This mandate, coupled with
munity are characterized by high-income, highly- the continuation of local watering restrictions, resul-
educated homeowners, with larger household sizes, ted in the policy period with the highest relative and
and these features are typically associated with higher absolute conservation rates within each cluster dur-
water use (Harlan et al 2009, Polebitski and Palmer ing the drought, with average cluster monthly block-
2010, House-Peters et al 2010, Mini et al 2014, Breyer group savings of 23%–37% compared to 2013.
et al 2018). However, by incorporating features of When the statewide and local mandatory water
the built environment, extracted from Zillow, we can restrictions were lifted, the ‘self-certified’ goal policy
understand that low water use is linked to new urban period went into effect. Customers maintained high
form, built in the 1990s compared to the 1940s– average cluster monthly block-group conservation
1960s like the rest of the city. Additionally, through rates of 20%–24% compared to 2013 despite the
6Environ. Res. Lett. 15 (2020) 124009 K J Quesnel et al
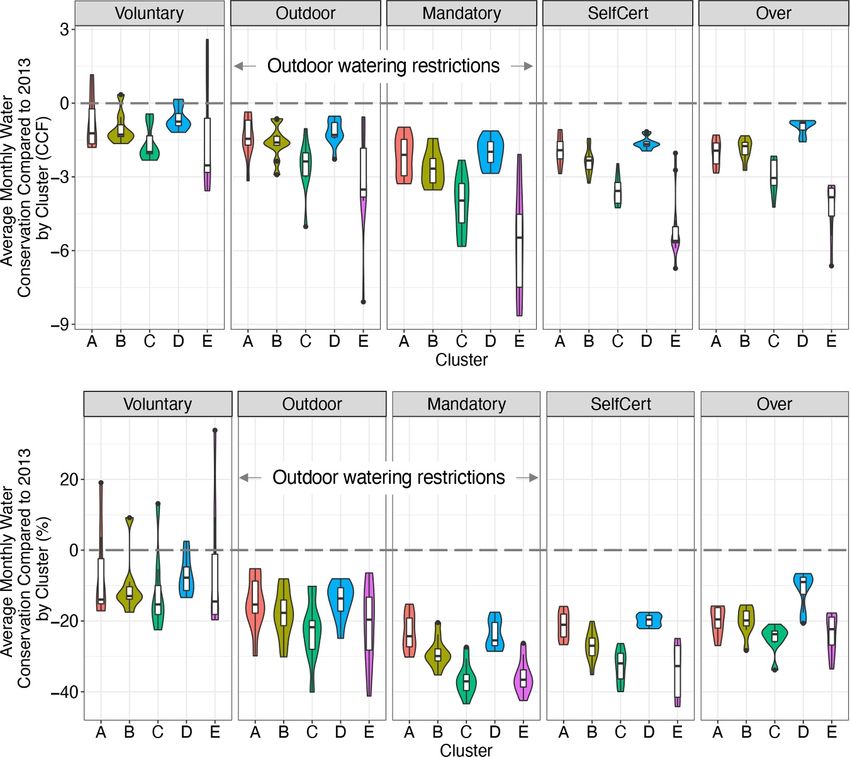
Figure 2. Cluster water use and conservation. (a) cycle plot of average water use per cluster over the 10-year time period; (b)
box-plots of block-group level peaking factors with each dot representing one block-group within the cluster and the dashed line
at 1.0 representing equal summer and winter water use; (c) violin plots of average monthly cluster water use; and (d) violin plots
of average summer (May–September) monthly cluster water use. Each violin plot contains 10 years of monthly observations for
each block group; for example, Cluster A is comprised of 11 block groups, so the violin plot of average monthly water use across all
12 months and 10 years contains 1320 points while the violin plot for the five summer months over 10 years contains 550 points.
Table 3. Cluster descriptions, water use, and peaking factors.
Mean monthly summer
Mean monthly block-group (May–September) block- Mean block-group
water use (CCF) [sd] group water use (CCF) [sd] peaking factor [range]
Cluster A 8.47 [2.11] 9.76 [1.96] 1.15 [1.07–1.24]
Cluster B 7.76 [2.51] 9.44 [2.51] 1.21 [1.15–1.30]
Cluster C 9.02 [3.04] 11.56 [2.36] 1.28 [1.24–1.32]
Cluster D 7.47 [1.64] 8.62 [1.54] 1.15 [1.11–1.21]
Cluster E 13.30 [5.71] 17.92 [4.89] 1.35 [1.31–1.38]
absence of restrictions. However, in the spring of 2017 peaking factors and therefore low household out-
when the drought was declared over, conservation door water use. One notable difference occurs when
rates lessened to 11%–25% compared to 2013. the drought ends. Clusters A and B, with sim-
From the beginning of the drought until the ilar demographic and built environment profiles,
self-certified goals were lifted, Clusters A and D have similar water use rebound responses while
had similar relative and absolute conservation rates, Cluster D exhibits the highest rebound (lowest con-
which were the lowest in the service area. These servation rates) in the service area, indicating dif-
two groups have dramatically different demographic ferent community responses to restrictions being
and housing features: Cluster A is comprised of lifted.
low-income renters in small, older houses com- During every policy period, customers in the two
pared to Cluster D which contains block-groups communities with the highest overall water use, sum-
defined by high-income homeowners in large, newer mer water use, and highest peaking factors, Clusters
houses. However, both have small-lot sizes, the lowest C and E, had the largest absolute savings, signaling
7Environ. Res. Lett. 15 (2020) 124009 K J Quesnel et al
Figure 3. Violin plots of (a) absolute and (b) relative (%) average block-group cluster water conservation and rebound
distributions with respect to 2013 during five distinct policy periods.
Table 4. Mean cluster absolute and relative conservation during each policy period. Letters in () under each number indicate that the
distribution of block-group conservation rates in that cluster was not significantly different than the distributions within those clusters.
For example, during the Mandatory policy period, the distributions of average block-group absolute conservation rates within Clusters
A and D were not statistically different.
Absolute Conservation
Average block-group monthly conservation w.r.t. 2013 (CCF)
Policy Period
Voluntary Outdoor Mandatory SelfCertified Over
Cluster A −0.8 (B, D) −1.4 (B, D) −2.2 (D) −2.0 (D) −2.0 (B)
Cluster B −1.0 (A,D) −1.6 (A,D) −2.6 −2.4 −1.9 (A)
Cluster C −1.6 (E) −2.6 (E) −4.1 −3.6 −3.0
Cluster D −0.6 (A,B) −1.2 (A,B) −2.0 (A) −1.6 (A) −1.0
Cluster E −1.5 (C) −3.2 (C) −5.7 −5.0 −4.3
Relative Conservation
Average block-group monthly conservation w.r.t. 2013 (%)
Policy Period
Voluntary Outdoor Mandatory SelfCertified Over
Cluster A −7% (B,C,D,E) −15% (D) −23% (D) −21% (D) −20% (B)
Cluster B −10% (A,C,D,E) −18% (E) −29% −27% −20% (A)
Cluster C −12% (A,B,E) −23% (E) −37% (E) −33% (E) −25% (E)
Cluster D −7% (A,B,E) −14% (A) −24% (A) −20% (A) −11%
Cluster E −6% (A,B,C,D) −21% (B,C) −36% (C) −34% (C) −24% (C)
8Environ. Res. Lett. 15 (2020) 124009 K J Quesnel et al
Table 5. Cluster water use and conservation cohesion (within cluster sum of squares, WCSS) and % improvement of including Zillow
data with Census data in the clustering algorithm compared to clustering based on Census data only.
Cluster solution Cluster solution
Zillow + Census Census only Percent Difference
Water use (CCF) Monthly, 59 647 70 309 −15%
01/2008–12/2017
Trend + remainder (CCF) 24 893 35 555 −30%
Monthly, 01/2008–12/2017
Absolute Conservation 7306 8222 −11%
(CCF) Monthly w.r.t. 2013
baseline, 01/2014–12/2017
Percent Conservation 391 817 402 629 −3%
(%) Monthly w.r.t. 2013
baseline, 01/2014–12/2017
Figure 4. Decoupled income, water use, and lot size relationships for cluster solutions created (a) with Zillow and Census features
and (b) with Census features only. Each dot represents one Census block-group in the study (n = 46). The heavy dashed lines
represent the median values while light dashed lines show quantiles.
the high potential for outdoor water conservation. included Zillow showed a 15% improvement in over-
During later drought periods, customers in Cluster all water use cohesion and a 30% improvement in de-
E were able to achieve higher absolute savings, how- seasoned water use cohesion, pointing to the import-
ever, likely linked to their higher summer and over- ance of including urban form not only when assessing
all water use. As urban landscapes can often recover total water quantities but also for examining water use
after drought periods, even with decreased irrig- trends and behavior over time. Both water conserva-
ation (Quesnel et al 2019), there is a strong case tion WCSS metrics also improved for the cluster solu-
for limiting outdoor water use during water supply tion that included Zillow, although to a lesser extent
shortages. at 11% and 3% performance increases.
Researchers have consistently reported that afflu- The cluster solution that takes into account both
ent communities are responsible for the greatest sav- built environment and sociodemographic features
ings during drought because they generally have the splits the high-income customers into two distinct
largest amount of outdoor space, and thus outdoor clusters (figure 1) leading to a logical grouping of their
water use (Kenney et al 2008, Mini et al 2015, Breyer water use patterns (figure 2) and conservation and
et al 2018). Yet in this study, we found that Clusters D rebound behavior (figure 3). Comparing block-group
and E were both defined by high-income, highly edu- water use and income relationships for both cluster
cated customers but had dramatically different water solutions (figure 4) further highlights the import-
use behavior during and after drought due to their ant decoupling between income and water use, which
built environment factors. This outcome demon- comes through in the cluster solution only when built
strates the importance of taking into account differ- environment features are included.
ences in urban form when assessing and forecasting The two cluster solutions diverge the most spe-
water use, including when developing drought plans. cifically when examining the higher-income block-
groups. In the first cluster solution that includes fea-
3.4. Counterfactual scenario: comparing cluster tures of the built environment (figure 4(A)), the
solutions with and without the built environment higher-income customers are stratified into three
We found that across all four cluster comparisons, groups that also correspond to three different levels
the clusters created using both Zillow and Census of water use, despite no water use characterist-
features had lower WCSS (table 5). The clusters that ics being used to generate the clusters themselves.
9Environ. Res. Lett. 15 (2020) 124009 K J Quesnel et al
This is especially important for the highest-income the door for multi-city or even multi-state studies.
customers, where the block-groups are separated These new websites offer a way to access built envir-
into three groups—Cluster E with the highest water onment data uniformly in one place instead of fil-
use, Cluster C with high to medium water use, ing separate records request for each service area of
and Cluster D with lower water use. However, in interest. While this research presents an alternative to
the cluster solution with sociodemographic features traditional methods for obtaining information about
only (figure 4(B)), the high-income customers are all the built environment, water use data remains sparse
grouped into one neighborhood typology, Cluster and challenging to acquire (Chini and Stillwell 2016,
Z, but water use spans the range of the entire city. Josset et al 2019).
The traditional method of classifying customers and As this is the first research to use Zillow in water
neighborhood based only on affluence will not be suf- demand research, there are a host of avenues for
ficient for understanding water use trends and tail- future research. For example, our study was set within
oring various demand management strategies as new one utility, but the potential for Zillow truly lies in its
types of urban development are integrated into cit- ability to cross administrative borders. For example,
ies. This distinction has important consequences for where cross-city and multi-city comparisons in dif-
demand forecasting and supply planning. If water ferent counties previously required obtaining data
agencies over-predict water use from high-income from each individual jurisdiction, Zillow or other
customers, they will be unable to optimally invest in online aggregators store this data in one central loc-
diverse water supplies and will mis-allocate resources ation. Having one central database also provides the
throughout the community. benefit of data consistency.
Additionally, here we focused primarily on neigh-
4. Discussion and conclusion borhood clustering to inform residential water use
modeling at the monthly scale, but future studies
This research demonstrates the coupled role of urban could explore how emerging databases, online plat-
form and sociodemographic characteristics in water forms, and data aggregators with high spatial and/or
use and drought-related conservation behavior. A temporal resolution can be coupled with higher tem-
crucial finding of this study is the importance of the poral resolution water use data from smart meters
built environment when classifying urban water cus- to better understand and predict water use and
tomers and creating residential neighborhood typo- conservation. These insights could then be used to
logies useful for water use and conservation analyses develop short-term and long-term demand manage-
and developing demand management strategies. Tra- ment strategies. Another avenue for future research
ditionally, many researchers have stratified customers would be to investigate how different emerging urban
by income, finding that affluence is associated with form paradigms including infill development, peri-
high water use, high levels of drought-related conser- urban, and suburban designs shift both short- and
vation, and subsequently high conservation backslide long-term water use behavior. Land managers and
post-drought. These water use characteristics are typ- water managers often do not coordinate or even talk
ically linked to more wealthy customers having bigger to each other (Gober et al 2013), but with these new
lots and therefore using more water outdoors. How- developments and unprecedented urbanization, there
ever, this study proves that income does not always is increasing pressure for integrated planning and
correlate to high water use, and that affluent residents management.
choosing to live in dense, new developments have very This research lays the framework for future big
different water use patterns and water use behavior. data-driven urban water research and provides evid-
We bypassed previous data constraints faced by ence for the implications evolving urban form on
researchers, utilities, municipalities and other pub- water use. Our results also point out future paths
lic agencies trying to better understand how built of more water-efficient urban development. Cities all
environment factors are linked to water use by util- over the world are expanding at rapid rates, and there
izing data from an online real estate aggregator. By are many different ways for them to develop. Here, we
obtaining customer-level information from the Zil- showed that dense housing patterns and new houses,
low ZTRAX database, this research for the first time regardless of the size, can result in lower water use
demonstrates the possibility for this kind of plat- than traditional sprawl. However, these low water
form to serve as a new tool for incorporating hous- use communities also have lower conservation rates
ing features into water use analyses. City and county and sometimes faster post-drought water demand
assessors are legally required to fulfill public record rebound, and actions must be taken to account for
requests and provide data in response to inquiries, this reduced water system flexibility. City planners
but acquiring these individual datasets for compar- and water managers must work together to develop
ative regional, state, or national assessments can be cities of the future that house an increasingly large
prohibitive. Thus, using aggregated data generated portion of the population and meet the wide-range
by Zillow and similar websites can provide a gate- of sustainability-oriented goals critical to addressing
way for widespread analyses, for example opening 21st century urban challenges.
10Environ. Res. Lett. 15 (2020) 124009 K J Quesnel et al
Acknowledgments California State Water Resources Control Board 2014 Resolution
No. 2014-0038 (Sacramento, CA: California State Water
Resources Control Board) (www.waterboards.ca.gov/
We would like to thank the City of Redwood City and
board_decisions/adopted_orders/resolutions/2014/
in particular Justin Chapel, Debbie Ivazes, and Sindy rs2014_0038_regs.pdf)
Mulyono-Danre for their time and effort in provid- California State Water Resources Control Board 2015 Resolution
ing data and valuable feedback. Research assistance by No. 2015–0032 (Sacramento, CA: California State Water
Resources Control Board) (www.waterboards.ca.gov/
Tim Hsu was critical for initial data processing. We
board_decisions/adopted_orders/resolutions/2015/
appreciate feedback from Jordyn Wolfand and Jose rs2015_0032.pdf)
Bolorinos during manuscript development. We also California State Water Resources Control Board 2018 Water
thank three anonymous reviewers for their feedback Conservation and Production Reports (Sacramento, CA:
California State Water Resources Control Board)
which improved the manuscript. This research was
(www.waterboards.ca.gov/water_issues/programs/
developed under STAR Fellowship Assistance Agree- conservation_portal/conservation_reporting.shtml)
ment no. FP-91778101-0 awarded to K J Q by the U.S. Chang H, Bonnette M R, Stoker P, Crow-Miller B and Wentz E
Environmental Protection Agency (EPA). It has not 2017 Determinants of single family residential water use
across scales in four western US cities Sci. Total Environ.
been formally reviewed by EPA. The views expressed
596–597 451–64
are solely those of the authors, and EPA does not Chini C M and Stillwell A S 2016 Where are all the data? the case
endorse any products or commercial services men- for a comprehensive water and wastewater utility database
tioned in this poster. Funding was also provided, in J. Water Resour. Plan. Manag. 143 01816005
City of Redwood City 2015 2015 Urban Water Management Plan
part, by the National Science Foundation Engineering
(Redwood City, CA: City of Redwood City)
Research Center for Re-inventing the Nation’s Urban (www.redwoodcity.org/home/showdocument?id=8091)
Water Infrastructure (ReNUWIt) (Award No. EEC- Cominola A, Nguyen K, Giuliani M, Stewart R A, Maier H R and
1028968), the Bill Lane Center for the American West, Castelletti A 2019 Data mining to uncover heterogeneous
water use behaviors from smart meter data Water Resour.
and Stanford Woods Institute for the Environment.
Res. 55 9315–9333
Ewing R and Rong F 2008 The impact of urban form on
Data availability statement U.S. residential energy use Hous. Policy Debate
19 1–30
Fan L, Gai L, Tong Y and Li R 2017 Urban water consumption and
The data that support the findings of this study are
its influencing factors in China: evidence from 286 cities
available upon reasonable request from the authors. J. Cleaner Prod. 166 124–33
Fielding K S, Russell S, Spinks A and Mankad A 2012
Determinants of household water conservation: the role of
ORCID iDs demographic, infrastructure, behavior, and psychosocial
variables Water Resour. Res. 48 W10510
Kimberly J Quesnel https://orcid.org/0000-0002- Garcia M and Islam S 2019 The role of external and emergent
drivers of water use change in Las Vegas Urban Water J.
4933-4218
15 888–98
Newsha K Ajami https://orcid.org/0000-0003- Gober P, Larson K L, Quay R, Polsky C, Chang H and Shandas V
4421-3764 2013 Why land planners and water managers don’t talk to
one another and why they should! Soc. Nat. Resour.
26 356–64
References Gonzales P and Ajami N K 2017b The changing water cycle:
impacts of an evolving supply and demand landscape on
Barnett M J, Jackson-smith D and Endter-wada J 2019 urban water reliability in the Bay area Wiley Interdiscip. Rev.
Implications of nontraditional housing arrangements for Water 4 e1240
urban water management in the United States Gonzales P and Ajami N 2017a Social and structural patterns of
intermountain west Soc. Nat. Resour. 32 508–29 drought-related water conservation and rebound Water
Berrigan D and Troiano R P 2002 The association between urban Resour. Res. 53 1–38
form and physical activity in U.S. adults Am. J. Prev. Med. Güneralp B, Zhou Y, Ürge-Vorsatz D, Gupta M, Yu S, Patel P L,
23 74–79 Fragkias M, Li X and Seto K C 2017 Global scenarios of
Bolorinos J, Ajami N K and Rajagopal R 2020 Consumption urban density and its impacts on building energy use
change detection for urban planning: monitoring and through 2050 Proc. Natl Acad. Sci. 114 8945–50
segmenting water customers during drought Water Resour. Gurung T R, Stewart R A, Beal C D and Sharma A K 2016 Smart
Res. 56 1–16 meter enabled informatics for economically efficient
Brelsford C and Abbott J K 2017 Growing into water diversified water supply infrastructure planning J. Cleaner
conservation? decomposing the drivers of reduced water Prod. 135 1023–33
consumption in Las Vegas, NV Ecol. Econ. 133 99–110 Hannibal B, Sansom L and Portney K E 2018 The effect of local
Breyer B and Chang H 2014 Urban water consumption and water scarcity and drought on water conservation behaviors
weather variation in the Portland, Oregon metropolitan area Environ. Sociol. 5 294–307
Urban Clim. 9 1–18 Harlan S L, Yabiku S T, Larsen L and Brazel A J 2009 Household
Breyer B, Zipper S C and Qiu J 2018 Sociohydrological impacts of water consumption in an Arid City : affluence,
water conservation under anthropogenic drought in Austin, affordance, and attitudes Soc. Nat. Resour.
Texas (USA) Water Resour. Res. 54 3062–80 22 691–709
California Department of Water Resource 2016 Urban Water Use House-Peters L A and Chang H 2011 Urban water demand
Efficiency: A Resource Management Strategy of the modeling: review of concepts, methods, and organizing
California Water Plan 1–36 (www.water.ca.gov/LegacyFiles/ principles Water Resour. Res. 47
waterplan/docs/rms/2016/02_Urban_Water_Efficiency_ House-Peters L, Pratt B and Chang H 2010 Effects of urban spatial
July2016.pdf) structure, sociodemographics, and climate on residential
11Environ. Res. Lett. 15 (2020) 124009 K J Quesnel et al
water consumption in Hillsboro, Oregon JAWRA J. Am. curtailments during drought JAWRA J. Am. Water Resour.
Water Resour. Assoc. 46 461–72 Assoc. 49 40–51
Husson F, Josse J and Pagès J 2010 Principal component Quesnel K J and Ajami N K 2017 Changes in water consumption
methods - hierarchical clustering - partitional clustering: linked to heavy news media coverage of extreme climatic
why would we need to choose for visualizing data? Tech. Rep. events Sci. Adv. 3 e1700784
Appl. Math. Dep. 1–17 (http://factominer.free.fr/docs/ Quesnel K J and Ajami N K 2019 Large landscape urban
HCPC_husson_josse.pdf) irrigation: a data-driven approach to evaluate conservation
Jabareen Y R 2006 Sustainable urban forms: their typologies, behavior Water Resour. Res. 55 771–86
models, and concepts J. Plan. Educ. Res. 26 38–52 Quesnel K J, Ajami N and Marx A 2019 Shifting landscapes:
Jackson-Smith D, Stoker P A, Buchert M, Endter-Wada J, Licon C, decoupled urban irrigation and greenness patterns during
Cannon M S and Li S 2016 Differentiating urban forms: A severe drought Environ. Res. Lett. 14 064012
neighborhood typology for understanding urban water Randolph B and Troy P 2008 Attitudes to conservation and water
systems Cities Environ. 9 5 consumption Environ. Sci. Policy 11 441–55
Josset L, Allaire M, Hayek C, Rising J, Thomas C and Lall U 2019 Sanchez G M, Terando A, Smith J W, García A M, Wagner C R and
The U.S. water data gap—a survey of state-level water data Meentemeyer R K 2020 Forecasting water demand across a
platforms to inform the development of a national water rapidly urbanizing region Sci. Total Environ. 730 139050
portal Earth’s Future 7 433–49 Schleich J and Hillenbrand T 2009 Determinants of residential
Kassambara A 2017 Practical guide to principal component methods water demand in Germany Ecol. Econ. 68 1756–69
in R: PCA, M (CA), FAMD, MFA, HCPC, factoextra Shandas V and Parandvash G H 2010 Integrating urban form and
(STHDA) demographics in water-demand management: an empirical
Kenney D S, Goemans C, Klein R, Lowrey J and Reidy K 2008 case study of Portland, Oregon Environ. Plan. B 37 112–28
Residential water demand management: lessons from SimplyAnalytics 2017 US Census and American Community
Aurora, Colorado JAWRA J. Am. Water Resour. Assoc. Survey Data (www.simplyanalytics.com)
44 192–207 Stoker P, Hinners S, Jackson-Smith D, Buchert M and Levine Z
Kontokosta C E and Jain R K 2015 Modeling the determinants of 2019 Neighborhood effects on parcel-level water use Sustain.
large-scale building water use: implications for data-driven Water Resour. Manag. 5 1303–13
urban sustainability policy Sustain. Cities Soc. 18 44–55 Stoker P and Rothfeder R 2014 Drivers of urban water use Sustain.
Lê S, Josse J and Husson F 2008 FactoMineR: an R package for Cities Soc. 12 1–8
multivariate analysis J. Stat. Softw. 25 1–18 Stokes E C and Seto K C 2019 Characterizing and measuring
Mini C, Hogue T S and Pincetl S 2014 Patterns and controlling urban landscapes for sustainability Environ. Res. Lett.
factors of residential water use in Los Angeles, California 14 045002
Water Policy 16 1054–69 U.S. Geological Survey: California Water Science Center 2018
Mini C, Hogue T S and Pincetl S 2015 The effectiveness of water 2012-2016 California Drought: Historical Perspective
conservation measures on summer residential water use in (https://ca.water.usgs.gov/california-drought/california-
Los Angeles, California Resour. Conserv. Recycl. 94 136–45 drought-comparisons.html)
Pandit A et al 2017 Infrastructure ecology: an evolving paradigm United Nations Department of Economic and Social Affairs
for sustainable urban development J. Cleaner Prod. Population Division 2019 World Urbanization Prospects: The
163 S19–S27 2018 Revision. Key Facts (New York: United Nations)
Pickett S T A and Zhou W 2015 Global urbanization as a shifting (https://population.un.org/wup/Publications/
context for applying ecological science toward the Files/WUP2018-KeyFacts.pdf)
sustainable city Ecosyst. Health Sustain. 1 1–15 Willis R M, Stewart R A, Giurco D P, Talebpour M R and
Polebitski A S and Palmer R N 2010 Seasonal residential water Mousavinejad A 2013 End use water consumption in
demand forecasting for census tracts J. Water Resour. Plan. households: impact of socio-demographic factors and
Manag. 136 27–36 efficient devices J. Cleaner Prod. 60 107–15
Polebitski A S and Palmer R N 2013 Analysis and predictive Zillow 2017 ZTRAX: Zillow Transaction and Assessor Dataset,
models of single-family customer response to water 2017-Q4 (Zillow Group, Inc.) (www.zillow.com/ztrax/)
12You can also read