Extreme Weather Events in Agriculture: A Systematic Review - MDPI
←
→
Page content transcription
If your browser does not render page correctly, please read the page content below
sustainability

Review
Extreme Weather Events in Agriculture:
A Systematic Review
Alessia Cogato 1, *, Franco Meggio 2 , Massimiliano De Antoni Migliorati 3 and
Francesco Marinello 1
 1    Department of Land, Environmental, Agriculture and Forestry, University of Padova, 35020 Padova, Italy;
      francesco.marinello@unipd.it
 2    Department of Agronomy, Food, Natural Resources, Animals and the Environment, University of Padova,
      35020 Padova, Italy; franco.meggio@unipd.it
 3    Institute of Future Environment, Queensland University of Technology, Brisbane QLD 4001, Australia;
      max.deantoni@qut.edu.au
 *    Correspondence: alessia.cogato.1@phd.unipd.it

 Received: 2 April 2019; Accepted: 27 April 2019; Published: 2 May 2019

 Abstract: Despite the increase of publications focusing on the consequences of extreme weather
 events (EWE) for the agricultural sector, a specific review of EWE related to agriculture is missing.
 This work aimed at assessing the interrelation between EWE and agriculture through a systematic
 quantitative review of current scientific literature. The review analysed 19 major cropping systems
 (cereals, legumes, viticulture, horticulture and pastures) across five continents. Documents were
 extracted from the Scopus database and examined with a text mining tool to appraise the trend
 of publications across the years, the specific EWE-related issues examined and the research gaps
 addressed. The results highlighted that food security and economic losses due to the EWE represent a
 major interest of the scientific community. Implementation of remote sensing and imagery techniques
 for monitoring and detecting the effects of EWE is still underdeveloped. Large research gaps still
 lie in the areas concerning the effects of EWE on major cash crops (grapevine and tomato) and the
 agronomic dynamics of EWE in developing countries. Current knowledge on the physiological
 dynamics regulating the responses of main crops to EWE appears to be well established, while more
 research is urgently needed in the fields of mitigation measures and governance systems.

 Keywords: Meta-analysis; bibliometric analysis; climate change; agriculture

1. Introduction
     The Intergovernmental Panel on Climate Change (IPCC) defines the extreme weather events
(EWE) “as rare as or rarer than the 10th or 90th percentile of a probability density function estimated
from observations” [1] The increasing frequency of EWE related to climate change (CC) represents a
severe threat to agriculture. The long-lasting socio-economic costs of heat waves, floods, hailstorms,
wildfires and other EWE pose serious challenges for the farmers and the communities [2]. According to
the IPCC [1], CC is affecting the intensity, frequency, and spatio-temporal extent of EWE. An increase
of extreme and uncertain events is characteristic of the most recent climate scenarios [3–6].
     Research in this field has substantially increased in recent years, focusing on the impact of EWE
on major crops. For example, a study on the effects of drought conditions in 2016 in the Northeastern
United States reported yield losses higher than 30% for fruit and vegetable crops (Sweet et al. 2017).
In Georgia (US) the photosynthesis rates of sweet corn decreased by at least 30% when the temperature
exceeded 30 ◦ C [7]. Similar responses have been reported for wheat, where both photosynthesis
and yield reduction were amplified by the synergetic interaction of high temperature and drought

Sustainability 2019, 11, 2547; doi:10.3390/su11092547                       www.mdpi.com/journal/sustainability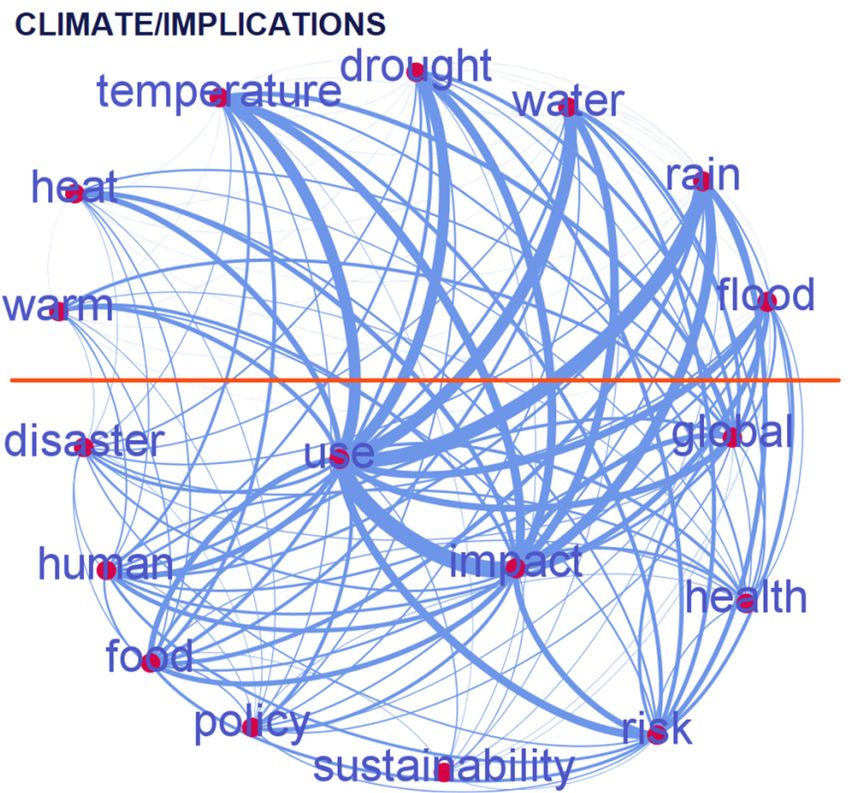
Sustainability 2019, 11, 2547                                                                         2 of 18

stress [8]. Soybean is more tolerant to water stress than the above-mentioned crops, but some
phenological stages (flowering and grain filling) are particularly sensitive to drought [9–11]. A study
conducted in Oklahoma (US) on prairie, switchgrass and crop sites showed a reduction of net ecosystem
exchange [12]. In grapevine, the increase of UV-B radiation is likely to influence the grape chemical
composition [13]. Drought leads to the stomata closure and the photosynthesis reduction, negatively
affecting the yield, and it has been observed that the combination of drought and heat waves can
prevent complete berry maturation [14].
      The overall impact of the EWE on the agricultural sector is therefore a very complex problem,
requiring an urgent effort to establish efficient and sustainable managing systems. In recent decades,
the interest of the scientific community on CC and its effects on agriculture, environment and economy
has substantially increased. The number of publications dealing with the impact of CC on agriculture,
its vulnerability and the best adaptation strategies has more than doubled between 2005 and 2010 [15],
and this expanding trend has continued in subsequent years. This growing interest on the impact of
CC on agriculture is on the one hand related to the importance of agriculture in the global economy,
especially in developing countries. Conversely, the heterogeneity and unpredictability of global
CC effects require a continuous improvement to predict and adapt to EWE. Measures to limit the
stresses have been extensively studied, including resilient farming systems based on increased levels
of biodiversity [16], enhancement of biotechnologies and genomic tools [17,18], selection of new
varieties [19,20] and modification of the distribution of the current varieties [21]. A substantial part of
the research on the effects and the risks for the plant communities related to the EWE focused on the
tools and technologies for early detection or risk maps. Based on the meteorological data obtained from
the weather stations, Tian et al. [22] evaluated the effectiveness of six different indices for the drought
monitoring in the Central-South United States. Nguyen-Huy et al. [23] modelled the joint influence of
12 climate indices on Australian wheat yield. A large branch of the scientific literature, concerning the
CC and the EWE, analyses the links between global warming and economic development. Two recent
reviews focus on the topic of the relationship between CC and economic growth: the first one is dealing
with the identification of the weather impacts [24], while the latter with the mechanisms linking CC
and economic performance [25]. Both reviews stressed the great alarm expressed among economic
and political institutions, caused by environmental modifications due to CC and, specifically, EWE.
      Despite increased interest on the specific issue, to date a systematic review including all the issues
related to the impact of EWE on the agricultural sector is missing. The review on the use of remote
sensing applications for crop production forecasting of Parihar [26] includes a section on the crop
assessment under some EWE (drought, floods and hailstorm). Singh and Kalra [27] analysed the
potential of crop models to estimate the impact of EWE. Other reviews instead addressed the influence
of EWE on insects and pathogen [28], and on food security [29].
      The scientific literature was analysed using a quantitative method based on text mining techniques.
The research on the EWE is inter-disciplinary, dealing with several sectoral topics. For this reason,
the number of documents on the topic of EWE/agriculture relation is published in different subject
categories of many journals, and a qualitative and narrative literature review would not be exhaustive.
In fact, due to the vastness and the urgency of the specific topic, the framework of the literature review
should use the following guidelines presented by Sacchelli et al. [30]:

-      inter-disciplinary, approaching the topic from a holistic perspective;
-      supporting decision-making from local to international level;
-      communicating clearly the state-of-the-art and the gaps of research.

      A systematic quantitative approach represents the most effective methodology to achieve the
aforementioned objectives.
      The aim of the present analysis is to provide a comprehensive state-of-the-art review of the
literature concerning EWE in agriculture. The specific objectives of this work are to (i) describe the
trend of the publications in the years, and (ii) highlight the significant gaps of the research relating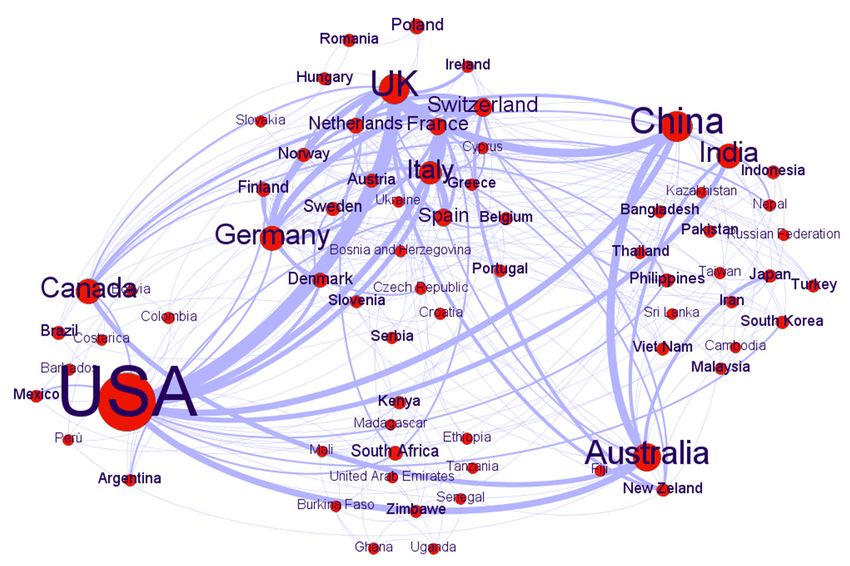
Sustainability 2019, 11, 2547                                                                               3 of 18

the EWE in the agricultural field, both in terms of topics and geographical areas, and (iii) categorise
the interrelationships among the climatic and agricultural variables reported in the literature using
cluster analysis.
     The present analysis can support the scientific community in the focusing of future work.

2. Methodology
      A systematic quantitative review was performed extracting documents from the Scopus database
(www.scopus.com), using the advanced search to limit the field of interest. This approach is based
on the selection of explicit and reproducible survey method [31], allowing a holistic approach to the
literature. It enables presenting a clear and complete picture of the state-of-the-art, highlighting the key
topics raised by the scientific community and performing cluster analysis. The analytic methodology
approach makes it possible to map the gaps, not only from a theoretical point of view, but also from
a methodological and geographic one. Some authors performed a quantitative literature review
on some aspects concerning CC. Sacchelli et al. [30] applied this methodology to the CC and the
adaptation strategies in the wine sector. Guidi et al. [32] published a literature analysis of the CC and
the vulnerability assessment tools for forest ecosystems. A systematic review was developed about the
methodologies to quantify the impacts of climate change on undernutrition [33]. A combination of
quantitative review and meta-analysis has been carried out about the effects of EWE on Cryptosporidium
and Giardia in fresh surface waters [34].
      The words appearing in title, keywords and abstract were analysed with the text mining tool,
taking advantage of the frequency functions available within Microsoft Excel and Gephi, an open
source software for network analysis. Text mining is a process that analyses unstructured information
(textual) by deriving meaningful numeric indices from the text. These indices provide the key to texts
interpretation, obtaining high-quality information by applying statistical analysis.
      The dataset extraction was based on a two-stage examination. The first stage aimed at realising
a general review of the state-of-the-art research on the impact of EWE on agriculture. This aim
was achieved by extracting documents concerning EWE in the subject area of Agriculture (Class
1). The search led to 1418 documents, including a total of 8441 words. Stage two enabled to refine
the search, combining EWE and agriculture in the search form (Class 2). This search resulted in
806 documents and a total of 4866 words. The scripts used to extract the words submitted to text
mining are reported in Table 1.

               Table 1. Scripts for extraction of documents. The scripts are referred to classes 1 and 2.

 Class                                                       Script for extraction
                                                             (TITLE-ABS-KEY (extreme AND weather AND event*)
 1. Extreme weather events (subject area: Agriculture)       OR TITLE-ABS-KEY (severe AND weather AND event*))
                                                             AND (LIMIT-TO (SUBJAREA, "AGRI"))
                                                             (((TITLE-ABS-KEY (extreme AND weather AND event*))
 2. Extreme weather events—Agriculture                       OR (TITLE-ABS-KEY (severe AND weather AND
                                                             event*))) AND (TITLE-ABS-KEY (agricult*)))

     The extracted words were organised on a spreadsheet and pre-processed to improve the efficiency
and effectiveness of the information retrieval [35]. The first process was tokenisation, which aims at
breaking the sequence of strings into pieces, removing punctuation marks, hyphens and brackets.
In most case, the outcome of the tokenisation is a list of single words. Special attention was paid to
not separating compound words, which would have different meanings if separated (i.e., heat wave).
The following step was the deletion of each word with very low frequency (words appearing 1 or
2 times) and the filtering of frequently recurring but meaningless words (i.e., connectors) with the “stop
words” function. The dataset was finalised with the word-sense disambiguation and the stemming
processes. The word-sense disambiguation aims to clarify the ambiguity between words with same or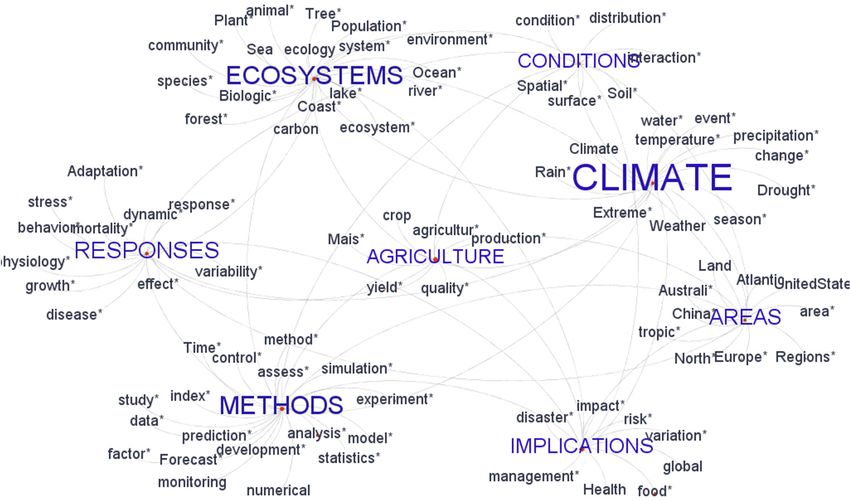
Sustainability 2019, 11, x FOR PEER REVIEW 4 of 18
Table 1. Scripts for extraction of documents. The scripts are referred to classes 1 and 2.
Class
Sustainability 2019, 11, 2547
Script for extraction 4 of 18
(TITLE-ABS-KEY (extreme AND weather AND event*) OR TITLE-ABS-
1. Extreme weather events (subject
KEY (severe AND weather AND event*)) AND (LIMIT-TO (SUBJAREA,
area: Agriculture)
similar spelling but different meaning "AGRI"))
(i.e., acronyms). The stemming analysis allows for including in
the dataset all variant forms of the (((TITLE-ABS-KEY
same word (common (extreme
rootAND weather
or same AND event*))
meaning) with OR (TITLE-ABS-
a single lemma
2. Extreme weather events—
KEY (severe AND weather AND event*))) AND (TITLE-ABS-KEY
(i.e., contamination and contaminated or corn and maize). All the words subject to the stemming analysis
Agriculture
(agricult*)))
are marked in this manuscript with an asterisk.
The Class 1 analysis was intended to provide a general overview of the state-of-the-art of research
The Class 1 analysis was intended to provide a general overview of the state-of-the-art of
on EWE, examining the trend of the number of published documents from 1982 to July 2018. The words
research on EWE, examining the trend of the number of published documents from 1982 to July 2018.
included in the dataset were then grouped in conceptual clusters to report the main topics concerning
The words included in the dataset were then grouped in conceptual clusters to report the main topics
EWE tackled by the scientific community. The clusters identified were: “Climate”, “Methods”,
concerning EWE tackled by the scientific community. The clusters identified were: “Climate”,
“Ecosystems”, “Responses”, “Agriculture”, “Conditions”, “Areas” and “Implications”. For each
“Methods”, “Ecosystems”, “Responses”, “Agriculture”, “Conditions”, “Areas” and “Implications”.
cluster, a words frequency analysis was carried out to identify the research hotspots and tendencies.
For each cluster, a words frequency analysis was carried out to identify the research hotspots and
The conceptual classification model is reported in Figure 1.
tendencies. The conceptual classification model is reported in Figure 1.
Data collection: Scopus
Query string in advanced search
Data Preprocessing: Excel
Cleaning the data:
remove URL, punctuation marks, numbers,…
Low frequency Stop words Word-sense
Tokenisation Stemming
words deletion removal disambiguation
Data Processing: Excel and Gephi
Cluster analysis
Figure1.1. Conceptual
Figure Conceptual classification
classificationmodel
modelused
usedin
inthis
thisstudy.
study.
In addition
In addition to
to the
theaforementioned
aforementionedanalytical reports,
analytical reports,thethe
Class 2 dataset
Class was built
2 dataset through
was built an in-
through
an in-depth evaluation to provide a complete overview of the state-of-the-art research on EWE the
depth evaluation to provide a complete overview of the state-of-the-art research on EWE in in
agricultural
the agriculturalspace.
space.Frequency
Frequency analysis
analysiswaswascarried
carriedout outwithin
within the
the categories
categories of of publications,
publications,
contributingauthors
contributing authorsandand countries.
countries. TheThe extraction
extraction of the
of the authors’
authors’ affiliation
affiliation of theofdocuments
the documents was
was used
used to analyse the geographical distribution of the contribution to research and to identify
to analyse the geographical distribution of the contribution to research and to identify potential gaps. potential
gaps.
The Theappearing
words words appearing in title, and
in title, keywords keywords
abstract and
wereabstract
analysedwere analysed
to identify to identify
possible possible
intercorrelations
between topics and interconnections between EWE and the most widespread crops in the world.crops
intercorrelations between topics and interconnections between EWE and the most widespread
in the world.
3. Results
3. Results
3.1. Class 1: Trend and Cluster Analysis
Class 1: Trend
The and cluster
total amount analysis revised in Class 1 from 1952 to July 2018 was 1418. From 1952 to
of publications
1986 the
Thedocuments
total amount on topic EWE in the
of publications Scopusindatabase
revised were1952
Class 1 from veryto limited (no more
July 2018 than From
was 1418. one/year).
1952
Starting from 1987, the interest on EWE has slowly risen, with an average
to 1986 the documents on topic EWE in the Scopus database were very limited (no more than 16.4% per year growth
(from 2 to 196
one/year). in 1987
Starting and1987,
from 2017, respectively).
the interest on EWEThe has
topic became
slowly relevant
risen, only
with an in the 16.4%
average last ten years,
per year
considering
growth (from that2 85%
to 196of in
the1987
documents have
and 2017, been published
respectively). The since
topic 2008.
became Since 2008, the
relevant average
only in the annual
last ten
growth was 13.8% (from
years, considering 61 toof196
that 85% thearticles in 2008
documents andbeen
have 2017,published
respectively).
sinceFigure 2 shows
2008. Since trend
2008, theanalysis
average
normalised on the total amount of documents in subject area “Agricultural and Biological Sciences”.
Natural oscillations are presented year by year.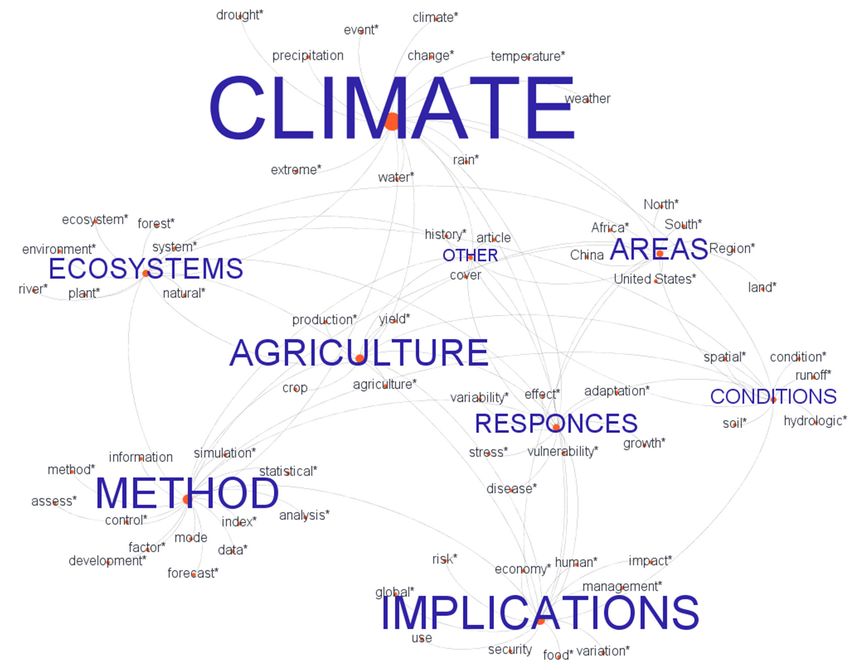
Sustainability 2019, 11, x FOR PEER REVIEW 5 of 18
annual growth was 13.8% (from 61 to 196 articles in 2008 and 2017, respectively). Figure 2 shows
trend analysis
Sustainability normalised
2019, 11, 2547 on the total amount of documents in subject area “Agricultural5 and
of 18
Biological Sciences”. Natural oscillations are presented year by year.
0.12% 100
0.11%
0.10%
Normalised amount of publications [%]
0.09% 50
Variation from previous year [%]
0.08%
0.07%
0.06% 0
0.05%
0.04%
0.03% -50
0.02%
0.01%
0.00% -100
1987 1988 1989 1990 1991 1992 1993 1994 1995 1996 1997 1998 1999 2000 2001 2002 2003 2004 2005 2006 2007 2008 2009 2010 2011 2012 2013 2014 2015 2016 2017 2018
year
Figure 2. Class 1. Normalised amount of publications per year. The red line shows the trend of
Figure 2. Class 1. Normalised amount of publications per year. The red line shows the trend of publications
publications across
across the years; the the
greyyears;
dashedtheline
grey dashedthe
illustrates linevariation
illustrates theprevious
from variation from
year previous year (1987-
(1987–2018).
2018).
The first 500 words among the pre-processed ones of Class 1, which corresponds to 76% of total
amountTheoffirst
this500 words
class, wereamong
grouped theinto
pre-processed ones of
eight conceptual Class (Figure
clusters 1, which3),corresponds to 76% ofwords
plus one containing total
amount of this class, were grouped into eight conceptual clusters (Figure 3),
regarding non relevant issues (not shown). To ease visualisation, the clusters represented in Figure 3 plus one containing
words regarding
report only the topnon20%relevant issues
of the 500 words.(notThe
shown).
clusterTo easedimension
label visualisation, the clustersto
is proportionate represented
the weight in
of
Figure
the 3 report
cluster. only the top 20%
Sustainability 2019, 11, x FOR PEER REVIEW
of the 500 words. The cluster label dimension is proportionate to the
6 of 18
weight of the cluster.
The largest cluster was the one concerning “Climate” which includes all words regarding
climatology and weather conditions. The EWE included in the cluster were, in descending order:
drought, heat waves, floods, wildfires, frost and hurricanes. Other relevant clusters were
“Ecosystems”, “Methods” and “Responses” (Table 2). The cluster “Ecosystems” highlighted the
lemmas associated with the environment, wildlife and forestry. The cluster “Methods” contained the
words related to tools, technologies, models and protocols utilised to detect the EWE and their effects.
The cluster “Responses” collected the terminology related to the effects on target, the target response
and the strategies to face extreme climate conditions.
The main result from the analysis of the Cluster “Climate” was that the most relevant topics
were temperature and drought, while precipitation showed a lower frequency. When excluding the
first words (climate, change, extreme, weather and events), which are intended for focusing the topic
of the documents, “temperature” had a weight equal to 4.7% of the total amount of the Cluster, while
“water” and “drought” weighted 4.1% and 3.2%, respectively. Much lower was the frequency of
other EWE, specifically “frost” (0.5%) and hurricanes (0.4%).
Within the cluster “Ecosystems”, the lemma “environment” was the most relevant (8.5%),
followed by similar or linked concepts (i.e., “population”, “ecosystem”, “species”). The highest
frequency words of the cluster “Methods” were connected to models (11.9%), analysis (9.1%) and
weather forecast (3.9%). The frequency of some words related to the use of remotely sensed
approaches were rather low (satellite 1%, remote sensing 0.8%, imagery 0.4%).
The cluster “Responses” highlights the significant interest on the effects (10.1%) and their
Figure 3. Clusters
Clusters inin Class
Class 1.
1. The
Thelabel
label size
size represents
represents cluster
cluster weight.
weight. Words
Words marked
marked with an asterisk
occurrence, especially regarding growth (5.7%) and physiology (3.5%). Another interesting topic
are the outcome of the lemming process.
within this cluster, focusing on responses and consequences of EWE, is related to adaptation
strategies (5.1%).
The Table
largest cluster
2. Main was of
clusters the one1. concerning
Class The clusters are“Climate” which
represented includes
by highest all words
frequency words.regarding
climatology and weather conditions. The EWE included in the cluster were, in descending of
The analysis carried out on Class 1 provided a general overview of the state-of-the-art the
order:
Cluster
research Lemmas and relative occurrence [%] Cluster percentage
drought, on heat EWE,
waves,as afloods,
starting point for
wildfires, a more
frost detailed dissection.
and hurricanes. Other relevant clusters were “Ecosystems”,
Climate, 16.3%, Change 11.0%, Extreme 8.0%, Weather 7.5%r, Event
“Methods” and “Responses” (Table 2). The cluster “Ecosystems” highlighted the lemmas associated
Climate 6.3%, Temperature 4.7%, Water 4.1%, Drought 3.2%, Precipitation 30%
with the environment, wildlife
2.7%, Rain 2.7%…and forestry. The cluster “Methods” contained the words related to
Environment 8.5%, Forest 7.7%, Population 6.1%, Animal 5.6%,
Ecosystems Ecosystem 5.5%, Plant 4.6%, Sea 3.8%, Species 3.9%, System 3.1%, 15%
Carbon 2.8%…
Model 11.9%, Analysis 9.1%, Forecast 3.9%, Assess 3.1%, Data 3.0%,
Methods 13%
Simulation 2.7%…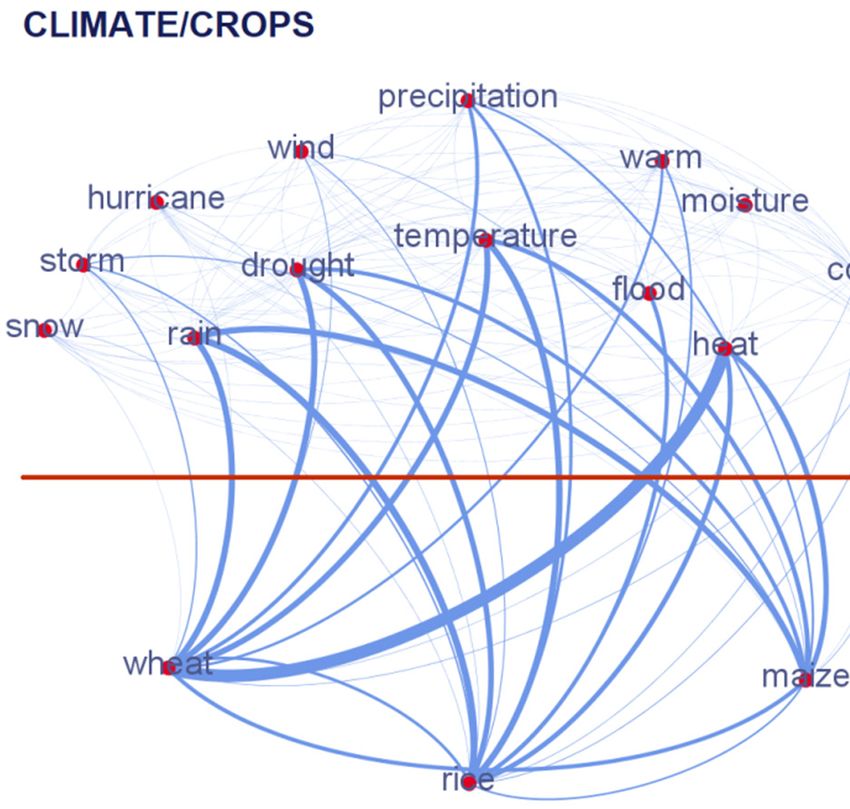
Sustainability 2019, 11, 2547                                                                              6 of 18

tools, technologies, models and protocols utilised to detect the EWE and their effects. The cluster
“Responses” collected the terminology related to the effects on target, the target response and the
strategies to face extreme climate conditions.

            Table 2. Main clusters of Class 1. The clusters are represented by highest frequency words.

  Cluster          Lemmas and relative occurrence [%]                                       Cluster percentage
                   Climate, 16.3%, Change 11.0%, Extreme 8.0%, Weather 7.5%r, Event
  Climate          6.3%, Temperature 4.7%, Water 4.1%, Drought 3.2%, Precipitation 2.7%,    30%
                   Rain 2.7% . . .
             Environment 8.5%, Forest 7.7%, Population 6.1%, Animal 5.6%,
  Ecosystems Ecosystem 5.5%, Plant 4.6%, Sea 3.8%, Species 3.9%, System 3.1%,               15%
             Carbon 2.8% . . .
                   Model 11.9%, Analysis 9.1%, Forecast 3.9%, Assess 3.1%, Data 3.0%,
  Methods                                                                                   13%
                   Simulation 2.7% . . .
                   Effect 10.1%, Stress 5.7%, Growth 5.7%, Adaptation 5.1%, Dynamic 5.0%,
  Responses                                                                                 11%
                   Response 5.0%, Disease 4.5%, Physiology 3.5% . . .
  Other                                                                                     31%

     The main result from the analysis of the Cluster “Climate” was that the most relevant topics were
temperature and drought, while precipitation showed a lower frequency. When excluding the first
words (climate, change, extreme, weather and events), which are intended for focusing the topic of the
documents, “temperature” had a weight equal to 4.7% of the total amount of the Cluster, while “water”
and “drought” weighted 4.1% and 3.2%, respectively. Much lower was the frequency of other EWE,
specifically “frost” (0.5%) and hurricanes (0.4%).
     Within the cluster “Ecosystems”, the lemma “environment” was the most relevant (8.5%), followed
by similar or linked concepts (i.e., “population”, “ecosystem”, “species”). The highest frequency words
of the cluster “Methods” were connected to models (11.9%), analysis (9.1%) and weather forecast
(3.9%). The frequency of some words related to the use of remotely sensed approaches were rather low
(satellite 1%, remote sensing 0.8%, imagery 0.4%).
     The cluster “Responses” highlights the significant interest on the effects (10.1%) and their occurrence,
especially regarding growth (5.7%) and physiology (3.5%). Another interesting topic within this cluster,
focusing on responses and consequences of EWE, is related to adaptation strategies (5.1%).
     The analysis carried out on Class 1 provided a general overview of the state-of-the-art of the
research on EWE, as a starting point for a more detailed dissection.

3.2. Class 2.1: Analysis of Trend and Geographical Distribution of Publications
     After refining the search, combining EWE and agriculture in the search form, Class 2 was created,
and preliminary statistics preceded further cluster analysis. As for Class 1, the first analysis performed
was the distribution of the publications over the years. The result of the advanced search in Scopus
database was 806 documents published from 1970 to July 2018. In particular, 72% of the documents were
classified as “article”, 11% as “conference papers”, 8% consisted of “book chapter”, 7% as “reviews”,
the remaining 2% was categorised as “book” and “article in press”. The trend of the publications
in the years was analysed starting from 1996 due to the sporadicity of documents published before
1995. 87% of scientific articles were published after 2007, with an average annual growth value of
24.1% (from 14 to 121 publications in 2007 and 2017, respectively). The average annual growth of
the considered period was 25.5% (from 3 to 121 respectively in 1996 and 2017). Figure 4 shows trend
analysis normalised on the total amount of documents including the word “agricult*” in title, keywords
and abstract.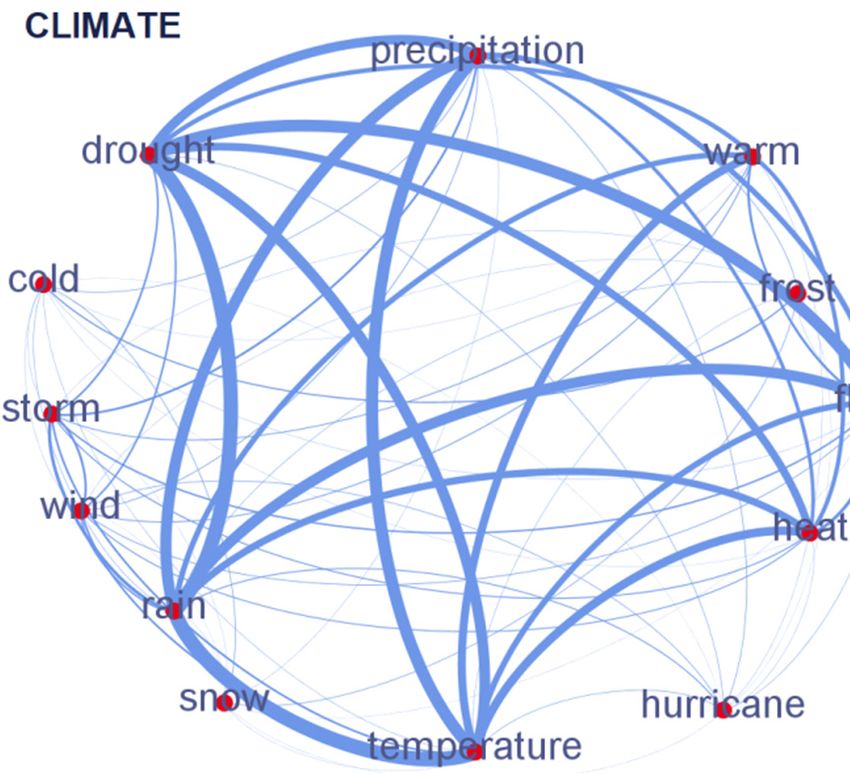
Sustainability 2019, 11, 2547 7 of 18
Sustainability 2019, 11, x FOR PEER REVIEW 7 of 18
0.003 80
60
0.003
40
Variation from previous year [%]
Normalised amount of publications [%]
0.002
20
0.002 0
-20
0.001
-40
0.001
-60
0.000 -80
1996 1997 1998 1999 2000 2001 2002 2003 2004 2005 2006 2007 2008 2009 2010 2011 2012 2013 2014 2015 2016 2017 2018
year
Figure 4. Class 2. Normalised number of publications per year. The red line shows the trend of
Figure 4. Class 2. Normalised number of publications per year. The red line shows the trend of publications
publications across the years; the grey dashed line illustrates the variation from previous year (1996-
across the years; the grey dashed line illustrates the variation from previous year (1996–2018).
2018).
The second quantitative assessment performed was the research outputs stemming from
The second quantitative assessment performed was the research outputs stemming from intra-
intra-national or inter-national collaborations. Of 806 total documents, 614 are single-country
national or inter-national collaborations. Of 806 total documents, 614 are single-country contributions
contributions and 192 are international collaborative ones. All continents contributed to research,
and 192 are international collaborative ones. All continents contributed to research, and four of them
and four of them are represented in the top ten contributors. Among the top ten contributing countries,
are represented in the top ten contributors. Among the top ten contributing countries, single-country
single-country documents
documents prevailed prevailed
in the top sevenin the top seven
countries, countries,
while researchwhile
groupsresearch groups
in the other in the
three other
(Italy,
three
Switzerland and Netherlands) tended to collaborate more at international level. Based on to theon
(Italy, Switzerland and Netherlands) tended to collaborate more at international level. Based
to the number
number of single-country
of single-country articles,
articles, India
India ranked
ranked second
second in the
in the toptop
tenten contributors,
contributors, butbut it showed
it showed
relative lack of international collaboration (Table
relative lack of international collaboration (Table 3).3).
The US, Canada and Brazil are the three major contributors of the Americas; UK, Germany and
Table
Italy 3. Top tenthe
contributed contributors in extreme
most in Europe. weather
Within events
Europe, the(EWE)/Agriculture field of research.
Netherlands, Switzerland, TheFrance
Spain and first
column contains the total amount of documents published by single-country
resulted to be the most active in terms of international collaborations. authors; the second
column contains the number of documents written as international collaboration; the third column
contains the
Table 3. total
Top tenamount.
contributors in extreme weather events (EWE)/Agriculture field of research. The first
column contains the total amount of documents published by single-country authors; the second
Country Single-Country International Total Amount
column contains the number of documents written as international collaboration; the third column
USA
contains the total amount. 141 62 203
China 46 27 83
Country UK Single-Country 42 International
38 Total
80 amount
USA Australia 141 41 6230 71 203
China Canada 46 40 2723 63 83
UK Germany 42 32 3822 54 80
Australia India 41 50 3013 63 71
Canada Italy 40 22 2327 49 63
GermanySwitzerland 32 11 2216 27 54
India Netherlands 50 8 1318 26 63
Italy 22 27 49
Switzerland 11 16 27
The US, Canada and Brazil 8are the three major contributors
Netherlands 18
of the Americas; 26 UK, Germany and
Italy contributed the most in Europe. Within Europe, the Netherlands, Switzerland, Spain and France
resultedTheto third
be thecountry
most active
in Asiainpublishing
terms of international collaborations.
research concerning EWE and agriculture, after China and
The is
India, third
the country in Asia
Philippines. publishing
Despite research
reporting concerning
a minimal EWEofand
number agriculture,
documents, afterAfrica,
South China Nigeria
and India,
is the Philippines. Despite reporting a minimal number of documents, South Africa,
and Kenya are the most operative countries in Africa. Australia and New Zealand are registered Nigeria and Kenya
as
areequal
the most operativeincountries
contributors Oceania.in Africa. Australia and New Zealand are registered as equal contributors
These findings were supported by the analysis of the authors’ affiliation, which confirmed that
in Oceania.
theThese
US and China have
findings werethe leadership
supported byinthe
this field of of
analysis research (Figureaffiliation,
the authors’ 5). which confirmed that
the US and China have the leadership in this field of research (Figure 5).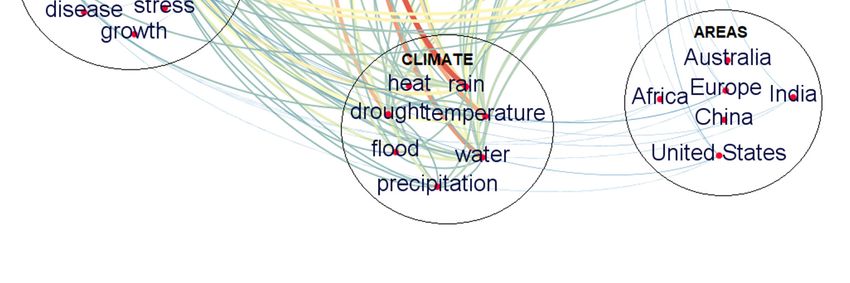
separated by continent in 5 clusters, running the Force Atlas layout. The node size indicates the
   weight of the country, intended as the total number of published documents (single-country and
   international collaboration). The edge thickness represents the intensity of international collaboration
   (Figure 6). US, UK and Australia rank first, second and third in cooperation with 62, 38 and 30 shared
   articles, respectively. In Europe, Italy and Germany rank second and third. Information about other
Sustainability
   countries2019,   11, 2547 in Table 4. The most intense international collaboration was between the US and
               is reported                                                                                8 of 18

   the UK, followed by the ones between France and the UK, China and the UK and China and Australia.
  Sustainability 2019, 11, x FOR PEER REVIEW                                                                   8 of 18

        The international research collaboration was analysed through cluster analysis performed using
  the Gephi software. After importing the spreadsheet, the software recognised 71 Nodes (countries)
  and 413 Edges (links highlighting cooperation between different countries). The nodes were
  separated by continent in 5 clusters, running the Force Atlas layout. The node size indicates the
  weight of the country, intended as the total number of published documents (single-country and
  international collaboration). The edge thickness represents the intensity of international collaboration
  (Figure 6). US, UK and Australia rank first, second and third in cooperation with 62, 38 and 30 shared
  articles, respectively. In Europe, Italy and Germany rank second and third. Information about other
  countries is reported in Table 4. The most intense international collaboration was between the US and
  the UK, followed by the ones between France and the UK, China and the UK and China and Australia.

       Figure
     Figure  5. 5.
                TopTop ten
                     ten   contributorsininEWE/Agriculture
                         contributors       EWE/Agriculture field
                                                            field of
                                                                  of research.
                                                                     research. Chinese
                                                                                ChineseAcademy
                                                                                         Academy  ofof
                                                                                                     Sciences
                                                                                                       Sciences
       ranks first, United States Department of Agriculture second, the other Institutions are very close.
     ranks first, United States Department of Agriculture second, the other Institutions are very close.

     The international research collaboration was analysed through cluster analysis performed using
the Gephi software. After importing the spreadsheet, the software recognised 71 Nodes (countries)
and 413 Edges (links highlighting cooperation between different countries). The nodes were separated
by continent in 5 clusters, running the Force Atlas layout. The node size indicates the weight of
the country, intended as the total number of published documents (single-country and international
collaboration). The edge thickness represents the intensity of international collaboration (Figure 6).
US, UK and Australia rank first, second and third in cooperation with 62, 38 and 30 shared articles,
respectively. In Europe, Italy and Germany rank second and third. Information about other countries
is reported in5.Table
       Figure          4. The
                  Top ten       most intense
                           contributors       international
                                        in EWE/Agriculture     collaboration
                                                            field               was between
                                                                  of research. Chinese   Academy theofUS  and the UK,
                                                                                                       Sciences
followed  by first,
       ranks  the ones   between
                    United          France and
                           States Department    the UK, China
                                             of Agriculture       and
                                                            second,  thethe UK
                                                                         other   and China
                                                                               Institutions areand
                                                                                                veryAustralia.
                                                                                                      close.

        Figure 6. Network diagram of international research cooperation in EWE/Agriculture. Nodes are
        separated by continent in 5 clusters. Node size indicates the weight of the country (total number of
        published documents); edge thickness represents the intensity of international collaboration.

     Figure 6. 6.Network
       Figure     Networkdiagram
                           diagram of  of international
                                           international research  cooperationininEWE/Agriculture.
                                                         research cooperation        EWE/Agriculture.      Nodes
                                                                                                        Nodes areare
     separated
       separatedbybycontinent
                     continentinin55clusters.
                                     clusters. Node size
                                                      size indicates
                                                            indicatesthe
                                                                      theweight
                                                                          weightofofthe
                                                                                      thecountry
                                                                                           country  (total
                                                                                                 (total    number
                                                                                                        number of of
       published
     published    documents);edge
                 documents);   edgethickness
                                      thickness represents
                                                 represents the intensity
                                                                 intensityof
                                                                          ofinternational
                                                                             internationalcollaboration.
                                                                                             collaboration.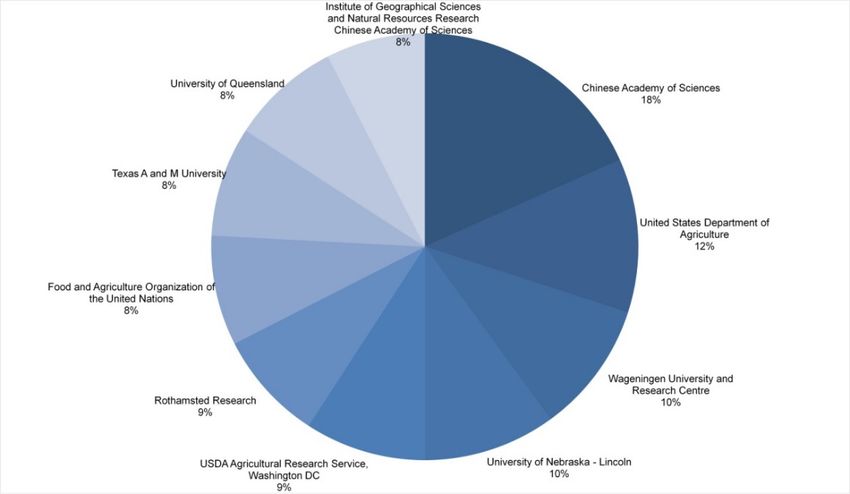
Sustainability 2019, 11, x FOR PEER REVIEW                                                              9 of 18

                                Table 4. Top ten international research cooperating countries.

                                             Country            no. collaboration
Sustainability 2019, 11, 2547                  USA                      62                                     9 of 18
                                               UK                       38
                                            Australia                   30
                                Table 4. Top ten international research27cooperating countries.
                                              China
                                      Italy                 27
                                  Country
                                    Canada                 no.
                                                            23 Collaboration
                                   Germany
                                    USA                     22     62
                                     France
                                     UK                     19     38
                                 Netherlands
                                 Australia                  18     30
                                   China
                                     Spain                  17     27
                                    Italy                          27
  Class 2: Cluster analysis       Canada                           23
                                 Germany                           22
       The pre-processed words of France
                                   Class 2 (350, corresponding to 19
                                                                   83% of total extracted words) were
  grouped in the same clusters Netherlands
                                as Class 1. Figure 7 provides an 18 overview of the clusters and their
                                   Spain                           17
  relevant lemmas. For the sake of simplicity, only the first 20% of words are reported in the figure.
  The cluster label dimension is proportionate to the weight of the cluster.
       Compared
3.3. Class          to Class
           2.2: Cluster       1 the clusters of Class 2 have different weights (Table 5). In this case, the
                        Analysis
  most relevant groups resulted “Climate”, the largest one, “Implications”, “Methods” and
      The pre-processed
  “Agriculture”.            words
                  The cluster        of Class 2 contains
                               “Implications”    (350, corresponding     to 83% of total
                                                            terminology highlighting  the extracted  words)
                                                                                           consequences        were
                                                                                                          of the
grouped
  EWE for in communities:
             the same clusters   as Class
                             in this  group1. the
                                              Figure  7 provides
                                                  words    concernansituations
                                                                      overviewofofrisk,
                                                                                   the clusters  and their
                                                                                         management        relevant
                                                                                                       choices,
lemmas.    For the  sake of simplicity,   only  the first 20%  of words   are reported  in the figure.
  repercussions on the economy and human health. The cluster “Agriculture” collects lemmas referring   The  cluster
label dimension    is proportionate    to the  weight  of  the cluster.
  to the different crops and the management of agricultural operations.

       Figure7.7.Clusters
      Figure     Clusters in
                           in Class
                              Class 2. The
                                       Thelabel
                                           labelsize
                                                 sizerepresents
                                                      representscluster weight.
                                                                  cluster       Words
                                                                          weight.     marked
                                                                                  Words      with
                                                                                        marked    an asterisk
                                                                                                with an asterisk
       are outcomes   of lemming   process.
      are outcomes of lemming process.

     Compared to Class 1 the clusters of Class 2 have different weights (Table 5). In this case, the most
relevant groups resulted “Climate”, the largest one, “Implications”, “Methods” and “Agriculture”.
The cluster “Implications” contains terminology highlighting the consequences of the EWE for
communities: in this group the words concern situations of risk, management choices, repercussions
on the economy and human health. The cluster “Agriculture” collects lemmas referring to the different
crops and the management of agricultural operations.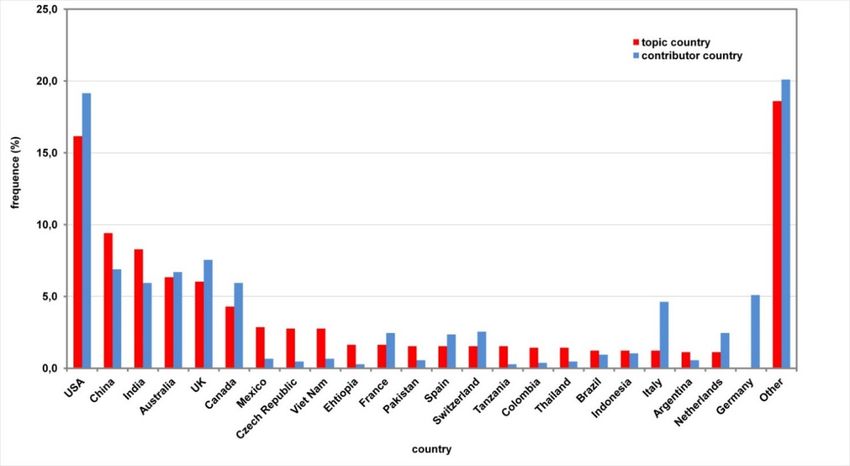
Sustainability 2019, 11, 2547                                                                             10 of 18

            Table 5. Main clusters of Class 2. The clusters are represented by highest frequency words.

  Cluster          Lemmas and Relative occurrence [%]                                      Cluster Percentage
                   Climate, 21.1%, Change 13.0%, Extreme 7.7%, Weather 7.4%r, Event
  Climate          5.7%, Water 5.4%, Drought 4.2%, Temperature 4.7%, Rain 3.6%,            31%
                   Precipitation 2.9% . . .
                   Management 9.0%, Risk 7.3%, Impact 7.1%, Food 6.3%, Global 4.0%, Use
  Implications                                                                             14%
                   4.0%, Economy 3.7%, Human 3.1%, Variation 3.1%, Security 3.1% . . .
                   Model 13.2%, Analysis 9.0%, Forecast 5.8%, Assess 5.4%, Data 3.7%,
  Methods                                                                                  14%
                   Development 3.5%, Simulation 3.1%, Index 2.3% . . .
                   Agriculture 31.0%, Crop 14.6%, Production 9.7%, Yield 6%, Farm 5.5%,
  Agriculture                                                                              11%
                   Wheat 4.3%, Maize 3.7%, Irrigation 3.4%, Quality 2.3% . . .
  Other                                                                                    30%

      The analysis of the cluster “Climate” led to similar results to those obtained for Class 1, and the
most studied EWE were the ones related to drought stress (4.2%), increase of temperature (4.7%) and
rainfall (3.6%). Other EWE faced from scientific literature were, in sequence, floods, heat waves, storm
and, at lower frequency, frost and hurricanes.
      Management (9.0%), risk (7.3%), impact (7.1%) and food security (6.3%) were the highest
frequency words characterising cluster “Implication”. Much lower was the frequency of words related
to mitigation measures (1.1%) and governance systems (0.7%).
      Results for the cluster “Methods” were very similar to the ones already provided for Class.1,
stressing the need for modelling and predicting weather extremes. Aside from some general lemmas,
most recurrent words in this cluster were “model” (13.2%), “forecast” (5.7%), “simulation” (3.1%)
and “index” (2.3%; during stemming analysis, all meteorological and climatic indices were grouped
under this string). Within this group, the following principal arguments found were the ones related to
remote sensing and satellite imagery (1.8%).
      High-frequency words of the cluster “Agriculture” were partially devoid of real information, while
it was more interesting to perform a specific statistic on different crops to verify the direction in which
research is moving. After analysing only the frequencies of different crops, results showed that major
attention was pointed to wheat, maize and rice, with values of 27%, 23% and 11%, respectively. A minority
of documents dealt with potatoes, cotton and soybean (6%, 6% and 4%, respectively), with the other crops
not contributing more than 3%.
      An overview of the other clusters resulted in rivers, forests and sea appearing to be the most
frequent topics of cluster “Ecosystems”, while carbon and pollution were the main causes of concern
within the environmental emergencies. Reactions by plants and ecosystems were grouped in the cluster
“Responses”. A reporting frequency of 16% clearly showed that the literature emphasises adaptation
strategies. Variability, growth and vulnerability were hotspots of the academic research. The following
lemmas are related to the consequences for the plants, in particular diseases. The terminology classified
under the cluster “Conditions” dealt with abiotic agents different from climate, mainly concerning soil and
hydrologic characteristics. The effects of EWE cannot be contemplated without considering concurrent
factors which may contribute to enhance or, conversely, contain their impact. Furthermore, some EWE,
such as precipitation and flood, are affecting, for their part, the stability of biotopes. When excluding
the first overview words, the main arguments found within this cluster were related to the mechanisms
dealing with the soil-air interface (runoff, 6%; surface, 5%, erosion 5%, catchment 4%).
      The cluster “Areas” was the collection of lemmas providing geographical details. As noticed
for other clusters, some of the high-ranking words did not provide real information (i.e., “land”,
“region”), and so a further analysis was performed to highlight which countries have been objective
of scientific research. When focusing on top ranking countries, research was mainly biased toward
largest and richest nations (United States 19.2%, United Kingdom 7.5%, Australia 6.7%) which are the
Sustainability 2019, 11, 2547 11 of 18
less vulnerable [36–38]. Nevertheless, going through the list, it is noticeable that a substantial number
Sustainability
of documents 2019,deal
11, xwith
FOR PEER REVIEW countries (China 6.9%, India 5.9%, Viet Nam 0.7%).
developing 11 of 18
By comparing the frequencies of the contributor countries and those of the countries appearing
By comparing the frequencies of the contributor countries and those of the countries appearing
as topic in cluster “Areas” it resulted that some nations (i.e., Germany, Italy) focused their search
as topic in cluster “Areas” it resulted that some nations (i.e., Germany, Italy) focused their search
mainly on other countries emergencies and, vice versa, others (i.e., Mexico, Viet Nam) are objective of
mainly on other countries emergencies and, vice versa, others (i.e., Mexico, Viet Nam) are objective
international interest (Figure 8).
of international interest (Figure 8).
Figure 8. Comparison between countries object of search and contributor countries.
Figure 8. Comparison between countries object of search and contributor countries.
Class
3.4. 2: Interrelationships
Class among
2.3: Interrelationships variables
among Variables
The words interrelations were analysed to provide specific information on how main topics
clusters are addressed
belonging to the same or different clusters addressed together.
together. The words in the title, keywords
and abstract
abstract sections
sectionswere
werecorrelated
correlatedtotohighlight thethe
highlight co-appearing
co-appearing words and and
words theirtheir
frequency. The
frequency.
investigation was performed on the highest frequency words of each cluster and led
The investigation was performed on the highest frequency words of each cluster and led to a high to a high number
of interrelations
number (Figure 9).
of interrelations (Figure 9).
First of all, the connections within the cluster “Climate” were considered.
considered. The statistical analysis
scientific community
highlighted that the scientific community had had researched
researched all
all EWE
EWE(Figure
(Figure10a).
10a).
Figure 10b shows the analysis of the the interconnections
interconnections between EWE and the most most widespread
widespread
crops
crops in the world. Drought stress and rainfalls were correlated to maize, wheat and rice. Heat waves
correlated to maize, wheat and rice.
seemed the most alarming weather event concerning concerning wheat,
wheat, while
while floods
floods are
are relevant
relevant only
only for
for rice.
rice.
For these
these crops,
crops,thethecorrelations
correlationswith
withother
otherhazards, such
hazards, as frost,
such hurricanes
as frost, and and
hurricanes moisture are very
moisture are
weak.
very weak.
The analysis of the interactions between the lemmas belonging to the cluster “Climate” and the
cluster “Implications” highlighted that drought stress and heavy rainfall had high correlations with
related to
many topics related to societies
societies and,
and, in
in particular,
particular,with
withfood
foodsecurity
security(Figure
(Figure10c).
10c).
Drought stress
stress and
andrainfall
rainfallwere
werethetheweather events
weather more
events connected
more withwith
connected words of theofother
words the
clusters.
other clusters.Sustainability 2019, 11, 2547 12 of 18
Sustainability 2019, 11, x FOR PEER REVIEW 12 of 18
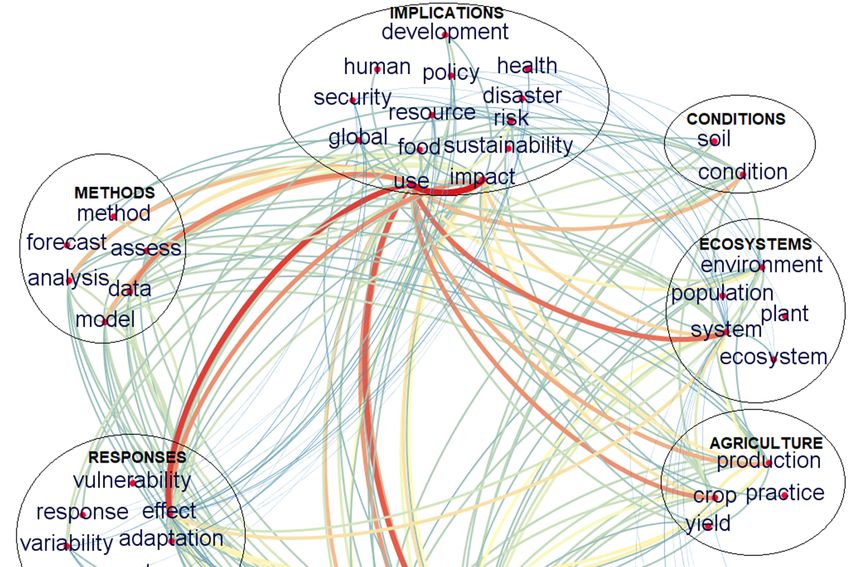
Figure 9. Interrelations between words appearing in title, keywords and abstract sections. The thickness and
the darker color of the lines indicate a larger number of connections. The circles highlight different clusters.
Figure 9. Interrelations between words appearing in title, keywords and abstract sections. The
thickness and the darker color of the lines indicate a larger number of connections. The circles
highlight different clusters.Sustainability 2019, 11, 2547 13 of 18
Sustainability 2019, 11, x FOR PEER REVIEW 13 of 18
(a) (b)
(c)
Figure 10. Co-occurrence of topics within cluster “Climate” (a) between cluster “Climate” and the
Figure 10. Co-occurrence of topics within cluster “Climate” (a) between cluster “Climate” and the
main crops (b) and between cluster “Climate” and cluster “Implications” (c).
main crops (b) and between cluster “Climate” and cluster “Implications” (c).
4.4.Discussion
Discussion
Theissues
The issuesrelated
relatedtotothe
theEWE
EWEand andtheir
theireffects
effectson
onthe
theenvironment,
environment,agriculture
agriculture and
and economy
economy are
are a recent research topic. This aspect is confirmed by the fact that 85% of publications of Class 1
a recent research topic. This aspect is confirmed by the fact that 85% of publications of Class 1 have
have been published starting after 2008 and 87% of Class 2 after 2007. In such a relatively short time
been published starting after 2008 and 87% of Class 2 after 2007. In such a relatively short time span,
span, all the most alarming EWE have been considered by the scientific community, as shown by the
all the most alarming EWE have been considered by the scientific community, as shown by the cluster
cluster analysis of both Class 1 and Class 2. These results are consistent with the evidence from the
analysis of both Class 1 and Class 2. These results are consistent with the evidence from the report of
report of the Intergovernmental Panel on Climate Change (IPCC) claiming, as a result of climate
the Intergovernmental Panel on Climate Change (IPCC) claiming, as a result of climate observations
observations since 1950, that EWE are very likely to occur through a decrease in cold temperature
since 1950, and
extremes thatan
EWE are very
increase likelytemperature
in warm to occur through a decrease
extremes in cold
and heavy temperature
precipitation eventsextremes
[15]. and an
increase in warm temperature extremes and heavy precipitation events [15].
4.1. Cluster Analysis: Trend and Gaps in the ResearchSustainability 2019, 11, 2547 14 of 18
4.1. Cluster Analysis: Trend and Gaps in the Research
The analysis of the methods and technologies currently in use (Cluster “Methods”) highlighted
the reliance of scientists on models simulating different potential scenarios and the crucial role of the
weather forecasting. “Model”, “analysis” and “forecast” were, indeed, the highest-ranking words
of this Cluster both in Class 1 and Class 2 (Tables 2 and 5). However, there seems to be a lack of
research on remote sensing, sensors and imagery as tools for detection of EWE and their effects.
Lemmas related to these tools showed frequency lower than 1.8% in both Classes. The application of
sensors for field noninvasive analysis underlies precision agriculture, based on real-time crop mapping.
Some application of sensor-based technologies to detect abiotic stress has been investigated, i.e.,
for detection of drought stress in barley using hyperspectral images [39] and in maize utilising spectral
indices and IR-temperature [40]. Matese and Di Gennaro [41] tested the applicability of RGB, thermal
and multispectral sensors to detect water stress index in vineyards. Despite examples mentioned of
application of sensor-based technologies for early abiotic stress detection, the current review highlights
the lack of exhaustive research in this field.
Based on the results of the specific analysis of different crops appearing in cluster “Agriculture”,
the scientific community focuses primarily on wheat, maize and rice (27%, 23% and 11%, respectively).
These crops are the top three crops in the world in terms of planted area [42,43]. Nevertheless, when
considering the production value per square kilometer, tomatoes and grapes appear to be the most
lucrative crops [44]. This quantitative review showed that the frequency of lemma “Vitis” in documents
of Class 2 is very low (0.9%), while Class 1 and 2 do not contain any document dealing with tomatoes.
The limited research on the effects of EWE in grapevine is particularly critical since grapevine is a
perennial crop, meaning that the impact of EWE might be particularly severe because they could affect
its production also in the following years.
In the cluster “Responses”, adaptation and plants’ response mechanisms are addressed using
a framework approach, ranging from vulnerability to strategies to avoid or, conversely, taking
advantage of EWE. Undoubtedly, the hotspot of research is adaptation strategies to cope with adverse
environmental conditions. This information emerges particularly from cluster analysis of Class 2, where
there is a difference of 13.6 percentage points between “adaptation” and the following analysed word.
Since words classified in cluster "Conditions" are contributing factors, they are equally and
homogeneously considered by scientists, although it can be observed that there is a more significant
interest on topsoil. The topsoil is the plant-root-soil interface, providing the majority of water and
nutrients, and containing microorganisms which are crucial for plant’s growth. Considering the
topsoil’s more significant influence on vegetation, scientists’ efforts have been focused on it.
The analysis of the cluster “Implications” highlighted the urgency to provide risk management
practices to reduce the potential impact of EWE. Table 5 shows that “management”, “risk” and “impact”
are the top-ranking lemmas of the cluster in Class 2 and the analysis of Class 1 led to similar results.
A crucial topic of this cluster is “food”, as the main implications of CC and EWE on food could likely be
the exacerbation of food insecurity, particularly in the emerging countries. For example, Knox et al. [45]
estimated that by 2050, under a +1.6 ◦ C scenario, the yields of wheat, maize, sorghum and millet in
Africa and South Asia will decrease by 8% compared to current production levels. A recent research
reports that a one degree Celsius warming would induce yield losses on 65% of maize-growing African
areas [46]. A study about the effects of CC in the United States based on ten global circulation models
forecasts a decrease of yield by 4.6% for each 1 ◦ C simulated for maize and by 3.8% for wheat [47].
The effects of EWE could have negative consequences on global markets. The unpredictability of
EWE increases the risk of the variability of production, leading to uncertainty for future price trends.
This variability can be more or less pronounced depending on the phenological stage the crop is
hit by the EWE. These considerations could explain why one of the high-ranking lemmas in cluster
“Implications” is “economy”. Table 5 shows that “economy” appears within the highest-ranking
words of Class 2 with a frequency of 3.7%. The development of adaptation strategies to cope with
world hunger challenge is becoming a key issue for both the agricultural and the scientific community,Sustainability 2019, 11, 2547 15 of 18
as already discussed for Cluster “Responses”. The analysis of Cluster “Implications” highlighted that
fewer documents handle crucial topics such as mitigation measures, with a frequency of 1.1% and
governance systems, with a frequency of 0.7%. Mitigation measures and governance systems can be
considered gaps and will have to be investigated in greater detail.
The evaluation of the topic “Ecosystems” highlighted that international research is focusing on
the analysis of the dynamics of EWE related to different ecosystems. In particular, rivers, forests and
sea resulted the most relevant concern. These topics were not related to the effects of EWE within
the agricultural sector. This, however, was beyond the scope of this study and therefore the cluster
“Ecosystems” was not further analysed.
Lastly, the analysis of the cluster “Areas” highlighted that there is a lack of research concerning
the vulnerable countries, intended as developing countries where the effects of EWE could be more
alarming as showed in Figure 8.
4.2. Geographical Distribution of Publications
The analysis of the geographic distribution of literature carried out through the examination of the
authors’ affiliation (Figure 5) and contributor countries (Figure 8) showed that the most active nations
are the US (19.2%), the UK (7.5%) and China (6.9%). The United States is undoubtedly the largest
contributor country, but it might be noticed that US’s first publication is dated 1978, while the most
productive Asian countries, China and India, started publishing later, in 2005 and 2004 respectively.
The analysis highlighted the low level of international collaboration of the vulnerable countries.
Figure 5 points that the vast majority of joint research concern the Americas and Europe, while, except
for China, Asia and Africa are not very active in international collaboration. It must be underlined
that most of the developing countries have only more recently been approached through international
research. Furthermore, applied research fields, such as Agricultural Sciences shows high growth rates
of international collaboration [48]. It is therefore likely that this gap will be partially filled in the
next years.
4.3. Interrelationships among Variables
CC arises through an increase of co-occurring EWE, causing severe and unpredictable damage to
agriculture. The correlations examination shown in Figure 10a highlighted the importance of studying
multiple EWEs at the same time. The high value of co-occurrence of lemmas “rain”, “temperature” and
“drought” indicated that the EWE rainfall and drought stress were frequently concurrently analysed.
Contrarily to what it can be expected, the interrelation between drought and heat waves was less
strong. The responses of the vegetation to a single event might, indeed, are different from one to
a combination of simultaneous or subsequent EWE. In particular, Figure 10b shows that the effects
of drought stress and rainfalls are considered a threat to maize, wheat and rice, while floods are
relevant only for rice. Rice is in fact used as a model crop to develop possible adaptation and breeding
strategies for other crops in relation to flooding, and thus hypoxia/anoxia tolerance. The analysis of the
interactions between lemmas belonging to the cluster “Climate” and cluster “Implications” is reported
in Figure 10c. It underlines that the most relevant concerns for communities related to global CC are
the lack of water due to drought stress and heavy rainfall threatening food security.
The decision to perform a quantitative review allowed for the analysis of a high number of
documents that would not have been possible through qualitative review. This method ensures
replication of results and a reduction of the subjectivity, which might affect the choice of the documents
and their interpretation. The high number of documents analysed enabled us to identify the hotspots
and gaps, grouping the words into clusters. The knowledge of the hotspots and gaps may represent a
user-friendly document, easy to navigate and to communicate.You can also read