Predicting American Idol with Twitter Sentiment
←
→
Page content transcription
If your browser does not render page correctly, please read the page content below
Predicting American Idol with
               Twitter Sentiment

                                    A comparison of Volume- and Sentiment
                                    analysis with regard to predicting eliminations
                                    of American Idol #RSM_BachelorThesis
                                    #CLevallois

This document is written by Sivan Alon, Simon Perrigaud, and Meredith Neyrand, who
declare that each individual takes responsibility for the full contents of the whole document.
We declare that the text and the work presented in this document is original and that no
sources other than mentioned in the text and its references have been used in creating it. RSM
is only responsible for supervision of completion of the work but not for the contents.

                                                                                            0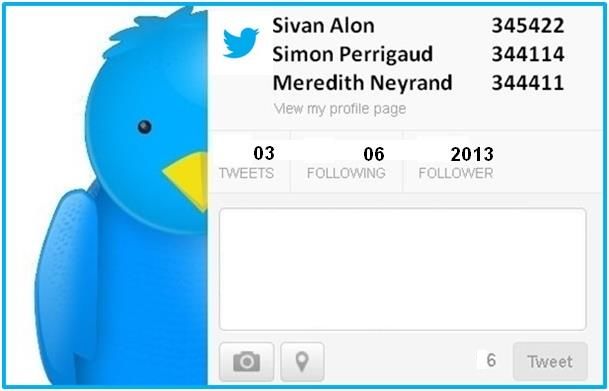
Summary Form

Name instructor                          Clément Levallois
Team number                              3
Name student 1                           Sivan Alon
Name student 2                           Simon Perrigaud
Name student 3                           Meredith Neyrand
Hypothesis as reformulated by you        A greater number of positive tweets about a
                                         contestant of American Idol is more likely to be
                                         associated with a greater number of votes for that
                                         contestant
Theoretical domain                       Elections
Population that was studied              US singing contest show
Case that was studied                    American Idol 2013
Focal unit                               Individual contestants
Independent variable                     The relative share of votes received (Semi-ordinal
                                         ranking)
Dependent variable                       The number of positive tweets about a contestant
Type of relation (Causal / Not causal)   There is no causal relationship. This hypothesis is
                                         based on an association between the number and
                                         nature of tweets pertaining to a contestant on the one
                                         hand (X) and the number of votes that contestant
                                         subsequently receives (Y).
Minimum effect size for having           To have a point of reference, traditional polls
practical relevance                      included in the survey report MAEs varying from
                                         0.4% to 1.81%. Since they are currently the best
                                         prediction tool available to forecast election results
                                         they set the golden standard
Outcome of the quantitative meta-        Volume based meta-analysis MAE: 11.65%
analysis                                 Sentiment based meta-analysis MAE: 9.53%
Your research strategy                   Cross-sectional
Effect size parameter                    N/A
Observed effect size                     N/A
Your study’s contribution to what is     Sentiment improves prediction accuracy when
known about the hypothesis               compared to volume based approach.
Most important recommendation for        One of the central issues further research should
further research                         focus on is to correct for the demographic bias
                                         present within the twitter user base.

                                                                                              0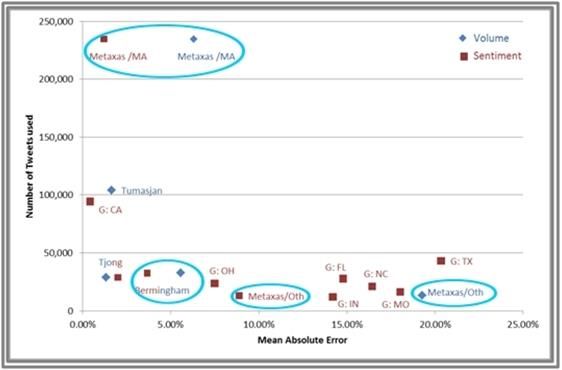
Abstract:
In an attempt to add to the body of research on the topic of
electoral predictions with Twitter we have tried to predict the
eliminations of contestants from American Idol 2013. To this
end, we have conducted a literature review to uncover the
trends in the existing literature and to isolate the factors that
might improve our methodology. Building on the study by
Ciulla et al. (2012) we have extracted over 40,000 tweets and
constructed one prediction model based primarily on tweet
volume and a second model focusing on sentiment. In line with
our hypothesis, we found that sentiment improved the
prediction accuracy. Furthermore, we found that the overall
accuracy of our predictions were low when compared to the
findings of Ciulla et al. As a result, we have outlined the
possible reasons and limitations of our study and suggest four
main    points   of   improvement      for   further   research.

                                                               0
Table of content
Summary Form ........................................................................................................................... 0
1. Introduction ............................................................................................................................ 3
1.1 Twitter .............................................................................................................................. 3
1.2 American Idol ................................................................................................................... 3
1.3 Predicting American Idol with Twitter ............................................................................. 4
1.4 Relevance.......................................................................................................................... 4
2. Literature Review ................................................................................................................... 4
2.1 Survey of the literature ..................................................................................................... 4
2.2 Meta-Analysis ................................................................................................................... 6
2.2.1 Effect Size .................................................................................................................. 6
2.2.2 Meta-analysis Process ................................................................................................ 6
2.2.3 Comparison of prediction methods ............................................................................ 6
2.2.4 Systematic Overview of Methodology ...................................................................... 9
3. Hypothesis ............................................................................................................................ 10
4. Research Methodology ......................................................................................................... 11
4.1 Data collection channel .................................................................................................. 11
4.2 Data collection period ..................................................................................................... 12
4.3 Data Processing and Tweet Classification...................................................................... 12
4.3.1 Data processing: Manual vs. Automatic .................................................................. 12
4.3.2 Tweet Classification................................................................................................. 13
4.4 Data Analysis .................................................................................................................. 14
4.4.1 Volume Model ......................................................................................................... 14
4.4.2 Sentiment Model ...................................................................................................... 14
5. Results .................................................................................................................................. 16
5.1 And the Winner is… ....................................................................................................... 17
5.2 The underlying assumption about voting intention ........................................................ 18
15.3 Limitations ...................................................................................................................... 18
5.3.1 Tweets from users outside of the US ....................................................................... 18
5.3.2 Measurements of Performance ................................................................................ 18
5.3.3 Decreasing Viewership ............................................................................................ 19
5.3.4 Twitter as a social phenomenon ............................................................................... 19
5.3.5 Positive Sentiment Bias ........................................................................................... 19
5.4 Conclusion ...................................................................................................................... 19
Acknowledgements .................................................................................................................. 21
Bibliography ............................................................................................................................. 22
Appendix A: Sentiment Analysis Tools ................................................................................... 25
Appendix B: Summary of the meta-analysis............................................................................ 26
Appendix C: Overview of sentiment analysis methods ........................................................... 28
Appendix D: Inter-annotator Agreement ................................................................................. 29
Appendix E: Umigon’s performance ....................................................................................... 30
Appendix F: Positive Tweets ................................................................................................... 30
Appendix G: American Idol 2013 – Classification of Tweets per week ................................. 31
Appendix H: American Idol 2013 – Predictions (Volume and Sentiment) ............................. 32
2140 characters. Recognisable by its light-
blue bird-logo and its users’ tendency to
1. Introduction classify their own content by use of hash
Ever since its creation the Micro-blogging tags, the micro-blogging platform has
platform ‘Twitter’ has been used as a tool grown to attract the attention of consumers
to predict a variety of outside variables. as well as businesses (Gallaugher 2012).
User generated content (in the form of Created in 2006 in San Francisco, Twitter
‘tweets’) has been analysed to predict is now available in over 20 languages
outcomes ranging from the box-office of (Twitter 2013) and counts over 250 million
movies (Asur & Huberman 2010, Krauss et active users (McCune 2013). Increasingly,
al. 2008), through the stock-prices of researchers have attempted to analyse and
companies (Bollen et al. 2010), all the way make use of the vast amounts of digital
to the outcome of presidential elections content that is continuously being created
(O’Connor et al 2010). through Twitter. This has led to people
Research on predicting the outcome of claiming that an analysis of this content
elections is based on the assumption that could be used as a tool for predictive
popularity and voting intention translates purposes.
into the volume and sentiment of tweets
(analysis of the tweet-content) about a 1.2 American Idol
party or contestant. Building on the Created by Simon Fuller in 2002,
research carried out by Ciulla et al (2012) American Idol welcomes four popular
we have extracted data from Twitter to judges to select, mentor, and guide aspiring
predict the percentage of votes candidates young artists. The show can best be
on the popular TV show American Idol described as a reality-singing competition
will obtain as well as their ranking (and made up of several stages.
elimination). In addition to using the tweet Eleven years after the airing of the first
volume we have also tried to improve the season, American Idol began its twelfth
model’s accuracy by manually annotating season in January of 2013. After the initial
the tweets’ sentiment. As such, the results selection of candidates, the judges
of this study can contribute to the body of eliminated contestants every week until
literature on the subject of electoral reaching the ‘semi-final’ stage in which
predictions. only 24 to 36 contestants remained. From
We believe that by including sentiment in this stage onward, the show’s viewers
our prediction we can improve the overall decided on the fate of the singers by voting
accuracy of the model. The underlying for their favourite one (online, by
assumption of this research is that a telephone, or through SMS). Every week,
positive sentiment strength will reflect the bottom 2 candidates were eliminated
positively on a contestant’s relative until only 10 remained. At this point, the
number of votes and ranking. final stage was introduced and 1 contestant
was eliminated each week. In addition to
1.1 Twitter the elimination, the show would at times
Twitter is a social networking service that also present the bottom two and/or top two
allows its users to post content in the form contestants (the two contestants who
of ‘tweets’. These tweets are short received the lowest and highest number of
messages containing up to and including votes respectively).
3There were two shows per week. The first 2. Literature Review
one took place on Wednesday and was Within the body of research regarding
dedicated to the singers’ performances. At Twitter there has been a growing number
the end of the show, viewers benefited of studies pertaining to the use of
from a 2 hour window to cast their vote information gained from Twitter to predict
(Online: 50 votes per time window per elections. Previous studies have attempted
user; Telephone & Text: Unlimited). The to predict the outcomes of eleven elections,
results were then announced the next day in various countries (USA, Germany,
during the second show. Ireland, The Netherlands and Singapore) at
1.3 Predicting American Idol with different levels (presidential, federal, and
state). The general underlying assumption
Twitter
is that more (less) popular candidates (or
With our study we aimed to replicate
parties) attract more (less) attention on
research conducted by Ciulla et al. (2012).
twitter. Thus, it seems intuitive that the
Consequently, instead of trying to predict
actual percentage of votes candidates
the outcome of political elections, our
(parties) receive is related to twitter chatter
research domain was more generally
during the election period.
elections and our focal unit the individual
Two main methods have been employed to
contestants of American Idol 2013
infer votes from tweets - volume analysis
(population: singing competition in the
and sentiment analysis. The former
US).
involves simply counting the number of
1.4 Relevance tweets mentioning a particular candidate or
Although this study’s focus is on American party. Sentiment analysis, the subject of
Idol, it has implications for the wider field this study, attempts to infer the voting
of ‘making predictions with Twitter’ and intentions from tweets.
more particularly ‘predictions about The results of these studies, however, have
elections’. The hypothesis being that a remained largely inconclusive, raising the
greater tweet volume and positive question, as to what extent Twitter can
sentiment strength about a contestant of actually predict elections.
American Idol is more likely to be In the following literature review we will
associated with a greater number of votes describe the evolution and quality of the
for that contestant. In this context most relevant research that has been
American Idol constitutes a “well defined conducted on the subject of predicting
electoral phenomenon that each week elections with Twitter.
draws millions of votes in the USA”
2.1 Survey of the literature
(Ciulla et al. 2012; p.1). As a consequence,
The first publications to underscore the
American Idol constitutes a stepping stone
potential of using Twitter data as a proxy
in making successful predictions about
for measuring political opinion is the work
political elections. Ultimately, if
conducted by O’Connor et al. (2010). In
successful, the use of Twitter might
this study the authors examine the
complement or even substitute traditional
temporal correlation between various
polls, thereby significantly decreasing
indices of public opinion (e.g. Gallup
costs (Tumasjan et al. 2010).
index) and twitter volume and sentiment
score (ratio of positive to negative tweets).
4With regard to electoral polls the authors demonstrate that by changing the data
found a correlation of 79% between the collection period the model’s accuracy
number of mentions of ‘Barack’ and the fluctuates between 1.51% and 3.34%. Even
results of the presidential election polls in more striking, merely adding one more
2008. However, the volume of tweets party to the subset included in the study
associated with J. McCain also correlated increases the MAE to 9.3%.
highly with those of Obama (74%), rather
than with his own tweeter ratings (no Avello (2011) extended the analysis
measure was reported). O’Connor et al. methods used by O’Connor et al. (2010)
conclude that “topic frequency may not and Tumasjan et al. (2010) to tweets
have a straightforward relationship to collected two months before the US 2008
public opinion in a more general text- presidential elections. By configuring
driven methodology for public opinion Twitter’s search API to include a user’s
measurement” (2010, p. 7), but encourage geographical location, he was able to
further exploration of the subject. correctly predict the election results for 6
different states. With the exception of
Another pioneering work was published in California (MAE = 0.42%), the prediction
the same year by Tumasjan et al. (2010). results largely overestimated voter support
The authors were the first to directly for Obama, with the mean difference
examine the predictive power of twitter varying from 7.49% to 20.34%. His
with regard to election results and suggest findings make evident that bias in
the use of mean absolute error (MAE) as a Twitter’s user base permeates research and
measure of performance. They claim that highlights the need to correct the results
they were able to accurately predict the according to demographics and voting
results of the 2009 German Federal behavior.
election, using the mere tweet volume
mentioning one of six political parties. Metaxas et al. (2011) also analyzed a
They report a mean difference of 1.65% - a number of different state elections by using
competitive performance when viewed both tweet volume as well as sentiment
against traditional polls (0.8%-1.48%). analysis. The authors found that sentiment
This study was highly influential and is improved the prediction accuracy,
responsible for much of the hype producing a lower MAE than an analysis
surrounding the subject of using Twitter based solely on volume. Although the
for electoral predictions. At the same time, results for both methods were inconsistent
it triggered a series of articles claiming the and at times very high (MAEs ranging
results were not based on a well-grounded from 1.2% to 39.6%), this may in part be
methodology and thus could not be explained by Metaxas et al.’s choice of
replicated in future studies. (Avello, 2011; analyzing highly contested elections.
Metaxas et al.,2011; Jungherr et al. 2011). Furthermore, two important conclusions
can be drawn from this study. First, the
Jungherr et al. (2011) wrote a paper in author’s found that the sentiment analysis
response to Tumasjan et al. (2010) pointing method employed by O’Connor et al.
out that the results of the former are highly (2010) is only slightly better than chance.
contingent on the arbitrary methodological Second, the authors have outlined the
choices taken by the authors. They importance of cleansing the data; denoising
5it by removing tweets that constitute spam, different studies’ methodological
propaganda, rumours or other forms of procedures we hope to uncover the sources
disinformation. of variations in these results.
More recent studies have focused less on We decided to include only studies
developing criticism of current reporting MAE to allow for comparison,
methodologies and have instead attempted therefore excluding O’Connor et al (2010)
to take into consideration the issues raised and Livne et al (2011), both of which
by previous authors. As a consequence, report correlations. Finally, we have also
Bermingham & Smeaton (2011) have tried excluded Jungherr et al (2011) as the MAE
to improve the overall accuracy of their reported is unstable.
model by trying different measures of
sentiment and time windows. These 2.2.2 Meta-analysis Process
attempts have allowed the authors to MAE is a measure of dispersion and as
improve their MAE from 5.51% to 3.67%. such does not permit meta-analytical
Similarly, Tjong et al. (2012) attempted to manipulation as would be the case with
incorporate the advice of Metaxas et al. common effect sizes (e.g. mean or
and tried to debias their data by the use of correlation). As a consequence, in order to
polls achieving an MAE of 1.33% and derive an overall value of the effect size
2.00% for volume and sentiment we simply used an average of the MAE’s
respectively. reported. As the field of electoral
predictions with Twitter is still in its early
2.2 Meta-Analysis stages there is no uniform procedure with
regard to the methodology employed.
2.2.1 Effect Size However, studies can generally be
As is apparent by the literature survey, the classified as paying attention to either
most commonly used effect size to volume or sentiment. For this reason we
evaluate the performance of the prediction have decided to conduct a meta-analysis on
is MAE. It measures the extent to which “a the basis of volume and sentiment. We
set of predicted values deviate from the applied the model (simple average) once
actual values.” (Bermingham, 2011:4). It for each prediction method and computed
was first used by Tumasjan et al. (2010), two meta-analytical measures of MAE
setting the standard for all subsequent (table 2.1 and 2.2). However, we would
studies. To have a point of reference, like to note that methodological differences
traditional polls included in the survey between studies force us to also analyse
report MAEs varying from 0.4% to 1.81%. each on a case by case basis in order to
Since they are currently the best prediction deepen our understanding of its results.
tool available to forecast election results
they set the golden standard. 2.2.3 Comparison of prediction methods
The literature survey shows that Twitter As can be seen in tables 2.1 and 2.2, the
prediction models’ MAEs vary meta-analysis yields an MAE of 11.65%
considerably from 1.65% to 17.1%. In for the volume analysis and 9.53% for the
order to assess the current status of the sentiment analysis which suggests that
effect size in the body of literature on the sentiment analysis does not substantially
subject, we have conducted a meta- improve the results. However, we believe
analysis. Through the examination of that individual studies that have used both
6prediction methods provide a better setting al. (2011) and Bermingham et al. (2011).
for comparison. As presented in figure 2.1, These results provide preliminary support
sentiment-based analysis outperforms for our hypothesis.
volume-based analysis for both Metaxas et
Figure 2.1: Mean Absolute Error
*Gayo Avello (2011) analysed different states and therefore is presented as G:State
7Table 2.1: Volume-based Analysis Table 2.2: Sentiment-based Analysis
Author Election MAE Author Election MAE
Tumasjan et al. German federal US 2008 Presidential
1.65% 0.42%
(2010) election, 2009 Election California
US senate elections in US 2008 Presidential
6.30% 14.78%
MA, 2010 Election Florida
US senate elections in US 2008 Presidential
24.60% 14.20%
CO, 2010 Election Indiana
US senate elections in Gayo-Avello US 2008 Presidential
1.90% 18.03%
NV, 2010 (2011) Election Missouri
Metaxas et al. (2011)
US senate elections in US 2008 Presidential
3.80% 16.44%
CA, 2010 Election N. Carolina
US senate elections in US 2008 Presidential
39.60% 7.49%
KY, 2010 Election Ohio
US senate elections in US 2008 Presidential
26.50% 20.34%
DE, 2010 Election Texas
Bermingham et al. Irish General Election, US senate elections in
5.58% 1.20%
(2011) 2011 MA, 2010
Dutch senate US senate elections in
Tjong et al. (2012) 1.33% 12.40%
election, 2011 CO, 2010
Singaporean election, US senate elections in
Skortic et al. (2012) 5.23% 4.70%
2011 NV, 2010
Metaxas et al.
US senate elections in
Overall MAE Result 11.65% (2011) 6.30%
CA, 2010
US senate elections in
1.20%
KY, 2010
US senate elections in
19.80%
DE, 2010
Bermingham et al. Irish General Election,
3.67%
(2011) 2011
Dutch senate
Tjong et al. (2012) 2.00%
election, 2011
Overall MAE Result 9.53%
82.2.4 Systematic Overview of Collection End of
Authors
Period collection
Methodology
O'Connor et al.
In this section, we present other 15 days election day
2010
methodological characteristics that must be Tumasjan et al.
one week
38 days before election
compared on a case by case basis. 2010
day
Jungherr et al. 2 different
Period of data collection 2011 time period
election day
Table 2.3 reveals that the time frame used Gayo-Avello
2 months election day
for analysis varies considerably between 2011
Metaxas et al.
the studies. Both Jungherr et al. (2011) 7 days election day
2011
and Bermingham et al. (2011) have Bermingham &
18 days election day
addressed this issue empirically by Smeaton 2011
calculating the MAE for different time Tjong Kim Sang
7 days election day
frames. Jungherr et al. (2011) & Bos 2012
demonstrated that the model accuracy
Skoric et al. 2012 30 days election day
varies from 1.51% to 3.34%. Similarly,
Table 2.3: Collection period
Bermingham et al. (2011) found
performance to fluctuate between 5.58% Sentiment analysis method
and 9.2%. This implies that the time period Two common approaches for sentiment
used is an important parameter. However, annotation used in the surveyed articles are
in both cases the choice of the time frame machine learning and lexicon based
was not based on well-grounded rules. methods (see appendix A). These
More specifically, the start of the data techniques offer the advantage of rapid
collection had no particular significance in automated analysis of the data collected.
the campaign (e.g. an important debate However, if not carefully chosen to fit the
symbolizing the beginning of the data type (e.g. tweets as opposed to blogs)
campaign). Therefore, no further and the subject domain (e.g. political
conclusions with regard to our own content as opposed to text about movies)
methodology can be drawn. they are likely to produce less accurate
results (Thelwall et al., 2011; Bermingham
Denoising
and Smeaton 2010).
Denoising implies the removal of tweets
O’Connor et al. (2010), Metaxas et al.
that constitute spam, propaganda, rumours
(2011) and Gayo-Avello (2011) used a
or other forms of disinformation. Although
subjectivity lexicon from OpinionFinder,
various authors have stressed the
“a word list containing about 1,600 and
importance of denoising (Metaxas et al.
1,200 words marked as positive and
2011; Gayo-Avello 2012), as of yet, no
negative, respectively” (2010, p.3).
empirical research has found evidence of
Metaxas et al. (2011) manually analyzed a
the impact it has on the accuracy of the
small subset of the data and found that “the
results. Due to the advantage of analysing
accuracy of the sentiment analysis [was]
the data manually we were able to subject
only 36.85%, slightly better than a
our data to the process of denoising in the
classifier randomly assigning the same
course of this study.
three labels.” This is not unexpected as
OpinionFinder was not developed to
analyze to twitter data.
9One would expect that the use of a 3. Hypothesis
customized sentiment analysis would Our study tests the following hypothesis: a
improve the accuracy of predictions. large volume of positive tweets about a
Indeed, by excluding Metaxas et al and candidate is associated with a large number
Gayo-Avello (2011) the Overall MAE of votes.
would be improved from the original MAE First, we believe the population of Twitter
of 9,53% to 2,84%. The results should users and American Idol watchers to
however be considered with caution as the overlap greatly. This overlap can be seen
resulting overall MAE was computed from in American Idol’s decision to include
only two studies. instant polls from audience members
Debiasing tweeting in the live show on screen (Stelter
Twitter’s user base is not representative of 2013). Furthermore, certain songs sung by
the public, as is evident by a survey the contestants were selected from
conducted by Pew internet (2012) submissions made by viewers on Twitter
revealing that “African-Americans, young (Hernandez 2013). In the research
adults, and mobile users stand out for their conducted by Smith and Brenner of the
high rates of Twitter usage”. This is a PewResearchCenter, the authors found that
critical problem since dominating among others African-Americans
demographic groups may skew the results particularly “stand out for their high rates
towards a particular candidate. Debiasing of Twitter usage” (2012). This bias is also
refers to the attempt of limiting or reflected in the population of people
removing any form of demographic bias watching American Idol; as adjusting for
within the data Gayo-Avello (2012). Ethnicity allows one to see that American
Review of the effect size reported Idol’s Wednesday and Thursday shows are
indicates that attempts to debias the data among the third and fourth most popular
improved the accuracy of the prediction. amongst African-Americans (compared to
Specifically, Gayo-Avello (2011) states eight and below ten for the entirety of the
that the attempt to reduce demographic US) (Nielsen 2013). Voting for American
bias by weighing tweets (for which he was Idol is also completely voluntary. The lack
able to obtain the users’ age) according to of moral obligation would suggest that
age participation for the previous 2004 people taking the time to tweet about the
election enabled him to reduce the error show are more likely to also vote for the
from 13.10% to 11.61%. Similarly, Tjong contestants.
et al. (2012) achieved higher accuracy by Second, American Idol allowed us to try
debiasing the data using pre-election and predict several rounds of elimination,
polling data. thereby increasing the reliability of our
methodology.
A comprehensive summary of the results Third, as pointed out by Gayo-Avello
of our meta-analysis can be found in (2012) incumbency rates can play a
Appendix B. significant role in the process of electoral
predictions. By analysing American Idol
we can disregard this factor as all
contestants are new to the show.
10However, there is a drawback with regard of further sentiment analysis renders the
to the effect size. Our hypothesis was model more accurate. As negative and
based on an association between the neutral tweets are less likely to result in
number and nature of tweets (sentiment) voting intention we believed that by
pertaining to a contestant on the one hand classifying tweets according to sentiment
(X) and the number of votes that contestant and only including positive tweets in our
subsequently received (Y). Unfortunately, prediction would improve the model’s
American Idol did not publish the exact accuracy. Furthermore, we also applied
voting results and thus did not provide us data cleansing, purifying and denoising the
with a dependent variable. Instead, we data.
were forced to replicate Ciulla et al.’s
(2012) methodology with regard to results,
comparing our predictions to the semi- 4. Research Methodology
ordinal ranking published by AI (bottom In this section we present the
two, top two). This limitation has made it methodological steps of our study.
impossible for us to compute an effect size,
4.1 Data collection channel
such as a Mean Absolute Error (MAE).
Twitter allows for the import of tweets
Ciulla et al use information gathered from through the platform’s application
Twitter to construct a rather simplistic programming interface. Two channels
model using the ‘tweet volume’ about provide an option to retrieve messages on a
contestants in ‘American Idol’ to rank larger scale, ‘Search API’ and ‘Streaming
them according to popularity. This model API’. Search API enables the collection of
was then used in order to predict the tweets matching a specific query from
contestants’ eliminations. Twitter's global stream of tweets published
Focusing on the top 10 rounds in the during the previous 6-9 days by submitting
American Idol show, the authors first HTTP requests to Twitter’s server.
performed post-event analysis, using the However, Twitter limits the number of
volume of tweets referring to each of the requests that can be sent per hour by a
contestants to rank them in descending unique user. We have chosen to use the
order (ordinal data), the last contestant Twitter streaming API which enables a
being most likely to be eliminated near real-time data import of filtered
according to the model. They then used tweets by establishing a continuous
their model to predict the winner before the connection to Twitter’s servers. While it
result was announced. yields higher volumes of data, it still
As a result of the research conducted by captures only about 1% of the entire traffic
Ciulla et al. we constructed and tested two (higher access level requires a commercial
models: partnership with Twitter).
The first one is a replication of the model, As the sampling procedure is controlled by
as devised by Ciulla et al. (2012), using Twitter, there is no way to assess sampling
only the volume of tweets about each bias. However there is some evidence that
candidate. streaming API provides better sampling.
The second is an attempt to improve upon More specifically, González-Bailón (2012)
the model already provided by Ciulla et al. compared the differences between samples
in order to determine whether the inclusion returned from Search and Streaming API
11and found that the former “over-represents depends on the context (political election
the more central users and does not offer vs. singing competition) and type of
an accurate picture of peripheral activity” medium used (social media website vs.
(p.1). printed newspaper). We wanted to test the
performance of an automated sentiment
4.2 Data collection period analysis tool and the extent to which its use
Our original plan was to follow Ciulla et affects the accuracy of the predictions. To
al.’s methodology, according to which only this end, we relied on Umigon, a lexicon
tweets generated during the allowed voting based sentiment analyzer developed
window in the show, will be considered specifically for Twitter by Levallois
(from 8PM until 3AM EST). However,
Peak at 8 PM (the show starts)
Voting window
allowed by the
show
Figure 4.1: Tweet volume per hour (2012), which classifies tweets as positive,
negative or neutral.
after a closer examination of the First, we manually annotated 3000 tweets
preliminary data it appears that about an (each tweet was labeled by two
hour before the start of the show (7 PM annotators), then we measured the inter-
EST), the volume of tweets increased annotators agreement using the S statistic
considerably, reaching a peak when the (Bennett et al., 1954)
show airs at 8 PM EST (figure 4.1). During An inter-annotator agreement score of 0.89
the voting window the number of tweets was achieved, signaling ‘almost perfect
gradually declined, with a slight increase agreement’ (see Appendix D for
after the window had closed. calculations and confusion matrix).
As a result of these findings we have Afterwards, we compared our manual
decided to expand the time period for data sentiment analysis with the results obtained
analysis from 7PM until 3AM EST. from Umigon’s (table 4.1)
4.3 Data Processing and Tweet Umigon
Negative Neutral Positive Total
Classification
Negative 40 27 7 74
4.3.1 Data processing: Manual vs. Man Neutral 54 229 114 397
Automatic ual Positive 207 695 960 1862
As was concluded in the literature survey, Total 301 951 1081 2333
it appears that automatic tools’ precision Table 4.1 : Confusion matrix
12would be a much better place if Lazaro
The performance of Umigon was evaluated Arbos wasn't singing on national television
along 3 widely accepted indicators adopted once a week” would thus receive a rating
from Sokolova et al. (2009): accuracy, of ‘1’.
precision and recall (see Appendix E)
Umigon appears to be relatively efficient at Category 2 – Neutral Sentiment: A score
rating positive tweets (precision of 89% of ‘2’ is given to all tweets whose
and a recall of 79%), however the sentiment can neither be classified as
precision and recall regarding negative positive nor negative (nor does the tweet
tweets suggests that it is not reliable (13% have to removed - 4,5,6). Consequently, “I
and 33% respectively). Initial analysis of sware that Angie Miller and Miley Cyrus
our first data set shows that about 80% of are the same person” would receive a score
tweets are positive (see Appendix F). of ‘2’.
Furthermore it would appear that for
certain contestant a large proportion of Category 3 – Positive Sentiment: Tweets
their total tweets are negative in nature. As are classified as belonging to category 3
a consequence, correctly classifying these when the underlying sentiment of the tweet
tweets is of great importance to the is positive. This can take on the form of “If
accuracy of our predictions. Therefore, we Candice Glover doesn't win American
decided not to make use of Umigon. Since Idol... I quit and am moving to North
the development of a sentiment analysis Korea”, as well as “Angie Miller is hot”.
tool customized for our purposes is outside
the scope of this thesis, we opted for Category 4 – Spam, Propaganda, or
manual annotation (thereby ensuring Advertising (Denoising): This category is
optimal classification of the data.) made up of any tweet that seems to have
been published for commercial purposes.
4.3.2 Tweet Classification Examples include tweets such as:
After tweets had been arranged according “American Idol: Did Candice Glover Have
to the contestant to whom they referred (by the Best Performance in Show History?:
means of a formula in Excel), they were The singer's version of "Loveson...
then subjected to manual analysis. In the http://t.co/uDNrgxsjrS”, or “Candice
context of the manual sentiment analysis Glover's rendition of "Love Song" is on
and data cleansing process tweets could be iTunes now http://t.co/NCrFYkJzgg”.
classified as belonging to one of six Retweets of spam are not considered as
categories. Categories one to three spam since they show an intention of
represented varying degrees of sentiment sharing information about a candidate
strength. While categories four through six (either positive, negative or neutral).
consisted of different forms of tweets that
had been removed in an attempt to denoise Category 5 – Foreign Languages and
the data and to ensure its purity. Tweets from Outside the US (Purity): This
category amasses all the tweets written in
Category 1 – Negative Sentiment: This languages other than English. In order to
first category contains all the negative- partially ensure the purity of our data we
sentiment tweets pertaining to a particular tried to use only tweets from eligible and
contestant. Tweets such as: “The world prospective voters through the elimination
13of these tweets.The underlying assumption
being that a tweet in another language is
less likely to have been written by
someone within the United States. Manual
4.4.2 Sentiment Model
inspection of the data allows us to further The studies in the subject domain of
broaden this category by including tweets elections have incorporated sentiment into
in English from people who are clearly not their prediction models in different ways –
prospective voters. Although “Wish I lived employing diverse ratios to represent the
in America to vote for Candice Glover. sentiment distribution of the tweets (see
Exception performance #idolTop6” would Appendix C). Bermingham et al. (2011)
normally be given a high sentiment score. distinguished between two types of
However, the content of the tweet makes it sentiment measures: intra-party and inter-
possible for us to place it within category party measures which we will refer to as
5. Another example would be: intra-candidate and inter-candidate. Intra-
“@AngieAI12 You know, I'm from the candidate measures consider a candidate in
Philippines and I'm telling everyone that isolation, computing a value representing
Angie Miller's gonna win! Go for it!” how positive or negative the collected
tweets are for a given candidate (i.e. the
Category 6 – Rubbish & Collection ratio of positive counts over negative
Errors: This last category is a means of counts mentioning the candidate). In order
classifying all the defective tweets that fall to make prior event predictions with intra-
within neither of the two previous candidate measures it is necessary to first
categories. All three categories together have few instances of the dependent
thus contain the data that needs to be variable (election results) to allow for the
removed before conducting the analysis. computation of the coefficients of the
For the most part tweets in the sixth regression analysis. However as each
category are the result of an error that election is different it is not possible to use
occurred when transferring data from the this method for prior event prediction.
streaming API to Excel (e.g. Tweets that Consequently, studies that had
lack the candidate’s name). incorporated such measures into their
4.4 Data Analysis models relied on regression analysis to
make post event predictions of elections
4.4.1 Volume Model results. Inter-candidate measures, on the
Models predicting share of votes with other hand, reflect the relative share of
tweet volume are based on the assumption positive and negative tweets between the
that the number of votes contestants parties. If we assume that a positive
receive is proportional to the attention they sentiment indicates an intention to vote for
receive on Twitter. Thus by aggregating a given candidate, the inter-candidate
the number of tweets referring to each measure of relative share of positive tweets
candidate, it is possible to calculate their may be used to predict the percentage of
share of votes according to Twitter. More votes a candidate will receive before
specifically we will employ the following publication of the results. Since the aim of
formula: our study is to predict the elimination of
14candidates, this measure seems most Figure 4.2 provides a graphic depiction of
appropriate. More specifically, the research methodology employed.
Figure 4.2: Methodology Illustration
155. Results
Table 5.1 Ciulla et al. (2012) American Idol 2012 - Results: Top 7 to Top 2
Table 5.1 presents the findings of
Ciulla et al. (2012) for American Idol
2012 for rounds ‘Top 7’ to ‘Top 2’.
Column 3 of the table indicates whether
or not the authors were able to predict
the eliminated contestant (‘check’:
successful prediction; ‘x’: predicted the
wrong contestant; and ‘CC’: Too close
to call- due to overlapping confidence
intervals). In the last column Ciulla et
al. present the number of contestants
they were able to successfully predict
Table 5.2 American Idol 2013 - Results: Top 6 to Top 2 (Vol)
as belonging to the bottom 3. We have
summarized the results of our research
(American Idol 2013) in a similar table
for comparative purposes. As a
consequence, Table 5.2 shows the
results of applying a volume-based
analysis to the collection of tweets
(after removing categories 4,5,6). Table
5.3 shows the results of further
classifying the volume according to
sentiment and eliminating ‘neutrals’
and ‘negatives’.
For the final dataset and classification
*Votes from April 25 and May 2 were combined for this elimination
for each week please refer to Appendix
Table 5.3 American Idol 2013 - Results: Top 6 to Top 2 (Sent)
G and H.
*Votes from April 25 and May 2 were combined for this elimination
16By comparing the results of volume and Second, we would like to stress the
sentiment analysis (table 5.2 and 5.3) it can importance of how one presents the data. If
be seen that sentiment allows us to more we take for instance the week of May 9.
accurately predict eliminations and Bottom An analysis of table 5.2 would show that
2 contestants. For instance, in the week of we were unable to predict this particular
April 11 classification of tweets according elimination. This way of presenting the
to sentiment reduced Lazaro’s share of results does not, however, convey the
tweets from 5.8% to 3.4%. This is due to extent to which our prediction was
the fact that 24% of total tweet volume inaccurate. Even after classifying the
concerning Lazaro in the week of April 11 tweets according to sentiment Angie (who
was of a negative nature. Although this was eliminated) still had 38.2% of positive
presentation suggests that sentiment tweets, compared to Kree’s 9.9%.
analysis allows making more accurate Third, it would appear as if certain
predictions it should be noted that the contestants were underrepresented on
results obtained for both methodologies are Twitter. Kree, for instance was constantly
not very accurate when compared to the predicted as belonging to the bottom half
results of Ciulla et al. (2012). of the contestants. Only for the two rounds
in which she did end up in the Bottom 2
(April 18 and May 16) were our
5.1 And the Winner is… predictions with regard to Kree correct.
The three times in which Kree was in the
In their paper Ciulla et al. (2012) present a
Top 2 our model was either unable to
section entitled “And the Winner is…”, in
predict her ranking (CC) or placed her in
which they show how adjusting for geo-
the Bottom 2 as being eliminated. This
location allowed them to successfully
misrepresentation may have to do with her
predict the winner of American Idol.
particular profile, as she comes from
Although, Graph 5.1 shows our “accurate”
Woodville, Texas and sings mostly country
prediction of the final round (Candice won
music. Indeed, Texas’ twitter usage is
American Idol), the fact that the show did
among the lowest in the United States
not announce the share of votes leaves us
(Miller, 2011).
unable to see to what extent our predictions
were accurate. As a consequence, instead
of presenting and focusing on the instances
in which we were able to successfully Kree
predict the outcomes of American Idol, we
would like to adopt a different tone.
First, by looking at table 5.2 and Appendix
H one can see that we attempted to predict
a total of five rounds of eliminations. Of Candice
those five rounds, our data would have
incorrectly predicted the elimination of a
contestant on one occasion; twice, the
0,0% 20,0% 40,0% 60,0% 80,0% 100,0%
results were ‘too close to call’, and only
%Tweets
two times were we able to correctly predict
an elimination. Graph 5.1: Relative Percentage of Tweets: Final (May 16,
2013)
17that their answers may be subject to self-
Last, we have discovered that certain selection bias.
contestants are overrepresented in the
dataset. For each of the weeks of April 11 5.3 Limitations
to May 9, together, Candice and Angie 5.3.1 Tweets from users outside of the
have accumulated between 78.5% and US
91.1% of the total positive tweet volume. Although we have tried to eliminate tweets
With only 21.5% to 8.9% of positive that clearly showed that the user is outside
tweets divided between the other of the US (either by content or language –
contestants and confidence intervals of 5%, categories 5), the possibility remains that
successfully predicting eliminations is thus many of the tweets about contestants of
very difficult. American Idol may still be from people
5.2 The underlying assumption about unable to vote and influence the outcome
of American Idol. Geo-location, as utilized
voting intention
by Ciulla et al. (2012), represents a
Research in the field of electoral
possible way of solving this problem. To
predictions with Twitter is based on the
this end, we collected 1,500 tweets through
assumption that the number or sentiment of
Twitter’s GetSample function (returns a
tweets correlates with people’s actual
small sample of all public tweets) and
voting behavior. Sentiment-research in
found that only 16 users had included their
particular assumes that a tweet such as “I
location within their profile. These results
love Barack Obama” would be associated
are supported by the research conducted by
with that person voting for Obama. In
Syosomos Inc (2010) who found that on
order to test this assumption we have
average only 0.23% of all tweets are
isolated over 2500 usernames of people
tagged with a geo-location. As a
tweeting about a contestant of American
consequence, research hoping to make use
Idol. We then proceeded to sending tweets
of geo-location would in all likelihood
through multiple accounts asking these
have to rely on commercial software
users which contestant they actually voted
(Syosomos Inc., 2010).
for. Even though we only received 134
answers, the results looked promising, as 5.3.2 Measurements of Performance
112 users actually voted for the person As a result of the relative share of votes not
they were supporting in their tweets being announced, we were unable to
(positive sentiment). Out of the remaining calculate to what extent our model’s
users, 2 tweeted a compliment to a predictions deviated from the actual rates.
contestant (e.g. “Kree Harrison has The consequences of this characteristic
amazing vocals”) but voted for another one were twofold. On the one hand it did not
and 20 did not actually vote. Although allow us to compute an effect size that
generally this attempt at empirically would be comparable to that of previous
proving this assumption has proven studies conducted in this field. On the
successful, the results should still be other, it has complicated our attempt at
considered with caution. Of the 2500 users improving the methodology of Ciulla et al.
only 134 answered, suggesting that those Although there was some evidence of
answering were the most active fans and negative sentiment in tweets being
inversely related to the relative share of
18votes, the lack of a dependent variable may be partly explained by the psychology
prevented us from empirically testing this of sharing positive image among followers
hypothesis without resorting to a recipe- (Wong et al., 2012), but more likely due to
like model. the nature of the show. Namely, the
onscreen conflict level between American
5.3.3 Decreasing Viewership Idol’s contestants is rather low; they
A possible explanation for the difference in appear like a unified group, supporting
accuracy with regard to the predictions each other before eliminations and posting
made by Ciulla et al. (2012), could be a pictures together on Facebook and Twitter.
39% decline in viewership in the age group It is possible that the effect of sentiment
18-49. This decline, attributable to the analysis is stronger in political contexts,
success of the new TV show ‘The Voice’ where the conflict level is high and each
may be responsible for a demographic shift candidate represents an ideology that is
(City Press, 2013). often time at odds with that of the other
5.3.4 Twitter as a social phenomenon candidate. As a result, Twitter users
An increasing number of research papers identifying with a particular stand are more
have described the predictive power of likely to overtly support their candidate
data extracted from Twitter. It is unclear to and object to the opposing view.
what extent this information has impacted
5.4 Conclusion
the way in which users and companies use
In this study we have extracted data from
this social media platform. Particularly, the
Twitter on the subject of American Idol in
paper by Ciulla et al. (2012), has
order to predict the show’s eliminations
captivated a considerable amount of media
and contestants’ rankings. We employed
attention. For the first time in eleven years,
two prediction methods: The first one was
this season of American Idol every
based on the work of Ciulla et al. (2012)
contestant on the show had an official
who attempted to predict the eliminations
Twitter page (Oblivious A.T., 2013). It is
of contestants from American Idol 2012,
possible that this is a result of this media
by counting the number of tweets
attention and an increasing number of
mentioning a contestant (Volume). The
blogs claiming that the mere number of
second method aimed to improve the
Twitter followers can predict the winner.
accuracy of the model by analyzing the
This may very well constitute such a
sentiment of the tweets. The assumption
change of behavior, and may thus be partly
underlying this second method was that
responsible for the overall low predictive
positive tweets are more closely associated
power of our model when compared to the
with voting intention.
results obtained by Ciulla et al. (2012).
We have found that a classification of the
5.3.5 Positive Sentiment Bias tweets according to sentiment, allows for
The high level of positive sentiment we more accurate predictions with regard to
found was striking, representing over 80% the subsequent ranking of a contestant.
of the tweets in our dataset (Appendix F). These findings are in line with the
As a result, the impact of the negative conclusions we have drawn from our
tweets on the results is greatly diminished, Meta-analysis, in which we showed that
possibly reducing the effect of sentiment studies using sentiment, rather than volume
on the prediction. This large positive bias were able to reduce their MAE.
19Although we found evidence in support of issue. They investigate the correlation
our hypothesis that the inclusion of between the share of Republican candidate
sentiment would improve the model’s name mentions and the corresponding vote
accuracy, we would nonetheless like to margin controlling, among other factors,
stress that the overall predictive power of for demographic variables (race, gender,
our model was low. We believe this to be a and age). While the authors report an
consequence of a lack of adjusted R-squared of 87%, they fail to
representativeness in the Twitter user base. explain how the demographic data about
As this is a problem that other researchers Twitter users was obtained (a critical issue
in this field have also encountered (Avello, as these details are not publicly disclosed),
2012), we would suggest that future and how the data can be adjusted ex-ante.
research be centered around more
fundamental issues with regard to using 3) In this study we have attempted to
Twitter to make predictions: question and test the underlying
assumption that a positive tweet about a
1) Although research has been conducted contestant/candidate will result in a vote.
to compare the samples generated by Due to a low response rate only limited
Streaming – and Search API (Gonzales- conclusions can be drawn from this
Bailon et al., 2012), no study has examined attempt. As a consequence, we encourage
the representativeness of either of these further research examining this assumption
methods compared to the entirety of the upon which much of today’s research is
Twitter data. Researchers tend to regard based.
these methods as ‘black boxes’, assuming
that their sample is representative of the 4) In order to ensure optimal sentiment-
entire Twitter population. classification we have analyzed the dataset
manually. This has allowed us to pre-
2) An increasing amount of evidence has process the data with regard to spam. As
pointed to the demographic bias present demonstrated in our literature review this
within the Twitter user base pre-processing positively impacts a
(PewResearchCenter, 2012; 2013). model’s accuracy. As a consequence, we
Although we believed the demographics of believe the programming of software that
the Twitter users on the one hand and reliably recognizes spam, propaganda, and
viewers of American Idol on the other to misrepresentation to be essential to the
correlate more strongly than the population development of this field. Similar
of an average election, this study has functions can already be found over the
shown that certain contestants are grossly web. For example, StatusPeople.com allows
under- and over-represented. Unable to its users to perform a "Fake Follower Check"
predict the eliminations of American Idol analysis of Twitter accounts. The
we believe political elections to constitute incorporation of similar applications in the
an even more difficult domain. As a domain of election can prove very useful.
consequence, correcting for demographic
Finally, we believe that the use of more
bias should be the main focus of attention
advanced algorithms and new software
for any paper trying to make predictions
innovations may be the key to more
with Twitter. In a recent study DiGrazia et
effective data analysis. For example,
al. (2013) make an attempt to address this
cross referencing users’ profiles with other
20You can also read