Multimodal Image Analysis of Apparent Brain Age Identifies Physical Fitness as Predictor of Brain Maintenance
←
→
Page content transcription
If your browser does not render page correctly, please read the page content below
Cerebral Cortex, July 2021;31: 3393–3407

                                                                             doi: 10.1093/cercor/bhab019
                                                                             Advance Access Publication Date: 5 March 2021
                                                                             Original Article

ORIGINAL ARTICLE

Multimodal Image Analysis of Apparent Brain

                                                                                                                                                         Downloaded from https://academic.oup.com/cercor/article/31/7/3393/6159016 by guest on 11 September 2021
Age Identifies Physical Fitness as Predictor
of Brain Maintenance
Tora Dunås 1,2 , Anders Wåhlin1,3 , Lars Nyberg1,3,4 and
Carl-Johan Boraxbekk1,3,5,6
1 Umeå Center for Functional Brain Imaging (UFBI), Umeå University, S-901 87 Umeå, Sweden, 2 Centre for
Demographic and Ageing Research (CEDAR), Umeå University, S-901 87 Umeå, Sweden, 3 Department of
Radiation Sciences, Umeå University, S-901 87 Umeå, Sweden, 4 Department of Integrative Medical Biology,
Umeå University, S-901 87 Umeå, Sweden, 5 Danish Research Centre for Magnetic Resonance (DRCMR), Centre
for Functional and Diagnostic Imaging and Research, Copenhagen University Hospital Hvidovre, DK-2650
Hvidovre, Denmark and 6 Institute of Sports Medicine Copenhagen (ISMC), Copenhagen University Hospital
Bispebjerg, DK-2400 Copenhagen, Denmark

Address correspondence to Centre for Demographic and Ageing Research, Umeå University, Umeå S-901 87, Sweden. Email: tora.dunas@umu.se.

Abstract
Maintaining a youthful brain structure and function throughout life may be the single most important determinant of
successful cognitive aging. In this study, we addressed heterogeneity in brain aging by making image-based brain age
predictions and relating the brain age prediction gap (BAPG) to cognitive change in aging. Structural, functional, and
diffusion MRI scans from 351 participants were used to train and evaluate 5 single-modal and 4 multimodal prediction
models, based on 7 regression methods. The models were compared on mean absolute error and whether they were related
to physical fitness and cognitive ability, measured both currently and longitudinally, as well as study attrition and years of
education. Multimodal prediction models performed at a similar level as single-modal models, and the choice of regression
method did not significantly affect the results. Correlation with the BAPG was found for current physical fitness, current
cognitive ability, and study attrition. Correlations were also found for retrospective physical fitness, measured 10 years prior
to imaging, and slope for cognitive ability during a period of 15 years. The results suggest that maintaining a high physical
fitness throughout life contributes to brain maintenance and preserved cognitive ability.

Key words: age predictions, brain aging, cognition, multimodal MRI, physical fitness

Introduction                                                                 et al. 2016). There is, however, considerable individual variabil-
As we age, our brains are subject to both functional and struc-              ity, with some individuals appearing to maintain a youth-like
tural degeneration, such as cortical thinning (Salat et al. 2004),           brain along with preserved cognition, that is, brain maintenance
increased white matter atrophy and lesions (Vernooij et al.                  (Nyberg et al. 2012), while other individuals fall outside the
2008), decreased functional connectivity (Salami et al. 2014), and           normal range of typical age-related changes, with elevated risk
increased dedifferentiation among functional regions (Ferreira               for developing dementia.

© The Author(s) 2021. Published by Oxford University Press. All rights reserved. For permissions, please e-mail: journals.permission@oup.com
This is an Open Access article distributed under the terms of the Creative Commons Attribution Non-Commercial License (http://creativecommons.org/
licenses/by-nc/4.0/), which permits non-commercial re-use, distribution, and reproduction in any medium, provided the original work is properly cited.
For commercial re-use, please contact journals.permissions@oup.com
3394 Cerebral Cortex, 2021, Vol. 31, No. 7
Brain age predictions use image-based machine learning predictions, using ordinary least square (OLS) regression as the
methods to identify patterns that differentiate older appearing reference.
brains from younger appearing ones (Franke et al. 2010; Cole, The third, main goal of this study was to investigate how
Poudel, et al. 2017a). Brain changes can impact distinct path- brain age predictions are related to variables that in past studies
ways, differently affecting a number of regions and functions have been linked to neurocognitive aging. Since aging can be
(Eavani et al. 2019; Smith et al. 2019). In general, older appearing defined as the gradual accumulation of cell damage or other
brains can be characterized by global and regional gray matter structural changes (Harman 2001; López-Otín et al. 2013), it
(GM) and white matter (WM) loss, as well as altered functional should be advantageous to employ a longitudinal perspective in
connectivity. For example, strong associations have been found brain age prediction. In the present study, we utilized individual
between the calculated brain age prediction gap (BAPG) and data collected over more than a decade to define the BAPG
white matter microstructure in the fornix and anterior tha- and assess relations to other variables both cross-sectionally
lamic radiation (Smith et al. 2019). By calculating the differ- and longitudinally. Given that brain maintenance was intro-
ence between predicted age and chronological age for a given duced to account for relative well-preserved cognition in aging
Downloaded from https://academic.oup.com/cercor/article/31/7/3393/6159016 by guest on 11 September 2021
individual, predictions can be made about their general brain (Nyberg et al. 2012; Nyberg and Pudas 2019), we related the
health, which in turn could serve as a brain-based personalized BAPG to cognitive ability over time and predicted that indi-
biomarker to detect individuals at risk for future disease. A viduals with a predicted age younger than chronological age
predicted age higher than the chronological age has, for exam- would have more intact cognition. We further examined the
ple, been related to cognitive decline and Alzheimer’s dementia association between predicted brain age and longitudinal study
(Franke and Gaser 2012; Gaser et al. 2013; Liem et al. 2017; dropout (attrition), since attrition has previously been linked to
Pendlebury and Rothwell 2019), and here we expected that a worse outcomes in aging (Caracciolo et al. 2008; Salthouse 2019).
predicted younger age would reflect brain maintenance. Additionally, we examined whether the BAPG was associated
Traditionally, most brain age prediction models are based on with level of education, which previously has been proposed
structural magnetic resonance images (MRI) (Franke et al. 2010; (Steffener et al. 2016) but not conclusively demonstrated. Based
Cole, Ritchie, et al. 2017b; Gutierrez Becker et al. 2018). However, on recent analyses of the role of education in cognitive aging
studies using other modalities, including diffusion tensor imag- (Lövdén et al. 2020), we predicted relations for cross-sectional
ing (DTI) (Richard et al. 2018), functional magnetic resonance but not longitudinal estimates of the BAPG. Finally, we related
imaging (fMRI) (Dosenbach et al. 2010), or combinations thereof BAPG to level of physical fitness. Physical fitness has been
(Liem et al. 2017; Cole 2020; de Lange et al. 2020), have also been linked to both structural and functional changes in the brain.
presented. In theory, different image modalities should provide For example, higher levels of physical fitness, measured in terms
unique information to the brain prediction model. Hence, a mul- of cardiorespiratory fitness, BMI, and blood pressure, have been
timodal approach could not only improve age predictions but associated with greater functional connectivity in age-sensitive
also result in a model that captures a wider range of pathologies networks, primarily the default mode network (Boraxbekk et al.
with stronger associations to various physiological factors. Thus, 2016; Voss et al. 2016), as well as higher perfusion and GM
by identifying several different “brain ages,” reflecting different volume in associated regions (Boraxbekk et al. 2016). There are
aspects of the aging process (Cole 2020; de Lange et al. 2020), also suggestions about a relationship between physical activity
we could get a deeper understanding of the connection between and changes in WM structure (Sexton et al. 2016). When linking
brain aging and neurological diseases, and thereby improve the the number of daily flights of stairs climbed with predicted brain
selection of which modalities to include depending on specific age from imaging data, it was shown that for each additional
research questions. However, more studies are needed on the flight of stairs climbed per day the predicted brain age decreased
importance of combining data from several modalities into a with 0.58 years (Steffener et al. 2016). We predicted that a high
multimodal model, and how the choice of input data influ- level of physical fitness throughout life would relate to a younger
ences the association with other variables and their change over brain age.
time (see below). The first goal of this study was to compare
5 single-modal and 4 multimodal prediction models, and we
hypothesized that by combining several image modalities the Materials and Methods
associations would be strengthened.
Participants
In addition to the choice of input data, the biggest difference
between prediction methods is the choice of machine learning All included subjects were part of the Betula prospective cohort
method. The level of complexity can vary markedly, from basic study on memory, health, and aging (Nilsson et al. 1997; Nyberg
regression to more advanced methods including regularizing et al. 2020). The Betula study started in 1988, with data collection
terms that improve stability (Baldassarre et al. 2017), kernel every 5 years. Subjects with no history of severe neurological
methods where variable transformations are performed, prob- illness or events that might cause dementia were recruited
abilistic methods where hyperparameters are estimated from at random from the population in Umeå, Sweden. Informed
the data, or deep learning methods such as convolutional neu- consent, in accordance with guidelines of the Swedish Council
ral networks (Cole, Poudel, et al. 2017a). Some prior studies for Research in the Humanities and Social Sciences, was signed
compared different methods (Franke et al. 2010; Baldassarre by all participants. At the first measurement wave (T1), 1000 par-
et al. 2017; Cole, Poudel, et al. 2017a; Zhai and Li 2019; Jiang ticipants (S1) were recruited, 100 for each of 10 age groups where
et al. 2020), but the number of included methods is generally subjects were 35, 40, 45 . . . 80 years at inclusion. At the second
small and conclusive evidence is lacking. The second goal of measurement wave (T2), an additional longitudinal sample of
this study was, therefore, to investigate whether the choice of 963 participants (S3), spanning the same age groups (age 40–85
prediction method has a significant impact on the resulting at this point), was recruited. For more detailed information on
prediction. This was accomplished by comparing some of the subject inclusion in the Betula study, see (Nilsson et al. 1997;
most frequently used machine learning methods for brain age Nyberg et al. 2020).Physical Fitness as a Predictor for Brain Maintenance Dunås et al. 3395
Table 1 Average values for demographic, biomedical, and cognitive data at each measurement wave
T3 (1998–2000) T4 (2003–2005) T5 (2008–2010) T6 (2013–2014)
Number of subjects
S1 131 130 131 104
S3 140 139 140 106
S6 – – 80 62
Total 271 269 351 272
Background information, mean (SD)
Education, years 12.3 (4.2) 12.3 (4.2) 12.7 (4.1) 12.9 (4.2)
Age, yearsa 56 (8) 62 (8) 63 (13) 65 (13)
No. women/men 144/127 143/126 182/169 137/134
Biomedical data, mean (SD)
BMI (kg/m2 ) 26.1 (3.7) 26.4 (3.6) 26.4 (3.8) 26.5 (3.7)
Downloaded from https://academic.oup.com/cercor/article/31/7/3393/6159016 by guest on 11 September 2021
Waist circumference (cm) 89.5 (10.3) 91.4 (9.9) 92.1 (11.3) 93.2 (10.9)
Diastolic blood pressure (mmHg) 82.5 (9.7) 83.5 (8.7) 80.8 (9.2) 80.6 (8.7)
Systolic blood pressure (mmHg) 138.0 (19.3) 139.6 (18.5) 138.2 (18.8) 138.9 (16.3)
Grip strength right (kg) – 38.1 (12.8) 35.7 (12.4) 36.2 (13.0)
Grip strength left (kg) – 42.5 (6.2) 31.5 (10.8) 35.8 (13.7)
Pulse (bpm) 63.5 (8.6) 62.0 (9.2) 61.2 (9.0) 61.3 (8.4)
Cognitive performance, mean (SD)
Free recall 10.1 (2.5) 10.0 (2.36) 9.6 (2.6) 9.3 (3.1)
Fluency A 13.1 (4.2) 13.8 (4.7) 12.3 (4.4) 12.8 (4.8)
Letter Digit 31.7 (6.4) 31.3 (6.3) 30.2 (7.7) 29.1 (8.0)
Block design 31.1 (9.4) 30.2 (8.8) 29.5 (9.7) 28.6 (9.9)
Note: Brain age predictions were calculated from image data at the T5 and T6 wave. S1, S3, and S6 are different study samples, recruited at T1 (1988–1991), T2
(1993–1995), and T5 (2008–2010), respectively.
a For T3 and T4, mean and SD are calculated based on the stratified ages, while for T5 and T6, age at time of imaging is used.
At each time point, health assessment, memory tests, and plane resolution, 2.6 × 2.6 mm). Time series data were acquired
questionnaires on socioeconomic factors and critical life events over 5 min and 40 s, and participants were instructed to keep
were performed (Nilsson et al. 1997). At the fifth and sixth their eyes open during the scan and look at a presented fixation
measurement waves (T5 and T6), a subsample of individuals cross. All analyses in this study were carried out on a global brain
from the original study samples (S1 and S3), as well as an level and no regional comparisons were done, neither within
additional sample (S6), underwent structural and functional images nor between modalities.
MRI. Detailed information of this cohort can be found elsewhere Each image modality was preprocessed separately (i.e.,
(Pudas et al. 2013). In the present study, data from T3-T6 are images were not normalized and scaled in the same way).
included, spanning from approximately 10 years prior to base- Structural images were preprocessed using Statistical Paramet-
line brain imaging to approximately 5 years after. See Table 1 ric Mapping software (SPM12) (www.fil.ion.ucl.ac.uk/spm). T1
for details of the included cognitive and biomedical data. In images were segmented into GM, WM, and cerebrospinal fluid
the current study, subjects (N = 351, 182 women) with structural (CSF) using SPM12’s segment, resulting in probability maps for
T1-weighted images, DTI, and resting-state functional magnetic each tissue type, describing the probability that each tissue is
resonance images (rs-fMRI) data, acquired at the T5 wave, were found at a specific location in the brain (Ashburner and Friston
included, and follow-up images (T6) were available for 214 of 2005). These probability maps were then normalized to Montreal
these subjects (117 women). The age range was from 25 to Neurological Institute (MNI) space (Evans et al. 2012) using
83 years (63 ± 13 years) at the time of baseline MR scanning, and the nonlinear DARTEL method (Ashburner 2007). In DARTEL,
29 to 85 years (65 ± 13 years) at follow-up scanning. the tissue probability maps were used to produce a study-
specific template and subject-specific flow fields allowing
normalization of images of interest. An affine transformation of
Imaging Data the population average template to MNI space was used to bring
MR images were collected on a 3T scanner (GE Discovery MR 750, normalized images into MNI space. For anatomical data, we
Milwaukee, WI, USA) with a 32-channel head coil. T1-weighted utilized the option of preserving the amount of signal from each
structural images were collected with a 3D fast spoiled gra- region. To reduce the amount of data, the probability maps were
dient echo sequence (180 slices; thickness, 1 mm; repetition down sampled to isotropic 3 mm resolution and masked using
time (TR), 8.2 ms; echo time (TE), 3.2 ms; flip angle, 12◦ ; field the standard MNI brain mask from SPM to remove nonbrain
of view, 25 × 25 cm). DTI was collected with a single-shot T2- voxels. The DTI data were processed using the University of
weighted spin-echo planar sequence (64 slices; spatial resolu- Oxford’s Center for Functional Magnetic Resonance Imaging
tion, 0.98 × 0.98 × 2 mm; TR, 8000 ms; TE, 84.4 ms; flip angle, of the Brain (FMRIB) Software Library (FSL) package (http://
90◦ ; field of view, 25 × 25 cm; b = 1000 s/mm2 ; 32 directions; 6 www.fmrib.ox.ac.uk/fsl). Images were eddy current corrected
B0 images). Rs-fMRI was acquired with a gradient echo planar and skull stripped, and fractional anisotropy (FA) images were
imaging sequence (37 slices; thickness, 3.4 mm; gap, 0.5 mm; TR, calculated with DTIFIT. FA images were nonlinearly registered to
2000 ms; TE, 30 ms; flip angle, 80◦ ; field of view, 25 × 25 cm; in the FMRIB58_FA standard space image with an isotropic 1 mm3396 Cerebral Cortex, 2021, Vol. 31, No. 7
resolution, and values were projected onto the corresponding 344 970 for the structural images and 539 483 for all images
FA skeleton, through the tract-based spatial statistics (TBSS) combined. For the RF model, which was based on predictions
pipeline, creating a denser version of the FA image, with obtained in the previous step rather than raw data, input vectors
improved alignment between subjects. Functional images were were of the length of 3 and 5, respectively.
also processed in SPM, the data were slice-time corrected To obtain age predictions for all subjects, 10-fold cross-
and corrected for head movement with realign & unwarp, validation was used. The subjects were divided into 10-folds,
normalized to MNI space using DARTEL as previously described, the regression methods were trained on data from 9-folds,
smoothed using an 8-mm full-width half-maximum Gaussian and the trained method was used to obtain predictions for the
filter, and adjusted for B0 inhomogeneity. The data were also subjects in the last fold. This process was repeated for each fold,
high-pass filtered with a cutoff of 130 s, using SPM’s filtering to obtain predictions for all subjects. The regression methods
function. For each subject, a connectivity matrix describing were trained on T5 data, and predictions were made for both T5
temporal correlation between cortical regions was calculated and T6, simultaneously. To reduce the impact of group selection,
from the rs-fMRI data, using an in-house developed software this process was repeated 50 times, and the average prediction
Downloaded from https://academic.oup.com/cercor/article/31/7/3393/6159016 by guest on 11 September 2021
(DataZ) operating with SPM subroutines. Additional motion value from all repetitions was used in the analysis. The same
correction (the Friston 24 parameter model Friston et al. 1996, methodology was used for both the single-modal models and
which contains 6 motions estimates from the current and the models based on concatenated data, but in the latter case,
preceding volume, plus their squared versions) was used in the feature vectors were concatenated to form longer vectors
this process. The seed regions for the connectivity matrix was before entering the prediction scheme.
defined based on the Cortical Area Parcellation from Resting- First, each set of data was normalized by calculating the
State Correlations (Gordon et al. 2016) with 333 cortical regions; z-score (subtracting the mean and dividing by the standard
this atlas was selected since it is specifically developed for deviation), and principal component analysis (PCA) was used to
functional connectivity analysis. reduce the dimensionality of the data by extracting the most
Each image was reshaped into a one-dimensional feature important features (Franke et al. 2010; Gutierrez Becker et al.
vector, using each voxel as a feature. Final resolution for 2018). To avoid contamination between test and training data,
the structural images was 3 × 3 × 3 mm, resulting in a total both z-score and PCA were calculated based on the training data,
of 114 990 features each for the GM, WM, and CSF tissue and the resulting transforms were applied to the test data. PCA is
probability maps after removing background voxels. The a linear transformation that calculates orthogonal components
FA images had a final resolution of 1 × 1 × 1 mm and were from a data set, describing the linear combinations of features
masked with the sample-specific binary skeleton mask obtained that capture the largest amount of the variance in the data.
through the TBSS pipeline, resulting in a total of 139 235 This means that instead of hundreds of thousands of features,
features. The connectivity analysis carried out on the rs- many of which contains little unique information, the prediction
fMRI resulted in a symmetric 333 × 333 matrix (FC), describing methods only need to handle a few hundred linear combinations
connectivity between each region; after removing duplicate of features, where each PCA component might include data from
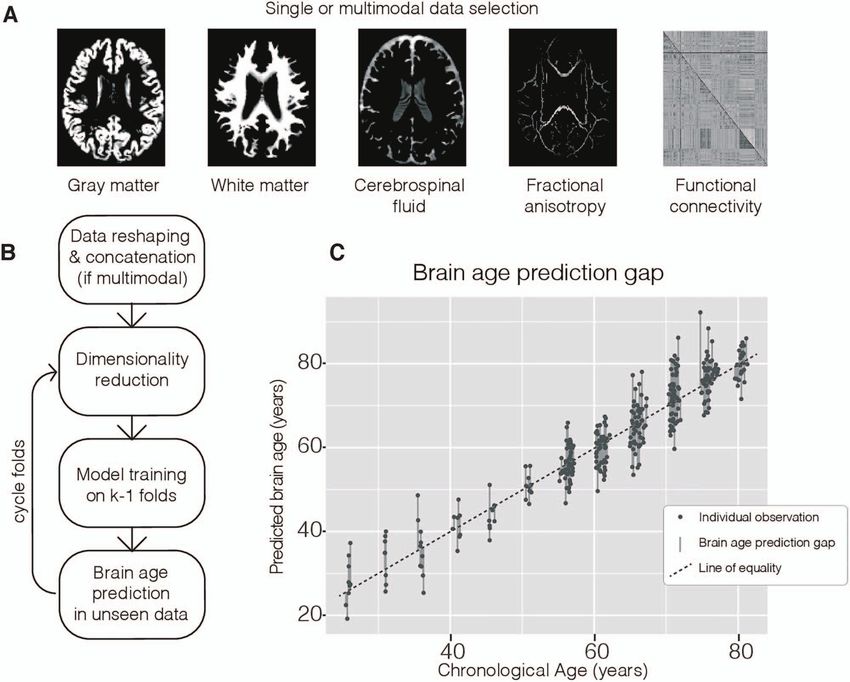
values, 55 278 features remained. Figure 1 shows examples of several modalities. By design, the largest number of components
these images and how they are used in the brain age prediction obtained from PCA is equal to the number of observations. The
process. number of principal components in each model was therefore
equal to the number of subjects in the training set (315 or 316
depending on fold).
Brain Age Predictions
Brain age predictions were carried out using supervised
Figure 1 shows an overview of the brain age prediction pipeline. learning regression methods from the scikit-learning package in
Single-modal brain age predictions were calculated for each of python. The goal of regression methods is to find the function
the 5 images (GM, WM, CSF, FA, and FC). These predictions were that best fits the training data, by minimizing training error.
compared with 2 different types of multimodal age predictions, Different methods use different definitions of training error
using either concatenation or random forest (RF) regression and hence might differ in what is considered the best fit. Based
(Liem et al. 2017). In the concatenation model, the feature vectors on previous studies of brain age predictions, we identified 7
of all included modalities were joined lengthwise, to a single regression methods for comparison. As a reference, we used the
feature vector for each subject, as the first step in the data most straightforward of the identified methods, OLS (Zhai and Li
processing scheme (Fig. 1). 2019), where a linear model is fitted to the data by minimizing
RF is an ensemble machine learning method based on deci- the residual sum of squares. Some drawbacks of OLS include
sion trees. A decision tree can be seen as a flow chart where large variance (Tibshirani 1996), which could increase the risk of
subjects are sorted into groups giving the lowest training errors. unreliable results, especially if the number of predictor variables
Individual trees have a tendency to overfit to the training data, is much larger than the number of observations, or if there are
and to overcome this, a large number of trees, in our case multicollinearities (Zhai and Li 2019).
100, were trained on random subsets of the data, and the pre- Bayesian ridge regression (BRR) (Hoerl and Kennard 1970;
dicted values were obtained by averaging the results from all Hsiangl 1975; Monté-Rubio et al. 2018) is also a linear model, and
trees. The goal of RF is to improve predictions by combining the 2 main differences to OLS are that BRR adds a regularization
results from the single-modality models; therefore, the RF model term to the minimizing function, penalizing large coefficients.
was trained on the age predictions obtained from the single- This term is controlled by a hyperparameter, α, and is propor-
modality models rather than the full feature vectors (Liem et al. tional to the root of the sum of squares of the coefficients (L2
2017). norm). The other difference is that BRR is a probabilistic method
For each of the 2 approaches, 2 models were constructed, based on Bayesian statistics, meaning that hyperparameters are
including either the 3 structural images or all 5 images. For estimated from the data according to a probability function,
the concatenated data, this resulted in feature vectors of length rather than set by the user.Physical Fitness as a Predictor for Brain Maintenance Dunås et al. 3397
Downloaded from https://academic.oup.com/cercor/article/31/7/3393/6159016 by guest on 11 September 2021
Figure 1. Overview of the brain age prediction process. (A) Example of input modalities that were used in the brain age prediction process. (B) Main processing steps
of the prediction method from reshaping image data into 2-dimensional matrixes with one row per subject that could be concatenated to contain all the considered
modalities, through the k-fold prediction framework where dimension reduction and model training are performed on k-1 folds and resulting parameters are used in
the prediction of age in the unseen fold. (C) Combined output from the prediction method and corresponding calculation of BAPG.
Least absolute shrinkage and selection operator (LASSO) (Tib- where it is hardest to fit the model. This fit is controlled by
shirani 1996; Baldassarre et al. 2017; Varikuti et al. 2018) does 2 hyperparameters, C and ε. Relevance vector regression (RVR)
also add a regularization term, controlled by hyperparameter α, (Tipping 2000; Franke et al. 2010; Su et al. 2013) is analogues to
proportional to the sum of the absolute values of the coefficients SVR, but uses the Bayesian method where hyperparameters are
(L1 norm) instead of its square, which shrinks unnecessary estimated within the regression model.
coefficients to zero, that is, performing variable selection, which The final method in our comparison was Gaussian process
could improve prediction accuracy (Tibshirani 1996). regression (GPR) (Rasmussen and Williams 2006; Cole, Poudel,
Elastic net (ENET) (Zou and Hastie 2005; Baldassarre et al. et al. 2017a; Aycheh et al. 2018), another probabilistic model,
2017) combines the advantages of both LASSO and ridge regres- closely related to ridge regression models, but employing the
sion by adding 2 regulation terms, one with L1 and one with L2 kernel transformation mentioned above. To find suitable kernels
norm, and the proportion between these 2 terms is controlled by for the 3 kernel methods, standard options were compared.
a hyperparameter ρ. For SVR and RVR (https://github.com/JamesRitchie/scikit-rvm),
In addition to these 4 linear models, we also included 3 a linear kernel was used, while GPR used a dot product kernel.
kernel methods. These methods differ in that instead of working For the non-Bayesian methods, hyperparameters can be esti-
directly with coordinates in feature space, the features are trans- mated using cross-validation. We chose to go with the default
formed using a predefined kernel function, working with inner options, meaning α = 1 for LASSO and elastic net, ρ = 0.5 for
products of feature vectors. The most common kernel method is elastic net, C = 1 and ε = 0.1 for SVR and a priori values of
support vector regression (SVR) (Drucker et al. 1997; Dosenbach α1 = α2 = λ1 = λ2 = 10−6 for BRR, α = β = 10−6 for RVR and α = 10−10
et al. 2010; Franke et al. 2010), which focuses on those cases for GPR.3398 Cerebral Cortex, 2021, Vol. 31, No. 7
Downloaded from https://academic.oup.com/cercor/article/31/7/3393/6159016 by guest on 11 September 2021
Figure 2. Scatterplot of T5 BAPG versus chronological age for the Conc all model (a) before (MAE = 4.20 years) and (b) after (MAE = 3.64 years) age correction using linear
regression. Before correction, young subjects on average get a higher predicted brain age than chronological age, while old subjects get a lower predicted brain age.
For each combination of regression method and input data, Associations between BAPG and physical fitness and cog-
the corresponding model was fitted to the training data and nitive ability were investigated both cross-sectionally and lon-
applied to the test data, and the process was then repeated gitudinally. For the cross-sectional analysis, data collected at
for the next fold. Just as the other models, the RF models T5, that is, in conjunction with the first imaging session, were
were trained and evaluated using 50 iterations of 10-fold cross- used, while data from all 4 time points (T3–T6) were used in the
validation. But instead of the full feature vector, the input was longitudinal analysis of how factors change over time. Physical
the 3 (structural) or 5 (all combined) age predictions for each fitness and cognitive ability were assessed using composite
subject, obtained from the single-modal models. The difference scores as described below.
between predicted and chronological age, denoted BAPG, was Cognitive ability, education, attrition, and physical fitness
calculated for each subject and model by subtracting the chrono- were collectively referred to as investigated factors. Among these,
logical age from the predicted age. A positive BAPG is therefore education and physical fitness were identified as potential pro-
equivalent to a predicted age higher than chronological age, and tective factors that might prevent brain aging, while cognitive
a negative BAPG to a predicted age lower than chronological ability and attrition are considered outcome factors, related to
age. Previous studies have shown noticeable age dependency brain maintenance. The physical fitness score has previously
in BAPG, where the predicted ages are overestimated for young been described in (Boraxbekk et al. 2016). It was based on mea-
subjects and underestimated for old subjects (Le et al. 2018; surements of resting pulse, resting systolic and diastolic blood
Smith et al. 2019; de Lange and Cole 2020). This bias was also pressure, maximum grip strength (left and right hand, not avail-
observed here and was corrected for using the following linear able at T3), BMI in kg/m2 , and waist circumference in cm. The z-
regression (Beheshti et al. 2019), calculated from the full T5 data: score for each measurement was calculated, and scores from all
7 measurements were averaged. Measurements where a higher
value was indicative of poorer health (BMI, waist circumference,
Predicted agecorrected = Predicted ageraw −β−α∗Chronological age
pulse, and blood pressure) were multiplied with −1, so that a
higher score indicated higher level of fitness. These values were
where β is the intercept and α the slope of the regression originally calculated from the entire Betula cohort and were
line describing the relationship between chronological age and therefore renormalized using z-scores, to reflect the distribution
BAPG. Figure 2 shows results before and after correction. This of values in the current cohort.
correction ensured that the BAPG was independent of age, which To assess cognitive ability, the g-factor (Spearman 1904; Car-
is necessary to exclude age as a mediating factor between BAPG roll 1993) was used, where a common factor influencing several
and other investigated factors. cognitive domains is identified and used as a measure of general
cognitive ability. To calculate this score, we used 4 cognitive
tests spanning different domains: episodic memory (free imme-
BAPG Association with Cognition, Education, Attrition,
diate recall of 16 enacted sentences), semantic memory (1-min
and Physical Fitness
generation of words beginning with the letter A), spatial ability
Associations between BAPG and education and attrition were (block design), and processing speed (letter–digit substitution
analyzed cross-sectionally. Education was measured in terms of test). These tests were selected in accordance with a previous
self-reported number of years of formal education. Attrition was study (Davies et al. 2018); for a more extensive description of
coded as a dummy variable, taking the value of 1 if the subject these tests, see (Nilsson et al. 1997; Larsson et al. 2004). Test
remained in the study at T6, and −1 if they dropped out. Out of scores were normalized using z-scores, and PCA was used to find
the 351 subjects, 272 returned for further testing at T6. the linear combination of these tests that captured the largestPhysical Fitness as a Predictor for Brain Maintenance Dunås et al. 3399
amount of variation (the first principal component), based on For the multimodal predictions (Fig. 3B), the models based
the T5 data. Normalized loadings were between 0.4 and 0.6 for on concatenated data had a lower MAE than RF, and models
all 4 tests, and the cognitive ability score for each individual was combining all 5 modalities had lower MAE than those based
calculated by multiplying each test score with the corresponding on only the structural data (GM, WM, and CSF), (Conc struct:
loading and summing them all together. 3.93 ± 3.08, Conc all: 3.64 ± 2.98 years, RF struct: 3.99 ± 3.30,
and RF all: 3.72 ± 2.98 years), with the lowest value over all for
Longitudinal Analyses the full multimodal model (Conc all). Scatterplots of predicted
Both physical fitness and cognitive ability were assessed at 4 versus chronological age for all models are shown in Figure 4.
time points (T3–T6), and the retrospective data were included Table 2 shows the correlation between all the BAPG methods, all
to investigate if cognitive ability and physical fitness earlier in models were significantly correlated, and all models except the
life were related to brain age later in life. A linear model for single-modal FC had r’s > 0.5.
each of these measures was fitted for every subject, provided
that data were available for at least one retrospective time
Downloaded from https://academic.oup.com/cercor/article/31/7/3393/6159016 by guest on 11 September 2021
point (T3 or T4), and at least 2 time points in total. Slope and Longitudinal Brain Age Prediction
intercept of these models were then used to investigate longi- The average BAPG, based on the full multimodal model (Conc
tudinal effects, using correlation analysis as described below. all), for the participants that were scanned at both time points
In this context, slope measures the rate of change over time, was −0.33 ± 4.65 years at T5 and −0.46 ± 4.52 years at T6. This
while intercept can be interpreted as a modified baseline score, means that subjects on average aged 3.87 ± 2.13 years during
indicating an expected value 10 years before baseline brain this period of 4.0 ± 0.2 years. BAPG at T5 and T6 was strongly
age prediction, assuming a linear trajectory. Since the data are correlated (r = 0.89). A moderate correlation (r = −0.29) was found
normalized at each time point, all scores are set in relation to between T5 BAPG and change in BAPG, indicating that subjects
the other subjects in the study, rather than change in absolute with a low BAPG at T5 had a higher rate of brain aging than
values. those with a high BAPG at T6. Figure 5 shows individual BAPG
trajectories over this period.
Correlation with BAPG
The primary measurement of association between BAPG and
the investigated factors in both the cross-sectional and the BAPG Associations with Cognition, Education, Attrition,
longitudinal analysis was correlation. We also investigated how and Physical Fitness
much of the variation in each factor could be explained by
Table 3 shows the correlations among the 4 investigated factors.
predicted age in comparison to chronological age. This was done
Years of education was significantly correlated with physical
by calculating the coefficient of determination (R2 ) for a linear
fitness and cognitive ability, and the latter 2 factors were also
regression between each investigated factor and both predicted
correlated with each other. Attrition was only correlated with
and chronological age. F-test was then used to determine if there
cognitive ability. All correlations were positive.
is a significant difference in the amount of explained variance
For BAPG, a negative value was considered an indication of
for predicted and chronological age.
good health (a person with a negative BAPG has lower pre-
For the longitudinal BAPG, correlation between T5 and T6
dicted brain age than chronological age, i.e., a brain that more
value was calculated, as well as correlation between baseline
closely resembles the brain of someone younger). Therefore, we
value and change in BAPG between the 2 time points. Correlation
expected negative correlations between BAPG and the inves-
with investigated factors was also calculated for both T6 BAPG
tigated factors, which was the case for all significant corre-
and change in BAPG.
lations. In the cross-sectional analysis, BAPG measures from
Correlations among the 4 investigated factors were also cal-
4 of the evaluated models were significantly negatively corre-
culated, as well as the difference in BAPG and years of education
lated to physical fitness, cognitive ability, and attrition, while
between subjects who did or did not return for testing at T6.
only the predictions based on FC were significantly correlated
In total, 20 tests were performed for each model at T5, and
to education (Table 4). For cognitive ability, all but 2 models
an additional 20 at T6. False discovery rate (Benjamini and
showed a significant correlation with BAPG. Figure 6 illustrates
Hochberg 1995) was used to correct for multiple comparisons.
the relationship between BAPG and education, physical fitness,
Unless otherwise stated, all analyses were done in MATLAB
and cognitive ability for the models based on WM, FC, and all
(Mathworks).
modalities concatenated.
In the longitudinal analyses of changes in cognition and
Results physical activity over time in relation to BAPG (Table 5), 6 of
the 9 models showed correlations between cross-sectional BAPG
Cross-Sectional Brain Age Prediction
and slope of cognitive ability, but only one method (FC) showed
All evaluated regression methods performed at a similar correlation with slope of physical fitness. However, for physical
level in terms of average size of the prediction gaps (MAE) fitness intercept, correlations were seen with BAPG in several
at T5 (Fig. 3, Kruskal–Wallis P’s > 0.23), and predicted age models. This pattern indicates that both cognition and physi-
was strongly correlated to chronological age for all models cal fitness relate to BAPG longitudinally, but in different ways.
(r’s > 0.90). Therefore, the reference method (OLS) was used for Current and retrospective levels of physical fitness appear to be
all subsequent analyses. The lowest MAE among the single- more related than rate of change, whereas those with low BAPG
modal models (3.72 ± 2.90 years) was obtained for the model (younger brains) show less cognitive decline regardless of their
based on WM (Fig. 3A). GM and FA did also perform well level of cognitive ability to begin with.
(3.90 ± 3.21 and 4.04 ± 2.88 years, respectively), while CSF and FC Significant associations between BAPG and physical fitness
had a higher MAE (4.68 ± 3.82 and 4.87 ± 3.50 years, respectively). and cognitive ability remained at T6, meaning that BAPG at T63400 Cerebral Cortex, 2021, Vol. 31, No. 7
Downloaded from https://academic.oup.com/cercor/article/31/7/3393/6159016 by guest on 11 September 2021
Figure 3. Average mean absolute error (MAE) for each method based on the 50 iterations, error bars show the range of obtained values, (A) single-modal prediction, (B)
multimodal predictions.
Table 2 Correlation between BAPG obtained from each investigated cross-sectional model. All correlations were significant at P < 0.0005
GM WM CSF FA FC RF struct RF all Conc struct
WM 0.69
CSF 0.61 0.61
FA 0.58 0.59 0.54
FC 0.22 0.21 0.30 0.23
RF struct 0.78 0.73 0.62 0.58 0.21
RF all 0.74 0.69 0.59 0.67 0.33 0.91
Conc struct 0.93 0.75 0.78 0.63 0.28 0.78 0.74
Conc all 0.85 0.70 0.70 0.79 0.44 0.72 0.75 0.91
was correlated with both current physical fitness and cogni- trend was seen either. Thus, changes in BAPG and changes in
tive ability, as well as intercept of physical fitness and slope cognition or physical fitness were not significantly associated.
of cognitive ability (P’s < 0.03). Significant correlation was also Finally, Table 6 shows the results from the analysis of vari-
found for change in BAPG and education (r = 0.15, P = 0.024), ance that directly compared the relation of chronological ver-
where individuals with longer education aged faster than those sus predicted age with the examined factors. Since no relation
with shorter education. No association with any of the other between BAPG and intercept of cognitive ability and slope of
investigated factors was found for the longitudinal difference physical fitness was found, these variables were left out of the
in BAPG between the 2 imaging sessions (P’s > 0.3), and no clear analysis. Predicted brain age explained more of the variancePhysical Fitness as a Predictor for Brain Maintenance Dunås et al. 3401
Downloaded from https://academic.oup.com/cercor/article/31/7/3393/6159016 by guest on 11 September 2021
Figure 4. Scatterplots of predicted versus chronological age for all methods, dashed lines indicate M ± 2 SD.
Table 3 Correlations among investigated factors
Education PF CA
Education – – –
PF 0.23 – –
CA 0.51 0.25 –
Attrition 0.08 0.04 0.26
Note: Bold values are significant at false discovery rate corrected P = 0.05,
PF = physical fitness, CA = cognitive ability.
Discussion
In this study, we addressed heterogeneity in brain aging by
comparing predicted brain age with chronological age. One of
the main advantages of our study is that we have a wide vari-
ety of data, including brain images, cognitive tests, and health
assessment, covering several decades. A predicted brain age
Figure 5. Trajectories of change in BAPG over a 4-year period, each line represents
one subject and shows how their BAPG change with their chronological change higher than the chronological age is indicative of accelerated
from T5 to T6. aging, while a predicted brain age younger than chronological
age could reflect brain maintenance. Overall, we found the
chronological and predicted ages to be strongly related, and
than chronological age in both physical fitness and cognitive the additional prediction capacity of BAPG was limited in com-
ability, and for attrition, a similar pattern was seen as for cog- parison to that of chronological age. Still, even for the models
nitive ability. with the smallest deviation between actual and predicted age,3402 Cerebral Cortex, 2021, Vol. 31, No. 7
Table 4 Correlations between each BAPG measure and the 4 main investigated factors
Correlations Education PF T5 CA T5 Attrition
N = 349 N = 316 N = 350 N = 350
r P r P r P r P
GM −0.06 0.242 −0.17 0.002 −0.14 0.010 −0.15 0.005
WM −0.07 0.178 −0.17 0.003 −0.21Physical Fitness as a Predictor for Brain Maintenance Dunås et al. 3403
Table 5 Correlations of longitudinal variables
Correlations PF slope PF intercept CA slope CA intercept
N = 268 N = 268 N = 271 N = 271
r P r P r P r P
GM -0.12 0.059 -0.08 0.193 -0.14 0.025 -0.02 0.751
WM -0.03 0.650 -0.15 0.013 -0.273404 Cerebral Cortex, 2021, Vol. 31, No. 7
Physical Fitness as a Predictor for Brain Maintenance        Dunås et al.         3405

since each factor was analyzed separately, and such associations       Breteler MMB, Van Amerongen NM, Van Swieten JC, Claus JJ,
would not be weakened by potential collinearity.                          Grobbee DE, Van Gijn J, Hofman A. 1994. Cognitive correlates
    Although there are many studies looking at the connec-                of ventricular enlargement and cerebral white matter lesions
tion between predicted brain age and various diseases such                on magnetic resonance imaging: the Rotterdam study. Stroke.
as schizophrenia (Nenadića et al. 2017), epilepsy (Pardoe et al.         25:1109–1115.
2017), and multiple sclerosis (Høgestøl et al. 2019), studies where    Caracciolo B, Palmer K, Monastero R, Winblad B, Bäckman L,
these prediction methods are developed and introduced have                Fratiglioni L. 2008. Occurrence of cognitive impairment and
generally aimed to minimize the difference between predicted              dementia in the community: a 9-year-long prospective study.
and chronological age, by comparing the performance of differ-            Neurology. 70:1778–1785.
ent methods in terms of MAE (Franke et al. 2010; Liem et al.           Carroll JB. 1993. Human cognitive abilities: a survey of factor-analytic
2017; Cole, Poudel, et al. 2017a). If the main goal is to con-            studies. Cambridge: Cambridge University Press.
struct a biomarker with strong connection to modifiable factors        Cole JH. 2020. Multimodality neuroimaging brain-age in UK
and capacity to predict future pathologies, rather than actual            biobank: relationship to biomedical, lifestyle, and cognitive

                                                                                                                                                  Downloaded from https://academic.oup.com/cercor/article/31/7/3393/6159016 by guest on 11 September 2021
age, this might not be the most effective approach, and it is             factors. Neurobiol Aging. 92:34–42.
therefore important to consider other measures of performance          Cole JH, Franke K. 2017. Predicting age using neuroimaging: inno-
besides MAE.                                                              vative brain ageing biomarkers. Trends Neurosci. 40:681–690.
    In conclusion, combining several MRI modalities did not            Cole JH, Poudel RPK, Tsagkrasoulis D, Caan MWA, Steves C,
significantly improve MAE for brain age predictions but might             Spector TD, Montana G. 2017a. Predicting brain age with deep
still contribute with unique information. Choice of input data is         learning from raw imaging data results in a reliable and
more important than choice of regression method. Brain age pre-           heritable biomarker. Neuroimage. 163:115–124.
dictions were associated to attrition, current and retrospective       Cole JH, Ritchie SJ, Bastin ME, Valdés Hernández MC, Muñoz
physical fitness, and cognitive ability over time, indicating that        Maniega S, Royle N, Corley J, Pattie A, Harris SE, Zhang
maintaining a high physical fitness throughout life contributes           Q, et al. 2017b. Brain age predicts mortality. Mol Psychiatry.
to brain maintenance.                                                     23:1385–1392.
                                                                       Davies G, Lam M, Harris SE, Trampush JW, Luciano M, Hill WD,
                                                                          Hagenaars SP, Ritchie SJ, Marioni RE, Fawns-Ritchie C, et al.
Funding                                                                   2018. Study of 300,486 individuals identifies 148 indepen-
The research is part of the program Paths to Healthy and Active           dent genetic loci influencing general cognitive function. Nat
Ageing, funded by Forskningsrådet om Hälsa, Arbetsliv och                 Commun. 9:1–16.
Välfärd (2013–2056). This publication is based on data collected       de Lange A-MG, Anatürk M, Kaufmann T, Cole JH. 2020. Mul-
in the Betula prospective cohort study, Umeå University, Sweden.          timodal brain-age prediction and cardiovascular risk: the
The Betula Project is supported by a Wallenberg Scholar Grant             Whitehall II MRI sub-study. Neuroimage. 222:117292.
to L.N. from Knut och Alice Wallenbergs Stiftelse and by grants        de Lange A-MG, Cole JH. 2020. Commentary: correction proce-
from Vetenskapsrådet (K2010-61X-21446-01).                                dures in brain-age prediction. NeuroImage Clin. 26:24–26.
                                                                       Dosenbach NUF, Nardos B, Cohen AL, Fair DA, Power D, Church
                                                                          JA, Nelson SM, Wig GS, Vogel AC, Lessov-schlaggar CN, et al.
Notes                                                                     2010. Prediction of individual brain maturity using fMRI.
                                                                          Science. 329:1358–1361.
Conflict of Interest: The authors declare no conflict of interest.     Drucker H, Surges CJC, Kaufman L, Smola A, Vapnik V. 1997.
                                                                          Support vector regression machines. Adv Neural Inf Process
                                                                          Syst. 1:155–161.
References                                                             Eavani H, Habes M, Satterthwaite TD, An Y, Hsieh M-K, Honnorat
Ashburner J. 2007. A fast diffeomorphic image registration algo-          N, Erus G, Doshi J, Ferrucci L, Beason-Held LL, et al. 2019.
   rithm. Neuroimage. 38:95–113.                                          Heterogeneity of structural and functional imaging patterns
Ashburner J, Friston KJ. 2005. Unified segmentation. Neuroimage.          of advanced brain aging revealed via machine learning meth-
   26:839–851.                                                            ods. Neurobiol Aging. 71:41–50.
Aycheh HM, Seong JK, Shin JH, Na DL, Kang B, Seo SW, Sohn KA.          Evans AC, Janke AL, Collins DL, Baillet S. 2012. Brain templates
   2018. Biological brain age prediction using cortical thickness         and atlases. Neuroimage. 62:911–922.
   data: a large scale cohort study. Front Aging Neurosci. 10:1–14.    Ferreira LK, Regina ACB, Kovacevic N, Martin M d GM, Santos PP,
Baldassarre L, Pontil M, Mourão-Miranda J. 2017. Sparsity is              Carneiro C d G, Kerr DS, Amaro E, Mcintosh AR, Busatto GF.
   better with stability: combining accuracy and stability for            2016. Aging effects on whole-brain functional connectivity
   model selection in brain decoding. Front Neurosci. 11:62.              in adults free of cognitive and psychiatric disorders. Cereb
Beheshti I, Nugent S, Potvin O, Duchesne S. 2019. Bias-                   Cortex. 26:3851–3865.
   adjustment in neuroimaging-based brain age frameworks: a            Franke K, Gaser C. 2012. Longitudinal changes in individual
   robust scheme. NeuroImage Clin. 24:102063.                             BrainAGE in healthy aging, mild cognitive impairment, and
Benjamini Y, Hochberg Y. 1995. Controlling the false discovery            Alzheimer’s disease. GeroPsych. 25:235–245.
   rate: a practical and powerful approach to multiple testing. J      Franke K, Gaser C. 2019. Ten years of brainage as a neuroimaging
   R Stat Soc Ser B Methodol. 57:289–300.                                 biomarker of brain aging: what insights have we gained?
Boraxbekk C-J, Salami A, Wåhlin A, Nyberg L. 2016. Physical               Front Neurol. 10:789.
   activity over a decade modifies age-related decline in perfu-       Franke K, Ziegler G, Klöppel S, Gaser C. 2010. Estimating the age
   sion, gray matter volume, and functional connectivity of the           of healthy subjects from T1-weighted MRI scans using ker-
   posterior default-mode network—a multimodal approach.                  nel methods: exploring the influence of various parameters.
   Neuroimage. 131:133–141.                                               Neuroimage. 50:883–892.
3406 Cerebral Cortex, 2021, Vol. 31, No. 7
Friston KJ, Williams S, Howard R, Frackowiak RSJ, Turner R. 1996. Nilsson L-G, Bäckman L, Erngrund K, Nyberg L, Adolfsson R,
Movement-related effects in fMRI time-series. Magn Reson Gös B, Karlsson S, Widing M, Winblad B. 1997. The betula
Med. 35:346–355. prospective cohort study: memory, health, and aging. Aging,
Gaser C, Franke K, Klöppel S, Koutsouleris N, Sauer H. 2013. Neuropsychol Cogn. 4:1–32.
BrainAGE in mild cognitive impaired patients: predicting the Nyberg L, Boraxbekk CJ, Sörman DE, Hansson P, Herlitz A, Kauppi
conversion to Alzheimer’s disease. PLoS One. 8:e67346. K, Ljungberg JK, Lövheim H, Lundquist A, Adolfsson AN, et al.
Gordon EM, Laumann TO, Adeyemo B, Huckins JF, Kelley WM. 2020. Biological and environmental predictors of heterogene-
2016. Generation and evaluation of a cortical area parcella- ity in neurocognitive ageing: evidence from Betula and other
tion from resting-state correlations. Cereb Cortex. 26:288–303. longitudinal studies. Ageing Res Rev. 64.
Gutierrez Becker B, Klein T, Wachinger C. 2018. Gaussian pro- Nyberg L, Lövdén M, Riklund K, Lindenberger U, Bäckman L.
cess uncertainty in age estimation as a measure of brain 2012. Memory aging and brain maintenance. Trends Cogn Sci.
abnormality. Neuroimage. 175:246–258. 16:292–305.
Harman D. 2001. Aging: overview. Ann NY Acad Sci. 1–21. Nyberg L, Pudas S. 2019. Successful memory aging. Annu Rewiew
Downloaded from https://academic.oup.com/cercor/article/31/7/3393/6159016 by guest on 11 September 2021
Hoerl AE, Kennard RW. 1970. Ridge regression: applications to Psychol. 70:219–243.
nonorthogonal problems. Dent Tech. 12:69–82. Pardoe HR, Cole JH, Blackmon K, Thesen T, Kuzniecky R, Epilepsy
Høgestøl EA, Kaufmann T, Nygaard GO, Beyer MK, Sowa P, Nord- H, Investigators P. 2017. Structural brain changes in medically
vik JE, Kolskår K, Richard G, Andreassen OA, Harbo HF, et al. refractory focal epilepsy resemble premature brain aging.
2019. Cross-sectional and longitudinal MRI brain scans reveal Epilepsy Res. 133:28–32.
accelerated brain aging in multiple sclerosis. Front Neurol. Pendlebury ST, Rothwell PM. 2019. Incidence and prevalence
10:1–9. of dementia associated with transient ischaemic attack and
Hsiangl TC. 1975. A Bayesian view on ridge regression. J R Stat Soc stroke: analysis of the population-based Oxford Vascular
Ser D Stat. 24:267–268. Study. Lancet Neurol. 18:248–258.
Jiang H, Lu N, Chen K, Yao L, Li K, Zhang J, Guo X. 2020. Predicting Pudas S, Persson J, Josefsson M, De Luna X, Nyberg L. 2013. Brain
brain age of healthy adults based on structural MRI par- characteristics of individuals resisting age-related cognitive
cellation using convolutional neural networks. Front Neurol. decline over two decades. J Neurosci. 33:8668–8677.
10:1346. Rasmussen CE, Williams CKI. 2006. Gaussian processes for
Karalija N, Wåhlin A, Ek J, Rieckmann A, Papenberg G, Salami machine learning, the MIT Press, 2006, ISBN 026218253X. ©
A, Brandmaier AM, Köhncke Y, Johansson J, Andersson M, 2006 Massachusetts Institute of Technology.
et al. 2019. Cardiovascular factors are related to dopamine Richard G, Kolskår K, Sanders AM, Kaufmann T, Petersen A, Doan
integrity and cognition in aging. Ann Clin Transl Neurol. NT, Sánchez JM, Alnæs D, Ulrichsen KM, Dørum ES, et al.
6:2291–2303. 2018. Assessing distinct patterns of cognitive aging using
Kaskikallio A, Karrasch M, Koikkalainen J, Lötjönen J, Rinne JO, tissue-specific brain age prediction based on diffusion tensor
Tuokkola T, Parkkola R. 2019. White matter hyperintensities imaging and brain morphometry. PeerJ. 6:e5908.
and cognitive impairment in healthy and pathological aging: Rokicki J, Wolfers T, Nordhoy W, Tesli N, Quintana D, Alnaes
a quantified brain MRI study. Dement Geriatr Cogn Disord. D, Richard G, de Lange A-M, Lund MJ, Norbom LB, et al.
48:297–307. 2020. Multimodal imaging improves brain age prediction and
Larsson M, Nilsson LG, Olofsson JK, Nordin S. 2004. Demographic reveals distinct abnormalities in patients with psychiatric
and cognitive predictors of cued odor identification: evidence and neurological disorders. Hum Brain Mapp. 1–13.
from a population-based study. Chem Senses. 29:547–554. Sajedi H, Pardakhti N. 2019. Age prediction based on brain MRI
Le TT, Kuplicki RT, Mckinney BA, Yeh H. 2018. A nonlinear simu- image: a survey. J Med Syst. 43:279.
lation framework supports adjusting for age when analyzing Salami A, Pudas S, Nyberg L. 2014. Elevated hippocampal resting-
BrainAGE. Front Aging Neurosci. 10:1–11. state connectivity underlies deficient neurocognitive func-
Liang H, Zhang F, Niu X. 2019. Investigating systematic bias tion in aging. Proc Natl Acad Sci. 111:17654–17659.
in brain age estimation with application to post-traumatic Salat DH, Buckner RL, Snyder AZ, Greve DN, Desikan RSR, Busa
stress disorders. Hum Brain Mapp. 40:3143–3152. E, Morris JC, Dale AM, Fischl B. 2004. Thinning of the cerebral
Liem F, Varoquaux G, Kynast J, Beyer F, Kharabian Masouleh S, cortex in aging. Cereb Cortex. 14:721–730.
Huntenburg JM, Lampe L, Rahim M, Abraham A, et al. 2017. Salthouse TA. 2019. Attrition in longitudinal data is primarily
Predicting brain-age from multimodal imaging data captures selective with respect to level rather than rate of change. J
cognitive impairment. Neuroimage. 148:179–188. Int Neuropsychol Soc. 25:618–623.
López-Otín C, Blasco MA, Partridge L, Serrano M, Kroemer G. Sexton CE, Betts JF, Demnitz N, Dawes H, Ebmeier KP, Johansen-
2013. The hallmarks of aging. Cell. 153:1194–1217. Berg H. 2016. A systematic review of MRI studies examining
Lövdén M, Fratiglioni L, Glymour MM, Lindenberger U, Tucker- the relationship between physical fitness and activity and
Drob EM. 2020. Education and cognitive functioning across the white matter of the ageing brain. Neuroimage. 131:81–90.
the life span. Psychol Sci Public Interest. 21:6–41. Smith SM, Elliott LT, Alfaro-Almagro F, McCarthy P, Nichols TE,
Monté-Rubio GC, Falcón C, Pomarol-Clotet E, Ashburner J. 2018. Douaud G, Miller KL. 2020. Brain aging comprises multiple
A comparison of various MRI feature types for characteriz- modes of structural and functional change with distinct
ing whole brain anatomical differences using linear pattern genetic and biophysical associations. Elife. 9:e52677.
recognition methods. Neuroimage. 178:753–768. Smith SM, Vidaurre D, Alfaro-Almagro F, Nichols TE, Miller
Nenadića I, Dietzeka M, Langbeina K, Sauera H, Gaser C. KL. 2019. Estimation of brain age delta from brain imaging.
2017. BrainAGE score indicates accelerated brain aging in Neuroimage. 200:528–539.
schizophrenia, but not bipolar disorder. Psychiatry Res Neu- Spearman C. 1904. “General intelligence”, objectively deter-
roimaging. 266:86–89. mined and measured. Am J Psychol. 15:201–292.You can also read