Summer weather conditions influence winter survival of honey bees (Apis mellifera) in the northeastern United States - Nature
←
→
Page content transcription
If your browser does not render page correctly, please read the page content below
www.nature.com/scientificreports
OPEN Summer weather conditions
influence winter survival
of honey bees (Apis mellifera)
in the northeastern United States
Martina Calovi1*, Christina M. Grozinger2, Douglas A. Miller3,4 & Sarah C. Goslee5*
Honey bees are crucial pollinators for agricultural and natural ecosystems, but are experiencing heavy
mortality in North America and Europe due to a complex suite of factors. Understanding the relative
importance of each factor would enable beekeepers to make more informed decisions and improve
assessment of local and regional habitat suitability. We used 3 years of Pennsylvania beekeepers’
survey data to assess the importance of weather, topography, land use, and management factors
on overwintering mortality at both apiary and colony levels, and to predict survival given current
weather conditions and projected climate changes. Random Forest, a tree-based machine learning
approach suited to describing complex nonlinear relationships among factors, was used. A Random
Forest model predicted overwintering survival with 73.3% accuracy for colonies and 65.7% for apiaries
where Varroa mite populations were managed. Growing degree days and precipitation of the warmest
quarter of the preceding year were the most important predictors at both levels. A weather-only
model was used to predict colony survival probability, and to create a composite map of survival for
1981–2019. Although 3 years data were likely not enough to adequately capture the range of possible
climatic conditions, the model performed well within its constraints.
Abbreviations
USDA-NASS United States Department of Agriculture—National Agricultural Statistics Service
CDL Cropland data layer
FRI Forage resource index
ITL Insect toxic load
RF Random forest
OOB Out-of-bag
Honey bees (Apis mellifera) contribute more than $20 billion in pollination services to agriculture in the United
States1, and contribute substantial economic value to downstream industrial s ectors2. Honey production generates
an additional $300 million annually for US beekeepers3. However, winter colony mortality has a strong negative
effect on economic and ecosystem potentials, with approximately 53.5% overwintering mortality of US honey bee
colonies estimated from survey data from 2016 to 2 0194. However, winter mortality is known to vary regionally in
both the US and Europe, but the landscape or weather factors underlying this variation are poorly understood5,6.
Honey bee colonies are not dormant during the winter: they remain active and maintain the hive temperature
between 24 and 34 °C by forming a thermoregulating c luster7. This enables them to survive long periods of cold
temperatures8–10. During the winter, the colony ceases foraging for nectar and pollen and relies on its existing
stores, collected during the plant growing season. Furthermore, brood rearing ceases, and the colony is depend-
ent on the survival of a long-lived cohort of bees that is produced in the autumn. These bees will live for several
months, while worker bees produced in the summer only live for a few weeks. Thus, factors which undermine the
ability of the bees to collect and store adequate amounts of food during the summer and fall, or to thermoregulate
1
Department of Ecosystem Science and Management, The Pennsylvania State University, University Park,
PA 16802, USA. 2Department of Entomology, Center for Pollinator Research, Huck Institutes of the Life Sciences,
The Pennsylvania University, University Park, PA 16802, USA. 3Department of Geography, The Pennsylvania
State University, University Park, PA 16802, USA. 4Department of Ecosystem Science and Management, The
Pennsylvania State University, University Park, PA 16802, USA. 5USDA-ARS Pasture Systems and Watershed
Management Research Unit, University Park, PA 16802, USA. *email: mcalovi@psu.edu; Sarah.Goslee@usda.gov
Scientific Reports | (2021) 11:1553 | https://doi.org/10.1038/s41598-021-81051-8 1
Vol.:(0123456789)
www.nature.com/scientificreports/
effectively during the winter, or reduce the lifespan of winter bees, can contribute to colony mortality. These
factors include: beekeeper management practices that affect parasite and pathogen loads, particularly control of
Varroa mites11–13; forage quality and pesticide exposure due to the surrounding land use14; and weather factors
which influence the availability of forage, the thermoregulatory ability of the bees in the winter, and the amount
of time before bees are able to initiate brood rearing in the s pring15. Modeling and predicting honey bee winter
survival requires consideration of all of these factors.
Previous studies have evaluated how colony growth, honey production and survival correlates with particular
land use practices, such as the percentage of agricultural land or the percentage of certain crops in the area sur-
rounding the hive16–19. However, while several studies have indicated that honey bees show reduced growth or
higher mortality with increasing urban or agricultural land u se16,17,20, others have found that agricultural land
18
use is positively correlated with colony survival . These measures of land use do not necessarily correlate directly
with forage quality, as bees can collect substantial resources from wildflowers in both agricultural and urban
areas, and crops can vary greatly in the resources they provide to bees or their pesticide r egimes21–24. Indices of
forage quality and of pesticide loading based on surrounding land cover have been developed that are intended
to incorporate specific effects of crop and habitat types on a broad s cale25–27, but thus far these have not been
applied to studies of honey bee winter survival or health.
Seasonal weather conditions affect both forage availability and thermoregulatory success, and thereby directly
and indirectly influence honey bee h ealth28. During the growing season, weather conditions can affect the onset
and decline of specific foraging resources, lengthen or shorten the time in which resources are available for
bees, change the quality of these resources, and alter the span during which bees can actively f orage29,30. Indeed,
even small variations in temperature can dramatically change the numbers of available flowers and the amount
of nectar they p roduce31. Winter temperature conditions influence the efficiency of maintaining hive internal
temperatures. The optimal external temperatures that maximize efficiency of this thermoregulation are from
− 5° to 10 °C32. When temperatures drop below 10 °C, the bees form a thermoregulating c luster8,10. In previous
studies in Austria, warmer and drier climates have been associated with higher winter l osses15.
Few studies have simultaneously evaluated the effects of multiple landscape and weather factors on honey
bee colony winter survival. A study of honey bee winter survival in the Netherlands evaluated survival of 1106
colonies across 2 years, using 24 variables in a generalized linear mixed m odel14. Overall, there were positive
effects of forest and grassland, and negative effects of increased annual mean temperature, and no effect of
predicted toxicity of insecticides applied to agricultural areas. Another study was conducted in Belgium, where
the apiary-level winter colony survival rates were assessed for 147 apiaries across two years (encompassing 607
colonies) using 26 variables using regression a nalyses33. In that study, Varroa infestation was by far the most
correlated variable with winter mortality rates, followed by temperature conditions (in terms of frost days and
flying hours), beekeeper practice (e.g., involvement in beekeeping organizations), potential pesticide exposure
(calculated from surrounding agricultural lands), and landscape connectivity.
Evaluating how these complex factors influence honey bee winter survival requires large data sets that span
multiple types of habitats, microclimates, and years. Collaborations with beekeepers through citizen science pro-
jects can provide the necessary large and varied data sets, and are becoming increasingly important for studying
both managed honey bee and wild bee h ealth33–35. The voluntary involvement of beekeepers as key collabora-
tors in the collection of data has the dual benefits of generating the necessary large data sets while also directly
engaging stakeholders in scientific research, such that the outcomes are more likely to be translated to directly
benefiting the stakeholders35. One example of this citizen science approach is the annual winter loss survey con-
ducted by the Pennsylvania State Beekeepers Association (PSBA) across the entire state. Voluntary survey data
entails certain limitations, such as effective coverage of target populations, data accuracy, potential bias of the
survey sample, the survey modes, missing data, and incomplete responses36, but nonetheless the PSBA survey
provides the best available information, a geographically robust data set covering hundreds of apiaries and 3 years.
Using this unique data set, our objective was to develop a predictive model of the overwintering survival of
honey bee colonies in Pennsylvania that incorporates weather, topographic variables that affect temperature and
moisture, and the composition of the surrounding landscape as it determines foraging resources and potential
pesticide load25–27 (Supplementary Table S2). Our goal was to understand relative contribution of these factors
to honey bee winter losses in this region, and to develop a model predicting honey bee winter survival across
Pennsylvania to support beekeeper management decisions and processes.
Methods
The complex nature of the factors influencing overwintering survival of European honey bees necessitated the
integration of multiple datasets comprising weather and topographic variables that determine temperature and
moisture conditions, and landscape variables that determine the availability of foraging resources and insecticide
exposure risk. The analysis of these diverse datasets can best be addressed with randomization-based machine
learning techniques that do not require the data to meet standard statistical assumptions or expect relationships
between overwintering success and environment to follow any predetermined form. Thus, unlike previous studies
which examined landscape and/or weather condition effects on winter survival using general linear mixed models
or regression approaches14,32, we used a machine learning approach suitable for complex multivariate datasets.
Data sources. Honey bee overwintering survival. Our main dataset originates from the Pennsylvania State
Beekeepers Association Winter Loss Survey (see sample questions in the Supplementary S1). The survey began
to collect apiary locations information in 2017, resulting in data for three winters in our analysis: 2016–2017,
2017–2018, and 2018–2019. Variables extracted from the survey were: beekeeper ID, spring year, colony number
in November and in April, beekeepers’ years of experience, use of Varroa mite treatment. The ID that identifies
Scientific Reports | (2021) 11:1553 | https://doi.org/10.1038/s41598-021-81051-8 2
Vol:.(1234567890)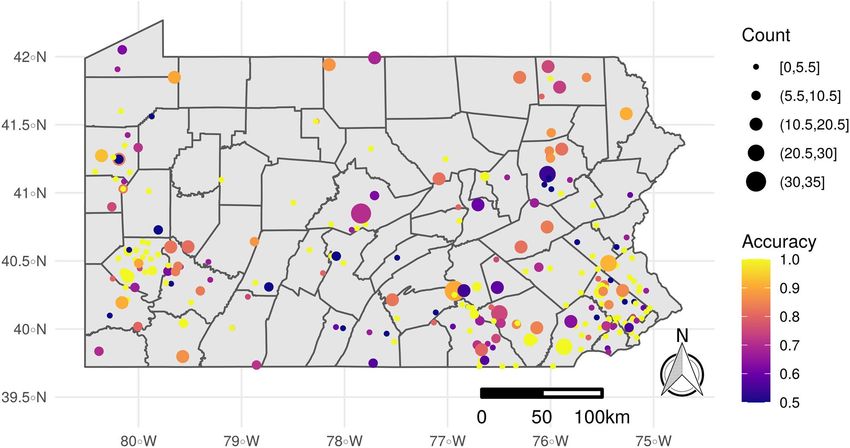
www.nature.com/scientificreports/
Figure 1. Locations of Pennsylvania beekeeper survey respondents from 2016 to 2019, stratified by use of
treatment for Varroa mites (257 treated and 85 untreated apiaries). Only treated apiaries were modeled. The
map has been generated by the authors in R 3.6.250, using the s f72, the raster56, the ggplot273 and the cowplot74
packages.
each beekeeper is randomly assigned each year to protect personally identifiable information. Unfortunately,
as a result it is not possible to follow individual apiaries throughout the years of the survey, making historical
tracking of the individual beekeepers and their apiaries impossible. Furthermore, detailed information is not
available on the genetic background of the colonies, whether the colonies were newly established or persisted
over the previous winter, the age or quality of the queens, or how and when the colonies were established (e.g.,
from packages or splits).
In the survey, beekeepers noted whether their operations were involved in migratory beekeeping practices
(meaning they moved colonies to different sites for pollination services throughout the year). These operations
were not used in this study. Beekeepers could only provide information on their total colony numbers and loca-
tion information for one apiary: thus, it is possible that some beekeepers combined information from multiple
apiaries and this is a limitation of this data set. However, most of the non-migratory respondents reported fewer
than ten hives: this suggests they were likely small-scale beekeepers with a single apiary, or a few nearby apiaries.
After filtering, 342 apiaries with 1726 colonies had adequate data (Fig. 1).
Preliminary analysis of the dataset clearly demonstrated that treating for Varroa mites was a key factor in
determining overwintering survival across all three years (Fig. 2). For each of the three winter years, difference in
the survival of mite-treated and untreated honey bee colonies was evaluated using a one-sided t-test. For each of
the 3 years the evidence is to reject the null hypothesis that means were equal; when the colonies are treated the
average survival is higher (see Fig. 2). Only 17% of beekeepers did not treat their colony in some way. Because of
the clear effect of the treatment and the small number of untreated colonies, we chose to model only the treated
apiaries. Thus, the final dataset comprised 1429 colonies within 257 apiaries.
Weather and topographic variables. For each reported apiary location, we generated annual and seasonal
weather variables from 4-km gridded daily temperature and precipitation data37. The variables created include
standard bioclimatic and agronomic indices such as BIOCLIM38 that have been used in previous modeling stud-
ies (e.g., Ref.39). Agronomic indices include consecutive dry days and growing degree days, a measure of heat
accumulation over a base temperature of 5 °C. Only the variables most relevant for honey bees (rather than other
taxa) have been included in the study (Table 1). Bee-specific weather indices relevant for overwintering include
winter days within bee optimal thermoregulating temperature range (− 5° to 10 °C) and the number of winter
days suitable for flight and foraging, with maximum temperature above 16 °C and total precipitation below
3 mm (Table 1)9,38. Note that while there is little blooming in the winter months (December, January, February,
in our analysis) some plants in Pennsylvania do bloom during these times (such as witch hazel), and bees in the
northeastern United States begin brood rearing in late February9. Furthermore, bees take cleansing flight when
the weather permits to void their intestines and prevent pathogen and parasite transmission in the colony40.
Topographic variables were included in the analysis because they modify the local climate at finer scales than
Scientific Reports | (2021) 11:1553 | https://doi.org/10.1038/s41598-021-81051-8 3
Vol.:(0123456789)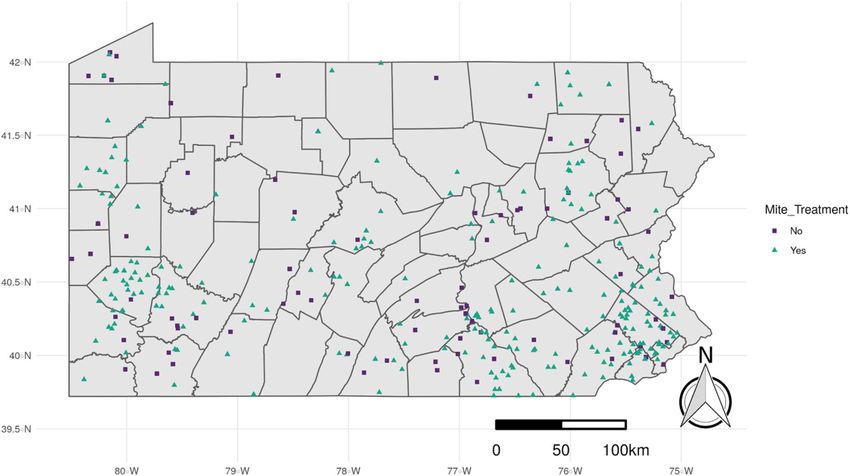
www.nature.com/scientificreports/
Figure 2. Survival of mite-treated and untreated honey bee colonies by year. In each of the three years, 80 out
of 375 (21%), 25 out of 377 (7%) and 192 out of 974 (20%) colonies were untreated (297 out of 1,726, or 17%
overall). In the white boxes the p-values results of the one-sided t-test for each year. Evidence rejects H0 in favor
of H1: the average survival is higher when the colonies are treated.
ata39. These were calculated from 30-m resolution gridded elevation
can be represented by the gridded climate d
41 42
data using GRASS GIS , and include slope, curvature, and the northerly and westerly components of aspect.
Forage resource index and insecticide toxic load. Two honey bee-specific distance-weighted landscape descrip-
tors were generated for each apiary using the 30 m resolution USDA-NASS Cropland Data Layer (CDL)43. The
Forage Resource Index (FRI was calculated for each floral season. This index describes the quality and abun-
dance of floral resources available for both managed and wild bees for each land use category25,26,44. Following
Koh et al. (2016), we generated the seasonal FRI at each apiary location using a weighted distance decay function
that extends to the 5-km foraging radius of honey bees45. The Insect Toxic Load (ITL) characterized the amount
of active ingredient used for each insecticide based on statewide records of per-hectare use by crop type, and
converted this to an aggregated insect toxic load using honey bee LD50s27. The same CDL data and distance-
weighting function were used for the FRI and ITL to maintain consistency. Although CDL is an annual product,
these indices integrate over large areas and are extremely highly correlated between years, so for simplicity we
only used 2017 indices in the model.
Statistical analyses. The survey data were extremely unbalanced, with 1429 colonies within 257 apiaries.
The apiaries contained from 1 to 34 colonies, with a median value of 3. Our objective was to predict survival at
the colony level, but we analyzed the data at both apiary and colony scales to ensure that results were consistent
at both levels. We used a binary classification to model survival at the colony scale: 0 for mortality, and 1 for
survival. Thus, if an apiary had 5 colonies in November and 3 of those colonies survived in April, each of the
3 surviving colonies was assigned a score of 1, while each of the 2 dead colonies was assigned a score of 0. To
provide comparable results, and because of the highly unbalanced dataset, we modeled survival at the apiary
scale as a binary variable as well. Thus, if any colonies in an apiary died, the apiary was assigned a score of 0. If
no colonies in an apiary died, the apiary was assigned a score of 1. A tenfold cross-validation across cutoff values
from 50 to 100% showed that the highest accuracy was obtained by modelling the survival with this 100% cutoff.
A probability Random Forest (RF), a flexible tree-based machine learning approach, was used to analyze
overwintering mortality in relation to environmental and landscape factors within the 1429 colonies that had
been treated for Varroa mites. Random Forests develop a large number of decision trees using a random sampling
of variables, then average across all trees to produce an ensemble (forest) fi t39,46. The RF technique is very effi-
47
cient when working with datasets comprising a large number of p redictors , and when the relationships among
variables are nonlinear or complex, because it is a flexible distribution-free m ethod48. Given the complexity and
nonlinearity of the dataset used in this study, RF was preferred to a linear regression method, and allowed the
development of a reliable empirical model without prior knowledge of the relationship between the survival and
the predictors49. Importantly for a study of this scope, RF models are robust to correlated predictors.
All analyses were conducted in R 3.6.250, using the ranger package 0.11.251 for RF models of survival prob-
ability and permutation-based variable importance, and the caret package 6.0-8452 for model evaluation. Vari-
able importance was calculated using the permutation-based method in the ranger package, which indicates the
prediction accuracy lost if that variable is omitted53,54. The form of the relationship between survival probability
and the major independent variables was assessed using partial dependence plots (pdp 0.7.0 p ackage55). All maps
56 57
presented in this manuscript were produced with the raster (3.0-12 ) and sp (1.4-0 ) packages.
Our initial intent was to train the model with the first 2 years of data and test it on the third, but the weather
was very different across the 3 years: 2016 was warm and dry, 2017 was warm and wet, and 2018 was very wet.
Instead, to ensure that the data used to train the model spanned the greatest possible range of weather conditions,
Scientific Reports | (2021) 11:1553 | https://doi.org/10.1038/s41598-021-81051-8 4
Vol:.(1234567890)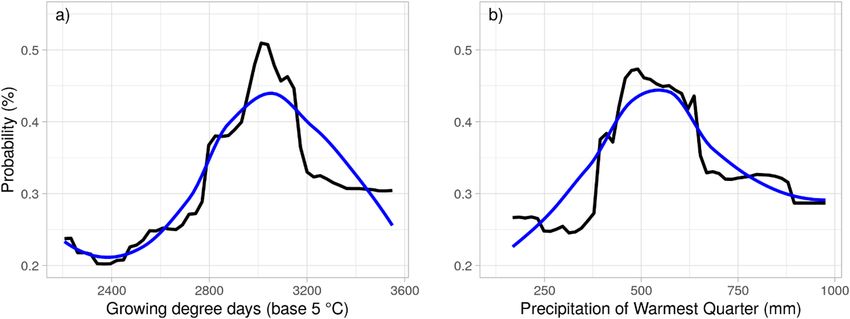
www.nature.com/scientificreports/
Variable description Unit Variable importance
Weather
BEE1: Winter minimum temperature °C 0.0151
BEE2: Winter total precipitation mm 0.0164
BEE3: Winter days within the bee-optimal temperature range − 5 °C to + 10 °C D 0.0111
BEE4: Winter days with maximum temperature above 16 °C and precipitation below 3 mm D 0.0119
BEE5: Winter minimum temperature variation °C 0.0118
BEE6: Autumn total precipitation mm 0.0128
Growing degree days (base 5 C) °C 0.0252
Days between rain events > 0.25 mm mm 0.0127
BIOCLIM 2: Mean diurnal temperature range °C 0.0151
BIOCLIM 3: Temperature isothermality 0.0196
BIOCLIM 4: Temperature seasonality °C 0.0132
BIOCLIM 5: Maximum temperature of warmest month °C 0.0201
BIOCLIM 6: Minimum temperature of coldest month °C 0.0131
BIOCLIM 7: Temperature annual range °C 0.0130
BIOCLIM 8: Mean temperature of wettest quarter °C 0.0140
BIOCLIM 9: Mean temperature of driest quarter °C 0.0147
BIOCLIM 12: Annual precipitation mm 0.0148
BIOCLIM 16: Precipitation of wettest quarter mm 0.0202
BIOCLIM 17: Precipitation of driest quarter mm 0.0122
BIOCLIM 18: Precipitation of warmest quarter mm 0.0213
BIOCLIM 19: Precipitation of coldest quarter mm 0.0157
Topography
Elevation m 0.0154
Slope 0.0126
Potential incident solar radiation, 21 Dec Wh × m − 2 × d − 1 0.0156
Profile curvature m−1 0.0111
Terrain curvature m−1 0.0110
Topographic wetness index 0.0116
East/West orientation of slope 0.0102
North/South orientation of slope 0.0103
Landscape
Distance-weighted Insect Toxic Load 0.0112
Distance-weighted Forage Quality autumn 0.0104
Management
Beekeeper years of experience 0.0040
Number of colonies in November 0.0057
Table 1. Weather and topographic variables hypothesized to affect honey bee overwintering survival. Weather
variables include both BIOCLIM38 and agronomic indices, as well as bee-specific variables developed for this
study (BEE#). Permutation variable importance values are from the full colony model; larger values are more
influential. The most important four variables are bold. Autumn: September, October, November. Winter:
December, January, February.
we used cross-validation stratified by year to train and evaluate the model. Ten repetitions of a tenfold cross-
validation were used to tune the model on a gridded parameter search with the number of trees between 2000
and 5000 on an increment of 500, and number of variables per tree (mtry) from 3 to 8. For both colony and api-
ary models, the best number of variables was 3, and best number of trees was 4000 and 4500 respectively; mtry
was more influential than number of trees. An independent set of ten repetitions of a tenfold cross-validation
using the tuned parameters was used to obtain the error estimates. The final model was fitted on the full dataset,
in order to obtain the most reliable estimates of variable importance and the best model for prediction. Such a
model overestimates accuracy, so cross-validation error estimates are given. These estimates show how the model
is likely to perform when presented with new data. The same cross-validation and analysis methods were used
at both the apiary and colony scales.
Ethics declaration. No humans or honey bees have been directly used.
Scientific Reports | (2021) 11:1553 | https://doi.org/10.1038/s41598-021-81051-8 5
Vol.:(0123456789)www.nature.com/scientificreports/
Figure 3. Prediction accuracy of the Random Forest model of overwintering survival probability from the
colony model, averaged by apiary for mapping purposes. The dataset used to generate the accuracy map
contained 1429 colonies within 257 apiaries. The color indicates the mean overall model accuracy at that apiary,
and the circle size is proportional to the number of colonies in November. The map has been generated by the
authors in R 3.6.250, using the s f72, the raster56, the ggplot273 and the cowplot74 packages.
Results
Actual
Full model Mortality Survival
Predicted
Mortality 337 (24%) 87 (6%)
Survival 192 (13%) 813 (57%)
Table 2. Confusion matrix for model predictions of colony-level honey bee overwintering survival for the full
Random Forest model.
As described in the methods, we created models using data both at the apiary and individual colony level. The
apiary model had cross-validated out-of-bag (OOB) error of 22% on the training data set, and a prediction
accuracy of 65.7% on the test data (95% confidence interval 59.6–76.15%); the colony model had an OOB error
of 19% and prediction accuracy of 73.3% (95% confidence interval 70.9–75.5%). More detailed assessments of
model performance and variable importance are only presented for the colony model, since variable importance
was similar for both models. Model accuracy was not notably related to geography within Pennsylvania (Fig. 3).
The four most important variables were: growing degree days, maximum temperature of the warmest quarter,
precipitation of the warmest and of the wettest quarter (Table 1). Based on the sorted variable importance for
all four models, growing degree days in the prior summer was the strongest predictor of overwintering survival;
this agronomic index of heat accumulation may relate to floral resource availability. Landscape (FRI and ITL)
and topographic factors did not contribute substantially to the colony survival model. The beekeeper’s years of
experience had no relationship to colony survival, though it was identified as important in other studies58. The
colony level model was nearly twice as likely to predict that colonies survived when they died than that they
died when they actually survived (Table 2), suggesting that there is an additional source of mortality we have
not considered.
The four most influential variables were further evaluated using partial dependence plots. These plots help
understand how the variable affects the prediction, more specifically they show the dependence pattern between
the probability of survival, and the variable investigated59,60, independent of all other variables in the model.
This kind of visualization is able to provide a powerful interpretation on how the variables affect the probability
of survival61.
Scientific Reports | (2021) 11:1553 | https://doi.org/10.1038/s41598-021-81051-8 6
Vol:.(1234567890)www.nature.com/scientificreports/
Figure 4. Partial dependence plot for the two variables that most explain overwintering survival in the
prediction analysis at the apiary level. Plot (a) describes the relationship between the growing degree days (along
the x axis) and the probability of overwintering survival (y axis), given all the other variables in the model. Plot
(b) describes the relationship between the precipitation during the warmest quarter (along the x axis) and the
probability of overwintering survival (y axis), given all the other variables in the model. In both the plots, the
black line represents the modeled relationship between survival and the variables, while the blue line shows a
spline-smoothed fit.
The partial dependence plot for growing degree days (Fig. 4a) shows a unimodal pattern: survival was high-
est at intermediate values. Maximum temperature of the warmest quarter also had a high importance value and
showed a similar partial dependence pattern to growing degree days and thus is not shown. Both precipitation of
the warmest quarter and of the wettest quarter were important, but the partial dependence plot is only presented
for precipitation of the warmest quarter as this variable was more important, and the other was very similar
(Fig. 4b). Precipitation also showed a unimodal relationship with survival; neither too dry nor too wet resulted
in greatest survival.
Because the climatic variables were the most important overall, we also modeled colony survival using only
weather variables, generating a prediction for each of the three winter years (Fig. 5) and over the PRISM period
of record, 1981–2019 (Fig. 6). The weather-only model performed about as well as the full model, with an OOB
error of 19% and 73% prediction accuracy (95% confidence interval 70.6–75.2%).
No part of Pennsylvania was always good or always bad for honey bee survival; there was substantial spatial
and temporal variability. The maps of predicted honey bee survival for the three winters studied showed consid-
erable variability, both between years and across the state (Fig. 5). Winter 2016–2017 showed a predicted mean
survival of 49.2% (range 5–97.6%); 2017–2018 had a predicted mean survival of 59.2%, (range 9.8–100%); and
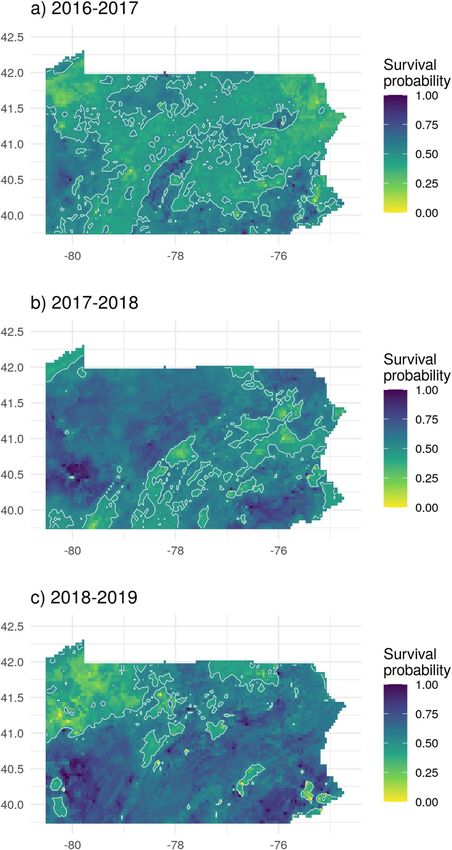
2018–2019 winter had a mean predicted survival of 59.7% (range 17–100%). Mean predicted long-term survival
probability across Pennsylvania based on weather data from 1981 to 2019 (Fig. 6) was 59.5% (range 5.3–100%).
The mean is consistent with values reported by the Bee Informed Team (53.5%)4.
Discussion
In colonies where beekeepers controlled for Varroa mite populations, weather factors, particularly summer
temperatures and precipitation for the prior year, were the strongest predictors of overwintering survival in
European honey bee colonies in Pennsylvania in our data set. Topographic factors and landscape quality factors
(forage and insecticide toxic load) were not important, contrary to expectations.
In our initial analysis, we found that beekeepers who used management practices to control Varroa mite
levels overall had higher winter survival. Winter mortality of honey bee colonies has been strongly correlated
with uncontrolled Varroa mite populations in multiple s tudies11,12. Parasitized, virus-infected bees have reduced
nutritional stores and a reduced lifespa62. Thus, high levels of Varroa reduce the probability of winter survival32.
In our data set, we found the majority of responding beekeepers did use management practices to control Var-
roa mite populations (83%), and thus we focused on these beekeepers for the rest of the analysis. However,
approximately 70% of new beekeepers (< 1 year of experience) treated for Varroa mites, while 77–89% of the
beekeepers in the other categories treated for Varroa (data not shown): thus, encouragement of new beekeepers
to implement Varroa management strategies could be beneficial.
There are several explanations as to why the landscape quality factors included in our analysis were not sig-
nificant predictors of winter survival. The foraging index is based on expert opinion, and the insecticide toxic
load index does not account for variation in local crop management practices or exposure rates of bees25–27,44,45;
thus, there is clearly room for improvement in methods for assessing the suitability of surrounding land use for
pollinator use. Moreover, supplementary feeding from the beekeeper (which was not included in the survey data)
may have mitigated impacts of floral resource availability, while insecticide exposure can have complex effects
on bees which may not be captured by winter survival r ates24.
Scientific Reports | (2021) 11:1553 | https://doi.org/10.1038/s41598-021-81051-8 7
Vol.:(0123456789)www.nature.com/scientificreports/
Figure 5. Weather-based prediction maps of the probability of honey bee colony survival from the weather-only colony
model for the most recent 3 years of PRISM data. Contour lines show the 0.5 probability level. The three maps show the
survival probability for Pennsylvania, based on the results of the weather-based model. The map (a) represents results from
year 2016, which had a mean annual temperature of 10.4 °C and a mean annual precipitation of 1007 mm across the state.
Map (b) represents results from year 2017, which had a mean temperature of 10.2 °C and a mean annual precipitation of
1205 mm. Map (c) represents results from year 2018, which had a mean annual temperature of 9.7 °C and mean annual
precipitation of 1653 mm. For the whole period of record, from 1981 to 2018, the mean annual temperature was 9.4 °C, with
a mean annual precipitation of 1082 mm. The maps have been generated by the authors in R 3.6.250, using the s f72, the raster56,
the ggplot273 and the c owplo74 packages.
Scientific Reports | (2021) 11:1553 | https://doi.org/10.1038/s41598-021-81051-8 8
Vol:.(1234567890)www.nature.com/scientificreports/
Figure 6. Mean probability of colony survival for 1981–2019 from the weather-only colony model. Contour
lines show the 0.5 probability level. The map has been generated by the authors in R 3.6.250, using the s f72, the
raster56, the ggplot273 and the cowplot74 packages.
It is important to note that there are many factors that can contribute to winter survival which were not
possible to assess, due to limited information about the colonies used in this analysis. In Europe, for example,
the genotype of the colony influences its survival rates, and colonies from local stock perform better63. In our
previous studies, however, we did not find an effect of colony genotype on winter survival in Pennsylvania: rather,
colony size was a major factor64. Colony size can be influenced by the surrounding landscape conditions, but
may also be influenced by beekeeper practices and the origin of the colony—for example, if a colony is initiated
earlier in the growing season, it reaches a larger size in the fall and is more likely to survive the winter9. Queen
age and quality can also influence winter survival11 Moreover, the methods used for controlling Varroa popula-
tions, the timing of application and the conditions of application (including weather conditions) can influence
winter survival65. Even the relative distribution of the colonies within the apiary can influence survival, likely
by influencing disease dynamics: colonies in “low density” apiaries had higher winter survival than colonies in
“high density” apiaries66. Finally, the survey did not include information about levels of or evidence for parasites
or pathogens, and thus we could not evaluate whether these parameters correlated with survival. While citizen
science data is a powerful tool to generate the necessary large and varied data sets needed for studies of the effects
of landscape and weather conditions on bee health, there are limitations in the extent of the data that can be
collected36. Future surveys can seek to collect additional information to address these issues.
Despite the limitations in the data set, the importance of weather conditions in predicting winter bee sur-
vival are quite clear from our analysis, and consistent with results from previous studies in other countries. In
Austria, Switanek et al.15 found that hot, dry summers reduced overwintering survival. Similarly, studies in the
Netherlands found reduced survival with increased annual mean t emperatures14. In colonies in Belgium, more
frost free days were associated with positive survival outcomes, while more flying days were associated with
negative outcomes33. Our approach allowed for a more nuanced analysis of climatic variables, and we found
adverse effects of both too-cool and too-hot summers. This could be the result of effects on plant flowering
patterns (flowering could be reduced in both cool and hot conditions), which could negatively effect colony
growth. Periods of drought can dramatically decrease weight gain in colonies in the summer67. Alternatively,
mismatches between colony behavior (in terms of timing of brood rearing, which is triggered by temperature
conditions) and local flowering patterns can also influence colony growth, by reducing nectar collection and
honey production68. Smaller colonies are less likely to survive the w inter64. Additionally, altered colony behavior
as a result of environmental conditions can result in increased disease levels. In a study in Germany, bee colonies
relocated to warmer or cooler regions exhibit differences in brood rearing, and colonies with longer period of
brood rearing had higher levels of Varroa68. Thus, longer summers could result in high Varroa levels in the fall,
which could negatively affect winter survival. Evaluation of colony growth patterns throughout the season using
automated hive scales may provide insights into how weather conditions during the summer are influencing fall
colony size and winter m ortality21,69.
Interestingly, topographical features were not important variables in predicting bee winter survival. While
topographical features should influence the microclimate surrounding the colony, it is possible that the forag-
ing range of honey bees (which can span several kilometers from the colony70) reduce any observed influence
of microclimate on forage or habitat conditions. Additionally, colony thermoregulatory behavior may have
mitigated the effects of m icroclimate8,10.
Scientific Reports | (2021) 11:1553 | https://doi.org/10.1038/s41598-021-81051-8 9
Vol.:(0123456789)www.nature.com/scientificreports/
The 3 years of data that we had available undoubtedly does not represent the full range of weather conditions
possible in Pennsylvania. Thus, as additional years of data become available and are included in the model, the
ability to predict outcomes will be improved. Nonetheless, this model worked well in the 3 years for which it
was developed, with an acceptable accuracy given the extreme variability within the dataset, and the multitude
of factors that affect overwintering survival.
Because the important variables were all weather-related, we were able to develop a predictive RF model
created without landscape or topographic variables that was equally as accurate as the full model. Doing so
reduced the data needs for the predictive model, and simplified analysis and mapping. Because it does not rely
on landscape or management factors, this model can be used to characterize changes in overwintering survival
with the changing climate independent of other factors. With slight modifications to use current data, this model
has been used to develop a real-time tool to predict honey bee survival probability as a function of G DD71. The
tool (BeeWinterWise) has been incorporated into the Beescape decision support system (https://beescape.org/),
used by beekeepers and technical advisors. As apparent from Fig. 5, there is substantial variation across different
regions of Pennsylvania and among years, and thus it is critical to develop site-specific decision support tools.
The presented model can be used to predict the probability of overwintering success, both for the current
year and as a function of projected future climate change scenarios. The modeling framework used allows for
the quantification of variable importance. Thus, modeling results can be used to develop decision support tools
for overwintering survival, to better understand the roles of weather and landscape on honey bee success, and
to characterize the effects of climate change on honey bee survival in the future. To the best of our knowledge
this is the first study on honey bee overwintering survival that combines weather, topography, and derived land
use factors. Our results, within the study limitations presented above, demonstrate both the predictive power
of weather variables on analyses of honey bee overwintering survival, and the efficacy of addressing this type
of question with machine learning methods such as Random Forest that are capable of identifying complex
nonlinear relationships with correlated predictors.
Data availability
The anonymized survey data with corresponding weather and topographic data (geographic information is
missing for privacy concerns) are being submitted as Supplementary Material (Supplementary Table S2). The
columns’ names in Supplementary Table S2 correspond to the variables described in Table 1. Spring year and
binary survival variables have been included in Supplementary Table S2.
Received: 23 September 2020; Accepted: 1 January 2021
References
1. Calderone, N. W. Insect pollinated crops, insect pollinators and US agriculture: Trend analysis of aggregate data for the period
1992–2009. PLoS ONE 7, 24–28 (2012).
2. Chopra, S. S., Bakshi, B. R. & Khanna, V. Economic dependence of U.S. industrial sectors on animal-mediated pollination service.
Environ. Sci. Technol. 49, 14441–14451 (2015).
3. USDA-National Agricultural Statistics Service Information. Honey. (2019).
4. Bee Informed Team. Loss & Management Survey. https://beeinformed.org/citizen-science/loss-and-management-survey/ (2019).
5. Seitz, N. et al. Encuesta nacional sobre la pérdida anual de colmenas de abejas manejadas durante 2014–2015 en los EEUU. J. Apic.
Res. 54, 292–304 (2015).
6. Brodschneider, R. et al. Multi-country loss rates of honey bee colonies during winter 2016/2017 from the COLOSS survey. J. Apic.
Res. 57, 452–457 (2018).
7. Heinrich, B. Y. B. The mechanisms and energetics of honeybee swarm temperature regulation. J. Exp. Biol. 91, 25–55 (1981).
8. Döke, M. A., Frazier, M. & Grozinger, C. M. Overwintering honey bees: Biology and management. Curr. Opin. Insect Sci. 10,
185–193 (2015).
9. Seeley, T. D. & Visscher, P. K. Survival of honeybees in cold climates: The critical timing of colony growth and reproduction. Ecol.
Entomol. 10, 81–88 (1985).
10. Currie, R. W., Spivak, M. & Reuter, G. S. Wintering management of honey bee colonies. In The Hive and the Honey Bee 2015
(Dadant & Sons, Williamsport, 2015).
11. Genersch, E. et al. The German bee monitoring project: A long term study to understand periodically high winter losses of honey
bee colonies. Apidologie 41, 332–352 (2010).
12. van Dooremalen, C. et al. Winter survival of individual honey bees and honey bee colonies depends on level of varroa destructor
infestation. PLoS ONE 7, e36285 (2012).
13. Morawetz, L. et al. Health status of honey bee colonies (Apis mellifera) and disease-related risk factors for colony losses in Austria.
PLoS ONE 14, 1–28 (2019).
14. Yasrebi-de Kom, I. A. R., Biesmeijer, J. C. & Aguirre-Gutiérrez, J. Risk of potential pesticide use to honeybee and bumblebee
survival and distribution: A country-wide analysis for The Netherlands. Divers. Distrib. 25, 1709–1720 (2019).
15. Switanek, M., Crailsheim, K., Truhetz, H. & Brodschneider, R. Modelling seasonal effects of temperature and precipitation on
honey bee winter mortality in a temperate climate. Sci. Total Environ. 579, 1581–1587 (2017).
16. Ricigliano, V. A. et al. Honey bee colony performance and health are enhanced by apiary proximity to US Conservation Reserve
Program (CRP) lands. Sci. Rep. 9, 1–11 (2019).
17. Clermont, A., Eickermann, M., Kraus, F., Hoffmann, L. & Beyer, M. Correlations between land covers and honey bee colony losses
in a country with industrialized and rural regions. Sci. Total Environ. 532, 1–13 (2015).
18. Sponsler, D. B. & Johnson, R. M. Honey bee success predicted by landscape composition in Ohio, USA. PeerJ https://doi.
org/10.7717/peerj.838 (2015).
19. Wintermantel, D., Odoux, J. F., Chadœuf, J. & Bretagnolle, V. Organic farming positively affects honeybee colonies in a flower-poor
period in agricultural landscapes. J. Appl. Ecol. 56, 1960–1969 (2019).
20. Dolezal, A. G., Clair, A. L. S., Zhang, G., Toth, A. L. & O’Neal, M. E. Native habitat mitigates feast–famine conditions faced by
honey bees in an agricultural landscape. Proc. Natl. Acad. Sci. U. S. A. 116, 25147–25155 (2019).
21. Sponsler, D. B., Shump, D., Richardson, R. T. & Grozinger, C. M. Characterizing the floral resources of a North American metropolis
using a honey bee foraging assay. Ecosphere 11, (2020).
Scientific Reports | (2021) 11:1553 | https://doi.org/10.1038/s41598-021-81051-8 10
Vol:.(1234567890)www.nature.com/scientificreports/
22. Requier, F. et al. Honey bee diet in intensive farmland habitats reveals an unexpectedly high flower richness and a major role of
weeds. Ecol. Appl. 25, 881–890 (2015).
23. Colwell, M. J., Williams, G. R., Evans, R. C. & Shutler, D. Honey bee-collected pollen in agro-ecosystems reveals diet diversity, diet
quality, and pesticide exposure. Ecol. Evol. 7, 7243–7253 (2017).
24. Sponsler, D. B. et al. Pesticides and pollinators: A socioecological synthesis. Sci. Total Environ. 662, 1012–1027 (2019).
25. Kennedy, C. M. et al. A global quantitative synthesis of local and landscape effects on wild bee pollinators in agroecosystems. Ecol.
Lett. 16, 584–599 (2013).
26. Koh, I. et al. Modeling the status, trends, and impacts of wild bee abundance in the United States. Proc. Natl. Acad. Sci. U. S. A.
113, 140–145 (2016).
27. Douglas, M., Sponsler, D., Lonsdorf, E. & Grozinger, C. Rising insecticide potency outweighs falling application rate to make US
farmland increasingly hazardous to insects. Sci. Rep. https://doi.org/10.1101/715763 (2019).
28. Schweiger, O. et al. Multiple stressors on biotic interactions: How climate change and alien species interact to affect pollination.
Biol. Rev. 85, 777–795 (2010).
29. Bartomeus, I. et al. Climate-associated phenological advances in bee pollinators and bee-pollinated plants. Proc. Natl. Acad. Sci.
U. S. A. 108, 20645–20649 (2011).
30. Scaven, V. L. & Rafferty, N. E. Physiological effects of climate warming on flowering plants and insect pollinators and potential
consequences for their interactions. Curr. Zool. 59, 418–426 (2013).
31. Mu, J. et al. Artificial asymmetric warming reduces nectar yield in a Tibetan alpine species of Asteraceae. Ann. Bot. 116, 899–906
(2015).
32. Dainat, B., Evans, J. D., Chen, Y. P., Gauthier, L. & Neumanna, P. Dead or alive: Deformed wing virus and varroa destructor reduce
the life span of winter honeybees. Appl. Environ. Microbiol. 78, 981–987 (2012).
33. Van Esch, L. et al. Multivariate landscape analysis of honey bee winter mortality in Wallonia, Belgium. Environ. Model. Assess. 25,
441–452 (2020).
34. Heigl, F., Kieslinger, B., Paul, K. T., Uhlik, J. & Dörler, D. Toward an international definition of citizen science. Proc. Natl. Acad.
Sci. U. S. A. 116, 8089–8092 (2019).
35. Pocock, M. J. O., Chapman, D. S., Sheppard, L. J. & Roy, H. E. Choosing and using citizen science. Centre for Ecology & Hydrology
https: //www.ceh.ac.uk/sites/ defaul t/files/ sepa_choosi ngand
using citiz ensci ence_ intera ctive _4web_final_ amende d-blue1. pdf (2014).
36. Van Der Zee, R. et al. Standard survey methods for estimating colony losses and explanatory risk factors in Apis mellifera. J. Apic.
Res. 52, 1–36 (2013).
37. PRISM Climate Group. Oregon State University. http://www.prism.oregonstate.edu/ (2020).
38. Busby, J. BIOCLIM: A bioclimate analysis and prediction system. Plant Prot. Q. 6, 8–9 (1991).
39. Wang, A., Goslee, S. C., Miller, D. A., Sanderson, M. A. & Gonet, J. M. Topographic variables improve climatic models of forage
species abundance in the northeastern United States. Appl. Veg. Sci. 20, 84–93 (2017).
40. Sparks, T. H. et al. Advances in the timing of spring cleaning by the honeybee Apis mellifera in Poland. Ecol. Entomol. 35, 788–791
(2010).
41. United States Geological Survey. National Elevation Dataset. https://gdg.sc.egov.usda.gov/ (2014).
42. GRASS. Software, Version 7.0 Open source Geospatial Foundation Electronic Document. (2018).
43. Boryan, C., Yang, Z., Mueller, R. & Craig, M. Monitoring US agriculture: The US department of agriculture, national agricultural
statistics service, cropland data layer program. Geocarto Int. 26, 341–358 (2011).
44. Lonsdorf, E. et al. Modelling pollination services across agricultural landscapes. Ann. Bot. 103, 1589–1600 (2009).
45. Beekman, M. & Ratnieks, F. L. W. Long-range foraging by the honey-bee, Apis mellifera L.. Funct. Ecol. 14, 490–496 (2000).
46. Breiman, L. Random forests. Mach. Learn. 45, 5–32 (2001).
47. Berk, R. A. Statistical Learning from a Regression Perspective. (Springer, 2008). https://doi.org/10.1007/978-3-319-44048-4.
48. Shoemaker, K. T. et al. A machine-learning approach for extending classical wildlife resource selection analyses. Ecol. Evol. 8,
3556–3569 (2018).
49. Auret, L. & Aldrich, C. Interpretation of nonlinear relationships between process variables by use of random forests. Miner. Eng.
35, 27–42 (2012).
50. R Core Team. R: A language and environment for statistical computing. R Foundation for Statistical Computing, Vienna, Austria.
Version 3.6.0. https://www.R-project.org/. (2019).
51. Wright, M. N. & Ziegler, A. Ranger: A fast implementation of random forests for high dimensional data in C++ and R. J. Stat.
Softw. 77, 2020 (2017).
52. Kuhn, M. et al. caret: Classification and Regression Training. Version 6.0-86. https://CRAN.R-project.org/package=caret. (2020).
53. Wright, M. N., Wager, S. & Probst, P. ranger: A Fast Implementation of Random Forests. Version 0.12.1. https://CRAN.R-proje
ct.org/package=ranger. (2020).
54. Altmann, A., Toloşi, L., Sander, O. & Lengauer, T. Permutation importance: A corrected feature importance measure. Bioinformatics
26, 1340–1347 (2010).
55. Greenwell, B. M. pdp: An R package for constructing partial dependence plots. R J. 9, 421–436 (2017).
56. Hijmans, R. J. et al. raster: Geographic Data Analysis and Modeling. Version 3.3-13. https://CRAN.R-project.org/package=raste
r. (2020).
57. Pebesma, E. et al. sp: Classes and Methods for Spatial Data. Version 1.4-2. https://CRAN.R-project.org/package=sp. (2020).
58. Jacques, A. et al. A pan-European epidemiological study reveals honey bee colony survival depends on beekeeper education and
disease control. PLoS ONE 12, 1–17 (2017).
59. Cutler, D. R. et al. Random Forests for Classification in Ecology Published by: Ecological Society of America. Ecology 88, 2783–2792
(2007).
60. Hastie, T., Tibshirani, R. & Friedman, J. The Elements of Statistical Learning. Data mining, Inference, and Prediction. (Springer, New
York, 2009). https://doi.org/10.1007/b94608_4.
61. Friedman, J. H. Greedy function approximation: A gradient boosting machine. Ann. Stat. 29, 1189–1232 (2001).
62. Amdam, G. V., Hartfelder, K., Norberg, K., Hagen, A. & Omholt, S. W. Altered physiology in worker honey bees (Hymenoptera:
Apidae) infested with the mite Varroa destructor (Acari: Varroidae): A factor in colony loss during overwintering?. J. Econ. Entomol.
97, 741–747 (2004).
63. Büchler, R. et al. The influence of genetic origin and its interaction with environmental effects on the survival of Apis mellifera L.
Colonies in Europe. J. Apic. Res. 53, 205–214 (2014).
64. Döke, M. A., McGrady, C. M., Otieno, M., Grozinger, C. M. & Frazier, M. Colony size, rather than geographic origin of stocks,
predicts overwintering success in honey bees (Hymenoptera: Apidae) in the Northeastern United States. J. Econ. Entomol. 112,
525–533 (2019).
65. Beyer, M. et al. Winter honey bee colony losses, Varroa destructor control strategies, and the role of weather conditions: Results
from a survey among beekeepers. Res. Vet. Sci. 118, 52–60 (2018).
66. Dynes, T. L., Berry, J. A., Delaplane, K. S., Brosi, B. J. & De Roode, J. C. Reduced density and visually complex apiaries reduce
parasite load and promote honey production and overwintering survival in honey bees. PLoS ONE 14, 1–16 (2019).
67. Flores, J. M. et al. Effect of the climate change on honey bee colonies in a temperate Mediterranean zone assessed through remote
hive weight monitoring system in conjunction with exhaustive colonies assessment. Sci. Total Environ. 653, 1111–1119 (2019).
Scientific Reports | (2021) 11:1553 | https://doi.org/10.1038/s41598-021-81051-8 11
Vol.:(0123456789)www.nature.com/scientificreports/
68. Nürnberger, F., Härtel, S. & Steffan-Dewenter, I. Seasonal timing in honey bee colonies: Phenology shifts affect honey stores and
varroa infestation levels. Oecologia 189, 1121–1131 (2019).
69. Marchal, P. et al. Automated monitoring of bee behaviour using connected hives: Towards a computational apidology. Apidologie
51, 356–368 (2020).
70. Couvillon, M. J., Schürch, R. & Ratnieks, F. L. W. Waggle dance distances as integrative indicators of seasonal foraging challenges.
PLoS ONE 9, 1–7 (2014).
71. BeescapeTeam. Bee Winter Wise. https://www.pollinators.psu.edu/wintersurvival.html (2020).
72. Pebesma, E. et al. sf: Simple Feature for R. Version 0.9-6. https://CRAN.R-project.org/package=sf. (2020).
73. Wickham, H. et al. ggplot2: Create elegant data visualisations using the grammar graphics. Version 3.3.2. https://CRAN.R-proje
ct.org/package=ggplot2. (2020).
74. Wilke, C. O. cowplot: Streamlined plot theme and plot annotations for ‘ggplo2’. Version 1.1.0. https://CRAN.R-project.org/packa
ge=cowplot. (2020).
Acknowledgements
We appreciate the willingness of Pennsylvania beekeepers to contribute the data used in these analyses, and
specifically the support of Ken Hoover, who manages the Pennsylvania State Beekeepers Association Winter
Loss Survey. We are also grateful for the very helpful discussions with M. Douglas, M Kammerer, D.J. McNeil,
G. Quinlan, M.A. Cremona, and G. Franch.
Author contributions
M.C. and S.C.G. contributed to all aspects of the work: writing, background review, data development and analy-
ses, and mapping. C.M.G. contributed to writing, data development, and background review. D.A.M. contributed
to data development and analyses. All the authors contributed to project planning and have read and approved
the final version of the manuscript.
Funding
This work was funded by grants from USDA-NIFA-AFRI (#2018-67013-27538) and the Foundation for Food
and Agricultural Research (#549032).
Competing interests
The authors declare no competing interests.
Additional information
Supplementary Information The online version contains supplementary material available at https://doi.
org/10.1038/s41598-021-81051-8.
Correspondence and requests for materials should be addressed to M.C. or S.C.G.
Reprints and permissions information is available at www.nature.com/reprints.
Publisher’s note Springer Nature remains neutral with regard to jurisdictional claims in published maps and
institutional affiliations.
Open Access This article is licensed under a Creative Commons Attribution 4.0 International
License, which permits use, sharing, adaptation, distribution and reproduction in any medium or
format, as long as you give appropriate credit to the original author(s) and the source, provide a link to the
Creative Commons licence, and indicate if changes were made. The images or other third party material in this
article are included in the article’s Creative Commons licence, unless indicated otherwise in a credit line to the
material. If material is not included in the article’s Creative Commons licence and your intended use is not
permitted by statutory regulation or exceeds the permitted use, you will need to obtain permission directly from
the copyright holder. To view a copy of this licence, visit http://creativecommons.org/licenses/by/4.0/.
© The Author(s) 2021
Scientific Reports | (2021) 11:1553 | https://doi.org/10.1038/s41598-021-81051-8 12
Vol:.(1234567890)You can also read