The age of the dragon: Chinese competition and the pricing behavior of the Italian firms
←
→
Page content transcription
If your browser does not render page correctly, please read the page content below

Ministry of Economy and Finance

 Department of the Treasury

                              Working Papers
                                        N°4 - August 2010

                                                             ISSN 1972-411X

           The age of the dragon:
Chinese competition and the pricing
        behavior of the Italian firms
                 Matteo Bugamelli, Silvia Fabiani, Enrico Sette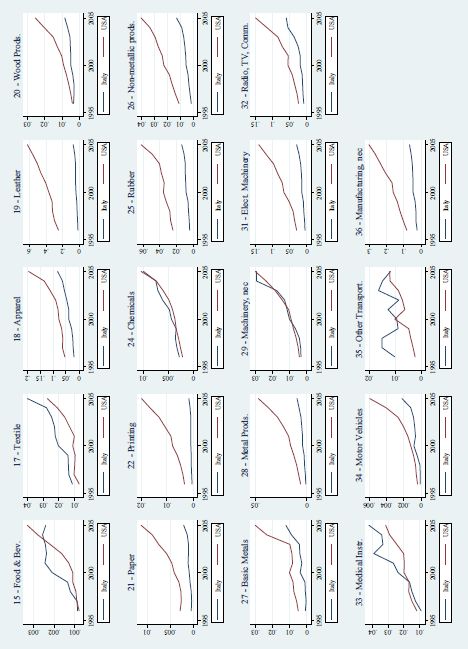
Working Papers
    The working paper series promotes the dissemination of economic research produced in
    the Department of the Treasury (DT) of the Italian Ministry of Economy and Finance
    (MEF) or presented by external economists on the occasion of seminars organised by
    MEF on topics of institutional interest to the DT, with the aim of stimulating comments
    and suggestions.
    The views expressed in the working papers are those of the authors and do not
    necessarily reflect those of the MEF and the DT.

© Copyright:
   2010, Matteo Bugamelli, Silvia Fabiani and Enrico Sette.

   The document can be downloaded from the Website www.dt.tesoro.it and freely
   used, providing that its source and author(s) are quoted.

   Editorial Board: Lorenzo Codogno, Mauro Marè, Libero Monteforte, Francesco Nucci, Franco Peracchi
   Organisational coordination: Marina Sabatini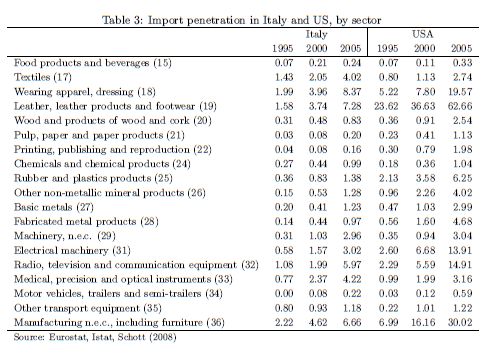
The age of the dragon:
    Chinese competition and the pricing behavior of
                    Italian firms1
                               Matteo Bugamelli, Silvia Fabiani, Enrico Sette*

Abstract

    In this paper we use a unique dataset of Italian manufacturing firms that includes firm-level
price data to investigate whether increased penetration of Chinese products affects the
competitive environment in an advanced country like Italy. Instrumenting import penetration
from China to account for potential endogeneity biases, we find that the increase of the
penetration of Chinese products has a negative and sizeable causal impact on Italian firms~
price dynamics: firms operating in a sector where such penetration is 10 per cent higher contain
output price growth by about 0.35 percentage points per year. In line with the factor proportions
hypothesis we show that this impact is stronger on less skill-intensive sectors. Finally, as
predicted by the recent theoretical trade literature with heterogeneous firms, we find that,
especially in low skill-intensive sectors, less productive firms are the ones that are forced to
reduce prices more.

JEL Classification: F14, F15, L2, E31.
Keywords: import penetration, competition, China, prices and productivity.

(*) Bank of Italy, Economic Research Department.
1
  We wish to thank Andrew Bernard, Andrea Brandolini, Sergio de Nardis, Giorgio Gobbi, John Halti¬wanger, Keith
Head, Saul Lach, Francesca Lotti, Rocco Macchiavello, Francesco Nucci, Giuseppe Parigi, John Romalis, Alfonso
Rosolia and Fabiano Schivardi, and participants at seminars at EEA2009, EIEF, ETSG2008, LMDG2008, ITSG2009,
University of Perugia, Italian Ministry of Economy and Finance and Bank of Italy for their comments. We also thank
Angela Gattulli for invaluable research assistance, Ste¬fano Federico for providing us the data on import penetration in
Italy and Peter Schott for making the US trade and production data available on his website. This paper has previously
circulated with the title of "The Pro-Competitive Effect of Imports from China: an Analysis of Firm-Level Price Data". We
are solely responsible for all errors. The views expressed herein are those of the authors and do not necessarily reflect
those of the Bank of Italy. Corresponding author: Matteo Bugamelli - Tel. +39 06 4792 2667. Email address:
matteo.bugamelli@bancaditalia.it

                                                                                     DRAFT FOR DISCUSSION ONLY
     3                                                                                      Please do not quote or distribute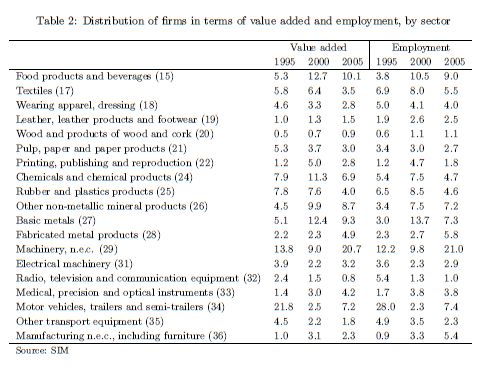
CONTENTS

1          INTRODUCTION .............................................................................................................. 5
2          EMPIRICAL SPECIFICATION ......................................................................................... 7
    2.1       CAUSALITY ...................................................................................................................... 9
3          THE DATA ..................................................................................................................... 10
    3.1       FIRM-LEVEL DATA........................................................................................................... 11
    3.2       SECTORAL DATA ............................................................................................................ 13
4          EMPIRICAL RESULTS .................................................................................................. 14
    4.1       BASE REGRESSION......................................................................................................... 15
    4.2       ROBUSTSNESS .............................................................................................................. 16
5          EXTENSIONS ................................................................................................................ 17
    5.1       HETEROGENEITY ACROSS SECTORS ................................................................................ 17
    5.2       HETEROGENEITY ACROSS FIRMS ..................................................................................... 19
6          CONCLUSIONS ............................................................................................................. 21
REFERENCES ............................................................................................................................ 34

FIGURES

Fig. 1        Distribution of annual price changes, by year ............................................................. 22
Fig. 2        Distribution of price changes over all year .................................................................. 23
Fig. 3        Annual price change, sectoral averages: SIM vs official production prices ................ 24
Fig. 4        China’s import penetration ........................................................................................... 25

                                                                                                     DRAFT FOR DISCUSSION ONLY
    4                                                                                                       Please do not quote or distribute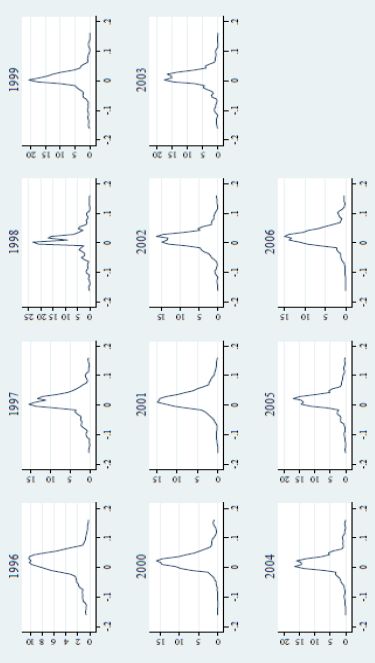
1            INTRODUCTION

     Does increased penetration of Chinese products affect the competitive environment in
advanced countries? More precisely, does product competition from China cause a reduction of
firms' prices? Are these effects stronger in less skill-intensive sectors where China holds a
comparative advantage? Are they stronger on less productive firms? We answer positively to all
these questions using a unique micro-level dataset of Italian manufacturing firms over the
period 1994-2006.
     The pro-competitive effect of trade is theoretically well-grounded. In the seminal paper by
Krugman (1979), trade integration raises the number of product varieties available, thereby
increasing competition. Recent trade models (Bernard, Eaton, Jensen and Kortum, 2003; Melitz,
2003; Melitz and Ottaviano, 2008) have proposed a new and richer perspective emphasizing
the importance of firm heterogeneity. In these models enhanced foreign competition raises
aggregate industry productivity by means of within-industry reallocation of resources from low-
to high-productivity firms. The empirical support to the pro-competitive effect of trade is growing
and, following theoretical developments, has progressively restricted the focus from countries to
                          2
sectors and then to firms .
     In this paper, we address this issue focusing on the impact of foreign competition on Italian
firms' prices. We estimate a model of firm-level pricing that accounts for demand and cost
shocks, for domestic and foreign competition, for firms' size and productivity. We distinguish
between competition from China and from the rest of the world and find a sizeable effect of the
former: Italian firms operating in a sector where import penetration from China is 10 per cent
higher contain output price growth by 0.34-0.38 percentage points per year. We then exploit the
sectoral and firm-level dimension of our dataset and test whether this effect is heterogeneous
across sectors and firms. Confirming the predictions brought forward by a standard Heckscher-
Ohlin model, we find that Chinese competitive pressures are stronger in less skill-intensive
industries, where China holds a comparative advantage thanks to its relative abundance of
unskilled labor (Schott, 2008). We do not find, instead, any empirical support to the hypothesis
that it is easier to escape from low- wage competition in sectors with more scope for quality
differentiation (Khandelwal, 2010). In line with recent international trade models with
heterogenous firms, our results show that the effect of stepped-up competition of Chinese
provenance is stronger on less productive firms, in particular within low skill-intensive sectors.
     The primary contribution of this paper to the empirical literature hinges upon the use of firm-
level actual price data. Thanks to our focus on prices, we complement firm-level analysis on the
effects of import competition from low-wage countries on quantity-based variables such as
output, employment, and firms' survival. Bernard, Jensen and Schott (2006a) use US plant-level
manufacturing data and show that sectoral exposure to increasing imports from low-wage
countries is positively (negatively) correlated with the probability of plant death (employment

2
    See Bernard, Jensen, Redding and Schott (2007) for a comprehensive survey.

                                                                                 DRAFT FOR DISCUSSION ONLY
      5                                                                            Please do not quote or distribute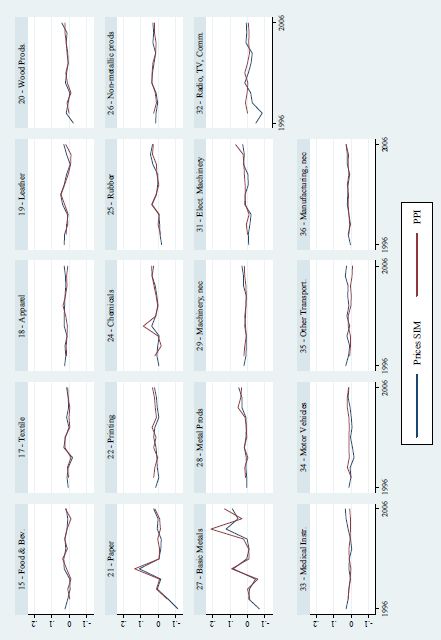
3
growth) . They also find that these effects are stronger in less capital- and skill-intensive sectors
and on low-productivity firms. Bloom, Draca and Van Reenen (2008) use firm-level data from 11
EU countries and find that Chinese import competition reduces employment growth and
increases, though to a lesser extent, the propensity to adopt ICT and plant exit. Applying
Bernard, Jensen and Schott (2006a) empirical strategy on Italian sectoral data, Federico (2010)
finds that a one standard deviation increase in low-wage import penetration in a given sector
decreases annual employment by 4 per cent and this effect is smaller in sectors that are more
capital- and skill-intensive and have a longer quality ladder.
     With respect to these studies, we provide a direct test of the first step of the reallocation
process proposed by trade models with heterogeneous firms: stronger foreign competition
                                                      4
forces domestic firms to reduce prices and profits until low-productivity firms get closer to their
break-even and eventually exit the market, thus giving a start to a redistribution of market
shares that leads to sectoral productivity improvements. Our firm-level evidence on prices (and,
                       5
indirectly, markups) is particularly important because, as pointed out by Bernard, Jensen,
Redding and Schott (2007), "welfare gains arising from the reallocation of market shares toward
high-productivity firms, may be magnified if the increase in the product market competition
induced by trade liberalization leads to lower markups of price over marginal costs".
     Recently, a number of papers have analysed the price effect of import competition, but they
have done so on the basis of sectoral data. Using a panel of manufacturing industries for seven
European countries during the 1990s, Chen, Imbs and Scott (2009) show that increased imports
raise industry productivity, reduce industry markups, (temporarily) slow down (production) prices.
Auer and Fischer (2010) find that US industrial sectors more exposed to competition from
emerging countries record higher productivity growth, as well as lower price inflation. Using the
same empirical framework, Auer, Degen and Fischer (2010) confirm the impact of import
penetration from low-wage countries, and China in particular, on European producer prices.
Compared to these studies, the firm- level dimension of our paper allows to analyse whether
increased penetration of Chinese imports has a differential impact on heterogenous firms.
Moreover, it allows to control for firm-specific features affecting price dynamics beyond time and
sector fixed effects.
     We focus specifically on China, whereas most of the existing empirical literature has
analyzed the effects of import penetration from low-wage countries. We believe that this has two
main advantages. First, the rise of China as a global player in world trade is a dramatic and well
identified shock. Schott (2008) shows that in the last 30 years Chinese products' penetration in
the US has been impressive, much higher than that recorded by the Latin American countries
altogether: China's share of total exports to the US has grown by almost 20 percentage points,
against only 8 of Mexico. According to WTO data, the Chinese share of total world exports of

3
  Bernard, Jensen and Schott (2006b) perform a similar exercise using as an external trade shock a reduction of
inbound trade costs. They find that this shock is positively associated with industry- and firm-level productivity growth,
the probability of plant death, the probability of entry of new exporters, and export growth by incumbent exporters.
4
 In the seminal paper by Melitz (2003) markups are time-invariant. This hypothesis has been relaxed by
Melitz and Ottaviano (2008).
5
 Through the use of actual prices and the estimation of a pricing equation that controls for all deter -
minants of costs, we can also draw, though indirectly, conclusions on t he effects of import competition on
markups without appealing to estimation methods as the one proposed by Hall (1988) and used by
Abraham, Konings and Vanormelingen (2009) to show that import competition from low -wage countries
reduces markups and workers' barganining power among Belgian firms.

                                                                                       DRAFT FOR DISCUSSION ONLY
    6                                                                                         Please do not quote or distribute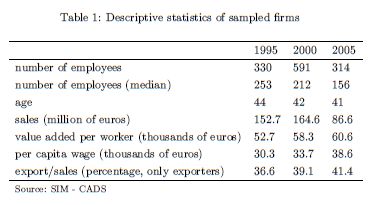
6
manufacturing goods increased from 1.9 per cent in 1990 to 9.6 in 2005 . On the contrary,
import penetration from some low-wage countries (especially African countries) is still pretty low
and shows little dynamics when compared to China, at least in Italy: on the basis of the less
restrictive definition of low-wage countries implemented by Federico (2010) on Italian data -
those where GDP per capita is less than 10 per cent that of the US in 2006, whereas Bernard,
Jensen and Schott (2006a) and Khandelwal (2010) adopt a 5 per cent threshold - China
accounts for above 40 per cent of total low-wage imports.
     Second, as shown by Schott (2008), a product-level comparison between China and other
OECD countries' exports to the US reveals a very similar product specialization, but Chinese
prices are much lower. This suggests that competitive pressures exerted by China on world
markets are in the same product range as advanced countries and mostly price-based, thus
making our investigation of firms' price reactions particularly appropriate. The similarity of
product specialization is particularly high in the case of Italy, since both Chinese exports and
Italian production are concentrated in less technologically advanced sectors such as textile,
apparel, leather, footwear and furniture.
     In the empirical analysis we deal with possible endogeneity biases caused by the evolution
of price competitiveness of Italian firms feeding back into export patterns of China and other
countries in Italy, as well as by omitted variables. We instrument import penetration in Italy from
China and other countries by means of three instrumental variables. Sector-year measures of
freight rates, computed on US trade data, are meant to capture differences in the bulkiness of
goods or in transportation technology that are independent of economic developments in Italy.
This instrument has also been used by Bernard, Jensen and Schott (2006a), Chen, Imbs and
Scott (2009) and Khandelwal (2010). Chinese import penetration in the US aims at isolating
determinants of China's exports that are related with industrial development and trade policy in
that country (i.e., push factors in China's trade developments). Finally, the Chinese share of US
imports captures the crowding-out effect of Chinese exports on other countries' exports.
     The paper is organized as follows. Next section presents the estimating equation. Section 3
describes the firm-level and trade data used in the empirical analysis. The results for the
baseline specification are discussed in section 4, while extensions in section 5. Concluding
remarks are left to the last section.

2        EMPIRICAL SPECIFICATION

    As our goal is to isolate the effect of import competition on firms' pricing strategies, we set
up an empirical specification that accounts for all determinants of prices: demand, costs,
productivity and market power. In a standard model with imperfect competition a firm's profit
maximization yields an optimal price that is a markup over marginal costs (i.e.,                 );
after taking logs and first-differencing, we get:

    While we observe prices at the firm level, we need to proxy for markups and unit costs. To

6
 Since 2005 China's world export share in manufacturing has kept increasing at a very high annual rate
(more than 30 per cent), and has reached 12.7 per cent in 2008.

                                                                          DRAFT FOR DISCUSSION ONLY
    7                                                                          Please do not quote or distribute
this aim, we take stock of the rich industrial organization literature on markups (Domowitz,
Hubbard and Petersen, 1988; Rotemberg and Woodford, 1992; for Italy, Marchetti, 2001) and
define markups as a function of a time-invariant sector component related to technology and
market structure, the level of demand (cyclical markups) (demand) and competition. We make a
distinction between domestic (domcomp) and foreign competition, and we further break down
the latter into Italy's import penetration from China (impen_china) and from the rest of the world
(impen_other). This distinction is conceptually analogous to that between low-wage and other
countries used by Bernard, Jensen and Schott (2006a), Khandelwal (2010) and Federico (2010)
and allows to estimate the effect of an increase of import penetration from China holding
constant import penetration from other countries. In line with industrial organization models and
related empirical evidence, we also assume markups to be increasing in firm size (size).
                          7
Notationally, we obtain :

where s indexes the 2-digit Nace sector a firm i belongs to. It is worth highlighting
that we use a firm-level measure of demand, proxied by changes in the capacity
utilization rate. Competition, both domestic and foreign, is measured at the sectoral
level.
     We then model changes in unit costs as follows:

where wage is the unit wage, inputcost is the un it cost of intermediate inputs, t fp is
total factor productivity. Year dummies      capture changes in costs that are common to
all firms. Importantly, inputcost controls for the effect of cheaper intermediate inputs,
including those from China, on costs and prices (Abraham, Konings and
Vanormelingen, 2009).
    When we combine equations (1) and (2) to derive our base empirical specification,
we take one-period lags of all the regressors. This choice, that helps reduce
simultaneity bias, is substantiated by the empirical evidence arising from a large
number of recent studies on firms' pricing policies in the euro area, based on both
survey and quantitative micro data (see Fabiani et al., 2007 and references therein).
According to these studies, firms' prices do not react immediately to cost or demand
shocks: both in Italy and in other European countries firms adjust prices on average
once a year.
     Given that the firm-level output price change recorded in our database is expressed
in percentage terms, in the estimating equation we define all regressors as percentage
changes. Notationally:

7
    The time-invariant sector components affecting the level of markups are swept away by first -differencing.

                                                                               DRAFT FOR DISCUSSION ONLY
      8                                                                              Please do not quote or distribute
We always cluster standard errors by sector, as we aim at identifying the effect
of a sectoral var iable ( im pen_china) in a firm -level dataset. In order to account
for the possibility that changes in costs are characterized by sectoral trends - induced,
for example, by technological change - we also estimate a version of equation (3) that
includes a full set of sector dummies (19 sectors from the 2-digit Nace-Rev.1
classification).
2.1 Causality
The key parameter of interest in equation (3) is . This is the coefficient of the annual
percentage change of Chinese import penetration in Italy ( impen_china), which in our
interpretation measures the effect of a change in competitive pressures from China (through
imports) on Italian firms~ price variations. We expect it to be negative.
Even after controlling for other determinants of firm-level price dynamics, import penetration
from China could still be correlated with the error term, thus inducing a bias in the estimate of .
The main concern is reverse causality: Chinese products may gain larger market shares in
those sectors where Italian firms raise prices more (or decrease them less). Hence, we would
expect an upward bias in . A second concern is related to the potential omission, among our
set of controls, of time-varying sectoral factors that affect at the same time both output price
dynamics and Italian imports from China. Finally, measurement errors in impen_china could
imply an attenuation bias. The same concerns apply to , the coefficient of the annual
percentage change of import penetration from other countries ( impen_other).
W e address these issues by instrumenting impen_china and impen_other.
W e use three instrumental variables, all based on US data. The first is freight rates at
the sectoral level, computed as the ratio of the difference between imports CIF and
imports FOB to imports CIF. This measure has been used by Bernard, Jensen and
Schott (2006b) as a direct exogenous measure of the reduction in inbound trade
costs and by Bernard, Jensen and Schott (2006a), Chen, Imbs and Scott (2009) and
Khandelwal (2010) as instrument for import penetration. Unlike the latter papers,
where freight rates are computed on national trade data, we base our measure on US
data, which are more likely to be exogenous to economic developments and prices in
Italy. Moreover, we do not construct two separate freight rates for low-wage (China,
in our case) and other countries as done in the papers above, but we use other
instruments in order to account for such differences in import penetration. The
variable is expressed as annual percentage change ( cif fob) and we expect it to be
negatively correlated with the increase of overall import penetration, which in our
specification is more closely proxied by impen_other.
The other two instruments are import penetration in the US from China (impen_china_us)
and the Chines e share of US total im ports ( share_china_ us), both c om puted at
DRAFT FOR DISCUSSION ONLY
9 Please do not quote or distributethe s ec toral level and included in the regression as annual percentage changes.
Import penetration in the US aims at capturing push factors related to industrial
development in China, which led this country to stand as a leading player in world
trade over the last decades. The C hinese share of total US imports is instead meant to
reflect the possible crowding-out effect of the expansion of imports from China on
imports from other countries: we therefore expect share_ china _us to be
8
negatively correlated with impen_other .
Our identification strategy is therefore based on the idea that while cif fob
captures exogenous and product-specific changes in worldwide transportation
technologies, import penetration from China in the US is related to that in Italy
only through China-specific supply-side factors and not through demand or
supply shocks common to Italy and the US. In this respect, we observe that the
latter two economies are very little integrated. On the one side, Italy's weight
over total US im ports is ver y sm all (around 2 per cent). Italy's effect on
Chinese exports to the US is hence negligible: if China's import penetration in
Italy is relevant for Italian firms' pricing strategies, price competitiveness of
Italian firms does not affect China's import penetration in the US. On the other
side, the US market absorbs about 5 per cent of Italian total exports of goods and
therefore its weight on Italy's GDP is very small (0.5 per cent).
Having argued that our instruments evolve independently of Italian
developments, we also consider the possibility that some global unobserved time -
varying sectoral factors could still bias our estimates. To account for this, in the
empirical analysis we test whether our results are robust to the inclusion of a
sectoral measure of world trade.
Since the IV model is overidentified (we are using three instruments for two
endogenous variables) and the data are heteroskedastic, as indicated by both the
Breusch-Pagan-Godfrey and by the W hite-Koenker tests, we estimate the model
by two-step GMM, which yields efficient estimates. However, results using 2SLS
are qualitatively and quantitatively very similar.
3 THE DATA
We combine data from various sources and merge firm -level information with
sectoral trade figures. Firm-level data, available from 1982 to 2006, are obtained from
the Bank of Italy's Surve y on Investm ent in Manufacturing Firm s (SIM) and the
Com pany Account Data Service (CADS). Sectoral trade data are from Schott's
website in the case of the US and from Eurostat in the case of Ital y. US data
range from 1972 to 2005. Eur ostat's trade data for Italy cover the period 1988-
8
An alternative identification strategy would rely on using the expiration of the Multifiber Agreement in 2005, as an event
that had a strong impact on the surge of Chinese exports (Brambilla, Khandelwal and Schott, 2009; Raff and Wagner,
2009). However, that is beyond the reach of our data. For developing countries, endogeneity concerns have been
solved using (exogenous) one-off trade liberalization events (Levinsohn, 1993; Harrison, 1994; Krishna and Mitra, 1998;
Pavcnik, 2002).
DRAFT FOR DISCUSSION ONLY
10 Please do not quote or distribute2006, while turnover data start from 1995. W e focus only on 2-digit Nace Rev.1
manufacturing industries and exclude three sectors: "tobacco products", which in
Italy is m ostly governm ent-owned, "petroleum and coal products", whose
performance is too sensitive to international oil prices, and "computing and office
equipment", which includes too few firms in Italy.
Since we estimate a lagged differenced model and want to exclude from the analysis
the evolution of prices during the 1992-1993 devaluation of the Italian currency, the
dependent variable (i.e., the annual rate of change in firms' output prices) ranges
from 1996 to 2006. After excluding observations below the 1st and above the 99th
percentile of the distributions of the growth rate of each firm -level regressor, we are
left with 5,071 observations (about 1,410 firms that are sampled on average for 3.6
consecutive years).
3.1 Firm-level data
SIM is an open panel (managed by the Bank of Italy) of firms with at least 50 employees.
SIM's questionnaires, submitted to companies at the beginning of each calendar year
and relative to the previous year's data, collect a wide range of information: year of
foundation, nationality, location, sector of activity, ownership structure, employment
(yearly average), investment (realized and planned), sales (domestic and foreign),
9
capacity utilization rate, indebtedness . CADS is the organization in charge of
gathering and managing firms' ac counting data in Italy. It was established in the early
1980s jointly by the Bank of Italy, the Italian Banking Association (ABI) and a pool
of leading banks with the aim of collecting and sharing information on borrowers.
For about 15,000 manufacturing firms per year, CADS collects balance sheets re-
classified in order to reduce the dependence on accounting conventions used by each
firm to record income figures and asset values.
Descriptive statistics on the merged CADS -SIM dataset are presented in Tables
1 and 2. The sample tends to be biased towards relatively large and old firms reflecting the fact
that we observe the balance sheets of those firms that obtain bank loans. The sectoral
composition is broadly representative of Italy's product specialization, with mo st
firms operating in machinery, food and beverages, other non -metallic mineral
products (such as tiles) and the s o c alled Made in Italy (tex tile, apparel, leather,
f ootwear). The num ber of firms is not constant over time, due to the fact that SIM
is an open panel and to the requirement we impose in our analysis that each firm
participates to the survey for at least three years in a row.
Importantly, since 1987 the SIM survey has collected quantitative information on
firms' output price change with respect to the previous year. This is the dependent variable in
equation (3). The price change is expressed in percentage terms, euro -denominated
and averaged across products and destination markets. The absence of a product breakdown
9
Given the strict, personal relationship between officials of the Bank of Italy and the single firm, the intense process of
data revision carried out by statisticians of the Bank of Italy and the special effort to keep information as closely
comparable across time as possible, SIM turns out to be a very high quality dataset. Among others, papers based on
SIM are Guiso and Parigi (1999) and Iranzo, Schivardi and Tosetti (2008).
DRAFT FOR DISCUSSION ONLY
11 Please do not quote or distributemay raise some concern: as firms are classified in the sector their main product
belongs to, they could partly be misplaced if they produce goods falling in two or
more different 2- digit categories. Fortunately, as shown by ISAE (2009), this is
extremely rare among Italian firms.
Figure 1 shows the price distribution across firms by year: the overall average is
about 2 per cent, but there is quite a high degree of variability, both over time and
across sectors and firms. The largest price increases are reported by firms operating
in the metal industry and are concentrated in 2003 and 2004 when raw material
prices increased sharply. The largest price cuts are recorded in the metal industry
and in the production of paper and chemical products in 1996. In the empirical
analysis we control for these time and sectoral effects. The advantage of working with
firm-level price data can be appreciated in Figure 2 that reports the overall (all years)
distribution of price changes under three specifications: raw data, controlling for year
fixed effects and controlling for year and sector fixed effects. Including year and (to a
lesser extent) sector fixed effects helps smooth out some spikes in the raw data but
does not seem to have a large explanatory power. In other words, there is still a lot
of heterogeneity to be exploited within years and sectors, that is, across firms.
The reliability of our firm -level price measure can be assessed by comparing
it with its macroeconomic counterpart, the official Producer Price Index (PPI),
computed and published by the Italian National Statistical Institute (ISTAT).
Figure 3 shows that PPI and SIM prices go hand in hand in all sectors over the
sample period.
All the regressors at the firm level are constructed from the merged CADS -SIM
10
dataset. Firm size (size) is measured as the number of employees . Unit wage (wage)
is obtained as the ratio between total labor costs and the number of employees. The
short-run changes in demand (A demand) are proxied by changes in the firm's
11
capacity utilization rate . Total factor productivity (t fp) is Bank of Italy's internal
computation based on the method proposed by Olley and Pakes (1996) and
applied to CADS data on value added, capital s toc k and lab or. Un it inp ut c os ts
(inputc os t) ar e c om puted as the ratio of total c os ts for intermediate inputs,
reported in balance sheets, to the number of employees. This is not a precise
measure of unit input costs, since the average price of intermediate inputs is multiplied
by the ratio between the physical quantity of intermediate inputs a nd the number of
employees. In other terms, changes in inputcost can be related both to changes in input prices
(possibly due to cheaper Chinese products) and to changes in factor (intermediate
inputs vs labor) proportions related, for example, to changes in firms' outsourcing
strategies (again possibly due to cheaper Chinese products). Hence, the coefficient
10
As a measure of firm size, we prefer to use employment instead of total sales. Being the product between
output and prices, sales could be positively correlated with prices, even with their changes.
11
The firm-level rate of capacity utilization is derived from SIM as the answer to the following q uestion:
"W hat is the ratio between actual production and the level of production which would be possible by
fully using the available capital goods without changing labor inputs?". The correlation between its
annual across-firm average and a standard macr o measure of capacity utilization in manufacturing
(computed by the Bank of Italy on the basis of industrial production and ISAE's quarterly surveys) is
about 0.8. Gaiotti (2010) shows that movements in SIM's capacity utilization also track quite well the
behavior of the output gap in the whole economy.
DRAFT FOR DISCUSSION ONLY
12 Please do not quote or distributeof this variable can be interpreted as the effect of changes in input prices only under
the assumption that, from year to year, factor proportions are fixed.
The intensity of domestic competition (domcomp) is measured by a sectoral concentration
index (the market share of the four largest firms in terms of sales) computed on the
basis of the full CADS sample at the 2 -digit level.
3.2 Sectoral data
Import penetration in Italy (from both China and the rest of the world) is based
on Eurostat Structural Business Statistics (SBS) and External Trade Statistics
12
(COMEXT) . SBS provides the value of domestic production for each 4 -digit
sector of the Nace Rev.1 classification for the period 1995-2007. COMEXT
contains Italy's export and import values by product and partner country for the
period 1988-2006. COMEXT product breakdown follows the Combined
13 ,
Nomenclature (CN) classification which is mapped into the 4-digit CPA
classification using the concordance tables provided by Eurostat. Given the one -to-one
correspondence between CPA and Nace, it is possible to compute import
penetration from China for each 2-digit Nace Rev.1 sector as the ratio between
imports from China and domestic demand (the sum of domestic production and
total net imports). Import penetration from other (than China) countries is
analogously constructed, using imports from the rest of the world instead of
imports from China. Notationally:
Like in Auer and Fischer (2010) and Auer, Dengen and Fischer (2010), the denominator is
the sectoral (across time) average of the value of domestic shipments plus imports so
as to neutralize the potential correlation between both measures and the dependent
variable, ar is ing fr om the f ac t that the value of s ales m ove with pric es . At the
s am e tim e, this also avoids that the dynamics of import penetration is affected by
the yearly evolution of domestic demand.
The US-based instrumental variables are built on the basis of the data used by
Bernard, Jensen and Schott (2006a and 2006b) and downloadable from Schott's
12
Italian data is produced and provided to Eurostat by ISTAT. SBS data for Italy are collected using two
firm-level surveys: the System of Economic Accounts in Enterprises for firms with at least 100 employe es,
and the Sample Survey on Small and Medium Enterprises for firms with less than 100 employees. These
survey data are then integrated with administrative balance sheet data and treated with statistical
techniques for non-responses and extrapolation to the universe.
13
CN is based on the Harmonized System (HS) classification and includes about 10,000 8 -digit codes.
DRAFT FOR DISCUSSION ONLY
13 Please do not quote or distribute14
website . The da ta r ef e r t o U S ex p ort a n d im port f l o ws b y p art n er an d pro d uc t ,
an d t h e to t al v a lu e of shipments by product. The products are classified
according to the 4-digit Standard Industrial Classification (SIC87): we group them at
the 2-digit level that easily maps into the 2-digit Nace Rev.1 classification. We
therefore compute US import penetration from China (impen_china_us) as we do for
Italy. The Chinese share of US imports (china_share_us) is t he rat i o of U S
im por ts f r om Ch i na to U S t o ta l im ports . T h e a dd i t io n a l i ns tr um en t (cif fob) is
constructed as the ratio of the difference between imports CIF and imports FOB to
imports CIF.
Table 3 reports import penetration from China in Italy and in the US, by sector
and for the years 1995, 2000 and 2005. Not surprisingly, it is largest and fast -growing
in "leather and footwear", "wearing apparel" and "other manufacturing" which
includes toys and furniture. It is instead still very low in the most technologically
advanced sectors, like "chemicals and chemical products", "motor vehicles and
transportation equipment". It is in general smaller in Italy than in the US. The
difference in the levels is striking in th ose sectors where Italy holds a strong
comparative advantage, like "leather and footwear", "wearing apparel" and "other
manufacturing". Figure 4 shows the evolution of Chinese import penetration in
Italy and in the US, in each 2-digit Nace sector. Overall, the dynamics of the two
series are quite similar, even though US figures depict a stronger increase,
especially in the most recent years, than Italian ones. The largest discrepancies are
recorded in sectors, like "food and beverages", "motor vehicles" and "other
transportation equipment", where however import penetration from China is very
15
small, almost negligible, both in Italy and in the US .
4 EMPIRICAL RESULTS
Before turning to estimates of equation (3), we assess whether raw data provide any
preliminary evidence suggesting that import penetration from China has a bearing on Italian
firms' pricing strategies. We split the sample into two groups according to the size of the
average sectoral annual change of Chinese penetration over the sample period, using the
median as cutoff point. Simple unconditional means indicate that indeed the average annual
price increase in the group of sectors that recorded a larger (than the median) increase in
competitive pressures from China is equal to 1.7 per cent, against 2.2 per cent in the other
group.
Another way to examine the data is to test whether the relationship we are looking for
already holds in a simple regression framework. Table 4 reports the coefficients of OLS and IV
regressions of the firm-level price change only on the lagged change of import penetration in
Italy from China and from other countries. The results display a statistically significant
relationship only when we control for year fixed effects (columns 2 and 4); in such cases, the R-
14
For a detailed description of the data, see Schott (2008).
15
In the "leather products" sector, the very different scale between import penetra tion in the US and that
in Italy does not allow to appreciate the large increase recorded in the latter country.
DRAFT FOR DISCUSSION ONLY
14 Please do not quote or distributesquared rises significantly, too. Sector fixed effects, despite being statistically significant,
contribute very marginally (columns 3 and 4). The IV estimate (column 5) is highly significant
and even more negative. Neither OLS nor IV estimates show any effect of import penetration
from other countries on Italian prices.
4.1 Base regression
We now focus on the estimation of equation (3). The first two columns of Table 5 report
OLS estimates without (column 1) and with (column 2) sector fixed effects. The
estimated coefficient of impen_china is always negative (-0.013-0.017) and
statistically significant, while that of impen_other is never significantly different from zero.
As discussed in Section 2.1, if the entry of foreign products on the Italian market is, ceteris
paribus, more intense in sectors where Italian firms are less price competitive, i.e.
where domestic prices increase relatively more, then the OLS estimates of the
parameters and are upward-biased. W e therefore turn to IV estimation. The
results, shown in Table 5, are again displayed without (column 3) and with (column 4) sector
fixed effects. The coefficient of impen_china remains highly significant and becomes much
16
larger in absolute value, thereby indicating an upward bias in the OLS estimates . The effect of
imports from China amounts to about 0.034-0.038, to say that a 10 per cent increase in
the penetration of Chinese products brings about a 0.35 percentage points reduction
of price dynamics. This is quite a sizeable effect as the average price change acr oss
years and sectors in our sample is 2 per cent. We still find no significant effect of
impen_other.
Since we are estimating the model via GMM, we cannot evaluate the robustness of
our instruments by examining a first-stage regression. Nevertheless, the results of a pseudo
first-stage regression, reported in Table 6, are in line with our expectations, validating
the instrumental strategy adopted. The F -statistics of excluded instruments are
well above the threshold of 10 recommended by Staiger and Stock (1997) to avoid
17
weak instrument concerns . The Sargan-Hansen test of overidentifying restrictions
does not reject the null hypothesis that the instruments are correctly excluded from the
estimated equation.
Going back to Table 5, the OLS and IV coefficients of the other regressors are pretty
sim ilar. An increas e in firm size ( size) raises m ark et power and therefore the
firm 's ability to charge, ceteris paribus, higher prices. According to Kugler and Verhoogen
(2008), a positive correlation between firm size and output prices might also follow
from the fact that larger firms are those producing better quality goods that are
18
reasonably sold at higher prices .
Output prices react positively to shocks to wages and intermediate input costs.
16
Such an upward bias could be due to both reverse causality and measurement error.
17
Estimations of the model by 2SLS and CUE -GMM yield very similar coefficients. This is a further sign
that the two-step GMM estimates are unlikely to suffer from weak instrument problems.
18
If we exclude O size from the base specification, on account of its potential endogeneity, results for all
the other regressors remain unchanged.
DRAFT FOR DISCUSSION ONLY
15 Please do not quote or distributeThe price elasticity to labor costs ( wage) is small, around 0.03. This result is
consistent with previous empirical evidence showing that the finer the disaggregation
of the data, the lower the estimated response of prices to changes in wages (Bils and
Chang, 2000). Similar results, based on Italian firm-level data, are obtained by Rosolia
and Venditti (2009) using actual wages and by Gaiotti and Secchi (2006) and
Gaiotti (2010) using nationally bargained wages. The coefficient of inputcost is
around 0.014. This variable, as stated in section 3, captures the dynamics of input
prices and changes in factor proportions related for example to outsourcing, which
could both reflect, among other things, increased imports from China. Its inclusion,
therefore, supports our claim that t he coefficient of A impen_china identifies a
purely pro-competitive effect of Chinese imports on firms' prices.
The remaining variables do not significantly affect firms' prices. In the case of TFP,
the statistically not significant coefficient may reflect the fact that the sign of the
relationship between price and TFP changes is a priori ambiguous: as clearly
pointed out by Melitz (2000), it captures both increases in productivity (with a
negative effect on prices) and quality upgrades (with a positive eff ect). Importantly,
our price data do not allow to control for the potential shift of multi -product firms'
production activity towards goods that are less exposed to increased competition.
However, we believe that our focus on China reduces the relevance of this issue: in
the face of low-wage competitive pressures multi -product firms more likely move
towards higher-quality products, thus inducing a positive bias in the estimated
coefficient of impen_china, that would go against the result we find.
All in all, the results in Tables 5 and 6 point to a causal link between changes in
import penetration from China and the dynamics of output prices in Italy. In the
remainder of the paper we present robustness tests and extensions to the base
estimation. To streamline the presentation of results, hereafter we focus only on IV
estimates.
4.2 Robustsness
A first exercise deals with the presence of a possible survivorship bias. If firms
that are not able to compress margins enough may decide, or be forced, to exit the
market, then we could be overestimating the pro-competitive effect of impen_china.
We address this issue using information on firms' history, contained in CADS, that
allows to explicitly control for exit from the market. In particular, we include among the
19
regressors a dummy variable exit constructed in two alternative ways . In the first,
more restrictive, definition, exit takes value 1 if the firm is liquidated or goes
bankrupt after exiting the sample and 0 otherwise. In the second, exit takes value 1
also if the firm is subsequently acquired by another firm. Results are displayed in
Table 7: in both cases (columns 1-2 for the first definition, and 3-4 for the second) all
the results are unchanged and the coefficient of exit is never significantly different from
19
The variable exit can be interpreted as the hazard rate in a Heckman selection model. The difference is
that here the probability of exit is perfectly observed and it does not need to be estimated.
DRAFT FOR DISCUSSION ONLY
16 Please do not quote or distributezero.
A second robustness exercise has to do with the fact that our dependent variable refers to
the average price charged by each firm for its products, independently of the market in which
they have been sold. Since we focus on Chinese competitive p ressure in Italy, we
should instead focus only on domestic prices, excluding the impact on export prices. In
the absence of information on prices broken down by destination markets and
given that we can not exclude the numerous exporting firms without rest ricting too
much the sample size, we indirectly test the relevance of this issue by estimating a
weighted version of equation (3) where firm-level weights are constructed as the
share of domestic sales in total sales. Results, reported in columns 5 and 6 of Table 7, are
again unchanged.
We then consider the possibility that an omitted variable bias, related to a global
unobserved sectoral time-varying shock, could be simultaneously driving both China's exports
across the wor ld ( and theref or e in Italy and in the US) and Italian pric es .
20
Colum ns 7 and 8 include the annual percentage change in world trade by sector as a
proxy for such sectoral time-varying shocks. This variable is not statistically significant,
the coefficient of impen_china is still highly significant and of the same size as in
the base regression.
Other r obustness c hecks carried out but not reported in the text are the
following. To allow for price dynamics that are geographically heterogeneous, we
control for firm's location including macro-area dummies (North-W est, North-East,
Center and South). W e also estimate the baseline model with firm fixed effects, so as to
capture firm-specific time trends, and allowing for clustering of standard errors at the
firm level. Finally, we exclude sector-year cells with fewer than 20 firms. In all cases,
results are unchanged.
5 EXTENSIONS
With the aims of improving our understanding of the mechanisms through which
Chinese competitive pressures influence prices in Italy and further strengthening our
main results, we now exploit the availability of firm -level data to explore how the effect
of import penetration from China varies across sectors and firms.
5.1 Heterogeneity across sectors
Is the price effect of Chinese competition different across sectors? Providing an answer to
this question represents not only a further indirect test on the plausibility of the
causal relationship we are identifying but also a way of testing the predictions of theoretical
20
This variable is constructed usin g the W orld Trade Analyzer database, developed and managed by
Statistics Canada, which provides data on export and import flows, in current dollars, for a very large set of
countries and the world, disaggregated by destination market and type of product fo r the period 1985-
2005. The product breakdown corresponds to the 4 -digit SITC-Rev.3 classification, which we map into the
3-digit Nace-Rev.1 using the concordance tables provided by the United Nations.
DRAFT FOR DISCUSSION ONLY
17 Please do not quote or distributemodels. In particular, we provide evidence on the relative explanatory power of two different
theoretical arguments.
Firstly, the factor proportions framework that descends from the Heckscher -Ohlin
trade model implies that a relatively low-skilled labor abundant country like China
(Schott, 2008) should specialize in manufacturing industries whose technology is less capital-
and skill- intensive. As a result, when Chinese goods massively enter a relatively
more capital- and skill-abundant country like Italy, Italian industries more severely
hit should be those that are less capital- and skill-intensive. Romalis (2004) shows
that factor proportions explain quite well the structure of commodity trade. Using
US plant data, Bernard, Jensen and Schott (2006b) find that, in the face of a high
exposure to imports from low-wage countries, plant survival and growth is lower in
industries that are less capital- and skill-intensive.
The second argument is based on vertical differentiation: focusing on product
quality, Khandelwal (2010) argues that the ability of advanced countries ' firms to
escape from low- wage countries' competition is increasing in the industry scope for
vertical differentiation. He finds that the negative impact of import penetration from
low-wage countries is stronger in US sectors where the quality ladder is shorter, that
is where the scope for quality up grading is more limited. He shows that his indicator of
length of quality ladder is not fully explained by capital- and skill-intensity indicators
(despite being positively correlated to them) and that the res ults above also hold
when explicitly controlling for factor propor tions.
In the empirical analysis, we interact impen_china with sectoral indicators of
capital intensit y, sk ill intensit y and im portanc e of product qualit y. In the spirit of
Rajan and Zingales (1998), all indicators are computed on US data to avoid
endogeneity problems. In particular, we take the measures of capital intensity
21
(capint) and length of quality ladder (qualad) from Khandelwal (2010) . W ith regard
to skill intensity, we compute fro m the March 2008 release of the EU KLEMS
database the 1990-2005 average share of high- and medium-skilled workers —
defined as those that have at least completed high school — over total work ers
(mhskill) and the same share for only high -sk illed workers ( hskill) — defined as
those with at least a college degree. The advertising/sales ratio ( adv), computed by
Kugler and Verhoogen (2008) from the 1975 FTC Line of Business Survey, is a
further proxy for the scope for quality differentiation.
Table 8 reports the sectoral measures. Capital intensity is highest in the production of
chemicals, basic metals, pulp and paper, and lowest in apparel, leather products and
f ootwear. The latter indus tr ies, along with the produc tion of tex tiles, em plo y the
lowest percentage of medium-high skilled workers, which is instead highest for firms
producing medical, precision and optical instruments, chemicals and communication
equipment. Overall, the correlation between capint and mhskill is about 0.4. The
sectors with the longest quality ladder are textiles, chemicals, medical, precision
and optical instruments, while the shortest is for printing, publishing, fabricated
metal products, leather products and footwear. The advertising/sales ratio is
21
The two measures refer to year 1989 and are from the NBER Manufacturing database (Bartelsman,
Becker and Gray, 1996).
DRAFT FOR DISCUSSION ONLY
18 Please do not quote or distributepositively correlated with the leng th of quality ladder; it is highest in printing and
publishing, food products and beverages and lowest in the production of leather
products and footwear, basic metals and wood products.
The results of the regressions with heterogeneous effects by sector are reported in Table 9,
where the coefficient of interest ( impen—china *sect) refers to the interaction between
22
impen—china and the (continuous) sectoral measure indicated in the column heading .
W hile we find no significant heterogeneity in terms of cap ital intensity
(column 1) and product quality (columns 4 and 5), the estimates support the
factor proportions hypothesis with regard to skill intensity. As it appears in column
(3), the causal impact of imports from China decreases as the share of high- and
medium-skilled workers increases: as a result, the impact of higher import
penetration from China ranges from -0.02 for "medical, precision and optical
23
instruments" to -0.09 for "wearing apparel and dressing" .
All in all, our estimates indicate that the pro-competitive effect of imports from
China is stronger in low-skill sectors where China holds a comparative advantage due
to the relative abundance of unskilled labor (Schott, 2008).
5.2 Heterogeneity across firms
Recent trade models focus on the relationsh ip between trade and firms'
heterogenous productivity. Looking at the effects of a trade liberalization through the lenses of
firm-level adjustments, Melitz (2003), Bernard, Eaton, Jensen and Kortum (2003) and
Melitz and Ottaviano (2008) show that, within an industry, the effects of increased foreign
competition are magnified by the reallocation of market shares from less productive to
more productive firms.
In line with these theoretical developments, and thanks to the growing
availability of micro datasets, a number of empirical studies highlights the importance
of firm heterogeneity to understand the effect of trade. Following the seminal paper
by Bernard and Jensen (1995), a large cross-country literature shows that exporters
are on average more productive t ha n n o n- ex p or ters a n d th a t th is i s n ot t h e r es u l t
of t h e ex p or t i ng ac t i v i t y b u t r at he r an ex-ante feature (self-selection) related to
the fact that only the most productive firms are able to overcome the costs of
starting to export. On US data, Bernard , Jensen and Schott (2006a) find that the
effect of low-wage country competition is indeed weaker on high-productivity and
relatively more capital-intensive plants and that plants tend to move away from industries
more exposed to low-wage country competition, towards more capital intensive
productions. In a companion paper Bernard, Jensen and Schott (2006b) find that the impact
on plant death is smaller for more productive plants.
All in all, productivity turns out to be a k ey elem ent to identif y which firm s
22
The variable s e c t is not included among the regressors because we always control for sectoral dummies.
23
The effect of import penetration from China does not seem to be significantly diffe rent across sectors
when the latter are ranked according to the share of only high -skilled workers. A stronger pro-competitive
effect of China on low skilled sectors is found (not reported) instead when we proxy skill intensity with
the sectoral share of non-production workers used by Khandelwal (2010).
DRAFT FOR DISCUSSION ONLY
19 Please do not quote or distributeare able to access foreign markets and which gain from trade -induced
reallocations. In this vein, we investigate whether and how productivity affects the way
firms' prices react to China's import competition. We include among our regressors the
interactions between sectoral and firm-level characteristics, that is we estimate the
24
following equation :
where we add to the specification discussed in the previous section the interaction between
impen_china and the (lagged log) TFP level and the interaction between impen_china, TFP
and the sectoral measures. The aim is to test whether the effect of Chinese competition differs
across firms with different productivity in a way that may depend on sectoral features.
We expect the coefficient to be positive, to say that high-TFP firms are better
able to face Chinese competitive pressures, while to be negative since the shield
coming from firms' productivity should be less important in sectors that, for
technological or product quality reasons, are less exposed to such pressures.
The results shown in Table 10 confirm these hypotheses. The positive coefficient
on i m p e n _c h i n a * s e c t in column (3) confirms the finding of the previous
section: sectoral differences in skill intensity are relevant in shaping the imp act of
import penetration from China. In the same column, the statistically significant and
positive coefficient of i m p e n _c h i n a * t f p indicates that the impact is smaller for
high-TFP firms. In other words, low-productivity firms are the ones forced to c ut
prices the most in the face of Chinese competitive pressures. As expected, the
coefficient - y 1 s i of the triple interaction is negative (and significant), indicating that
the differential impact of TFP becomes less important as sectoral skill intensity
increases. This result holds also, even though weakly, when we proxy skill intensity
with both the share of high-skilled workers and the share of non-production workers
(not reported). On the contrary, it does not hold when sectors are distinguished
according to capital intensity, or to measures of the ability of firms to upgrade the
quality, actual or perceived, of their products.
Using the estimated values of it turns out that an increase in TFP
significantly softens the negative impact of import penetra tion from China on prices
only for the sectors with the lowest skill intensity, that is, in decreasing order, for
"apparel", "textiles", "leather products", "wood products", "food and beverages",
"other manufacturing including furniture" and "other non -metallic mineral products".
The order of magnitude of this effect is non-negligible: in the "apparel" sector, a 10
per cent increase in import penetration from China reduces price dynamics by 0.96
th
percentage points for a firm with a TFP level equal to the 25 percentile of the
overall TFP distribution, and by 0.02 percentage points for a firm at the 75th
percentile; in the "textiles" and "leather products and footwear" sectors, price dynamics
24
The equat ion is est im at ed v ia 2SLS, s inc e t he num ber of c lus t ers is not s uf f ic ient t o allow c om put at ion
of GMM est im ates , as the interac tion terms increased t he number of regress ors.
DRAFT FOR DISCUSSION ONLY
20 Please do not quote or distributeYou can also read