Touchtone leakage attacks via smartphone sensors: mitigation without hardware modification
←
→
Page content transcription
If your browser does not render page correctly, please read the page content below
Touchtone leakage attacks via smartphone sensors:
                                                          mitigation without hardware modification
                                                          Connor Bolton1 , Yan Long1 , Jun Han2 , Josiah Hester3 , Kevin Fu1
                                                          1 College of Computer Science and Engineering, University of Michigan, Ann Arbor,
                                                          Michigan, USA
                                                          2 College of Computer Science, National University of Singapore, Singapore
                                                          3 College of Computer Science, Northwestern University, Evanston, Illinois, USA
arXiv:2109.13834v1 [cs.CR] 28 Sep 2021

                                                          Abstract
                                                          Smartphone motion sensors provide a concealed mechanism for eavesdropping on
                                                          acoustic information, like touchtones, emitted by a device. Eavesdropping on touchtones
                                                          exposes credit card information, banking pins, and social security card numbers to
                                                          malicious 3rd party apps requiring only motion sensor data. This paper’s primary
                                                          contribution is an analysis rooted in physics and signal processing theory of several
                                                          eavesdropping mitigations, which could be implemented in a smartphone update. We
                                                          verify our analysis imperially to show how previously suggested mitigations, i.e. a
                                                          low-pass filter, can undesirably reduce the motion sensor data to all applications by 83%
                                                          but only reduce an advanced adversary’s accuracy by less than one percent. Other
                                                          designs, i.e. anti-aliasing filters, can fully preserve the motion sensor data to support
                                                          benign application functionality while reducing attack accuracy by 50.1%. We intend
                                                          for this analysis to motivate the need for deployable mitigations against acoustic leakage
                                                          on smartphone motion sensors, including but not limited to touchtones, while also
                                                          providing a basis for future mitigations to improve upon.

                                                          1     Introduction
                                                          Touchtones, the sounds produced by a smartphone when a numerical key is pressed, are
                                                          an established communication standard [1] often used to encode user feedback in
                                                          telephony channels. In modern telephony systems, touchtones often represent important
                                                          information such as credit card numbers (during activation), bank pins, various account
                                                          numbers, social security numbers, selections for various options in an automated
                                                          services, and possibly even votes in a federal election (done by phone) [2]. Recent
                                                          research has shown that sound produced by a smartphone’s speaker may “leak” into the
                                                          same phone’s motion sensors, particularly speech. Our experiments show that touchtone
                                                          leakage, touchtone information leaking into motion sensor data, occurs with a
                                                          signal-to-noise ratio sufficient to be seen visibly (Fig 1b). This leakage enables malicious
                                                          smartphone applications with motion sensor access (e.g., a seemingly benign
                                                          smartphone game) to ascertain any numerical user input that produces touchtones
                                                          (Fig 1), an attack we term touchtone eavesdropping. However, reducing acoustic leakage
                                                          remains an open research problem as papers investigating this topic [3–6] focus more on
                                                          adversarial and threat modeling than mitigation efforts. This paper’s primary goal is to
                                                          open discussion on how to reduce acoustic leakage into nearby motion sensors, using
                                                          touchtone leakage as an exemplary case study.
                                                              To understand how to mitigate touchtone eavesdropping, we assess why acoustic
                                                          information is hidden in motion sensor data and how signal processing and physical

                                     September 29, 2021                                                                                          1/23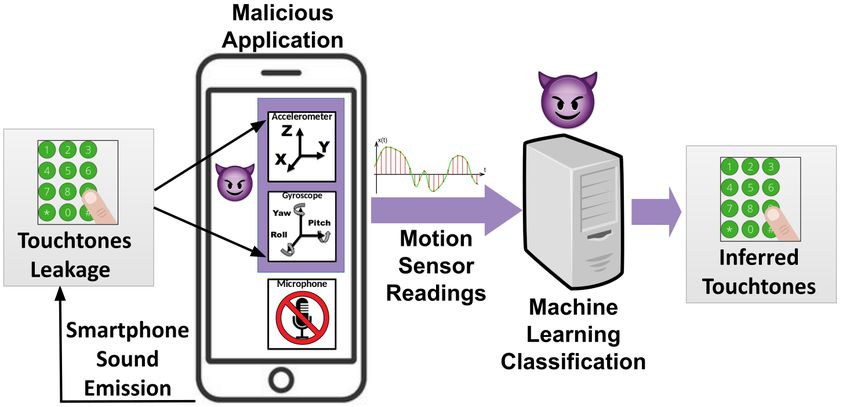
Fig 1. Touchtone leakage and eavesdropping. (a) A touchtone, indicating a “5”
                     on a smartphone number pad, leaks into accelerometer data. (b) A malicious
                     smartphone application can classify this leakage to descern that a “5” touchtone was
                     emitted, infering user input of a “5” for purposes such as dialing a phone number or
                     inputing information into automated services.

                     phenomenon, such as aliasing or varying frequency responses, aid adversarial recovery of
                     the original user key press. These phenomenon cause artifacts of touchtone information
                     to manifest in a multitude of ways, but an adversary only needs to be able to ascertain
                     user input through one of those manifestations. More advanced techniques such as
                     selective integration of multiple sensors and sensor axes via machine learning can
                     instead utilize several of these manifestations simultaneously for a more proficient
                     attack. Our experiments show user input can be recovered by an adversary at over 99 %
                     accuracy with such methods.
                         This paper uses the above assessment to inform and analyze functionality-aware,
                     software-updatable mitigation designs for touchtone leakage. Mitigations can reduce
                     touchtone leakage by reducing the total information in sensor output, but this also
                     affects benign applications relying on such data. It is thus important to keep
                     functionality in mind when designing mitigations. Additionally, we focus on solutions
                     that may be implemented as a software update to support existing devices and designs
                     where hardware changes may not be viable. Using these criteria we analyze both
                     ineffective and effective solutions to demonstrate ideas to emulate or avoid. For example,
                     we analyze and evaluate how some apparent mitigations briefly suggested in related
                     work, such as sampling rate reduction or digital low-pass filtering alone, are ineffective
                     at reducing touchtone leakage; sampling rate reduction can reduce available information
                     to all applications by more than 80% yet our classifier maintains accuracy over 95% for
                     three of the four tested phones. Other designs, such as a software anti-aliasing filter
                     that uses oversampling, do not change the amount of information available to
                     applications while reducing accuracy by over 50.1%. Our contributions include:

                     1.1    Contributions
                     Touchtone eavesdropping assessment: We discuss and experimentally demonstrate
                     the relevant physics and signal processing theory of touchtone leakage to reveal
                     challenges mitigations must consider, such as aliasing and non-linear frequency
                     responses. We detail both simple and advanced adversaries, discussing how selective
                     integration of multiple sensors’ data with machine learning can further impede
                     mitigation efforts.
                     Defense design analysis: We analyze the advantages and disadvantages of several
                     signal-processing based leakage reduction solutions. We explicitly include the idea of not
                     reducing functionality as a design criteria. Some apparent approaches, such as reduced

September 29, 2021                                                                                        2/23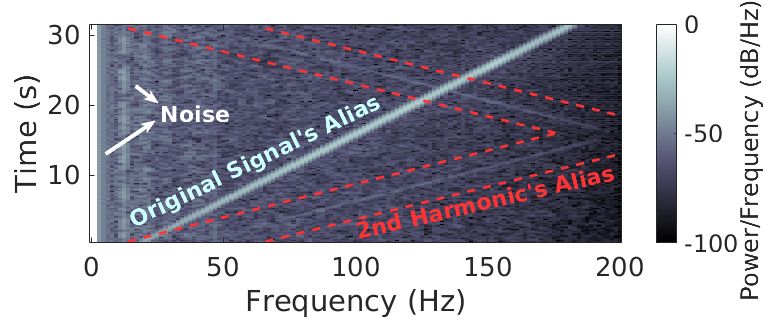
sampling rates, are nonintuitively ineffective mitigations. Other filter designs, such as a
                     software Butterworth anti-aliasing filter, can reduce leakage in the signals as a software
                     update. Hardware changes could serve as long term solutions.
                     Implementation and evaluation: We implement and evaluate both simple and
                     more advanced touchtone leakage attacks to serve as baselines for mitigation evaluation,
                     then the mitigations themselves. Baseline attacks can achieve accuracy higher than 99%.
                     We evaluate several signal processing mitigation designs to demonstrate both effective
                     and ineffective designs. Apparent mitigations, such as digital low-pass filters and
                     reduced sampling rates, may remain ineffective (less than a 1% difference in accuracy
                     from baseline) even while reducing benign information that may be crucial for
                     applications to function. Our anti-aliasing filter reduces accuracy by over 50.1% with no
                     information loss, and can reduce further with minor benign information loss.

                     2       Background and related work
                     2.1     Touchtones
                     Touchtones, also known as dual-tone multi-frequency (DTMF) signals, are a
                     standardized [1] code of two-tone audible acoustic signals that play upon a numerical
                     key press, often used in telecommunications or other applications with a numerical
                     touch pad [7–10]. The sound produced by a phone when you press an individual key to
                     dial a phone number, answer an automated telephony question (e.g. “press 1 to....”),
                     register credit card numbers or bank pins over the phone, or other such actions are
                     examples of touchtones. There are 16 unique touchtones (Fig 2), each consisting of two
                     frequencies taken from two separate frequency sets, used for the numbers 0-9, the
                     symbols * and #, and an additional 4 tones reserved for special services. As they are
                     unique, hearing one touchtone is indicative of a certain number press. These dual-tone
                     combinations have been chosen specifically to be easily understood in the presence of
                     noise for reliable communication.

                     Fig 2. Touchtone frequencies. Touchtones are comprised of two single-frequency
                     tones emitted simultaneously to convey numerical input.

                     2.2     Signal Processing
                     2.2.1    Aliasing
                     Aliasing can have several definitions depending on context, but the most relevant
                     definition in the context of this paper refers to distortions caused by improper sampling
                     of a signal [11, 12]. As defined by the Nyquist sampling theorem [13, 14] the highest
                     frequency a sensor with sampling rate fs can properly sample is the Nyquist frequency

September 29, 2021                                                                                        3/23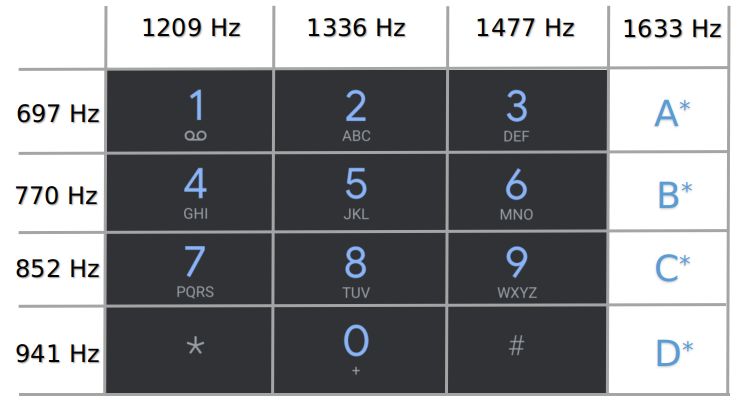
fN = fs /2. If a signal has frequencies greater than fN the sensor output will contain
                     aliases of the original signal. The formula for the frequency of the alias, fa , given the
                     Nyquist frequency fN and the frequency of the original signal f is fa = |2mfN − f |.

                     2.2.2   Bandwidth
                     The signal path of physical signals can normally only allow signals in a certain range of
                     frequency to pass without strong attenuation because of the signal path’s frequency
                     response which is determined by its physical properties. Generally, the difference
                     between the upper and lower bounds of such frequency range is defined as the
                     bandwidth of the signal path. For an ideal motion sensor (with a flat frequency
                     response) with the sampling rate of fs , the its bandwidth is the same as the Nyquist
                     frequency fN since only motion signals under the Nyquist frequency can be properly
                     sampled and passed to the processor of smartphones. Although the nominal bandwidth
                     is pre-determined by the properties of the signal path, people usually reduce the actual
                     bandwidth by means of filtering.

                     2.2.3   Filtering
                     Filtering is the process of reducing the bandwidth of a signal path by blocking
                     (attenuating) unwanted signals at certain frequencies and only allowing desired signal to
                     reach the destination, i.e., the smartphone processor in the context of this paper [15].
                     Common filters include low-pass filters, which blocks high-frequency signals and passing
                     through high-frequency signals, and high-pass filters which achieve the opposite. The
                     band of frequencies that the filters let pass through is called the pass band. Filters can
                     be implemented either in software or in hardware, and can be implemented in different
                     forms such as simple RC impulse response filters, Butterworth filters, Chebyshev filters,
                     etc. Different implementations of filters have different frequency responses, meaning the
                     abilities of blocking and passing signals at different frequencies are different. Ideally, the
                     frequency response in the filters’ pass band should be flat, so that the desired signals
                     won’t be distorted. However, such distortions are usually unavoidable for both software
                     and hardware filters in the real world.

                     2.3     Related work
                     Acoustic eavesdropping using motion sensors. Previous works have shown the
                     feasibility of acoustic eavesdropping attacks using motion sensor similar to touchtone
                     eavesdropping in this paper. Gyrophone [3] demonstrates an attack that recognizes
                     human-spoken digits using smartphone gyroscopes by extracting speech spectral
                     information. Similarly, Spearphone [6] and AccelEve [16] uses smartphone
                     accelerometers to eavesdrop human-spoken digits. AccelWord [4] investigate the
                     feasibility of leveraging smartphone’s accelerometer to capture acoustic signals for
                     low-power hotword detection. PitchIn [17] fuses across multiple uni-model sensors (e.g.,
                     only accelerometers or gyroscopes) to reconstruct intelligible human speech by
                     interleaving sensor readings from multiple sensors to increase the effective sampling rate.
                     This work differ from the previous works in that: 1) We assess the privacy issue of
                     eavesdropping touchtone information from smartphones, which require a different
                     analysis methodology than the previous acoustic eavesdropping targets. 2) We analyze
                     and evaluate the effectiveness as well as feasibility of several mitigations that can be
                     practically implemented, and open up the discussion of future functionality-aware
                     mitigations. 3) We inspect how acoustic leakage can manifest itself differently in
                     separate axes’ sensor readings of even a single sensor and uncover the fact that an

September 29, 2021                                                                                           4/23
advanced attacker may combine multidimensional information from different axes to
enhance the attack.
Other motion sensor side-channels. Recent research also demonstrates novel
side-channel attacks utilizing smart-phone motion sensors to infer victims’ location or
keystrokes. ACComplice [18] leverages smart-phone accelerometer to infer victim
driver’s driving routes as well as starting point. Narain et al. further extended findings
of ACComplice and demonstrated the feasibility of such attacks in large scale across ten
cities [19]. (sp)Iphone [20] accesses acceleromter readings to infer typed text on nearby
keyboards by observing the relative physical position and distance between the
smartphone and keyboards and the vibration detected. Similarly, ACCessory [21]
utilizes an accelerometer to infer keystrokes as the victim user types on his/her
smart-phone. Due to minute differences in taps, it is able to sufficiently infer the typed
keys. Tapprints [22] further extends the findings of ACCessory by incorporating both
accelerometer and gyroscopes as well as conducting larger experiments at scale with
more practical use case scenarios. These motion sensor side-channel attacks against
locations and keyboard inputs complement our discussions on eavesdropping touchtone
information in this paper.
Acoustic injection attacks. Previous work has also explored motion sensors’
susceptibility to vibrations caused by acoustic signals, namely to affect motion sensor
readings via acoustic injection. For instance, Son et al. proposes an attack to bring
down and crash drones only by acoustic injection as MEMS gyroscopes are vulnerable
to acoustic noises at their resonant frequencies [23]. Similarly, [24, 25] propose acoustic
injection attack on MEMS accelerometers to manipulate the output of the sensors by
injecting certain acoustic signals at their resonant frequencies. Unlike these attacks that
inject acoustic signals to motion sensors, we demonstrate the feasibility of capturing
privacy sensitive information such as touchtone from acoustic signals naturally emitted
from victim smartphones.
3 Touchtone eavesdropping assessment
For mitigation design it is crucial to understand how attacks utilizing touchtone leakage
occurs (Fig 1) and the multitude of reasons why it can be difficult to mitigate (Fig 3).
We assess (1) how touchtones produced by a phone’s speaker leak distinguishable,
deterministic byproducts to the smartphone’s motion sensors (e.g. the accelerometer
and gyroscope) and (2) how adversaries can use leakage to determine user input.
10 10
#3 Touchtone #3 Touchtone Touchtone
Normalized Amplitude
Normalized Amplitude
#4 Touchtone #4 Touchtone Touchtone
8 8
Measured Predicted Predicted Measured
Alias Alias
6 Predicted Alias 6 Alias
Alias
4 4
2 2
0 0
0 50 100 150 0 10 20 30 40 50
Frequency (Hz) Frequency (Hz)
(a) (b) (c)
Fig 3. Predictable and discernible touchtone leakage. Touchtone leakage for
#3 and #4 touchtones in a Google Pixel 2’s accelerometer’s x-axis. These signals
remain discernable and predictable in the frequency domain with (a) a normal,
unaltered signal, and also despite previously suggested mitigations in (b) reduced
sampling rates and (c) digital low-pass filtering.
September 29, 2021 5/233.1 Threat Model
This paper considers an adversary whose goal is to determine a user’s numerical key
presses on a smartphone using access to a smartphone’s motion sensor data and the
knowledge of touchtone leakage, an attack we term touchtone eavesdropping. We assume
the adversary can obtain and save motion sensor data through means such as a
malicious application with motion sensor access. The adversary may have access to the
same model as the victim’s phone(s); a phone’s model can be determined by an
application using fingerprinting techniques [26–28]. The adversary can use their
duplicate phone(s) to collect training data to build a classification system. Last, the
adversary has unlimited time to classify victim data as the victim data can be saved
and sensitive information (e.g. credit card numbers, bank pins, social security numbers)
may not change often.
3.2 Touchtone information in motion sensor data
Touchtone leakage manifests itself in motion sensor data in a multitude of forms due to
various physical and signal processing phenomenon. Each of these manifestations can
contain redundant or complementary information regarding the original touchtone.
However, an attacker only needs one method, and possibly one manifestation of
touchtone information, to achieve an eavesdropping attack. Defenders however, must
consider how to block as much of this information as possible.
3.2.1 Acoustic waves and sensor construction
Acoustic waves produced by the smartphone’s speaker alter the output of
microelectricalmechanical systems (MEMS) accelerometers and gyroscopes [29] due to
how these sensors approximate motion. MEMS accelerometers and gyroscopes
approximate the motion of a larger body (i.e. a smartphone) via the motion of a small
sensing mass(es) attached to capacitive springs. When the mass(es) moves, the springs
create a representative voltage which is then amplified, filtered, digitized, and sent to
the processor. However, while the linear or angular acceleration of the sensing mass(es)
are usually accurate representations of the body’s acceleration, they are not exact. For
example, small acoustic vibrations via the air or contacted surfaces can move the small
sensing masses even if minimally affecting the connected body (i.e. smartphone) due to
effects such as varying frequency responses [3, 6, 24]. In this case, MEMS accelerometers
and gyroscopes may capture acoustic signals.
3.2.2 Touchtone aliasing
Aliasing, described in Section 2.2, is a key factor in both making touchtone leakage
occur and for making it difficult to mitigate. Touchtones have frequencies higher than
the Nyquist sampling rate for most smartphone motion sensors, and thus have aliases.
However, the frequencies of these aliases can be predicted as the touchtone frequency
and sampling rate are both known (Fig 3). An attacker can use these known aliases to
indicate the presence of the missing original touchtone frequencies.
Furthermore, the non-linear placement of these aliases — how all touchtone
frequencies can lie somewhere in the sampled signal’s frequency band — can make
touchtone eavesdropping resistant to suggested mitigations. For example, reducing the
sampling rate will not get rid of aliases, only move them (Fig 3b). Low-pass filters may
remain ineffective unless the cutoff frequency is placed low, as touchtone aliases could
be close to 0 Hz (Fig 3c).
September 29, 2021 6/233.2.3 A cacophony of sensitive information
The two above factors enable touchtone leakage, but information leakage may manifest
in a multitude of forms simultaneously (i.e. different axes of a sensor having different
signals related to touchtones) due to a variety of physical and signal processing
phenomenon; these manifestations can provide complementary or distinct information
for the purpose of classifying touchtones (and thereby user input) and an attacker may
need only one of these manifestations.
Different sensors or sensor axes can contain complementary or different information
about the same set of touchtones. One factor that can vary how information manifests
is varying frequency responses in phone construction, speakers, sensors, or even
individual axes of sensors. Different frequency responses inherent to physical materials
and sensors can lead to one sensor axis having a higher signal-to-noise ratio (SNR) for
certain frequencies (i.e. touchtones) where a separate axis could have a higher SNR for
other frequencies [23, 30, 31] (Fig 4a). With access to both axes an adversary may be
able to exploit this fact and combine useful information.
Samsung Galaxy S9
1
Gyro X-axis
Normalized SNR
Accel Y-axis
Accel Z-axis
0.5
0
20 40 60 80 100 120 140 160 180
Google Pixel 2
1
Gyro X-axis
Normalized SNR
Accel Y-axis
Accel Z-axis
0.5
0
20 40 60 80 100 120 140 160 180
Chirp Center Frequnecy (Hz)
(a) (b)
Fig 4. Touchtone information manifestations. Touchtone information can be
embedded in a variety of forms or to varying extents in motion sensor data. In (a), two
axes have distinct non-linear frequency responses to a 420 Hz to 580 Hz chirp from the
loudspeaker. Different axes may be better predictors for certain tones. (b) shows how
there may be many subtle artifacts in touchtone data. An attacker could use any of
these artifacts to launch a touchtone eavesdropping attack.
Additionally, in the same signal (i.e. sensor axis) information about the same
touchtone can manifest in different manners. For example, an axis will have information
on an alias of the touchtone frequency, but could also have information on the
harmonics of the same touchtone (Fig 4b). A touchtone eavesdropping attack would
only need to recognize one of a touchtone’s alias, harmonic, or even an alias of the
harmonic to be successful.
3.3 Adversarial touchtone recovery
The goal of the attacker is to recognize when a touchtone is pressed by discerning the
presence of the eight individual touchtone frequencies (Fig 2) in motion sensor data.
The adversary can benefit by trying to use all possible touchtone information in motion
sensor data, as discussed in Section 3.2.3. The most straightforward approach to do this
is by making a machine learning based classifier as the attacker does not particularly
care which information the classifier uses, just that it can classify motion sensor data
into touchtones. The advent of easily usable machine learning tools makes this task not
arduous in the modern day.
Furthermore, adversaries can make use of the varying information in different
September 29, 2021 7/23sensors and sensor axes by selectively integrating data from multiple sensors (in our
case the accelerometer and gyroscope). For example, one sensor axis may be more apt
at discerning the presence of a particular touchtone but a separate sensor axis could be
a better indicator of a separate touchtone. This same idea, using multiple sensors to
reveal emergent information, has been used by researchers for benign purposes in several
fields including on drones [32], body-sensor networks [33], and much more. Building a
classification model to specifically use this fact should lead to more efficient attacks.
4 Functionality-aware software mitigation design
Touchtone eavesdropping mitigations require careful forethought and consideration of
leakage mechanics (Section 3.2) to effectively reduce leakage while not hampering
benign application behaviour. To accomplish this task, mitigations should reduce
touchtone information in motion sensor data while minimally altering or reducing any
other information. This paper adds an additional criteria that mitigations should be
able to deploy as a software update to support current devices. This section examines
several mitigation designs to show how some apparent designs such as sampling rate
reduction can only reduce touchtone leakage by reducing the total information in a
signal, hampering application functionality, while other designs such as anti-aliasing
filters can reduce touchtone leakage while minimally harming application functionality.
4.1 Designing for both privacy and functionality
While protecting the privacy of smartphone users from touchtone eavesdropping attacks
is an urgent issue this paper is addressing, we consider ensuring functionality to be a
second — but no less critical — criteria for mitigation design. The reason is that to be
adopted into mainstream systems the mitigation must also support the expected
functionality of motion sensor dependant applications. It is widely accepted that
security and privacy must support some level of functionality and usability [34–36] as
these features drive device markets and development.
Touchtone eavesdropping attackers and benign smartphone applications using the
motion sensors use the same signals — the motion sensor readings. As a result, limiting
the attackers’ capability might also inadvertently limit benign applications’ performance.
From a practical use standpoint, designing such mitigation for privacy protection thus
also requires the designers to be functionality-aware and guarantee minimal degradation
of functionality by carefully optimizing the implementation of their mitigation.
As discussed in Section 2.2 two significant factors for reducing information in a
signal — and thereby reducing application functionality — are (1) bandwidth reduction
and (2) signal distortion; conversely, minimizing bandwidth reduction and signal
distortion can better support application functionality. There is a near-unanimous trend
of higher sensor bandwidth leading to higher performance in previous research in
various activities such as human activity recognition [37], animal health monitoring, [38],
road quality assessment [39], etc. In addition, more commercialized techniques such as
using motion sensor readings for smartphone image stabilization [40] and rolling shutter
correction [41] rely on sample rates higher than 100 Hz, correlating to a bandwidth of
50 HZ. Thus reducing bandwidth below those ranges risks causing these applications to
malfunction and may stifle future application performance. A significantly distorted
signal could also impact application behavior and thus should also be minimized when
possible, but it is more difficult to ascertain how much distortion is permissible. An
ideal mitigation should support the original bandwidth with minimal distortion, only
removing traces of touchtone byproducts.
September 29, 2021 8/234.2 Apparent mitigations that sacrifice functionality
Mitigation strategies predicated on reducing available sensor bandwidth may not only
hinder application functionality, but also may ineffectively attenuate sensitive touchtone
information. This section analyzes apparent mitigations of sampling rate reduction and
digital low-pass filtering to show how touchtone information may persist despite
significant bandwidth reduction.
4.2.1 Sampling rate reduction
Lowering sampling rates directly lowers available bandwidth (Section 2.2) in an attempt
to also lessen the threat of acoustic eavesdropping; however, it is ineffective at
attenuating leakage (Fig 3b) primarily due to how aliasing places touchtone information
in a digital signal no matter the sampling rate (Section 3.2.2). Even at very low
frequencies, the eight touchtone frequencies still have aliases and thus leave discernible
traces. Although with such an extremely low sampling rate, it might be difficult for an
attacker to realistically differentiate between different touchtone aliases. But this also
affects dependant application’s functionality similarly. Our experiments back this
intuition (Section 6.2.1), as reduced sampling rates achieve minimal accuracy reduction
for our touchtone eavesdropping attack until having sampling rates under 100 Hz, a
forth of the original sampling rate.
4.2.2 Digital Low-pass filter
Low pass filters may at first seem like a natural mitigation for touchtone leakage, which
relies on aliasing, but a software digital low-pass filter alone cannot increase privacy
while preserving functionality (Fig 3c). To note, previous papers often do not specify
which low-pass filter design they suggest, and hardware changes to include analog low
pass filters may be a sufficient future defense as later discussed. However, when
discussing software-updatable mitigations, digital low-pass filters alone also do not
address the problem of aliasing. Referring back to Section 3.2.2, many of the resulting
touchtone aliases could be under the low-pass filter cutoff frequency that is chosen due
to the non-linear placement of alias frequencies. A lower cutoff frequency is more likely
to attenuate more aliases, but only because it is reducing the available bandwidth for all
motion sensor data. Thus it also suffers from needing to reduce available bandwidth to
provide better privacy. Our experiments demonstrate this pathology (Section 6.2.2).
4.3 Designing functionality-aware signal processing mitigations
A functionality-aware signal processing mitigation should minimally reduce available
bandwidth and distortion while attenuating touchtone leakage. Our approach is to rely
on established digital signal processing techniques designed to eliminate specific leakage
contributors, particularly aliasing. We propose a software update enabling oversampling
and digital anti-aliasing filters as a primary means of defense acoustic general acoustic
leakage. Additionally, we describe how one can utilize the predictable nature of
touchtone aliases in defense design.
4.3.1 Oversampling and digital anti-aliasing filters
Oversampling is the act of sampling at a faster rate than the bandwidth that you wish
to eventually provide, and can be used to create anti-aliasing filters that reduce
touchtone leakage while still providing the original bandwidth to current
applications (Fig 5). Oversampling can be implemented as a software update on most
phones as often the sampling rate is limited not by the sensing hardware, but by the
September 29, 2021 9/23operating system and sensor drivers to preserve power. Thus, a software update could
change these driver values to provide a faster sampling rate to the operating system.
The operating system can then perform some operation on the oversampled signal and
then downsample the signal to the original sampling frequency. If the oversampled
frequency is a multiple of the original, this can be trivially done by selecting x of y
number of samples from the oversampled data. If a the oversampling frequency is a
non-multiple, this could result in distortion of some kind being introduced into the
digitized signal. This method provides the same signal sampling rate and bandwidth as
current designs.
Touchtone Freqs
(a)
Touchtone Freqs
(b)
Fig 5. A need for oversampling. Digital anti-aliasing filters can attenuate more
touchtone aliases than low-pass filter without reducing available bandwidth due to use
of oversampling. In the example with sampling rate of fS = 400Hz, fN = 200 Hz, and
fc = 180 Hz, touchtone aliases (numbered 1 to 8 to correlate with the eight touchtone
frequencies in the blue box) are attenuated if filtered (diagonal red-lined area) and
otherwise unattenuated (green area). (a) A digital low-pass filter may be unable to
attenuate many touchtone frequency aliases without also eliminating significant
frequency information benign applications may rely on (Section 4.2.2). (b) A digital
anti-aliasing filter with the same fc can filter more frequencies due to the use of
oversampling (Section 4.3.1).
Digital anti-aliasing filters can employ oversampling to attenuate touchtone aliases
while minimally altering other information applications may desire. The key is that the
filters can remove any information above the original sampling rate’s Nyquist frequency
without effecting legitimate (i.e. not touchtone alias) data as seen in Fig 5. Due to the
non-linear nature of aliased frequencies, with oversampling the touchtone aliases may
fall into range and can be attenuated without affecting benign information. This is not
a panacea however, as aliases of sensitive information may still be in the original
sampling range, but such a design can attenuate touchtone aliases without attenuating
information hat applications may expect.
touchtone alias
4.3.2 Mitigations for targeted sensitive frequencies
When there is a case of known sensitive signals with specific frequencies, such as in the
case of mitigating touchtones, one can use frequency-specific mitigation designs such as
notch filters and selective sampling frequencies in combination with anti-aliasing or
other filtering techniques. A notch filter is a digital or analog filter design, similar to
the high and low pass filters in Section 2.2, that attenuates information with frequencies
between two cutoff frequencies. One could design multiple notch filters to attenuate
targeted sensitive frequencies such as the eight touchtone frequencies.
September 29, 2021 10/23Another approach is to use an anti-aliasing design while carefully selecting the
sampling frequency to maximize the number of targeted sensitive frequencies above fN
(Fig 6). The basis for this lies in the non-linear relationship between signal frequency,
sampling frequency, and the frequency alias as seen in Section 2.2. One can set the filter
cutoff frequency fc to design for a desired bandwidth. Then, the designer could change
the sampling rate until a desired number of aliases fall above fc so they can be
eliminated. This could allow a mitigation designer to select lower sampling frequencies
that result in greater protection from touchtone leakage.
touchtone alias
Fig 6. Choosing a sampling rate to mitigate touchtone leakage. A mitigation
designer desiring to attenuate the most touchtone aliases using the lowest sampling rate
fS when given a bandwidth fc to support can make use of the non-linear but
predictable nature of aliased frequencies. As the oversampled rate increases, the number
of aliased frequencies above fc will change. The designer can calculate this number of
attenuated aliases then select an appropriate sampling rate to meet design constraints.
5 Experimental Method
To evaluate our mitigations we recorded touchtone samples on multiple phones with and
without mitigations in place, then classified a test set of recordings to provide accuracy
numbers. Our machine learning classifier uses a variety of time and frequency features
along with selective axis integration (as explained in Section 3.3, to mimic a more
advanced adversary. We use the same classifier as an evaluation metric to determine the
accuracy of an adversary without any mitigations (a baseline) as well for both a baseline
(without mitigations) and with mitigations in place.
5.1 Data Collection
5.1.1 Hardware
We have three different hardware setups for motion sensor data collection. The first two
setups collect data from the four Android phones listed in 1 for baseline and
software-only mitigation evaluation; these two setups differ only in physical locations: a
quieter conference room versus a noisy server room. The conference room was next to a
busy atrium with the door closed to mimic a conference call setting, while the server
room was chosen to mimic a noisy environment measured at an average of 67 dB SPL as
measured by a General DSM403SD sound level meter [42]. Each setup used an Intel
NUC running Ubuntu 18.04 [43] as a base station, smart-phones (Table 1), cables, and
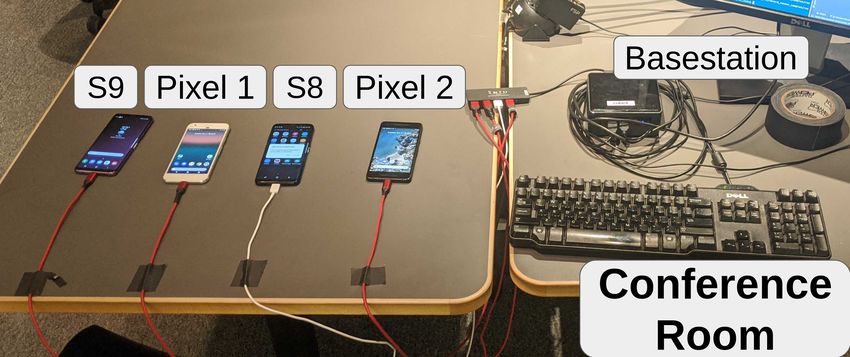
base station peripherals on a table (Fig 7). In this setup, the acoustic speaker was a
phone’s loudspeaker and the motion sensors (accelerometer and gyroscope) was the
same phone’s sensors. The base station used a python API for the Android Debug
Bridge [44] to upload a custom Android data collection program to each phone and for
other communication or file transfer.
The third hardware setup collects data at faster sampling rates for anti-aliasing
software filters and for testing on-board sensor anti-aliasing filtering. Phone hardware
September 29, 2021 11/23Fig 7. Data collection setup in conference room.
can collect at rates faster than what is made available to applications in smartphones to
limit power consumption. Although current phones do not support it, we test it with
external sensors to emulate a possible future mitigation. To that end, our setup uses a
LSM9DS1 breakout boards, a very similar chip to the ones in three of the
phones (Table 1), a Teensy 3.6 micro-controller, the same Intel NUC base station as in
the previous setup, and an external speaker connected to the NUC to produce audio.
The speaker was placed 10cm away from the LSM9DS1 breakout board. A python
program was used to produce audio on the speaker and interface with a custom sensor
collection program on the Teensy micro-controller.
Table 1. Motion sensor information for phones used in experiments.
Manufacturer Release Reported Sampling Rate (Hz)
and Model Date IMU Model Reported Measured
Google Pixel 1 Oct 2016 BMI160 400.00 401.69
Google Pixel 2 Oct 2017 LSM6DSM 400.00 409.96
Samsung Galaxy S8 Mar 2017 LSM6DSL 400.00 429.27
Samsung Galaxy S9 Mar 2018 LSM6DSL 415.97 413.61
Reported inertial measurement unit (IMU) model, which contains both an accelerometer
and gyroscope, and sampling rates are found via the Android Debug Bridge tool. Note
that the sampling rates are limited by the operating system, and not sensing hardware.
.
5.1.2 Recording
To reduce temporally correlated biases from data collection over a long period of time
the python3 program running on the base station first determines a randomized order
for all audio samples to record. The program then ensure proper setup of all devices for
the experiment. It then has the speaker for the experiment play each touchtone audio
clip in succession while recording motion sensor data. In the event with multiple devices
connected to the base station, only one speaker and sensor were used simultaneously.
Motion sensor data was collected at the fastest available sampling rate and saved and
sent back to the base station to save the recording to disk.
For each individual setup we recorded the motion sensor data as each individual
dial-tones was played for 0.5 s, with each tone being recording 250 times per setting for
a total of 4000 recordings. The data set was divided into training and test sets at 80%
September 29, 2021 12/23and 20% respectively. It was ensured that touchtones were divided equally during the
split (e.g. in the test set there was 50 samples of each of 16 touchtones).
5.2 Touchtone classifier
To serve as an evaluation metric we made a machine learning classifer (Fig 8) to mimic
that of an advanced adversary.
Motion Sensor Feature Axis Classifier
Extraction Selection
Accelerometer
X Statistical Optimal
Sound Features Axes
Y
Signal Z Mean AX
Variance AY XGBoost
Gyroscope Std. Dev AZ Inferred
... GX Touchtones
X
Y GY
FFT
Z GZ
Fig 8. Eavesdropping classifier. Our system extract signals features and selectively
combine useful motion sensor data from multiple sensors and axes to better classify
touchtones.
5.2.1 Selective integration of sensor data
To emulate a more advanced adversary, we build a classifiers that selectively integrates
feature data from multiple sensors into a single attack model based on the intuition that
each sensor axis can be a better or worse predictor for a given touchtone (Section 3.3).
Previous work has demonstrated classifiers for acoustic leakage onto motion
sensor [3, 4, 6], however to our knowledge no previous work has combined data from
both sensors simultaneously or selectively integrated axes into a single model. This
improvement works as each axis from each sensor carries some measure of unique
information. Selectively combining these sources of unique information should yield best
results.
Our method to selectively integrate axes is as follows. First the system imperially
ranks the axes in order of best predictor by building a model for each individual axis
and tests its accuracy on validation data. Then the system builds a model with the
most accurate two axes, then top three, etc, until a model with all axes as been tested.
Then the system selects the best performing model among the single-axis and multi-axis
models to use in actual testing. Once the best combination of axes have been chosen,
the axes will be selected in the Axis Selection step shown in Fig 8.
5.2.2 Features and Classifier Design
We briefly detail the feature extraction and classifier of our touchtone classifier in this
section. As a reminder, features are calculated per sensor axis, then features of only the
optimal combination of axes are included in the model as described in Section 5.2.1.
Time-alignment and Windowing: For feature extraction of a sample, our model
first time-aligns signals from different sensors (i.e. sample 1 from one signal correlates
with sample 1 of the others). Subsequently, it divides each time-series signal into a
September 29, 2021 13/23series of windows. Each window should correlate with windows of other signals (i.e.
window 1 in one signal correlates with window 1 of another signal).
Extract Statistical Features: The system calculates a series of statistics per window
per selected sensor axis, and concatenates these metrics to produce a single feature
vector. The set of statistical measurements (Table 2) are very similar to those used in
previous work [6].
Table 2. A list of features used in classification.
Mean Median Kurtosis Absolute Area % Mean Crossings
Minimum Variance Signal Power Standard Deviation Interquartile Range
Range Maximum Variation Spectral Entropy Fast Fourier Transform
Skew First, Second, Third Quantiles
The signal would be split into windows where the above features were calculated.
Zero-padding: Feature vectors with a different number of time windows, which may
happen due to experimental error, must have the same number of features for the
classifier to compare properly. The system zero-pads, or adds zeros or windows of zeros,
each feature vector to ensure the same length.
XGBoost Classifier: Our system uses xgboost to classify the extracted features from
the selected axes. Xgboost is a common classifier that uses gradient boosting and has
been shown to effective in several different applications [45].
5.2.3 Implementation details and hyper-parameter tuning
The system uses a python3 program to process the sensor recordings and subsequently
train and/or test recognition models. We utilize numpy, scipy, and other standard
python3 libraries to perform feature extraction as described previously. The system
then uses python3 XGBoost implementation with support libraries from Scikit-learn to
perform any training, validation, or testing of machine learning models. To select the
optimal combination of axes as described previously, the system would first train
separate models for individual axis. These axes would be then be ranked by individual
accuracy performance and axes would be added in order of highest accuracy and
evaluated. Last, for these eleven combinations (6 individual and 5 multi-axis) the
system would chose the best performing axis combination and use that for its model.
To choose specific feature and model hyper-parameters, we performed a randomized
grid search using data collected from a Pixel 2 phone in a conference room to imperially
pick parameters. The randomized grid search did not test every possible combination of
parameters in the interest of time, and thus it is possible more optimal parameters
could be chosen. The possible parameters for features and classifiers are shown in
Tables 3 and 4 respectively with selected parameters shown in bold. We tested these
settings against a commonly used feature set for audio classification with Mel Frequency
Cepstral Coefficients (MFCCs) [3] and another common classifier with Random
Forest [6] to provide a comparison against other commonly used selections. We took the
highest accuracy result to select feature and classifier settings. These settings stayed the
same through all testing.
5.3 Signal Processing Mitigations
September 29, 2021 14/23Table 3. Feature Settings.
Feature Setting Possible Choices
Frame Size (#vals) 10, 20, 50, 100
Statistic Features
Frame Step (#vals) 5, 10, 20
Window Length (s) 0.025, 0.05, 0.1, 0.2, 0.3, 0.5
MFCC
Window Step (s) 0.01, 0.05, 0.01
The optimum feature settings used in the final model are in bold.
Table 4. Classifier Settings.
Classifier Setting Possible Choices
learning rate 0.05, 0.10, 0.15, 0.20, 0.25, 0.30
max depth 3, 4, 5, 6, 8, 10, 12, 15
xgboost min child weight 1, 3, 5, 7
gamma 0.0, 0.1, 0.2 , 0.3, 0.4
colsample bytree 0.3, 0.4, 0.5 , 0.7
bootstrap True, False
max depth 10, 20, 30, 40, 50, 60, 70, 80, 90, 100, None
Random Forest min samples leaf 1, 2, 4
min samples split 2, 5, 10
200, 400, 600, 800, 1000, 1200, 1400
n-estimators
1600, 1800, 2000
The optimum feature settings used in the final model are in bold.
5.3.1 Selection
We selected a total of four signal processing mitigation designs to evaluate. Two designs,
a software-only low pass filter and reduced sampling rates, were chosen as they are
briefly mentioned in previous papers as possible mitigations for related work and may
seem like natural mitigations for touchtone leakage. However, our analysis (Section 4.2)
projects that both mitigations should have minimal effect on touchtone leakage without
significantly reducing the available information to all applications. The low-pass filter
used a Butterworth filter design with an order of 5.
The third and fourth mitigations, software and hardware digital anti-aliasing filters,
were chosen to better support application functionality by not reducing bandwidth
while still attenuating touchtone aliases. The tested software anti-aliasing filter design is
essentially oversampling combined with filtering as shown in Fig 5. Specifically, it uses
the oversampled data with a Butterworth low-pass filter and we test various filter
orders. The Butterworth filter provides a good balance with only slight signal distortion
and a sharper cutoff. The slight signal distortion means it should minimally affect
applications relying on sensor data while the sharper cutoff means it should
theoretically attenuate aliased signals further. Furthermore, this filter can be
implemented as a software update to any phone, but will require some computational
burden and cause some signal delay, which may be unacceptable for some applications.
The hardware digital anti-aliasing filter refers to the on-board anti-aliasing filter on
the LSD9DS1 breakout board, which should also be included on the LSM6DS(L/M)
sensors on three of the tested phones. This filter should work similarly in theory to
software anti-aliasing filter as they are both digital anti aliasing filters, but the exact
filter details are unfortunately black-box. The hardware filter benefits over the software
version in that it requires no computational burden and should require less signal delay,
but has the drawback that is less configurable and may not be available on some devices.
To note, it can be implemented as a software update should the hardware be available
September 29, 2021 15/23by changing values in the sensor driver.
5.3.2 Implementation Details
Implementation details for our four tested mitigations include:
1. Reduced sampling rate. The reduced sampling rate mitigation uses the
original motion sensor data from the conference room hardware setup but takes 1
sample of every n samples to emulate the effect of reducing sensor sample rate by
n. We vary n to test sampling rates from 400 Hz to as low as 50 Hz, with Nyquist
frequency and bandwidth equal to half the sampling rate.
2. Software low-pass filtering. The low-pass filter uses the original motion sensor
data from the conference room hardware setup with an unaltered sample rate but
applied the Python scipy Butterworth filter with an order of 5 for low-pass
filtering. The signal cut-off frequency was varied from 200, 150, 100 to 50 Hz.
This cut-off frequency effectively becomes the bandwidth of unattenuated
information in the signal.
3. Software (digital) anti-aliasing filtering. The software anti-aliasing filter
uses the oversampled data from the sensor breakout board setup and then applies
a scipy Butterworth filter (the same as from the original low-pass filter) with a
cutoff frequency equal to the eventual desired bandwidth. We vary this desired
bandwidth to use as comparison against other mitigations. The filtered signal is
then downsampled (similarly to the reduced sampling rate mitigation) to the
desired bandwidth. We also vary filter order in this evaluation.
4. Hardware (analog) anti-aliasing filtering. The hardware anti-aliasing filter
collects data from the sensor breakout board, changing the sensor’s on-board
filtering settings. There are four bandwidth configurations. The data from the
four configurations is then processed by the classifier.
6 Evaluation Results and Analysis
In this section we report the attack and mitigation results with the setups described in
Section 5. We analyze and summarize the findings of our assessment of the
eavesdropping attack and different mitigations.
Software low-pass filtering and reducing the sensor sampling rate can only
moderately mitigate the attack while significantly hindering data bandwidth (and
thereby application functionality). Software and hardware digital anti-aliasing filters
cannot eliminate touchtone eavesdropping, but are able to more significantly mitigate
the threat while also preserving more data bandwidth.
6.1 Baseline evaluation metrics: attack effectiveness
We find that the unmitigated touchtone classifier achieves accuracy exceeding 99% for
three of the four phones as shown in Fig 9, demonstrating that malicious applications
can effectively recover user input.
6.1.1 Differences between phone models
One of the phones, the Pixel 1, performs poorest in nearly every test despite similar
sampling rates as the other phones. The highest touchtone inference accuracy for Pixel
1 does not exceed 85% while other phones can all achieve over 99%. The most obvious
September 29, 2021 16/23100 99 99
100
85
80
60
40
20
(a)
100 100 97
100
84
80
60
40
20
(b)
Fig 9. Baseline results for the touchtone eavesdropper. (a) Conference room
and (b) Server room hardware setups. For each phone, we show the accuracy a
classification model trained on individual axes alone, then show the accuracy for the
model trained on the optimal combination of axes.
explanation would be that it has different inertial measurement unit produced by a
different manufacturer than all other phones (Table 1).
This result demonstrates that factors other than sampling rates can vary recognition
rates. These factors could include: signal propagation path that attenuates the acoustic
signal, less sensitive sensors, different frequency responses, or different sensor
configurations. This result also suggests that some motion sensors may be more
resistant to touchtone leakage than others. An examination on which motion sensors are
less susceptible could provide insight into future hardware-based mitigations.
6.1.2 Accelerometer vs. gyroscope axis accuracies
Classification based on data from an accelerometer axis achieved higher average
accuracy gyroscope axis data. While the exact reasons remain unclear, we provide a
possible assumption. Accelerometers measure linear acceleration while gyroscopes
measure angular acceleration. The phone’s speakers produce audio through vibration,
and then vibration travels through the phone body to affect both the accelerometers
and gyroscopes. Vibration acts as linear acceleration in this case, which the
accelerometer is designed to measure. While the gyroscope is not designed to measure
linear acceleration, its sensing mass(es) still vibrate and these vibrations are quantized.
Thus, the intent of each sensor changes the effectiveness for this particular scenario.
6.1.3 Selective integration of sensor axes.
Selective integration of axis data only achieved significantly higher results for one phone
model, the Google Pixel 1, but it did improve accuracy versus a single axis for all but
one case. This case was the test for the Google Pixel 2 in the conference room, and it
could not improve accuracy as accuracy was already 100%. For all phones but the
Pixel 1, the improvement was limited because the results were already near 100%
accuracy. However, for the Pixel 1 the selective-axis integration improved as much as
40% over single-axis accuracies. This indicates that in cases with noisier data, the
September 29, 2021 17/23selective axis integration could help a classifier model utilize the various touchtone
information in each axis to achieve higher accuracies.
6.2 Mitigation strategy evaluations
6.2.1 Reduced Sampling Rates
The results for the reduced sampling rates mitigation support the theoretical analysis in
Section 4.2.1 to show that this approach does not greatly affect touchtone
eavesdropping until sampling rates are reduced significantly (Fig 10a). Once again, this
is because touchtone aliases will remain in the digitized signal no matter the sampling
rate, and this mitigation affects eavesdropping accuracy by reducing the total
information available (affected functionality of benign applications). More concretely in
our results the reduced sampling rate does not seem to have much of an effect until the
sampling frequency is roughly 100 Hz, and thus bandwidth reaches around 50 Hz.
100 100
Accuracy (%)
Accuracy (%)
80 80
Galaxy-S8 No Filter Galaxy-S8
60 Galaxy-S9 60 Galaxy-S9
Pixel1 Pixel1
Pixel2 Pixel2
40 40
200 150 100 50 0 200 150 100 50
Nyquist Freuency Bandwidth (Hz) Cutoff Frequency Bandwidth(Hz)
(a) (b)
Fig 10. Functionality-unaware mitigation results. (a) Results for a
downsampling mitigation with listed bandwidth equivalent to half the used sampling
rate. (b) Results for the low-pass filter mitigation with listed bandwidth equivalent to
the cutoff frequency used. Both mitigations do not greatly reduce touchtone
eavesdropping accuracy until bandwidth is under 50 Hz, which could hinder
functionality for benign applications.
6.2.2 Software Low-pass Filter
An evaluation of software low-pass filter shows that, as expected (Section 4.2.2), they
may also do not seem to affect accuracy significantly until lower bandwidths are
researched. As Fig 10b demonstrates, in our tests the touchtone accuracy results were
only minimally affected until a very low 40 Hz cutoff frequency was reached. In fact in
some cases, such as with the Pixel 1’s accuracy results, the average accuracy actually
improved when using cutoffs of 160 Hz and 120 Hz, which could indicate a large amount
of noise in the 160 Hz to 200 Hz range for that particular phone. However, for the
Pixel 2 the accuracy for touchtones remained essentially unaffected even at a 40 Hz
cutoff frequency.
6.2.3 Software and Hardware Anti-aliasing Filter
Our experiments show that anti-aliasing filters are more effective than either pure
low-pass filters or sampling rate reduction. For example, at with a cutoff
frequency/bandwidth of 100 Hz, the order 5 and 8 software anti-aliasing filters reduce
the touchtone eavesdropping accuracy from over 99% to below 40% (see Fig 11), while
September 29, 2021 18/23neither the pure low-pass filter nor the reducing sampling rate mitigation could reduce
the accuracy to below 80%.
100
Accuracy (%)
80
No AA
60
SW Ord.=2
SW Ord.=5
40
SW Ord.=8
HW
20
400 200 100 50 25
Cutoff Frequency Bandwidth (Hz)
Fig 11. Anti-aliasing results. While not completely eliminating the attack, the
software anti-aliasing filter is able to significantly reduce the accuracy of the touchtone
eavesdropper and speech snooper attacks. Additionally, with better hardware
implementations (higher sampling rates), this mitigation could be even more effective
while preserving bandwidth.
Both the software and hardware anti-aliasing filter work to some degree, but neither
are perfect mitigations. Most manufacturers may expect a built-in, hardware based
“anti-aliasing filter” to fully filter aliases without looking into the details. While
somewhat effective, it was actually the software based solution we found to work best.
We do not currently know the exact filter parameters of the hardware filter due to the
black box nature of the design. However, the hardware implementation would likely
increase in effectiveness by increasing filter order, as seen in our software
implementation. The 8th order, 200 Hz bandwidth software anti-aliasing filter is likely
the best solution from our experiments as it preserves the 200 Hz bandwidth used by
most of our phones while still having a significant effect on the attacks.
7 Discussion
7.1 Hardware solutions
In this paper we do not evaluate sensor hardware changes for mitigations as they would
require mitigations as they cannot be implemented as a software update.However, some
mitigations embedded into circuitry could serve as long-term solutions. Analog filtering
mitigations schemes should work well against touchtone leakage as they can directly
attenuate the original touchtone frequencies before sampling, and therefor before
aliasing. Additionally, randomized sampling could be used to mitigate some of the
aliasing effects.
7.2 Application to other acoustic leakage
The analysis of the paper focuses on touchtones, but it is largely applicable to other
forms of acoustic leakage. We focus on touchtone leakage as it provides a high-impact,
yet simple signal for attack and mitigation analysis when compared to other potential
targets such as speech. Touchtones, while simple, are still difficult to mitigate and
possibly more difficult than speech as attackers likely need less information to classify
touchtones over complex signals such as speech. Thus, mitigation strategies that work
for touchtones should largely work for speech.
September 29, 2021 19/23You can also read