University of Kentucky measurements of wind, temperature, pressure and humidity in support of LAPSE-RATE using multisite fixed-wing and rotorcraft ...
←
→
Page content transcription
If your browser does not render page correctly, please read the page content below
Earth Syst. Sci. Data, 12, 1–15, 2020
https://doi.org/10.5194/essd-12-1-2020
© Author(s) 2020. This work is distributed under
the Creative Commons Attribution 4.0 License.

                University of Kentucky measurements of wind,
              temperature, pressure and humidity in support of
                 LAPSE-RATE using multisite fixed-wing and
                     rotorcraft unmanned aerial systems
         Sean C. C. Bailey1 , Michael P. Sama2 , Caleb A. Canter1,a , L. Felipe Pampolini2 , Zachary S. Lippay1 ,
                 Travis J. Schuyler3,b , Jonathan D. Hamilton1,c , Sean B. MacPhee1,d , Isaac S. Rowe1 ,
              Christopher D. Sanders2 , Virginia G. Smith1,e , Christina N. Vezzi1 , Harrison M. Wight1,c ,
                         Jesse B. Hoagg1 , Marcelo I. Guzman3 , and Suzanne Weaver Smith1
            1 Department    of Mechanical Engineering, University of Kentucky, Lexington, Kentucky 40506, USA
          2 Department    of Biosystems and Agricultural Engineering, University of Kentucky, Lexington, Kentucky
                                                            40546, USA
                     3 Department of Chemistry, University of Kentucky, Lexington, Kentucky 40506, USA
                                   a present address: AHS, Hodgenville, Kentucky 42748, USA
                b present address: Atmospheric Turbulence and Diffusion Division, Air Resources Laboratory,

                    National Oceanic and Atmospheric Administration, Oak Ridge, Tennessee 37830, USA
            c present address: Department of Aerospace Engineering Sciences, University of Colorado Boulder,

                                                  Boulder, Colorado 80303, USA
                        d present address: Bastian Software Solutions, Louisville, Kentucky 40223, USA
             e present address: Department of Aerospace and Ocean Engineering, Virginia Polytechnic Institute

                                      and State University, Blacksburg, Virginia 24061, USA
                               Correspondence: Sean C. C. Bailey (sean.bailey@uky.edu)

                                  Received: 3 April 2020 – Discussion started: 16 April 2020
                                  Revised: 1 July 2020 – Accepted: 1 July 2020 – Published:

      Abstract. In July 2018, unmanned aerial systems (UASs) were deployed to measure the properties of the
      lower atmosphere within the San Luis Valley, an elevated valley in Colorado, USA, as part of the Lower At-
      mospheric Profiling Studies at Elevation – a Remotely-piloted Aircraft Team Experiment (LAPSE-RATE). Mea-
      surement objectives included detailing boundary layer transition, canyon cold-air drainage and convection ini-
      tiation within the valley. Details of the contribution to LAPSE-RATE made by the University of Kentucky are
      provided here, which include measurements by seven different fixed-wing and rotorcraft UASs totaling over
      178 flights with validated data. The data from these coordinated UAS flights consist of thermodynamic and
      kinematic variables (air temperature, humidity, pressure, wind speed and direction) and include vertical pro-
      files up to 900 m above the ground level and horizontal transects up to 1500 m in length. These measurements
      have been quality controlled and are openly available in the Zenodo LAPSE-RATE community data repository
      (https://zenodo.org/communities/lapse-rate/, last access: 23 July 2020), with the University of Kentucky data
      available at https://doi.org/10.5281/zenodo.3701845 (Bailey et al., 2020).

Published by Copernicus Publications.
2                 S. C. C. Bailey et al.: Kentucky fixed-wing and rotorcraft UAS measurements in support of LAPSE-RATE

                                                        1   Introduction                                                    course of the week, the team conducted over 178 flights
                                                                                                                            yielding vetted observation data. Details about the systems
                                                        This paper discusses the systems and contribution of the Uni-       used, their deployment, and quality-control checks applied
                                                        versity of Kentucky researchers to the Lower Atmospheric            to the data are described in the remainder of the paper, with
                                                        Profiling Studies at Elevation – a Remotely-piloted Aircraft        the data files openly available (Bailey et al., 2020).
                                                        Team Experiment (LAPSE-RATE) campaign (de Boer et al.,                 The following sections of this paper include descriptions
                                                        2020b) conducted from 13 through 19 July 2018 in the                of the diverse UASs and ground systems used by the Uni-
                                                        San Luis Valley in Colorado, USA. In this campaign un-              versity of Kentucky during LAPSE-RATE, followed by de-
                                                        manned aerial system (UAS)-based atmospheric science re-            tails of measurement locations and completed flights. Data
                                                        search teams cooperated with researchers from the National          processing and quality-control specifics are included, which
                                                        Center for Atmospheric Research (NCAR), the National Se-            provide information needed by those wanting to use these
                                                        vere Storms Laboratory (NSSL), and the National Oceanic             data. Examples of some of the features observed within the
                                                        and Atmospheric Administration (NOAA) (de Boer et al.,              data are highlighted as well.
                                                        2020a) to conduct UAS sensor intercomparison, along with
                                                        separate days of UAS and ground observations focused on
                                                                                                                            2     Description of the UASs and ground systems
                                                        boundary layer transition, canyon cold-air drainage and con-
                                                        vection initiation. This paper describes the contribution from      2.1    BLUECAT5 UAS
                                                        University of Kentucky researchers towards the campaign
                                                        objectives, including a description of the systems used and         Four fixed-wing UASs were used by the University of Ken-
                                                        discussion of the data acquired during the LAPSE-RATE               tucky during the LAPSE-RATE measurement campaign.
                                                        campaign (de Boer et al., 2020b).                                   These UASs, of which one is shown in Fig. 1a, were con-
                                                           University of Kentucky’s research in UAS flight testing          structed from Skywalker X8 airframes, modified to introduce
                                                        evolved over more than 450 flights conducted to evaluate            semiautonomous operation by integrating a 3DR Pixhawk
                                                        performance of deployable-wing unmanned aircraft (Jacob             autopilot, and ruggedized by strengthening wing spars, skin-
                                                        et al., 2005, 2007; Thamann et al., 2015), before expanding         ning the aircraft, adding Kevlar landing skids, and shielding
                                                        into atmospheric turbulence (Witte et al., 2016, 2017), for-        to minimize the ingestion of dirt into the motor. Referred
                                                        mation and flight control (Mullen et al., 2016; Heintz et al.,      to as the Boundary Layer Unmanned Experiment for the
                                                        2019; Wellman and Hoagg, 2018; Heintz and Hoagg, 2019;              Characterization of Atmospheric Turbulence generation five
                                                        Lippay and Hoagg, 2019), and measurement of atmospheric             (BLUECAT5) UASs (Witte et al., 2017), the aircraft had en-
                                                        gas concentrations (Schuyler and Guzman, 2017; Schuyler             durance of up to 45 min with 20 m s−1 cruise speeds and were
                                                        et al., 2019a, b) as well as participants in the Collabora-         catapult launched and skid landed. The four aircraft used here
                                                        tion Leading Operational UAS Development for Meteorol-              are identified as BCT5B, BCT5C, BCT5D and BCT5E.
                                                        ogy and Atmospheric Physics (CLOUDMAP) program (Ja-                    In the configuration used for LAPSE-RATE, the instru-
                                                        cob et al., 2018). The CLOUDMAP program focused on                  mentation allowed for the measurement of three components
                                                        the development of UAS technologies for meteorology and             of wind, as well as pressure, temperature and humidity. Air-
                                                        atmospheric science and resulted in advancement of capa-            speed information used by the autopilot was acquired using
                                                        bilities for atmospheric observations with UASs, as demon-          a 30 cm long pitot–static CE1 tube extending from the nose of
                                                        strated via multiuniversity flight campaigns (Smith et al.,         the aircraft. In addition, the pitot–static tube was used to pro-
                                                        2017), via validation experiments (Barbieri et al., 2019) and       vide a reference static pressure for a custom-manufactured
                                                        through observations of the surface layer transitions during        five-hole pressure probe used to measure the velocity vec-
                                                        the 2017 total eclipse (Bailey et al., 2019).                       tor of the air relative to the aircraft. Pressure readings from
                                                           For the LAPSE-RATE campaign, the University of Ken-              each port of the five-hole probe were acquired using TE Con-
                                                        tucky deployed four fixed-wing UASs and three rotorcraft            nectivity, Switzerland, 4515-DS5A002DP differential pres-
                                                        UASs, which measured pressure, temperature, relative hu-            sure transducers with a 0.5 kPa range. Analog output from
Please note the remarks at the end of the manuscript.

                                                        midity, horizontal wind magnitude, vertical wind magnitude          the sensors was digitized at 16 bit resolution at a rate of
                                                        and direction. The UASs were used to measure these ther-            400 Hz with a 200 Hz passive resistor–capacitor low-pass fil-
                                                        modynamic and kinematic variables at altitudes up to 900 m          ter used for anti-aliasing. Digitization was performed using a
                                                        above ground level (a.g.l.). A surface flux tower was also de-      MCC-DAQ USB-1608FS-PLUS multifunction data acquisi-
                                                        ployed, capable of measuring net solar radiation, soil tem-         tion system controlled by a Kangaroo portable PC.
                                                        perature, ground heat flux, surface wind and turbulence and            Each five-hole probe was calibrated for directional re-
                                                        the near-surface temperature gradient. These assets were de-        sponse using a 0.6 m×0.6 m wind tunnel. The calibration fol-
                                                        ployed to seven different sites over the course of LAPSE-           lowed a standard calibration technique outlined by Treaster
                                                        RATE, measuring at up to five sites simultaneously to con-          and Yocum (1978) which was implemented following the re-
                                                        tribute to scientific objectives targeting convection initiation,   sults presented by Wildmann et al. (2014). During these stud-
                                                        boundary layer transition and cold-air drainage. Over the           ies, the probe tubing length was optimized to provide a fre-

                                                        Earth Syst. Sci. Data, 12, 1–15, 2020                                                    https://doi.org/10.5194/essd-12-1-2020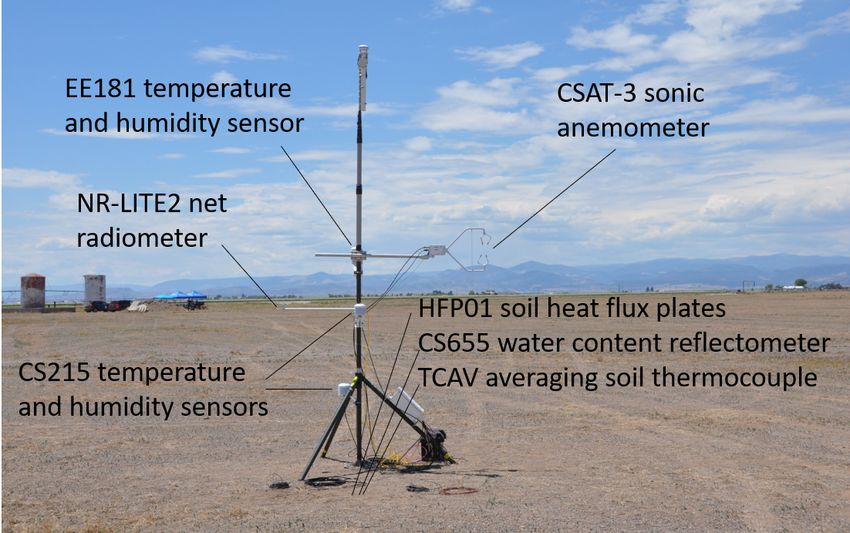
S. C. C. Bailey et al.: Kentucky fixed-wing and rotorcraft UAS measurements in support of LAPSE-RATE                             3

quency response on the order of 100 Hz. At the typical cruise     change. Used for vertical profiling measurements, this air-
speed of BLUECAT5, this frequency response translates to a        craft was typically operated with 2 m s−1 descent and 3 m s−1
spatial measurement resolution of approximately 0.2 m. Ad-        ascent velocities, which optimizes the number of vertical pro-
ditional wind and water tunnel studies verified that position-    files which could be obtained from a single battery charge
ing the measurement volume of the probe 18 cm upstream of         while maintaining the thermodynamic data within a nomi-
the nose of the aircraft was sufficient to minimize interfer-     nally 2.5 m measurement resolution.
ence effects from the airframe (Witte et al., 2017).                 For measuring the pressure, temperature and relative hu-
   Six-degrees-of-freedom position and rate information           midity, the UAS was equipped with an International Met Sys-
was provided by a VN-300 manufactured by VectorNav.               tems iMet-XQ-2 UAV sensor, in a custom mount below one
The VN-300 provided a heading accuracy of ±0.3◦ and               of the rotors to ensure sufficient aspiration of the sensors with
pitch/roll accuracy of ±0.1◦ with ground velocity accuracy        solar radiation shielding of the humidity and thermistor pro-
of ±0.05 m s−1 . The orientation information was sampled at       vided by the mount. Wind speed and direction sensing was
200 Hz by custom software running on the Kangaroo PC.             provided by a TriSonica Mini sonic anemometer manufac-
   Pressure, temperature and humidity were measured us-           tured by Applied Technologies with a manufacturer-provided
ing an International Met Systems iMet-XQ UAV sensor. The          accuracy of ±0.1 m s−1 and ±1◦ in wind speed and direction
iMet pressure sensor provides a ±1.5 hPa accuracy for pres-       respectively. The anemometer was mounted on a 0.38 m car-
sure, with the humidity sensor supporting a full 0–100 % RH       bon fiber post above the main body of the rotorcraft with
range at ± 5 % RH accuracy with a resolution of 0.7 % RH.         the optimal mast height determined through laboratory tests
The iMet-XQ temperature sensor provides a ±0.3 ◦ C accu-          consisting of increasing the post length until the UAS motors
racy with a resolution of 0.01 ◦ C up to a maximum of 50 ◦ C.     running at full speed did not result in a change in anemome-
The stated response times of these sensors are on the order of    ter reading. Additional laboratory calibration was conducted
10 ms for pressure, 5 s for humidity and 2 s for temperature      in a 0.6 m×0.6 m wind tunnel to account for blockage effects
in still air, with the iMet-XQ UAV system sampling these          from the sensor housing with calibration applied a posteriori.
sensors at 1 Hz. The iMet-XQ sensor was mounted on top            Although nominally a three-component anemometer, it had
of the aircraft with the thermistor exposed to the airflow but    an acceptance cone for vertical winds of ±30◦ to the vertical
shielded by a 3D-printed acrylonitrile butadiene styrene arch     which, when exceeded, contaminated the horizontal compo-
designed to protect it from heating via solar radiation.          nents of velocity as discussed in Sect. 4.
   To determine the wind velocity vector, the velocity of            Digital output from the sonic anemometer was logged at
the air measured by the five-hole probe in an aircraft-fixed      10 Hz during flight using a Slerj RS232 data logger and an-
frame of reference is transformed into an Earth-fixed frame       alyzed a posteriori following the same procedures utilized
of reference using inertial velocity provided by the VN-300.      for the fixed-wing aircraft, but with the aircraft position and
Following this transformation, the aircraft’s velocity relative   orientation information extracted at 10 Hz from the autopilot
to the ground was subtracted, leaving the three-component         flight logs. Corresponding pressure, temperature and humid-
wind vector (Axford, 1968; Lenschow, 1972; Broxmeyer and          ity data were interpolated to 10 Hz but should only be con-
Leondes, 1964). Further details are available in Witte et al.     sidered resolved to 1 Hz for pressure, 0.5 Hz for temperature
(2017) with additional corrections applied as described in Al-    and 0.2 Hz for humidity.
Ghussain and Bailey (2020) to correct for probe orientation
bias. During this postprocessing step, all data were resam-       2.3   S1000 UAS
pled to 200 Hz and aligned in time via cross correlation of the
signals measured by the different systems. However, the data      Pressure, temperature, humidity and wind measurements
from these aircraft should only be considered to be resolved      were also conducted using a DJI S1000 octocopter, identified
to 100 Hz for wind, 1 Hz for pressure, 0.5 Hz for temperature     here as the S1000, shown in Fig. 1c. The S1000 was modified
and 0.2 Hz for humidity.                                          for semiautonomous operation by implementing a Pixhawk
                                                                  autopilot and was capable of approximately 20 min of flight
2.2   SOLOW UAS
                                                                  time for each battery pack. Used for vertical profiling mea-
                                                                  surements, this aircraft was typically operated with 1 m s−1
Pressure, temperature, humidity and wind measurements             descent and ascent velocities, which optimizes the altitude
were also conducted using a 3DRobotics Solo quadrotor             which could be obtained for flight measuring a single verti-
identified here as the SOLOW and shown in Fig. 1b. This           cal profile on a single battery charge while minimizing the
UAS was capable of semiautonomous flight through a Pix-           spatial resolution of the thermodynamic data to nominally
hawk autopilot and had approximately 10 min of endurance          1 m.
for each battery, but near-continuous operations were pos-           Pressure temperature and relative humidity measurements
sible by keeping the sufficient batteries charged and avail-      were provided by an International Met Systems iMet-XQ
able to ensure that the aircraft could be returned to flight      system. These systems log data at 1 Hz, with a stated re-
with approximately 3 to 5 min on the ground for a battery         sponse and accuracy of 10 ms, ±1.5 hPa for pressure; 1 s,

https://doi.org/10.5194/essd-12-1-2020                                                  Earth Syst. Sci. Data, 12, 1–15, 2020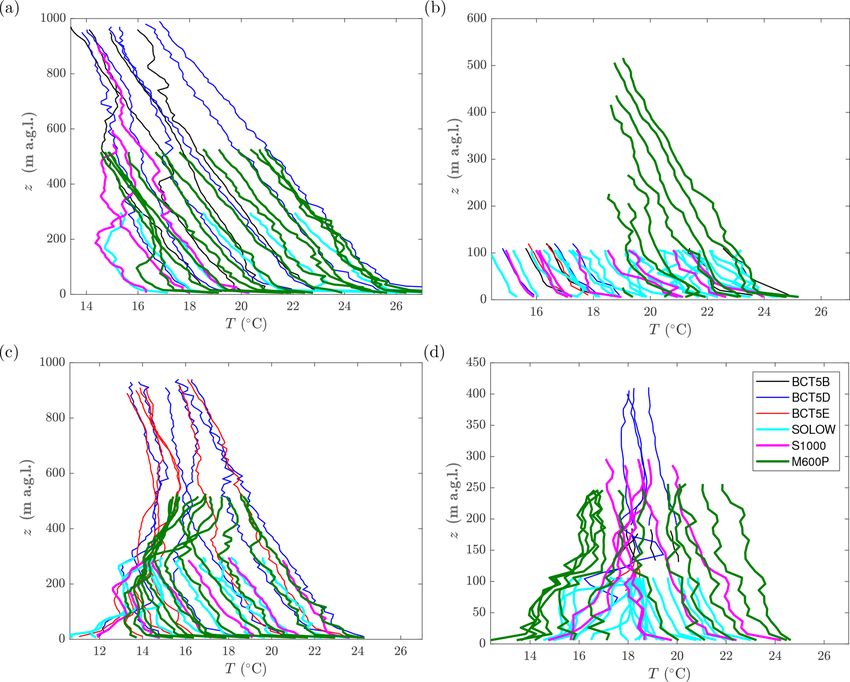
4                  S. C. C. Bailey et al.: Kentucky fixed-wing and rotorcraft UAS measurements in support of LAPSE-RATE

±0.3 ◦ C for temperature; and 0.6 s, 4 ± 0.5 % RH for rela-      was logged at 20 Hz via RS232 using a Kangaroo portable
tive humidity. The sensors were located under one of the air-    computer mounted in a weatherproof enclosure.
craft’s rotors for sensor aspiration in a housing designed to       The tower was equipped with a Campbell Scientific E+E
minimize the impact of solar radiation on the sensing.           Elektronik EE181 digital temperature and humidity sen-
   To measure wind speed and direction an R.M. Young,            sor at 2 m having accuracy of ±0.2 ◦ C and ±2.3 % RH.
USA, model 81000 ultrasonic anemometer was mounted on            At 1.5 and 0.75 m the tower had two additional Campbell
a mast with its measurement volume located 0.55 m above          Scientific CS215 digital temperature and humidity sensors
the rotor plane, at the centerline of the aircraft. The Young    (±0.4 ◦ C, ±4 % RH). All temperature and humidity sensors
81000 could measure wind speeds up to 40 m s−1 at a res-         were housed in a solar radiation shield and logged every 3 s
olution of 0.01 m s−1 with an accuracy of ±0.05 m s−1 . The      via a Campbell Scientific CR1000X measurement and con-
anemometer was set to output velocity and sonic temperature      trol data logger.
data as analog signals, which were digitized at a nominal rate      Additional sensors on the flux tower logged every 3 s in-
of 70 Hz by a Mayhew labs 16 bit analog-to-digital converter     cluded a Setra 278 digital barometer, a Kipp & Zonen NR-
controlled by an Arduino embedded computer.                      LITE2 net radiometer, two Hukseflux HFP01 soil heat flux
   As with the SOLOW UAS, the data were processed a              plates, a Campbell Scientific CS655 water content reflec-
posteriori to subtract aircraft motion from the wind data.       tometer, and a Campbell Scientific TCAV averaging soil ther-
To do so the aircraft position and orientation information,      mocouple probe. All sensors were factory calibrated within
sonic anemometer data and iMet-XQ data were interpolated         1 year of use, although intercomparison measurements in a
to 10 Hz. Although pressure, temperature and humidity data       laboratory environment revealed that the EE181 sensor had a
were interpolated to 10 Hz, they should only be considered       consistent 0.5 ◦ C bias which was removed from the measure-
resolved to 1 Hz for this aircraft.                              ments reported here.

                                                                 3   Description of measurement location(s), flight
2.4   M600P UAS
                                                                     strategies and completed flights/sampling
An additional UAS was used for pressure, temperature
and humidity profiling, based on the DJI M600P hexa-             The systems described above were deployed at different loca-
copter platform. This aircraft, shown in Fig. 1d, used the       tions throughout the LAPSE-RATE measurement campaign.
manufacturer-provided batteries and autopilot, allowing for      These locations are identified as Leach Airfield, Echo, Fox-
semiautonomous operation with approximately 20 min of            trot, Kilo, Oscar, Saguache Airfield and Poison Gulch. Ap-
flight time. Here we identify this UAS as the M600P.             proximate latitude and longitude of these locations are pro-
   Instrumentation on this aircraft was provided by two In-      vided in Table 1, with flight locations graphically illustrated
ternational Met iMet-XQ2 sensing systems. These sensors          in Fig. 3. Flight locations and UAS dispositions varied by day
are the same type as described above in the description of       of operations and measurement objective, with UAS mea-
the S1000; however, on the M600P these two were mounted          surements being conducted in the morning and early after-
below opposite rotors to maintain weight and balance. Data       noon. Aircraft dispositions and measurement times are out-
from both sensors were logged independently at 1 Hz.             lined below and summarized in Table 2. The flux tower was
   Unlike with the other UASs, the autopilot data were not       located at Leach Airfield and was measuring continuously
available for use in postprocessing the iMet-XQ2 sensor data.    until the afternoon of 18 July 2018.
Instead, the intrinsic iMet-XQ2 GPS and altimeter data were         The Leach Airfield, Echo, Foxtrot, Kilo and Oscar sites
used to identify UAS position and altitude information, with     were centrally located in the San Luis Valley, consisting
the pressure, temperature and humidity data from one sen-        largely of agricultural land having minimal elevation change
sor interpolated to sample times corresponding to the other      and loose, dry soil. The Poison Gulch and Saguache Airfield
sensor to unify the data stream. The intrinsic iMet-XQ2 GPS      sites were located at two points along a narrow valley leading
was a u-blox CAM-M8 with a vertical accuracy of 12 m and         into the larger San Luis Valley. The Poison Gulch site was a
response time of 1 s.                                            location where the valley was narrow with steep valley walls,
                                                                 whereas the Saguache Airfield site was located closer to the
                                                                 mouth of the valley, where the valley was much broader and
2.5   Flux tower                                                 had shallower elevation changes.
                                                                    Civil twilight during the measurement period started be-
Additional ground-based measurements were provided by            tween 05:24 MDT on 15 July and 05:27 MDT on 19 July,
a 2 m surface flux tower shown in Fig. 2. The tower was          with the corresponding sunrise times being between 05:54
equipped with a three-component sonic anemometer (Camp-          and 05:57 MDT. Sunsets for the same period were between
bell Scientific CSAT-3) for measuring wind speed and di-         20:26 and 20:24 MDT, with the civil twilight ending between
rection. Sensor accuracy was between ±2 % and ±6 % with          20:57 and 20:54 MDT.
±0.08 m s−1 bias precision. Output from the anemometer

Earth Syst. Sci. Data, 12, 1–15, 2020                                                https://doi.org/10.5194/essd-12-1-2020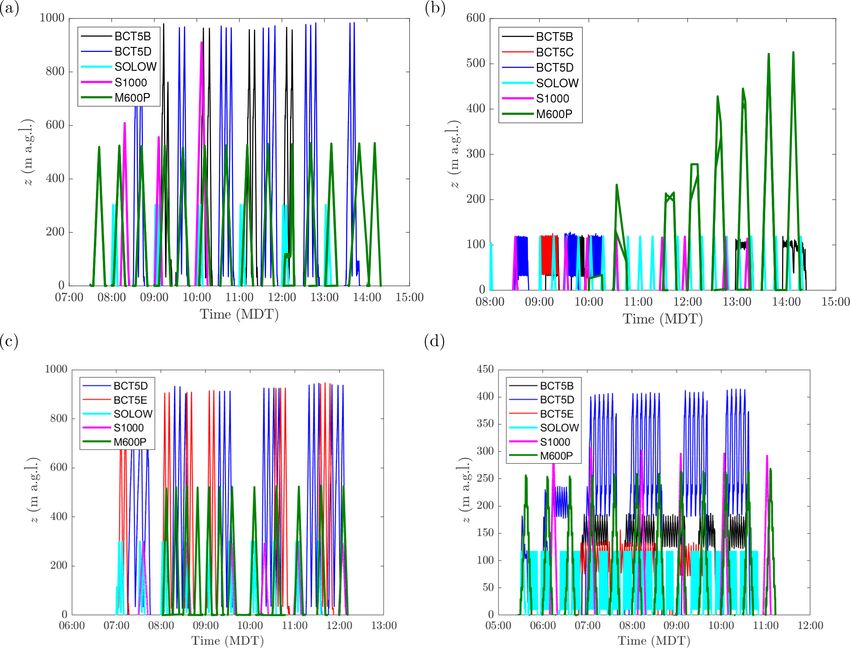
S. C. C. Bailey et al.: Kentucky fixed-wing and rotorcraft UAS measurements in support of LAPSE-RATE                             5

Figure 1. Photographs of (a) BCT5, (b) SOLOW, (c) S1000, and (d) M600P showing location of sensors on each aircraft.

                                                                         All flights were conducted legally under either FAA Part
                                                                      107 regulations, which limited flight operations to 121 m
                                                                      or below, or under the University of Kentucky’s Federal
                                                                      Aviation Authority (FAA) Certificate of Authority (COA)
                                                                      2018-WSA-1730-COA effective from 13 to 22 July 2018.
                                                                      The COA authorized operation of small UAS weighing less
                                                                      than 55 pounds (25 kg) and operating at speeds of less
                                                                      than 87 knots (45 m s−1 ) in Class E and G airspace below
                                                                      914 m a.g.l. and not exceeding 3657 m above mean sea level
                                                                      (m.s.l.) in the vicinity of Alamosa County, Colorado, un-
                                                                      der the jurisdiction of the Denver Air Route Traffic Con-
                                                                      trol Center (ARTCC). Standard COA provisions were ap-
                                                                      plied, including those for airworthiness, operations, flight
                                                                      crew, safety, notices to airmen (NOTAMs), reporting and reg-
Figure 2. Photograph flux tower in position at Leach Airport illus-
                                                                      istration. Special provisions were also necessary for coordi-
trating sensor configuration.
                                                                      nation and deconfliction of operations of multiple organiza-
                                                                      tions. Rather than authorizing different overlapping operat-
Table 1. Latitude and longitude of operation locations in World       ing areas defined by the preplanned positioning for each or-
Geodetic System 84 (WGS 84) decimal degrees.                          ganization, discussions among the organizations, FAA and
                                                                      Denver air traffic control, led to definition of one common
        Location                Latitude       Longitude              area encompassing the entire LAPSE-RATE plan of oper-
        Leach Airfield        37.779291     −106.039235               ations. With this, additional coordination and deconfliction
        Echo                  37.705015     −106.093502               became necessary with airports and several intersecting mil-
        Foxtrot               37.646877     −105.926981               itary training routes (MTRs). Two NOTAM subareas were
        Kilo                  37.712359     −105.947122               defined so that one or both could be issued with the required
        Oscar                  37.86782      −105.92853               24 h notice depending on the selected weather question that
        Saguache Airfield      38.09404      −106.16269               would be pursued the next day. Emergency contingency pro-
        Poison Gulch          38.157308     −106.280973
                                                                      cedures for lost links, communications and other potential
                                                                      anomalies also had special provisions due to the proximity
                                                                      of operations of the various organizations.

https://doi.org/10.5194/essd-12-1-2020                                                     Earth Syst. Sci. Data, 12, 1–15, 2020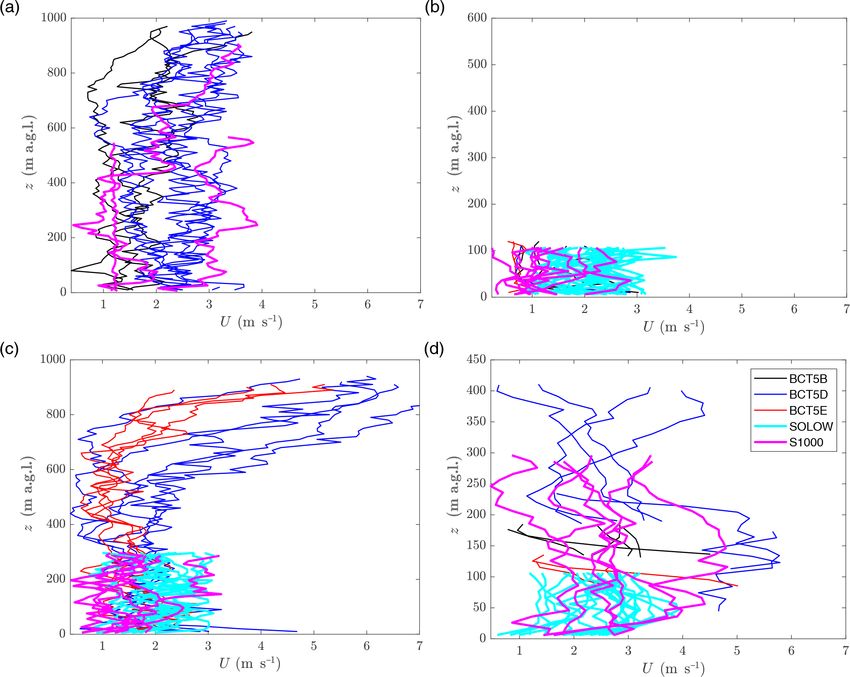
6                   S. C. C. Bailey et al.: Kentucky fixed-wing and rotorcraft UAS measurements in support of LAPSE-RATE

Figure 3. Topographic map of northern half of San Luis Valley, Colorado, USA, showing location of tower and aircraft flights conducted
by BCT5, S1000, SOLOW, and M600P aircraft on (a) 15 July 2018, (b) 16 July 2018, (c) 18 July 2018 and (d) 19 July 2018. Contour lines
indicate a 50 m change in elevation.

Table 2. Measurement systems location. (P) indicates measurement of a vertical profile; (T) indicates a horizontal transect measurement.

    Day                  Leach Airfield    Echo          Foxtrot        Kilo            Oscar         Saguache Airfield    Poison Gulch
    15 July 2018         Tower             BCT5B (P)                    BCT5D (P)       M600P (P)
    (07:30–14:30 MDT)                                    S1000 (P)      SOLOW (P)
    16 July 2018         Tower             BCT5B (P)     BCT5C (P)      BCT5D (P)       M600P (P)
    (08:00–14:30 MDT)    BCT5B (T)                       S1000 (P)      SOLOW (P)
    18 July 2018         Tower             M600P (P)     BCT5E (P)      BCT5D (P)
    (07:00–12:00 MDT)                                    S1000 (P)      SOLOW (P)
    19 July 2018                                                                                      BC5TB (T)            M600P (T)
    (05:30–11:00 MDT)                                                                                 BC5TD (T)
                                                                                                      BC5TE (T)
                                                                                                      SOLOW (P)
                                                                                                      S1000 (P)

3.1       15 July 2018                                                  parameters were conducted at Echo, Foxtrot, Kilo and Oscar,
                                                                        with BC5TB at Echo, the S1000 at Foxtrot, BCT5D and the
Measurements investigating convection initiation were                   SOLOW at Kilo, and the M600P at Oscar. The nominal flight
scheduled for 15 July 2018. To support this objective, verti-           profile for these flights was for the fixed-wing UAS to con-
cal profiling flights measuring kinematic and thermodynamic             duct 5 m s−1 , 200 m diameter spiraling ascents and descents

Earth Syst. Sci. Data, 12, 1–15, 2020                                                        https://doi.org/10.5194/essd-12-1-2020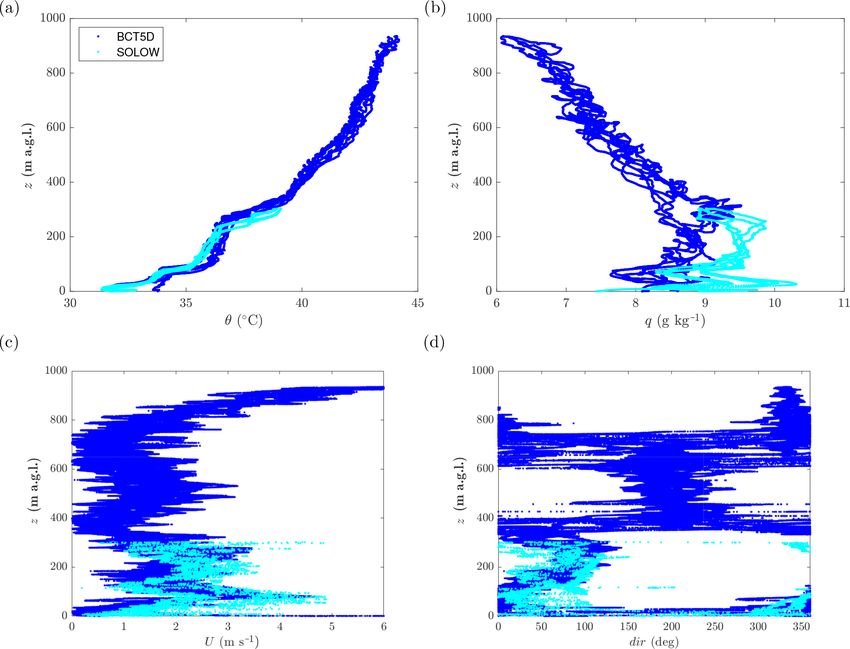
S. C. C. Bailey et al.: Kentucky fixed-wing and rotorcraft UAS measurements in support of LAPSE-RATE                             7

to 900 m a.g.l., with the rotorcraft ascending and descend-       3.3    18 July 2018
ing vertically to 300 m a.g.l. The S1000 measured a single
profile per flight ascending/descending at 1 m s−1 , whereas      Measurements investigating boundary layer transition were
the SOLOW completed two ascents/descents at 3 m s−1 up-           scheduled for 18 July 2018. As a result, profiling flights
ward and 2 m s−1 downward velocity. The UAS repeated              were again conducted following the same flight patterns as
these patterns from takeoff until their battery life was ex-      on 15 July. However, due to concerns with potential low-
pended, at which point they would land and have their bat-        altitude manned aircraft flights through the VR-413 airway,
teries changed. The nominal tempo for these patterns was          the M600P was retasked to Echo. A fixed-wing and rotor-
to conduct these flights once per hour. At Kilo, where two        craft UASs were located at Foxtrot and Kilo, with BCT5E
aircraft were available, the flights were staggered such that     and the S1000 at Foxtrot, and BCT5D and the SOLOW at
one aircraft was launched every 30 min. A figure showing the      Kilo. Flight operations on this day largely went as scheduled,
height, z, of each aircraft as a function in time is presented    with the cadence presented in Fig. 4c.
in Fig. 4a. This figure serves as a graphical representation of
the time each aircraft flew over the course of the day.           3.4    19 July 2018
   On this day, the wind speed and direction was not mea-
sured by the SOLOW aircraft due to data acquisition issue         Measurements of the cold-air drainage into the valley were
which was not diagnosed until after flights had concluded. In     scheduled for 19 July 2018. For this study, all aircraft were
addition, the S1000 conducted limited profiles at Foxtrot due     operating in the narrow valley leading into Saguache, with
to overheating of the flight batteries.                           the flight locations and patterns indicated in Fig. 5a for Poi-
                                                                  son Gulch and Fig. 5b for Saguache Airfield. Most aircraft
                                                                  were operating at Saguache Airfield, with the M600P oper-
3.2   16 July 2018                                                ating further up the mouth of the valley, in Poison Gulch.
Measurements investigating convection initiation were also           At Poison Gulch, the M600P was flying 600 m long
scheduled for 16 July 2018, and flight operations were ex-        horizontal transects at 25 m a.g.l. and every 50 m up to
pected to be a repeat of 15 July 2018, with vertical profiling    250 m a.g.l. at 10 m s−1 every 30 min to capture the flow en-
flights measuring kinematic and thermodynamic parameters.         tering the mouth of the valley. To measure the flow approach-
UASs were located at Echo, Foxtrot, Kilo and Oscar, with          ing the mouth of the valley, the remainder of the aircraft
BC5TB at Echo, BCT5C and the S1000 at Foxtrot, BCT5D              were positioned at Saguache Airfield. To capture the hori-
and the SOLOW at Kilo, and the M600P at Oscar. However,           zontal distribution of the thermodynamic and kinematic vari-
it was discovered that the NOTAM was not active for any           ables, the fixed-wing aircraft measured nominally 1700 m
operation locations (excepting Oscar), so flight operations       long transects at four different altitudes with the rotorcraft
could not be conducted under the COA regulations, requir-         flying vertical profiles. The SOLOW rotorcraft was conduct-
ing flights to be restricted to 120 m and below. As a result,     ing near-continuous profiles at 2 to 3 m s−1 up to 100 m from
it was decided that the fixed-wing operations could be better     05:30 to 11:00 MDT, with the S1000 profiling at 1 m s−1 ev-
utilized, and their flight crews were retasked to conduct hori-   ery hour from 06:00 to 11:00 MDT up to 300 m. The tran-
zontal east–west transects with BCT5B to attempt to capture       sects were measured at a nominal altitude of 100, 150, and
any fronts descending from the Sangre de Cristo Mountains         200 and 400 m a.g.l. Due to a longer preparation time for
to the east. Two 13 km long transects were conducted along        the fixed-wing aircraft, full operations did not begin until
the path initiating at Leach Airport (see Fig. 3b) in conjunc-    07:00 MDT, with flights continuing to 10:30 MDT. The ac-
tion with a ground vehicle from the University of Nebraska–       tual flight times and altitudes for all aircraft are presented in
Lincoln.                                                          Fig. 4d.
   To compensate for BC5TD being retasked, the cadence
of the SOLOW operations were increased to nominally one           4     Data processing and quality control
1 m s−1 ascent/descent profile measurement to 120 m every
15 min. However, due to continued battery issues, the S1000       Inspection of the raw data from these flights revealed sev-
was not able to maintain this cadence, and separation be-         eral instances were the instrumentation was not functioning
tween 1 m s−1 ascent/descent profile measurements to 120 m        properly. As noted above, the SOLOW sonic anemometer
was between 30 and 60 min. A graphical representation of          was not powered during the 15 July measurements, and no
the time each aircraft flew over the course of the day is pre-    wind data were recovered from those flights. On 17 July, the
sented in Fig. 4b. Note that some discrepancies exist in the      pressure, temperature and humidity from the SOLOW only
M600P profiles exist caused by poor GPS performance from          seem to have been recorded in the first two flights. In ad-
the onboard systems on this day.                                  dition, a power issue was also discovered with the S1000
                                                                  anemometer, whereby the anemometer would shut down ap-
                                                                  proximately halfway through the profile. This problem per-
                                                                  sisted throughout the campaign. Finally, several fixed-wing

https://doi.org/10.5194/essd-12-1-2020                                                  Earth Syst. Sci. Data, 12, 1–15, 2020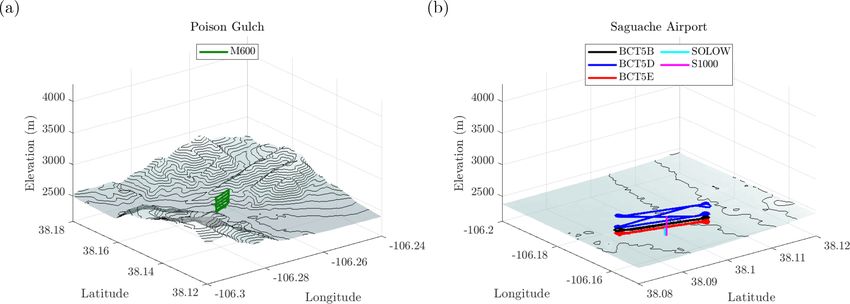
8                   S. C. C. Bailey et al.: Kentucky fixed-wing and rotorcraft UAS measurements in support of LAPSE-RATE

Figure 4. Altitude above ground level of each aircraft as a function of time for (a) 15 July 2018, (b) 16 July 2018, (c) 18 July 2018 and
(d) 19 July 2018.

Figure 5. Flight profiles for flights conducted by all aircraft on 19 July 2018. Flight trajectories at Poison Gulch shown in (a), with (b)
showing the flight trajectories at Saguache Airfield.

flights encountered overheating and malfunction of the em-                Furthermore, erroneous readings were observed for the
bedded computer, resulting in a loss of wind data for these             SOLOW anemometer during profiling flights which were
flights. Where these faults were observed, the values in the            caused by ±30◦ vertical acceptance angle violations. Wind
files have been replaced with values of −9999.9.                        data from this system should only be considered to be reli-
                                                                        able when the aircraft was descending due to a lower vertical

Earth Syst. Sci. Data, 12, 1–15, 2020                                                        https://doi.org/10.5194/essd-12-1-2020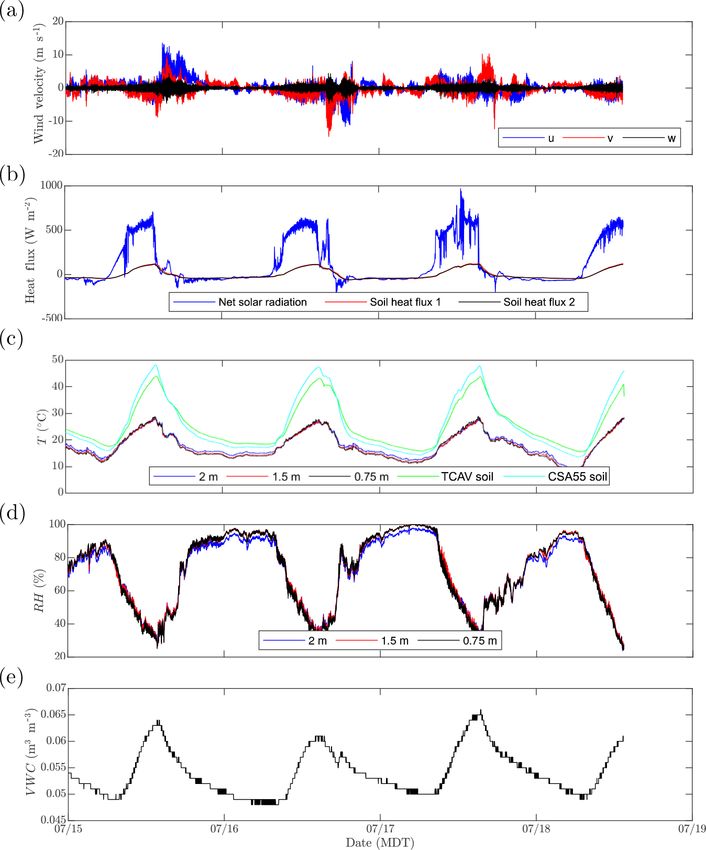
S. C. C. Bailey et al.: Kentucky fixed-wing and rotorcraft UAS measurements in support of LAPSE-RATE                                       9

Table 3. Overview of measurement systems and associated uncertainties. Measured quantities are pressure (P ), temperature (T ), relative
humidity (RH), wind velocity components in the horizontal and vertical direction respectively (u, v and w), net solar radiation (Net IR), and
volumetric water content (VWC).

                         System      Measurement      Instrument                Resolution          Est. uncertainty
                         BCT5        P                iMet-XQ                   0.02 hPa            ±2 hPa
                                     T                iMet-XQ                   0.01 ◦ C            ±1 ◦ C
                                     RH               iMet-XQ                   0.7 % RH            ±5 % RH
                                     u, v, w          Custom 5HP                Analog              ±20 %
                         SOLOW       P                iMet-XQ2                  0.01 hPa            ±2 hPa
                                     T                iMet-XQ2                  0.01 ◦ C            ±1 ◦ C
                                     RH               iMet-XQ2                  0.1 % RH            ±5 % RH
                                     u, v             TriSonica Mini            0.1 m s−1           ±25 %
                         S1000       P                iMet-XQ                   0.02 hPa            ±2 hPa
                                     T                iMet-XQ                   0.01 ◦ C            ±1 ◦ C
                                     RH               iMet-XQ                   0.7 % RH            ±5 % RH
                                     u, v             Young 81000               0.01 m s−1          ±25 %
                         M600P       P                iMet-XQ2 (×2)             0.01 hPa            ±2 hPa
                                     T                iMet-XQ2 (×2)             0.01 ◦ C            ±1 ◦ C
                                     RH               iMet-XQ2 (×2)             0.1 % RH            ±5 % RH
                         Tower       P                Setra 278                 0.01 hPa            ±0.5 hPa
                                     T                EE181 (2 m)               0.01 ◦ C            ±0.5 ◦ C
                                     T                CS215 (0.75 & 1.5 m)      0.01 ◦ C            ±0.5 ◦ C
                                     RH               EE181 (2 m)               0.01 % RH           ±2.3 % RH
                                     RH               CS215 (0.75 & 1.5 m)      % RH                ±4 % RH
                                     u, v, w          CSAT-3                    0.08 m s−1          ±6 %
                                     Net IR           NR-Lite2                  0.1 W m−2           30 W m−2
                                     Soil heat flux   HFP01 (×2)                0.1 W m−2           ±15 %
                                     Soil avg. T      TCAV                      0.01 ◦ C            ±1 ◦ C
                                     VWC              CS655                     0.001 (m3 m−3 )     ±3 %
                                     Soil T           CS655                     0.01 ◦ C            0.5 ◦ C

velocity during descent. These instances have been replaced              tional laboratory calibrations of the S1000 anemometer indi-
in the data files with −9999.9. In addition, slight misalign-            cated that the horizontal winds were underestimated by 25 %.
ment between ground and relative air velocity measurements                  These biases were found to be constant throughout the
introduces large biases in the wind estimates provided by                campaign and independent of weather conditions and flight
the BCT5 aircraft during periods of significant acceleration,            profile, as intrinsically validated by intercomparison between
specifically during takeoff, landing and sharp turns. These              all systems and the Automated Surface Observing System
biases were removed using the approach described in Al-                  (ASOS) using the colocated flights at Saguache Airfield. As
Ghussain and Bailey (2020). However, wind data from the                  the wind direction was found to be unaffected, they have
time periods when these aircraft are entering or leaving their           therefore been uniformly removed from the data files by ap-
measurement profile should be considered unreliable due to               plying them equally to both horizontal components of ve-
accelerations which exceeded the ability of the approach to              locity. However the magnitude of these corrections do reflect
detect and remove.                                                       the level of uncertainty in the respective wind measurements.
   As noted in the individual system descriptions, several lab-          In addition, utilizing the Barbieri et al. (2019) intercompari-
oratory calibrations were conducted prior to the flight cam-             son study findings, we also find that the temperature has an
paign, most notably for the systems for measuring wind.                  absolute confidence level of ±1 ◦ C, the relative humidity val-
In addition, as part of an intercomparison study, a series of            ues have an absolute confidence level of approximately ±5 %
flights were conducted on 14 July 2018 near a ground-based               and the pressure values have an absolute confidence level of
reference tower. The results of this study, published in Bar-            ±2 hPa. An overview of the systems, their instruments, and
bieri et al. (2019), indicated an overestimation of the winds            corresponding resolution and estimated uncertainty is pro-
measured by the BCT5 aircraft by up to 10 % to 20 %. Addi-               vided in Table 3.

https://doi.org/10.5194/essd-12-1-2020                                                            Earth Syst. Sci. Data, 12, 1–15, 2020
10 S. C. C. Bailey et al.: Kentucky fixed-wing and rotorcraft UAS measurements in support of LAPSE-RATE
Figure 6. Flux tower measurements of (a) wind velocity components in the east u, north v and vertical w directions; (b) net solar radiation
and soil heat flux; (c) temperature, T ; (d) relative humidity, RH; and (e) soil volumetric water content, VWC.
5 Overview of data but picking up in the late afternoon with the development of
convective boundary layer conditions, occasionally reaching
velocity magnitudes exceeding 10 m s−1 . Convective thun-
This section provides a general overview of the data provided derstorm activity occurred in the afternoons as well, resulting
by the systems described in Sect. 2 during the LAPSE-RATE in additional wind gusts corresponding to their outflows. A
campaign from the mornings of 15, 16, 18 and 19 July. An consistent diurnal cycle was observed for 15 through 18 July
overview of the prevailing synoptic and mesoscale conditions in heat flux (Fig. 6b); temperature, T (Fig. 6c); relative hu-
during the week is provided in de Boer et al. (2020b), as well midity, RH (Fig. 6d); and volumetric water content, VWC
as de Boer et al. (2020a). (Fig. 6e). The calm winds in the mornings corresponded to
The measurements made by the 2 m flux tower are pre- elevated humidity, with the 100 % RH observed on the morn-
sented in Fig. 6. Figure 6a shows that surface winds from 15 ing of 18 July corresponding to early-morning fog formation.
to 18 July were variable in direction, generally below 5 m s−1
Earth Syst. Sci. Data, 12, 1–15, 2020 https://doi.org/10.5194/essd-12-1-2020S. C. C. Bailey et al.: Kentucky fixed-wing and rotorcraft UAS measurements in support of LAPSE-RATE 11
Figure 7. Temperature measured by aircraft on (a) 15 July 2018, (b) 16 July 2018, (c) 18 July 2018 and (d) 19 July 2018. Note different
axis heights for each day. Profiles have been produced by averaging over 10 m height intervals from each flight.
Near-surface air temperatures ranged from 10 to 30 ◦ C with lapse rate throughout the morning. More interesting bound-
soil temperatures following the same cycle but elevated to be- ary layer transition behavior was evident on 18 July between
tween 20 and 50 ◦ C. The volumetric water content was low, 07:00 and 12:00 MDT. The temperature profiles shown in
reflecting the dry soil conditions prevalent in the San Luis Fig. 7c indicate the presence of multiple inversions during
Valley (evident in Fig. 2). the measurements made earlier in the morning, which evolve
Mean vertical profiles from all temperature measurements into a well-mixed lapse rate as surface temperatures increase.
made are presented in Fig. 7 with the corresponding velocity The corresponding wind profiles shown in Fig. 8c show that,
magnitude profiles presented in Fig. 8. These profiles were although relatively calm winds were evident near the surface
produced by bin averaging the results at 10 m intervals for during the entire measurement period, significantly stronger
each flight. The temperature profiles from 15 July, which winds and wind shear existed above 500 m a.g.l. Finally, the
were measured between 07:30 and 14:30 MDT and are pre- measurements made in the Saguache valley on 19 July be-
sented in Fig. 7a, show typical transition behavior, with the tween 05:30 and 11:00 MDT show in Fig. 7d the expected re-
lower-temperature, early-morning profiles showing a non- versal of gradient in the temperature profiles associated with
monotonic altitude dependence up to 800 m a.g.l., whereas the earlier morning boundary layer behavior as it transitions
the later afternoon profiles consist of the characteristic lapse to mixed-layer conditions over the course of the morning. As
rate of a well-mixed convective boundary layer. Over the expected over the complex terrain of the valley, the winds
same time period, the wind profiles shown in Fig. 8a in- were variable as shown in Fig. 8d, with mean velocity peak
dicate the presence of calm winds of generally less than near 6 m s−1 caused by a transient density-driven flow event.
3 m s−1 magnitude. Wind profiles were essentially the same
on 16 July between 08:00 and 14:30 MDT, shown in Fig. 8b,
although the altitude restrictions described in Sect. 3.2 lim- 6 Example profiles
ited measurements of winds to the lowest 100 m. Likewise,
the temperature profiles shown in Fig. 7b show a consistent Of the 178 measurements made, as noted in the previous sec-
tion some of the most interesting profiles were measured on
https://doi.org/10.5194/essd-12-1-2020 Earth Syst. Sci. Data, 12, 1–15, 202012 S. C. C. Bailey et al.: Kentucky fixed-wing and rotorcraft UAS measurements in support of LAPSE-RATE Figure 8. Wind velocity magnitude: (a) 15 July 2018, (b) 16 July 2018, (c) 18 July 2018 and (d) 19 July 2018. Axis heights same as Fig. 7. Profiles have been produced by averaging over 10 m height intervals from each flight. the morning of 18 July 2018. On this morning the weather ter vapor mass mixing ratio, q, profiles, shown in Fig. 9b, was fair, having less than three-eights cloud cover, with sur- are slightly less complex, but changes in the vertical gradi- face winds varying from calm to 2.5 m s−1 . Surface temper- ent are also observed at 50, 100 and 250 m a.g.l., coincid- ature increased from 10 to 25 ◦ C, with the dew point drop- ing with the changes observed in the potential temperature. ping from 5 to −1 ◦ C throughout the morning. However the The wind horizontal magnitude and direction are shown in boundary layer was stratified into multiple layers evident in Fig. 9c and d respectively. These figures show that the winds each of the measured statistics, as illustrated in the sample also experienced significant vertical and horizontal shearing. profiles from some of the earliest colocated flights on that For the lowest 100 m a.g.l., winds were from the north at up day which are presented in Fig. 9. In Fig. 9, profiles from the to 3 m s−1 , whereas they were from the east at 2 m s−1 from SOLOW rotorcraft are shown for a 10 min flight initiating at 100 to 300 m a.g.l. From 300 to 600 m a.g.l. they were from 07:00 MDT and profiles from BCT5D are shown for a flight the south at 2 m s−1 , and above that altitude the winds were initiating at 07:15 MDT that lasted 30 min. Hence the time from the north, increasing in magnitude with altitude until period represented by these profiles is approximately 45 min reaching 6 m s−1 at 900 m. Notably, these trends were evi- and any features evident persisted over that duration. Note dent on both aircraft systems at altitudes where overlapping that, despite this time difference, no dependence of measured measurements are available. Similar trends were observed for values on ascent or descent can be observed in these mea- other UASs throughout the morning during the same period, surements, and there appears to be good agreement between with mixed-layer conditions establishing up to 300 m a.g.l. the different aircraft and sensor systems. at 09:15 MDT, up to 500 m a.g.l. at 10:15 MDT, 600 m a.g.l. The potential temperature profiles, shown in Fig. 9a, sug- at 11:15 MDT and throughout the measurement domain at gests that the boundary layer was largely stable, except for 12:00 MDT. a thin region of unstable air near the surface. Significant changes in the potential temperature, θ , gradient are evi- dent at 50, 100, 250 and 300 m a.g.l. The corresponding wa- Earth Syst. Sci. Data, 12, 1–15, 2020 https://doi.org/10.5194/essd-12-1-2020
S. C. C. Bailey et al.: Kentucky fixed-wing and rotorcraft UAS measurements in support of LAPSE-RATE                                 13

                                                        Figure 9. Example vertical profiles measured between 07:00 and 07:45 MDT by BCT5D and SOLOW on 18 July 2018 at location Kilo.
                                                        Potential temperature profiles shown in (a); water vapor mass mixing ratio profiles shown in (b); and wind speed, u, and direction, dir,
                                                        profiles shown in (c) and (d) respectively.

                                                        7   Data availability                                                 8   Conclusions

                                                        The data files for each flight from each aircraft are                 In July 2018 in the San Luis Valley in Colorado, USA, re-
                                                        available from the Zenodo open data repository                        searchers from multiple institutions participated in the Lower
                                                        (https://doi.org/10.5281/zenodo.3701845, Bailey et al.,               Atmospheric Profiling Studies at Elevation – a Remotely-
                                                        2020). These data consist of 178 files containing thermody-           piloted Aircraft Team Experiment (LAPSE-RATE) measure-
                                                        namic and kinematic data (pressure, temperature, humidity,            ment campaign. As part of this campaign effort, University
                                                        wind speed and direction) measured by the unmanned aerial             of Kentucky researchers contributed seven fixed-wing and
                                                        systems and fixed 2 m flux tower operated by the University           rotorcraft unmanned aerial systems, totaling 178 successful
                                                        of Kentucky during the LAPSE-RATE campaign. These                     data acquisition flights over 4 d CE2 . For 3 of the 4 d, the
                                                        data have undergone preliminary quality control in the form           flights consisted of profiles measured up to altitudes of 900 m
                                                        of bias corrections and elimination of some false readings.           above ground level. The goal of these flights was to observe
                                                        Files are posted for each individual UAS flight in netCDF             the boundary layer state during morning transition within the
Please note the remarks at the end of the manuscript.

                                                        format. For the flux tower data, each measurement day is              elevated valley and to identify precursors for convection ini-
                                                        presented as a separate netCDF file.                                  tiation. For the fourth day the gravity-driven flow into the val-
                                                           The netCDF files have each variable listed individually            ley was measured using three fixed-wing-aircraft-conducted
                                                        with self-describing metadata to provide information on the           transects and one rotorcraft-aircraft-conducted transects at
                                                        source and units for the data. Missing data points or those           six altitudes while the remaining aircraft conducted vertical
                                                        determined to have bad values have been set to −9999.9.               profiling.
                                                           Files are named using the following standard:                         The data from these coordinated UAS flights provide a
                                                        UKY.ppppp.b1.yyyymmdd.hhmmss.cdf, with ppppp being                    significant contribution to the characterization of the lower
                                                        the five-letter platform identifier, yyyymmdd being the file          atmosphere within the valley during the LAPSE-RATE cam-
                                                        date (UTC year, month, day, month) and hhmmss being the               paign. All data from the systems described here are now dis-
                                                        file start time (UTC hours, minutes, seconds).                        tributed and can be freely accessed from the Zenodo data

                                                        https://doi.org/10.5194/essd-12-1-2020                                                       Earth Syst. Sci. Data, 12, 1–15, 2020
14 S. C. C. Bailey et al.: Kentucky fixed-wing and rotorcraft UAS measurements in support of LAPSE-RATE
repository (https://doi.org/10.5281/zenodo.3701845, Bailey Bailey, S. C. C., Canter, C. A., Sama, M. P., Houston, A. L., and
et al., 2020). Although some preliminary quality control and Smith, S. W.: Unmanned aerial vehicles reveal the impact of a to-
bias correction have been conducted on these data, some tal solar eclipse on the atmospheric surface layer, P. Roy. Soc. A,
caveats for their use have been described in this paper. These 475, 20190212, https://doi.org/10.1098/rspa.2019.0212, 2019.
caveats include noting that data from the BC5T and SOLOW Bailey, S. C. C., Smith, S. W., and Sama, M. P.: Uni-
versity of Kentucky files from LAPSE-RATE, Zenodo,
aircraft are sampled at rates exceeding that of the response
https://doi.org/10.5281/zenodo.3701845, 2020.
for their respective sensing systems. In addition, wind data Barbieri, L., Kral, S. T., Bailey, S. C. C., Frazier, A. E., Jacob, J. D.,
from the rotorcraft should only be considered valid on the Reuder, J., Brus, D., Chilson, P. B., Crick, C., Detweiler, C.,
ascent. CE3 Doddi, A., Elston, J., Foroutan, H., González-Rocha, J., Greene,
B. R., Guzman, M. I., Houston, A. L., Islam, A., Kemppinen,
O., Lawrence, D., Pillar-Little, E. A., Ross, S. D., Sama, M. P.,
Author contributions. The University of Kentucky contribution Schmale, D. G., Schuyler, T. J., Shankar, A., Smith, S. W.,
to LAPSE-RATE was planned and coordinated by SWS, MPS, JBH, Waugh, S., Dixon, C., Borenstein, S., and de Boer, G.: Intercom-
MIG and SCCB; flight team members included CAC, LFP, ZSL, parison of Small Unmanned Aircraft System (sUAS) Measure-
TJS, JDH, SBM, ISR, CDS, VGS, CNV and HMW; data analysis ments for Atmospheric Science during the LAPSE-RATE Cam-
and preparation was conducted by SCCB; and senior team members paign, Sensors, 19, 2179, https://doi.org/10.3390/s19092179,
SCCB, SWS and MPS contributed to the preparation of this paper. 2019.
Broxmeyer, C. and Leondes, C. I.: Inertial Navigation Systems, J.
Appl. Mech., 31, 735, https://doi.org/10.1115/1.3629763, 1964.
Competing interests. The authors declare that they have no con- de Boer, G., Diehl, C., Jacob, J., Houston, A., Smith, S. W., Chilson,
flict of interest. P., Schmale, David G., I., Intrieri, J., Pinto, J., Elston, J., Brus, D.,
Kemppinen, O., Clark, A., Lawrence, D., Bailey, S. C. C., Sama,
M. P., Frazier, A., Crick, C., Natalie, V., Pillar-Little, E., Klein,
Special issue statement. This article is part of the special issue P., Waugh, S., Lundquist, J. K., Barbieri, L., Kral, S. T., Jensen,
“Observational and model data from the 2018 Lower Atmospheric A. A., Dixon, C., Borenstein, S., Hesselius, D., Human, K.,
Process Studies at Elevation – a Remotely-piloted Aircraft Team Hall, P., Argrow, B., Thornberry, T., Wright, R., and Kelly, J. T.:
Experiment (LAPSE-RATE) campaign”. It is a result of the In- Development of Community, Capabilities, and Understanding
ternational Society for Atmospheric Research using Remotely pi- through Unmanned Aircraft-Based Atmospheric Research: The
loted Aircraft (ISARRA 2018) conference, Boulder, USA, 9–12 LAPSE-RATE Campaign, B. Am. Meteorol. Soc., 101, E684–
July 2018. E699, https://doi.org/10.1175/BAMS-D-19-0050.1, 2020a.
de Boer, G., Houston, A., Jacob, J., Chilson, P. B., Smith, S. W.,
Argrow, B., Lawrence, D., Elston, J., Brus, D., Kemppinen, O.,
Klein, P., Lundquist, J. K., Waugh, S., Bailey, S. C. C., Frazier,
Financial support. This research has been supported by the Na-
A., Sama, M. P., Crick, C., Schmale III, D., Pinto, J., Pillar-Little,
tional Science Foundation, Division of Chemical, Bioengineering,
E. A., Natalie, V., and Jensen, A.: Data Generated During the
Environmental, and Transport Systems (grant no. CBET-1351411),
2018 LAPSE-RATE Campaign: An Introduction and Overview,
and the National Science Foundation, Office of Experimental Pro-
Earth Syst. Sci. Data Discuss., https://doi.org/10.5194/essd-
gram to Stimulate Competitive Research (grant no. 1539070). Ad-
2020-98, in review, 2020.
ditional student financial travel support was provided through the
Heintz, C. and Hoagg, J. B.: Formation Control in a Leader-Fixed
National Science Foundation (grant no. AGS-1807199) and Depart-
Frame for Agents with Extended Unicycle Dynamics that In-
ment of Energy (grant no. DE-SC0018985).
clude Orientation Kinematics on SO(m), in: 2019 IEEE 58th
Conference on Decision and Control (CDC), 8230–8235, 2019.
Heintz, C., Bailey, S. C., and Hoagg, J.: Formation Control of Fixed-
Review statement. This paper was edited by Gijs de Boer and Wing Unmanned Aircraft: Theory and Experiments, in: AIAA
reviewed by two anonymous referees. Scitech 2019 Forum, https://doi.org/10.2514/6.2019-1168, 2019.
Jacob, J. D., Simpson, A., and Smith, S.: Design and Flight Test-
ing of Inflatable Wings with Wing Warping, in: Aerospace
Technology Conference and Exposition, SAE International,
References https://doi.org/10.4271/2005-01-3392, 2005.
Jacob, J. D., Smith, S. W., Cadogan, D., and Scarborough, S.: Ex-
Al-Ghussain, L. and Bailey, S. C. C.: An Approach to Minimize panding the Small UAV Design Space with Inflatable Wings, in:
Aircraft Motion Bias in Multi-Hole Probe Wind Measurements Aerospace Technology Conference and Exposition, SAE Inter-
made by Small Unmanned Aerial Systems, Atmos. Meas. Tech. national, https://doi.org/10.4271/2007-01-3911, 2007.
Discuss., https://doi.org/10.5194/amt-2020-126, in review, 2020. Jacob, J. D., Chilson, P. B., Houston, A. L., and Smith,
Axford, D. N.: On the Accuracy of Wind Measurements Us- S. W.: Considerations for Atmospheric Measurements with
ing an Inertial Platform in an Aircraft, and an Example of a Small Unmanned Aircraft Systems, Atmosphere, 9, 252,
Measurement of the Vertical Mesostructure of the Atmosphere, https://doi.org/10.3390/atmos9070252, 2018.
J. Appl. Meteorol., 7, 645–666, https://doi.org/10.1175/1520-
0450(1968)0072.0.CO;2, 1968.
Earth Syst. Sci. Data, 12, 1–15, 2020 https://doi.org/10.5194/essd-12-1-2020S. C. C. Bailey et al.: Kentucky fixed-wing and rotorcraft UAS measurements in support of LAPSE-RATE 15 Lenschow, D.: The measurement of air velocity and temperature us- Thamann, M. A., Smith, S. W., Bailey, S. C., Doepke, E. B., and ing the NCAR Buffalo aircraft measuring system, National Cen- Ashcraft, S. W.: Modeling and flight testing of wing shaping for ter for Atmospheric Research, 1972. roll control of an unmanned aerial vehicle, Journal of Unmanned Lippay, Z. S. and Hoagg, J. B.: Leader-Following Formation Con- Vehicle Systems, 3, 192–204, https://doi.org/10.1139/juvs-2014- trol in a Rotating Frame for Agents with Double-Integrator Dy- 0024, 2015. namics: Generalized Stability Results and Experiments, in: 2019 Treaster, A. L. and Yocum, A. M.: The calibration and application IEEE 58th Conference on Decision and Control (CDC), 8236– of five-hole probes, Tech. rep., DTIC Document, 1978. 8241, 2019. Wellman, B. and Hoagg, J.: Sampled-Data Flocking with Applica- Mullen, J., Bailey, S. C., and Hoagg, J. B.: Filtered dy- tion to Unmanned Rotorcraft, in: 2018 AIAA Guidance, Navi- namic inversion for altitude control of fixed-wing un- gation, and Control Conference, https://doi.org/10.2514/6.2018- manned air vehicles, Aerosp. Sci. Technol., 54, 241–252, 1856, 2018. https://doi.org/10.1016/j.ast.2016.04.013, 2016. Wildmann, N., Hofsäß, M., Weimer, F., Joos, A., and Bange, Schuyler, T. J. and Guzman, M. I.: Unmanned Aerial Systems J.: MASC – a small Remotely Piloted Aircraft (RPA) for Monitoring Trace Tropospheric Gases, Atmosphere, 8, 206, for wind energy research, Adv. Sci. Res., 11, 55–61, https://doi.org/10.3390/atmos8100206, 2017. https://doi.org/10.5194/asr-11-55-2014, 2014. Schuyler, T. J., Bailey, S. C. C., and Guzman, M. I.: Monitoring Tro- Witte, B. M., Schlagenhauf, C., Mullen, J., Helvey, J. P., Thamann, pospheric Gases with Small Unmanned Aerial Systems (sUAS) M. A., and Bailey, S.: Fundamental Turbulence Measurement during the Second CLOUDMAP Flight Campaign, Atmosphere, with Unmanned Aerial Vehicles (Invited), in: 8th AIAA At- 10, 434, https://doi.org/10.3390/atmos10080434, 2019a. mospheric and Space Environments Conference, AIAA 2016- Schuyler, T. J., Gohari, S. M. I., Pundsack, G., Berchoff, D., 3584, AIAA, Washington, DC, https://doi.org/10.2514/6.2016- and Guzman, M. I.: Using a Balloon-Launched Unmanned 3584, 2016. Glider to Validate Real-Time WRF Modeling, Sensors, 19, 1914, Witte, B. M., Singler, R. F., and Bailey, S. C.: Development of https://doi.org/10.3390/s19081914, 2019b. an Unmanned Aerial Vehicle for the Measurement of Turbu- Smith, S. W., Chilson, P. B., Houston, A. L., and Jacob, J. D.: lence in the Atmospheric Boundary Layer, Atmosphere, 8, 195, Catalyzing Collaboration for Multi-Disciplinary UAS Develop- https://doi.org/10.3390/atmos8100195, 2017. ment with a Flight Campaign Focussed on Meteorology and Atmospheric Physics, in: AIAA Information Systems-AIAA Infotech @ Aerospace, AIAA 2017-1156, AIAA, Grapevine, Texas, https://doi.org/10.2514/6.2017-1156, 2017. https://doi.org/10.5194/essd-12-1-2020 Earth Syst. Sci. Data, 12, 1–15, 2020
Remarks from the language copy-editor

CE1   The capitalization is correct (see https://www.merriam-webster.com/dictionary/pitot-statictube. However, I have
      changed these to en dashes based on your clarification as this is a combination of the two types of probes. This is
      also in agreement with the definition provided.
CE2   It’s our standard to abbreviate SI-accepted units of measure up to day (i.e., s, min, h, and d).
CE3   Please provide an explanation for the editor to remove this sentence. We are only allowed to insert minor technical
changes at this stage without approval.
You can also read