Performance of an open-path near-infrared measurement system for measurements of CO2 and CH4 during extended field trials
←
→
Page content transcription
If your browser does not render page correctly, please read the page content below
Atmos. Meas. Tech., 14, 3119–3130, 2021
https://doi.org/10.5194/amt-14-3119-2021
© Author(s) 2021. This work is distributed under
the Creative Commons Attribution 4.0 License.

Performance of an open-path near-infrared measurement system for
measurements of CO2 and CH4 during extended field trials
Nicholas M. Deutscher1 , Travis A. Naylor1 , Christopher G. R. Caldow1,a , Hamish L. McDougall1 , Alex G. Carter1, ,
and David W. T. Griffith1
1 Centre for Atmospheric Chemistry, School of Earth, Atmospheric and Life Sciences, Faculty of Science,
Medicine and Health, University of Wollongong, Wollongong, NSW, 2522, Australia
a now at: Laboratoire des Sciences du Climat et de l’Environnement, LSCE/IPSL, CEA-CNRS-UVSQ,

Université Paris-Saclay, Gif-sur-Yvette, 91191, France
 deceased, 8 September 2020

Correspondence: Nicholas M. Deutscher (ndeutsch@uow.edu.au)

Received: 9 July 2020 – Discussion started: 14 September 2020
Revised: 15 March 2021 – Accepted: 24 March 2021 – Published: 28 April 2021

Abstract. Open-path measurements of atmospheric compo-           of greenhouse gases to and from the atmosphere is critical to
sition provide spatial averages of trace gases that are less     understanding past, present, and future change.
sensitive to small-scale variations and the effects of meteo-       Open-path measurements of atmospheric composition can
rology. In this study we introduce improvements to open-path     provide complementary information to that available from
near-infrared (OP-NIR) Fourier transform spectrometer mea-       in situ point measurements. By integrating over kilometre-
surements of CO2 and CH4 . In an extended field trial, the OP-   length scales, open-path measurements provide quantifica-
NIR achieved measurement repeatability 6 times better for        tions that are less sensitive to small-scale variability and
CO2 (0.28 ppm) and 10 times better for CH4 (2.1 ppb) over a      more representative of model spatial scales. In applications
1.55 km one-way path than its predecessor. The measurement       around detecting remote point sources, an integrated path
repeatability was independent of path length up to 1.55 km,      also improves the likelihood of sampling through an emis-
the longest distance tested. Comparisons to co-located in situ   sion plume. These advantages may come at the cost of preci-
measurements under well-mixed conditions characterise bi-        sion and accuracy compared to in situ point measurements.
ases of 1.41 % for CO2 and 1.61 % for CH4 relative to in situ       Technologies available for open-path measurements in-
measurements calibrated to World Meteorological Organisa-        clude differential optical absorption spectroscopy (DOAS),
tion – Global Atmosphere Watch (WMO-GAW) scales. The             differential absorption lidar (DIAL), integrated path dif-
OP-NIR measurements can detect signals due to local pho-         ferential absorption (IPDA) lidar, chirped laser dispersion
tosynthesis and respiration, and local point sources of CH4 .    spectroscopy (CLaDS) tunable diode laser absorption spec-
The OP-NIR is well-suited for deployment in urban or rural       troscopy (TDLAS), frequency comb spectroscopy, and open-
settings to quantify atmospheric composition on kilometre        path FTIR (OP-FTIR).
scales.                                                             Single-wavelength open-path instruments include DIAL,
                                                                 IPDA, CLaDS and TDLAS. Tunable diode lasers are a rela-
                                                                 tively inexpensive technology capable of measurements of
                                                                 many atmospheric constituents, depending on the internal
1   Introduction                                                 laser used. These have been applied to the detection of CO2
                                                                 and CH4 in the past, but measured amounts vary consider-
Anthropogenic greenhouse gases, primarily carbon dioxide
                                                                 ably from instrument to instrument, and they are suscepti-
(CO2 ) and methane (CH4 ), are the main drivers of systematic
                                                                 ble to drifts and inaccuracies (Feitz et al., 2018). CLaDS
changes in the Earth’s climate, especially a net warming of
                                                                 techniques, which rely on the phase of detected light, have
the atmosphere and oceans. Characterising sources and sinks

Published by Copernicus Publications on behalf of the European Geosciences Union.
3120                                                                           N. M. Deutscher et al.: OP-NIR performance

been used for open-path measurements of methane (Niko-            Loh et al., 2009; Naylor et al., 2016; Phillips et al., 2016).
dem et al., 2015; Plant et al., 2015). DIAL is a LIDAR-           OP-MIR has also been used to detect and quantify a point
based technique that uses the differential backscatter signal     CO2 and CH4 source during a controlled release experiment
between two wavelengths, one of strong absorption and the         (Cartwright et al., 2019; Feitz et al., 2018). At these path
other of weak, to quantify concentrations of atmospheric ab-      lengths, repeatability of 1 ppm CO2 and 5 ppb for CH4 can
sorbers. IPDA is a variant of DIAL, using topographical tar-      be achieved. Tomographic techniques for quantifying fluxes,
gets to allow integrated-path measurements. DIAL (Queisser        such as described by Humphries et al. (2012), could be ap-
et al., 2016) and IPDA (Wagner and Plusquellic, 2016) can         plied to open-path measurements.
be applied to integrated-path measurements of CO2 and CH4 .          Griffith et al. (2018) detailed a pilot study extending OP-
In general, laser-based techniques can have low power re-         FTIR to measurements in the near-infrared (NIR) spectral
quirements but are only tuned around a single wavelength          region (4000–13 500 cm−1 ), where higher source brightness
and therefore can typically only detect a single gas. In addi-    results in better collimation of the beam and theoretically
tion, this leaves them susceptible to potential interferences.    longer paths. In addition, there are fewer interfering species,
GreenLITE™ (Dobler et al., 2013; Lian et al., 2019) gets          though the absorptions of CO2 and CH4 are weaker relative
around some of the interference aspect by measuring at two        to MIR as they are overtone and combination bands. The
wavelengths.                                                      instrument was deployed over a 1.55 km one-way path and
   DOAS is typically applied in the ultraviolet and visible re-   demonstrated repeatability of 1.7 ppm for CO2 and 21 ppb
gions of the spectrum, making it unsuitable for measuring         for CH4 for 5 min averages. This paper details further devel-
greenhouse gases. Recent advances have seen the expansion         opments and field trials based on the instrument introduced
of DOAS-type measurements into the near infrared (NIR),           in that study and demonstrates significant improvements in
delivering repeatability in CO2 measurements of 2–4 ppm           precision and accuracy.
over kilometre-scale path lengths and CH4 repeatability of           Section 2 describes the instrument, data processing and
the order of 200 ppb (Saito et al., 2015).                        corrections applied to the data. The field deployment and
   Frequency comb spectroscopy enables measurements               testing of the instrument are described in Sect. 3, while the
across a range a spectral wavelengths. For example, Alden         results are presented and discussed in Sect. 4. The conclu-
et al. (2019) employ a dual-frequency comb spectrometer           sions are then presented in Sect. 5.
to measure methane, operating over a 270 cm−1 spectral
window centred at 7000 cm−1 at high spectral resolution
(0.0067 cm−1 ). This combination of a wider window and            2   Open-path Near InfraRed Spectrometer
high spectral resolution allows for the simultaneous retrieval
of interfering species, especially atmospheric water vapour,      The instrument described here is based on the instrument de-
improving the inherent stability and accuracy of the measure-     scribed by Griffith et al. (2018), which was deployed in Hei-
ment. The instruments can operate in different wavelength         delberg, Germany. We describe the instrument, retroreflector
regions; Rieker et al. (2014) describe an earlier system op-      array and data processing and highlight the modifications rel-
erating around 6000 cm−1 at 0.0033 cm−1 resolution, which         ative to Griffith et al. (2018).
measures CO2 , CH4 , H2 O, HDO, and 13 CO2 over 2 km path            Figure 1 shows a schematic of the instrument setup. The
lengths, with 5 min precision of better than 1 ppm for CO2        central component of the open-path NIR (OP-NIR) system is
and 3 ppb for CH4 with agreement between instruments of           a low spectral resolution FTIR spectrometer, the Bruker IR-
better than 1 ppm CO2 and 7 ppb for CH4 (Waxman et al.,           cube (Bruker Optik, Ettlingen, Germany). The spectrometer
2017).                                                            has an internal 25 W tungsten globe restricted to 11 W as the
   While not operating at the spectral resolutions achieved       NIR radiation source, quartz beam splitter and TE-cooled In-
by laser-based spectroscopy, open-path FTIR spectrome-            dium Gallium Arsenide (InGaAs) detector optimised for the
ters can operate over even wider spectral regions, allowing       NIR spectral region, covering the spectral range from 3800
quantification of many gases that absorb infrared radiation       to 10 000 cm−1 . This covers the same spectral range as that
in the atmosphere. Open-path mid-infrared (OP-MIR) mea-           used in the Total Carbon Column Observing Network (TC-
surements (200–4000 cm−1 ) are limited to relatively short        CON) (Wunch et al., 2011), which measures total column
path lengths because of the low brightness of the internal        CO2 , CH4 and other gases using the Sun as a light source.
MIR light source. Open-path MIR measurements have been            Unlike TCCON, the IRcube used in this study has a low
used to quantify CO2 and CH4 on paths up to 400 m (e.g.           spectral resolution of 0.5 cm−1 (maximum optical path dif-
Desservettaz et al., 2019; Phillips et al., 2019) in an ur-       ference of 1.8 cm). The spectrometer is relatively compact
ban environment. More typically they have been applied on         (310 × 290 × 220 mm, 14 kg).
100 m scales for quantification of area sources coupled with a       For this work, the relatively small spectrometer allows it
tracer gas, micrometerological techniques or a backward la-       to be mounted on an Automated Instrument Mount (AIM,
grangian stochastic model (WINDTRAX) (Bai et al., 2018;           Omegalec, Unanderra, NSW, Australia), previously also
Flesch et al., 2016; Jones et al., 2011; Laubach et al., 2013;    used for open-path MIR measurements. AIM allows pro-

Atmos. Meas. Tech., 14, 3119–3130, 2021                                            https://doi.org/10.5194/amt-14-3119-2021
N. M. Deutscher et al.: OP-NIR performance                                                                                         3121

Figure 1. Schematic diagram of the setup of the OP-NIR spectrometer, its coupling to the Cassegrain telescope, and the light path through
these and subsequent to/from the retroreflector.

grammable, adjustable pointing of the instrument, driven by            is reflected off the beam splitter and focussed onto the In-
stepper motors on each of an elevation and azimuth axis.               GaAs detector in the spectrometer.
AIM and the instrument are supported on a heavy-duty tri-                 Auxiliary information is logged at the spectrometer end
pod (MOOG-QuickSet, Northbrook, IL, USA). The spec-                    of the path. A temperature sensor (LM335 diode) is housed
trometer is rigidly coupled to a beam-expanding telescope.             in a solar shield to protect from direct solar radiation, while
In contrast to the setup used by Griffith et al. (2018), here          a pressure sensor (Vaisala PTB110, Helsinki, Finland) is
we use a 50 : 50 zinc selenide (ZnSe) beam splitter instead            housed in a vented box. These are logged on the same time
of an optic fibre to couple the interferometer and detector to         interval as spectral collection.
the telescope and a Schmidt-Cassegrain (Meade Instruments                 The instrument is powered by 240 V mains power. For
Corporation, Irvine, CA, USA), instead of a Newtonian, tele-           field deployment, it was housed in a portable aluminium gar-
scope. In addition, the light is modulated prior to exiting            den shed.
the spectrometer, minimising the effects of stray light from
the environment on the measurements. The telescope has the             2.1   Data processing
Schmidt corrector plate removed and uses a custom convex
30 mm diameter secondary mirror with 50 mm focal length                From the collected NIR spectra, path-averaged trace gas
mounted on a micrometre stage for fine-focus adjustment to             mole fractions are retrieved by fitting a calculated spec-
convert the telescope to a beam expander. Direct back reflec-          trum to the measured spectrum. The calculated spectrum
tion off centre of the secondary mirror to the beam splitter,          is generated using a forward model, Multiple Atmospheric
which would result in a shorter measurement path, is min-              Layer Transmission (MALT, Griffith, 1996). The forward
imised by masking the centre of the secondary mirror using             model uses absorption line parameters based on HITRAN
non-reflective material. This setup more closely resembles             2016 (Gordon et al., 2017) (updated from HITRAN 2008,
that used with existing OP-MIR systems (Flesch et al., 2016;           Rothman et al., 2009; used in Griffith et al., 2018), mea-
Naylor et al., 2016; Phillips et al., 2016) and in initial lab         sured temperature, pressure and path length, and an initial
and field trials provided an order of magnitude more through-          estimate of trace gas amounts, together with an instrument
put than the optic fibre coupling described by Griffith et al.         model accounting for resolution, apodisation, line shape,
(2018).                                                                spectral shift and continuum shape. The calculated spectrum
   The retroreflector initially used was a hollow gold-coated          is iteratively adjusted using the Levenberg–Marquardt algo-
corner cube array (30 × 63 mm, PLX Inc, Deer Park, NY,                 rithm to achieve the best fit to the measured spectrum. This
USA) previously deployed with the OP-MIR systems. This                 yields a path-integrated number of molecules (column den-
was later replaced by an array of 49 × 50 mm solid BK-7                sity, molecules cm−2 ), which is converted to a path-averaged
glass retroreflectors (JEOC, Zhejiang, China) with a total di-         mole fraction using the air density calculated from pressure
mension of 600 mm by 625 mm (height × width). The solid                and temperature. Spectra are fitted in a number of different
glass corner cubes are less prone to condensation and dust ac-         windows. Those used for this work are summarised in Ta-
cumulation, easily cleaned, and require less maintenance in            ble 1 and are illustrated in Griffith et al. (2018).
the field, as well as being considerably less expensive to pur-           Spectra are fitted in real time immediately after collec-
chase. The beam transmitted over the open path is returned to          tion to provide an initial estimate of trace gas mole frac-
the telescope via the retroreflector array. The returning beam         tions; however, we subsequently re-fit the spectra to account

https://doi.org/10.5194/amt-14-3119-2021                                                 Atmos. Meas. Tech., 14, 3119–3130, 2021
3122                                                                             N. M. Deutscher et al.: OP-NIR performance

Table 1. Summary of the spectral windows used for retrieval of
path-averaged concentrations in the open-path NIR spectra; see
Griffith et al. (2018) for plots.

           Gas fitted    Interfering   Spectral region
                         species              (cm−1 )
           O2            H2 O             7790–7960
           CO2           H2 O             4800–5050
           CH4           H2 O             5885–6150
           H2 O, HDO     CO2              4910–5080
           CO            H2 O             4260–4310
           N2 O          CH4 , H2 O       4300–4460

for two corrections: (1) the residual back-reflection from the
secondary mirror and (2) differences between the tempera-
ture measured at one end of the path and the effective or true      Figure 2. Example long-path spectrum (23:48 AEST (Australian
path-averaged temperature. The retrievals are corrected to          eastern standard time) 5 December 2018, black) and original (red)
                                                                    and 20× zoom (pink) short-path spectrum (21:48 AEST 2 Decem-
dry-air mole fractions using the H2 O column retrieved from
                                                                    ber 2018).
the spectra.

2.1.1   Short-path correction                                       Air density is directly inversely proportional to temperature;
                                                                    therefore, a 1 % error in absolute temperature will result in an
A small fraction of the outgoing beam is reflected directly         inversely proportional error in the mole fraction. The mea-
back from the centre of the convex secondary mirror to the          sured temperature at one end of the path is not necessarily
beam splitter and detector. Outgoing radiation can also be re-      representative of the effective mean temperature along the
flected by the external beam splitter and returned to the beam      long path due to variation of the temperature within the path
splitter and detector after diffuse reflection from the inside of   and the possibility that the measured temperature could be in-
the instrument cover. Both of these effects result in radiation     fluenced by solar radiation and thermal mass of surrounds. In
that does not traverse the full atmospheric path. These effects     general, the measured temperature is also likely to be taken
are minimised by blocking the centre of the secondary mirror        closer to the ground than the average measurement height
and shielding the instrument cover with a non-reflective, matt      (beam path) along the open path.
black surface. Despite these measures, the short-path signal           To determine the effective path-averaged temperature, an
is not completely eliminated but remains relatively constant        initial fit to the CO2 window (Table 1) is performed, includ-
and is independent of the long-path intensity. It therefore rep-    ing the temperature in the least-squares fit. The retrieved tem-
resents a variable relative contribution to the total intensity.    perature is then applied as a fixed value in reanalysis of all
   For a more accurate analysis of the long-path spectrum,          windows. The retrieved temperatures show the greatest dif-
a correction for this effect is derived and applied. An off-        ference from the measurements during daytime, when solar
target spectrum is recorded and stored by pointing the tele-        heating of the sensor results in a positive bias in the apparent
scope away from the retroreflector to ensure there is no long-      measured values and can be as much as 5–10 ◦ C. Waxman
path contribution. A least-squares fit of the stored off-target     et al. (2017) found that a similar process was necessary with
spectrum is performed for each long-path measurement in             frequency comb spectroscopy open-path measurements.
the 5000–5500 cm−1 region, which is otherwise blacked out              The net effect of the refitting process to account for
by H2 O absorption in the full path. The least-squares fit pro-     both the short-path correction and path-averaged temperature
vides a scaling factor to apply to the stored off-target spec-      yields the differences illustrated in Fig. 3. The refitted tem-
trum, which is then subtracted from the measured spectrum           peratures are generally lower. This, together with removing
across the full wavelength range. The spectral analysis is then     the short-path absorption, results in an increase in retrieved
repeated on the resulting long-path-only spectrum. Example          mole fractions after refitting.
long-path and short-path spectra are shown in Fig. 2.

2.1.2   Path-averaged temperature                                   3   Field deployment

Temperature is required in the spectral analysis to generate        After initial testing over short path lengths within the lab
the forward model spectrum from HITRAN line parameters              and on the University of Wollongong campus, the instrument
and to calculate air density when deriving mole fractions.          was deployed on an extended field campaign to a New South

Atmos. Meas. Tech., 14, 3119–3130, 2021                                              https://doi.org/10.5194/amt-14-3119-2021
N. M. Deutscher et al.: OP-NIR performance 3123
3.1 Cavity RingDown Spectrometer (CRDS) in situ
measurements
During the campaign, a Picarro G2301 Cavity RingDown
Spectrometer (CRDS) (Crosson, 2008) measuring CO2 , CH4
and H2 O was deployed. The CRDS measured continuously
and was co-located with the OP-NIR spectrometer from
30 November to 12 December 2018. The CRDS sampled
from an inlet mounted above the roof of the instrument shed
at approximately 2.5 m above ground level. It was calibrated
against a suite of WMO-traceable gas standards before and
after the deployment and showed no drift in calibration dur-
ing the period.
3.2 Meteorological data
Figure 3. Time series illustrating the impact of re-processing the
original spectra to account for contributions from short-path (spuri- Weather data are collected on site by NSW-DPI 1.2 km to the
ous) reflections and inaccuracies in measured temperature. The fig- south-south-east of the OP-NIR instrument shelter. These are
ure shows, in order from bottom to top, the original (red) and refit- collected with 10 min resolution using a Measurement Engi-
ted (black) CO2 (d), the difference between the refitted and original neering Australia all-in-one weather station, supplying wind
CO2 (c), the measured (red) and fitted (black) temperature (b), and
speed and direction, temperature, humidity, solar radiation,
the difference between the fitted and measured temperature (a).
and precipitation.
Wales Department of Primary Industries (NSW-DPI) agricul-
4 Results
tural research site, Elizabeth Macarthur Agricultural Institute
(EMAI) at Menangle, NSW. The site is located just outside The time series of CO2 , CH4 , O2 , H2 O, CO and N2 O
the current Sydney urban area, 52 km to the south-west of the from the EMAI deployment are shown in Fig. 5. While the
city. The location is depicted in the map in Fig. 4. CO (120 ± 80 ppb, mean ± standard deviation) and N2 O
The instrument was located on site for about 4 months (330 ± 60 ppb) retrievals are centred on realistic values, the
(123 d), from 4 August 2018 to 12 December 2018. Through- scatter about these is large due to the transmission cutoff
out the deployment period, several changes to the setup took of the BK7 glass corner cubes at lower frequencies where
place, as summarised in Table 2. Firstly, the path length was these species absorb. This could be improved by using cor-
varied by moving the retroreflector array from 0.6 to 1.11 to ner cubes of different glass or quartz, but the focus of the
1.55 km distant from the FTIR, resulting in total path lengths remainder of this work will be on CO2 and CH4 .
of 1.20, 2.22 and 3.10 km. The terrain limited the one-way
path to a maximum of 1500 m. At 600 m, the retroreflector 4.1 Measurement performance
array was changed from the hollow gold-coated array to the
array of BK7 glass corner cubes. Finally, the telescope was We assess the performance of the system using a variety of
changed from a 10 to 12 in. (25 to 30 cm) version. metrics. Firstly, we calculate the signal-to-noise ratio (SNR)
Accounting for two periods where the instrument was re- within the spectra by ratioing consecutive spectra and calcu-
moved for (1) a re-alignment and (2) the change in telescope lating the root-mean-square (rms) noise of the result in the
size, the OP-NIR measured successfully during the remote 6300–6500 cm−1 spectral region, free from atmospheric ab-
deployment for 92 % of the possible time. Data losses oc- sorption.
curred due to power failures and on-site instrument mainte- Secondly, we assess the repeatability of the path-averaged
nance. After filtering to remove spectra with small signals mole fraction measurements by choosing periods when at-
due mostly to rain, fog and condensation on the retroreflec- mospheric variability is small, specifically at wind speeds
tors (less than 5 % of the maximum) and poor fits (rms resid- greater than 2 m s−1 . This does not eliminate all sources of
ual greater than 0.007), a further 9 % of measurements were real atmospheric variability; therefore, a low-frequency run-
removed, mostly due to moisture, meaning the system was ning mean (40 points/2 h) was also subtracted from the time
able to provide measurements of path-averaged mole frac- series in order to assess the variability in the trace gas mea-
tions 83 % of the time. surements. Allan deviations (Allan, 1966; Werle et al., 1993)
are also calculated and for single measurements agree with
the standard deviations of the noise time series.
The results are summarised in Table 3 for varying path
lengths and instrument setups with the results from the orig-
https://doi.org/10.5194/amt-14-3119-2021 Atmos. Meas. Tech., 14, 3119–3130, 20213124 N. M. Deutscher et al.: OP-NIR performance
Figure 4. Map showing the location of EMAI relative to Sydney and Wollongong. The measurement path and corresponding elevation profile
are shown in Fig. 8. Map data © Google Earth.
Table 2. Summary of the open-path NIR instrument setup at EMAI. Previous work by Griffith et al. (2018) in Heidelberg is used as a
reference. Dates are in YYYYMMDD.
Measurement Start End Path length Retroreflector Telescope
period date date (one way) diameter
1 20180804 20180809 600 m Hollow gold-coated 10 in.
2 20180809 20180816 600 m Solid uncoated BK7 glass 10 in.
3 20180816 20180831 1110 m Solid uncoated BK7 glass 10 in.
4 20180831 20181008 1500 m Solid uncoated BK7 glass 10 in.
5 20181018 20181212 1500 m Solid uncoated BK7 glass 12 in.
Ref 201407 201411 1500 m Solid UV quartz 12 in.
inal Heidelberg deployment (Griffith et al., 2018) for com- a component of noise proportional to the signal, presum-
parison. A change in retroreflector array at 600 m path length ably due to a combination of turbulence and photon noise.
yields SNR improvement of about a factor of 3 and a small The depth of absorption lines increases in proportion to path
improvement in trace gas retrieval repeatability for CO2 length, so the net absorption : noise ratio (and thus measure-
(18 %) and CH4 (44 %), as shown in the difference in perfor- ment precision) remains roughly constant with path length.
mance between measurement periods 1 and 2. The retrore- An increased telescope diameter from 10 to 12 in. (25
flector arrays are nearly identical in size; therefore, this is to 30 cm) at 1550 m also yielded a 40 % improvement in
attributed to the newer, cleaner optics. Measurements of CO SNR compared to a theoretical increase of 44 % based on
and N2 O are, however, compromised by the change in reflec- the relative increase in surface area. Larger telescope diam-
tor due to lower transmission at these wavelengths through eters should therefore yield further improvements in SNR.
the glass corner cubes. This setup yielded the best trace gas repeatabilities, though
For a (constant) detector-noise limited spectrum measure- some variability between setups occurs from the availability
ment, increasing path length from 600 to 1110 to 1500 m of suitable well-mixed atmospheric periods and underlying
would decrease spectrum signal and SNR as the inverse atmospheric variability.
square of the path length, while in practice we observe an Finally, comparing period 5 with the Heidelberg reference
approximately inverse linear falloff. This is consistent with performance in Table 3 at almost identical path length, the
Atmos. Meas. Tech., 14, 3119–3130, 2021 https://doi.org/10.5194/amt-14-3119-2021N. M. Deutscher et al.: OP-NIR performance 3125 Figure 5. Time series of the retrieved path-averaged mole fractions for the 600, 1110 and 1500 m path lengths. Data collected at a one-way path length of 600 m are shown in light grey, at 1110 m in darker grey, and the 1500 m path length in black. The CH4 y axis has been zoomed to 1700 to 2500 nmol mol−1 . https://doi.org/10.5194/amt-14-3119-2021 Atmos. Meas. Tech., 14, 3119–3130, 2021
3126 N. M. Deutscher et al.: OP-NIR performance
Table 3. Summary of the measurement performance during the field deployment at each path length and over changes in instrument setup.
The numbered measurement periods and setups correspond to those in Table 2.
Measurement Instrument setup Signal-to-noise Repeatability (1σ )
period (path, reflector, ratio (SNR) CO2 CH4 CO N2 O
telescope) (ppm) (ppb) (ppb) (ppb)
1 600 m, gold, 10 in. 2050 0.74 8.5 7.0 8.4
2 600 m, glass, 10 in. 6400 0.60 14.8 24.2 30.9
3 1110 m, glass, 10 in. 3750 0.38 3.8 27.1 35.8
4 1500 m, glass, 10 in. 2300 0.46 3.9 28.5 35.6
5 1500 m, glass, 12 in. 3200 0.28 2.1 17.1 21.8
Ref∗ 1500 m, quartz, 12 in. 750 1.7 21 – –
∗ Deployment at Heidelberg (Griffith et al., 2018).
new system has 4 times better SNR and repeatability 6 times
(0.28 ppm) and 10 times (2.1 ppb) better for CO2 and CH4 ,
respectively, than the original system described by Griffith
et al. (2018).
4.2 Comparison to in situ measurements
The time series of OP-NIR and CRDS measurements and
their differences are shown in Fig. 6. In the majority of the
time series the two instruments capture the same broad events
and the OP-NIR compares reasonably well with the Picarro
measurements over the concurrent measurement period. The
OP-NIR measurements typically exhibit less variability than
the in situ measurements, especially at night and/or during
low wind-speed conditions. This is expected, because the
OP-NIR measures the spatial average of gas mole fractions
and thus variability along the path averaged over the time
of each OP-NIR measurement – 3 min in this case. In con-
trast, in situ techniques are sensitive to spatio-temporal vari- Figure 6. Time series of measured CO2 (a, b) and CH4 (c, d) from
ability at their location on the timescale of several seconds, the OP-NIR (red) and in situ CRDS (black) measurements while
such as localised gas fluxes and/or atmospheric mixing or the CRDS was co-located with the OP-NIR, from 1 to 13 Decem-
lack thereof. ber 2018. For each gas, the upper panel (a, c) shows the difference
between the OP-NIR and CRDS measurements.
The comparison between the OP-NIR and Picarro for CO2
is shown in Fig. 7. The measurements are divided into three
categories: sunny (solar radiation above 100 W m−2 ), well-
mixed (wind speed greater than 2 m s−1 ) and all other data. For CH4 (Fig. 9) variations in both directions occur, with
Picarro CO2 measurements are consistently higher at night the OP-NIR measurements often higher than the CRDS. This
and lower during the day in sunny periods compared to the is due to the presence of two local sources in the fields over
OP-NIR measurements. Usually over grassland such as at which the open-path beam passes – a coal-seam gas (CSG)
the field site, there is a net flux of CO2 from the atmo- well located almost directly under the path at 500 m from the
sphere to the biosphere during the day, due to photosynthetic retroreflector and grazing stock (sheep and cattle) most often
uptake being larger than respiration. The reverse is true at located around the eastern end of the path. The CRDS is lo-
night. These fluxes establish a vertical CO2 gradient near the cated to the western side of the field and, since it is a point
Earth’s surface, with higher CO2 near the surface during the rather than path-integrated measurement, it samples less in-
night and lower CO2 near the surface during the day. The fluence from these sources.
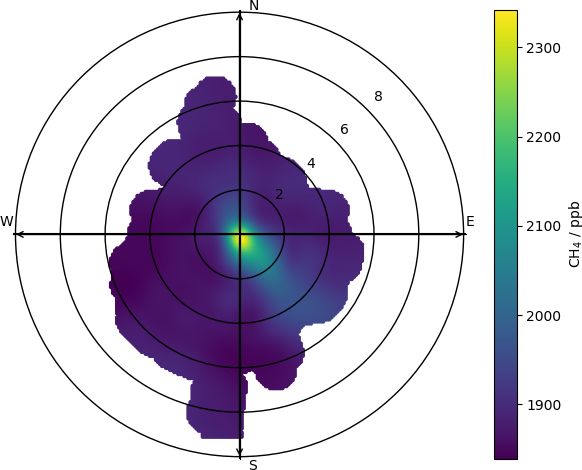
CRDS inlet is closer to the surface (2.5 m) than the mean A polar bivariate plot for CH4 from open-path measure-
height of the OP-NIR path (23 m; see Fig. 8), which may ex- ments is shown for the data from the entire campaign in
plain why the Picarro CO2 measurements are higher at night Fig. 10. The highest CH4 values are seen under conditions
and lower during the day than the OP-NIR. with low wind speeds, indicating a source under or very close
to the measurement path and/or a build-up of CH4 under sta-
Atmos. Meas. Tech., 14, 3119–3130, 2021 https://doi.org/10.5194/amt-14-3119-2021N. M. Deutscher et al.: OP-NIR performance 3127
Table 4. Calculated biases of OP-NIR measurements relative to ei-
ther in situ measurements or known mole fractions. “n/a” means not
applicable.
Species Ratio (mean ± SD) r
CO2 1.0141 ± 0.0002 0.89
CH4 1.0161 ± 0.0004 0.89
O2 1.0266 ± 0.0001 n/a
ety and spatial inhomogeneity of local sources and sinks. For
both CO2 and CH4 , these biases are approximately a factor
of 2 smaller using HITRAN 2016 line parameters compared
to HITRAN 2008 used in Griffith et al. (2018).
The comparison between the OP-NIR and in situ measure-
ments is summarised in Table 4.
Figure 7. Comparison of path-averaged CO2 measured by the open-
path NIR and in situ CO2 measured by the CRDS. All data points 4.3 Future directions
are shown in black, with those from well-mixed conditions (wind
speeds greater than 2 m s−1 ) in red and those during sunlight hours At EMAI, we were limited to testing up to 1.55 km due to the
(solar radiation greater than 100 W m−2 ) in cyan. The best-fit line availability of appropriate lines of sight, but the pathlength-
(OP-NIR = 1.0141 ± 0.0002 × Picarro) for the fit of OP-NIR vs. in independent behaviour of the OP-NIR measurement repeata-
situ measurements under well-mixed conditions is shown. bility out to 1500 m suggests that longer path lengths are pos-
sible. Given the cost-effective BK7 glass retroreflectors, the
surface area of the retroreflector array could be further in-
ble atmospheric conditions. Other high amounts are also seen creased to facilitate this. A larger telescope could also in-
from a sector to the south-east, with some enhancements to crease the signal, enabling longer path lengths to be used.
the north. The nearest CSG well is located approximately 5 m The inexpensive nature of the retroreflectors and the use
to the south of the open path, 500 m from the retroreflector of the AIM unit with programmable pointing mean that
end of the 1500 m path. When they were in nearby fields, a multiple-path configuration would also be possible. This
the majority of sheep were located to the east/south-east of could produce a doubling of effective path length or enable
the instrument shed (south of the retroreflector), while cattle setups where upwind/downwind measurement pairs can be
were periodically located to the south-east of the instrument taken over wider areas than previously possible with the OP-
and regularly to the north. As the experiment was conducted MIR system (Cartwright et al., 2019; Feitz et al., 2018).
remotely, we do not have exact records of stock movements. The ability to co-retrieve CO and N2 O would enable the
The locations of the potential sources are illustrated in Fig. 8. system to be used in a broader range of applications, in both
For CH4 , an additional criterion is therefore added to the urban and rural settings. At moderate increased expense, al-
definition of well-mixed conditions to account for the CSG ternative glass retroreflectors could be used to improve sig-
well, sheep and cattle that are present near to the OP-NIR nals at these wavelengths, which should lead to improved
measurement path. We therefore also include only data from precision. These co-retrieved gases could help to identify
the westerly sector in our definition of well-mixed condi- and quantify atmospheric signals especially from combus-
tions, i.e. wind directions between 180 and 360◦ . tion (CO) or soil/wastewater processes (N2 O).
Comparison between the in situ CRDS measurements and Open-path measurements are more likely to capture point
the path-averaged FTIR measurements under well-mixed source emissions than single point measurements provided
conditions is used to assess the bias of the OP-NIR system. that the repeatability is good enough to resolve this over the
Under these conditions, the relationship between the OP-NIR integrated path. The OP-NIR spatial scale is more compara-
and CRDS falls tightly on a line. For CO2 , this corresponds ble to the scale of many atmospheric models, which facili-
to a slope of 1.0141 ± 0.0002 (r = 0.89); i.e. the OP-NIR tates model intercomparison studies. Other potential applica-
is biased high by 1.41 % (≈ 6 ppm at 400 ppm) relative to tions include measurements from industrial-scale compost-
the in situ measurement scale. Figure 9 shows the compar- ing, landfills, and wastewater treatment, agricultural monitor-
ison between in situ and open-path CH4 . With wind speeds ing of soil (fertiliser) or animal emissions, and gas pipeline
above 2 m s−1 from the west, the relationship between the monitoring and leak detection when combined with appro-
open-path and in situ measurements lies around a slope of priate modelling.
1.0161 ± 0.0004 (r = 0.89). There is much more scatter in
the relationship for CH4 than CO2 , indicative of the vari-
https://doi.org/10.5194/amt-14-3119-2021 Atmos. Meas. Tech., 14, 3119–3130, 20213128 N. M. Deutscher et al.: OP-NIR performance
Figure 8. Map of the 1.55 km path at EMAI and corresponding elevation profile. The OP-NIR and stationary Picarro were located at the left
end of the path and the retroreflector array at the right end. The mean elevation across the 1.55 km observation path is 118 m above sea level,
an average of 23 m above surface elevation. Map © Google Earth.
Figure 9. Comparison of path-averaged CH4 measured by the open-
path NIR and in situ CH4 measured by the CRDS. All data points
are shown in black, with those from well-mixed conditions (wind Figure 10. Polar bivariate plot showing the relationship between
speeds greater than 2 m s−1 and from the westerly sector) in red. CH4 , wind speed and wind direction over the full campaign.
The best-fit line of OP-NIR = 1.0161 ± 0.0004 × Picarro for the fit
of OP-NIR vs. in situ measurements under well-mixed conditions is
shown.
spectral region. Over paths up to 1.55 km one way, the system
can achieve repeatability of better than 0.1 % (at 0.28 ppm)
5 Conclusions for CO2 and close to 0.1 % (at 2.1 ppb) for CH4 for 3 min av-
eraging times under well-mixed atmospheric conditions. The
In this paper, we present refinements to an open-path Fourier measurement precision is essentially independent of path
transform infrared system measuring in the near-infrared length. Comparison to co-located in situ measurements, also
Atmos. Meas. Tech., 14, 3119–3130, 2021 https://doi.org/10.5194/amt-14-3119-2021N. M. Deutscher et al.: OP-NIR performance 3129
under well-mixed conditions, indicates offsets of approxi- References
mately 1.5 % from measurements traceable to WMO scales.
The open-path measurements therefore have a calibration Alden, C. B., Coburn, S. C., Wright, R. J., Baumann, E., Cossel,
offset of 1.41 % for CO2 and 1.61 % for CH4 . The open- K., Perez, E., Hoenig, E., Prasad, K., Coddington, I., and Rieker,
G. B.: Single-Blind Quantification of Natural Gas Leaks from
path measurements also prove capable of detecting signals
1 km Distance Using Frequency Combs, Environ. Sci. Technol.,
from photosynthesis, respiration, and ruminant stock on lo- 53, 2908–2917, https://doi.org/10.1021/acs.est.8b06259, 2019.
cal scales. Allan, D. W.: Statistics of Atomic Frequency Standards, P. IEEE,
54, 221–230, https://doi.org/10.1109/PROC.1966.4634, 1966.
Bai, M., Suter, H., Lam, S. K., Davies, R., Flesch, T. K., and
Data availability. Data are in preparation for submission to a pub- Chen, D.: Gaseous emissions from an intensive vegetable farm
licly accessible database after approval from funding bodies. measured with slant-path FTIR technique, Agr. Forest Meteorol.,
258, 50–55, https://doi.org/10.1016/j.agrformet.2018.03.001,
2018.
Author contributions. NMD led the research and co-ordinated writ- Cartwright, L., Zammit-Mangion, A., Bhatia, S., Schroder, I.,
ing of the paper. NMD and DWTG were responsible for acquir- Phillips, F., Coates, T., Negandhi, K., Naylor, T., Kennedy,
ing funding for this research. NMD, DWTG and TAN organised M., Zegelin, S., Wokker, N., Deutscher, N. M., and Feitz, A.:
field trials, which were executed by them, CGRC and HLM. NMD, Bayesian atmospheric tomography for detection and quantifica-
DWTG, TAN and CGRC were involved in project direction. TAN, tion of methane emissions: application to data from the 2015
DWTG, NMD, CGRC and AGC were all involved in data analysis. Ginninderra release experiment, Atmos. Meas. Tech., 12, 4659–
All the authors contributed to writing and editing the manuscript. 4676, https://doi.org/10.5194/amt-12-4659-2019, 2019.
Crosson, E. R.: A cavity ring-down analyzer for measuring atmo-
spheric levels of methane, carbon dioxide, and water vapor, Appl.
Competing interests. The authors declare that they have no conflict Phys. B-Lasers O., 92, 403–408, https://doi.org/10.1007/s00340-
of interest. 008-3135-y, 2008.
Desservettaz, M., Phillips, F., Naylor, T., Price, O., Samson,
S., Kirkwood, J., and Paton-Walsh, C.: Air Quality Im-
Acknowledgements. The authors are grateful to staff at Elizabeth pacts of Smoke from Hazard Reduction Burns and Domes-
Macarthur Agricultural Institute, especially Greg Scott and Ania tic Wood Heating in Western Sydney, Atmosphere, 10, 557,
Deutscher for organising and providing access to the EMAI field https://doi.org/10.3390/atmos10090557, 2019.
site and Michael Fitzgerald for providing weather station data. The Dobler, J. T., Harrison, F. W., Browell, E. V., Lin, B., McGregor,
authors wish to acknowledge financial assistance provided through D., Kooi, S., Choi, Y., and Ismail, S.: Atmospheric CO2 col-
Australian National Low Emissions Coal Research and Develop- umn measurements with an airborne intensity-modulated contin-
ment (ANLEC R&D). ANLEC R&D is supported by COAL21 Ltd uous wave 1.57 µm fiber laser lidar, Appl. Opt., 52, 2874–2892,
and the Australian Government through the Clean Energy Initia- https://doi.org/10.1364/AO.52.002874, 2013.
tive. This research project used assets provided by the Australian Feitz, A., Schroder, I., Phillips, F., Coates, T., Negandhi, K., Day,
Government Education Investment Fund through the CO2CRC. We S., Luhar, A., Bhatia, S., Edwards, G., Hrabar, S., Hernandez,
also acknowledge the support of AuScope for the Picarro CRDS E., Wood, B., Naylor, T., Kennedy, M., Hamilton, M., Hatch,
analyser used in this work. Nicholas M. Deutscher is funded via M., Malos, J., Kochanek, M., Reid, P., Wilson, J., Deutscher, N.,
an ARC Future Fellowship, FT180100327. We an indebted to the Zegelin, S., Vincent, R., White, S., Ong, C., George, S., Maas, P.,
input of colleagues throughout the project, especially Peter Rayner Towner, S., Wokker, N., and Griffith, D.: The Ginninderra CH4
and Jeremy Silver at the University of Melbourne. and CO2 release experiment: An evaluation of gas detection and
quantification techniques, Int. J. Greenh. Gas Con., 70, 202–224,
https://doi.org/10.1016/j.ijggc.2017.11.018, 2018.
Flesch, T. K., Baron, V. S., Wilson, J. D., Griffith, D. W.,
Financial support. This research has been supported by the Aus-
Basarab, J. A., and Carlson, P. J.: Agricultural gas emis-
tralian National Low Emissions Coal Research and Development
sions during the spring thaw: Applying a new measure-
(grant no. 7-0816-0304) and the Australian Research Council (grant
ment technique, Agr. Forest Meteorol., 221, 111–121,
no. FT180100327).
https://doi.org/10.1016/j.agrformet.2016.02.010, 2016.
Gordon, I. E., Rothman, L. S., Hill, C., Kochanov, R. V., Tan, Y.,
Bernath, P. F., Birk, M., Boudon, V., Campargue, A., Chance,
Review statement. This paper was edited by Andreas Hofzumahaus K. V., Drouin, B. J., Flaud, J. M., Gamache, R. R., Hodges,
and reviewed by two anonymous referees. J. T., Jacquemart, D., Perevalov, V. I., Perrin, A., Shine, K. P.,
Smith, M. A., Tennyson, J., Toon, G. C., Tran, H., Tyuterev,
V. G., Barbe, A., Császár, A. G., Devi, V. M., Furtenbacher,
T., Harrison, J. J., Hartmann, J. M., Jolly, A., Johnson, T. J.,
Karman, T., Kleiner, I., Kyuberis, A. A., Loos, J., Lyulin,
O. M., Massie, S. T., Mikhailenko, S. N., Moazzen-Ahmadi,
N., Müller, H. S., Naumenko, O. V., Nikitin, A. V., Polyansky,
O. L., Rey, M., Rotger, M., Sharpe, S. W., Sung, K., Starikova,
https://doi.org/10.5194/amt-14-3119-2021 Atmos. Meas. Tech., 14, 3119–3130, 20213130 N. M. Deutscher et al.: OP-NIR performance E., Tashkun, S. A., Auwera, J. V., Wagner, G., Wilzewski, J., Plant, G., Nikodem, M., Mulhall, P., Varner, R., Sonnen- Wcisło, P., Yu, S., and Zak, E. J.: The HITRAN2016 molecu- froh, D., and Wysocki, G.: Field Test of a Remote Multi- lar spectroscopic database, J. Quant. Spectrosc. Ra., 203, 3–69, Path CLaDS Methane Sensor, Sensors, 15, 21315–21326, https://doi.org/10.1016/j.jqsrt.2017.06.038, 2017. https://doi.org/10.3390/s150921315, 2015. Griffith, D. W. T.: Synthetic Calibration and Quantitative Analysis Queisser, M., Granieri, D., and Burton, M.: A new frontier in CO2 of Gas-Phase FT-IR Spectra, Appl. Spectrosc., 50, 59–70, 1996. flux measurements using a highly portable DIAL laser system, Griffith, D. W. T., Pöhler, D., Schmitt, S., Hammer, S., Sci. Rep., 6, 33834, https://doi.org/10.1038/srep33834, 2016. Vardag, S. N., and Platt, U.: Long open-path measure- Rieker, G. B., Giorgetta, F. R., Swann, W. C., Kofler, J., Zolot, ments of greenhouse gases in air using near-infrared Fourier A. M., Sinclair, L. C., Baumann, E., Cromer, C., Petron, transform spectroscopy, Atmos. Meas. Tech., 11, 1549–1563, G., Sweeney, C., Tans, P. P., Coddington, I., and New- https://doi.org/10.5194/amt-11-1549-2018, 2018. bury, N. R.: Frequency-comb-based remote sensing of green- Humphries, R., Jenkins, C., Leuning, R., Zegelin, S., Griffith, D., house gases over kilometer air paths, Optica, 1, 290–298, Caldow, C., Berko, H., and Feitz, A.: Atmospheric Tomogra- https://doi.org/10.1364/OPTICA.1.000290, 2014. phy: A Bayesian Inversion Technique for Determining the Rate Rothman, L., Gordon, I., Barbe, A., Benner, D., Bernath, P., and Location of Fugitive Emissions, Environ. Sci. Technol., 46, Birk, M., Boudon, V., Brown, L., Campargue, A., Cham- 1739–1746, https://doi.org/10.1021/es202807s, 2012. pion, J.-P., Chance, K., Coudert, L., Dana, V., Devi, V., Fally, Jones, F. M., Phillips, F. A., Naylor, T., and Mercer, N. B.: Methane S., Flaud, J.-M., Gamache, R., Goldman, A., Jacquemart, D., emissions from grazing Angus beef cows selected for divergent Kleiner, I., Lacome, N., Lafferty, W., Mandin, J.-Y., Massie, residual feed intake, Anim. Feed Sci. Tech., 166–167, 302–307, S., Mikhailenko, S., Miller, C., Moazzen-Ahmadi, N., Nau- https://doi.org/10.1016/j.anifeedsci.2011.04.020, 2011. menko, O., Nikitin, A., Orphal, J., Perevalov, V., Perrin, A., Laubach, J., Bai, M., Pinares-Patiño, C. S., Phillips, F. A., Predoi-Cross, A., Rinsland, C., Rotger, M., Šimečková, M., Naylor, T. A., Molano, G., Cárdenas Rocha, E. A., and Smith, M., Sung, K., Tashkun, S., Tennyson, J., Toth, R., Van- Griffith, D. W.: Accuracy of micrometeorological tech- daele, A., and Auwera, J. V.: The HITRAN 2008 molecular niques for detecting a change in methane emissions spectroscopic database, J. Quant. Spectrosc. Ra., 110, 533–572, from a herd of cattle, Agr. Forest Meteorol., 176, 50–63, https://doi.org/10.1016/j.jqsrt.2009.02.013, 2009. https://doi.org/10.1016/j.agrformet.2013.03.006, 2013. Saito, H., Manago, N., Kuriyama, K., and Kuze, H.: Near- Lian, J., Bréon, F.-M., Broquet, G., Zaccheo, T. S., Dobler, J., Ra- infrared open-path measurement of CO2 concentration monet, M., Staufer, J., Santaren, D., Xueref-Remy, I., and Ciais, in the urban atmosphere, Opt. Lett., 40, 2568–2571, P.: Analysis of temporal and spatial variability of atmospheric https://doi.org/10.1364/OL.40.002568, 2015. CO2 concentration within Paris from the GreenLITE™ laser Wagner, G. A. and Plusquellic, D. F.: Ground-based, inte- imaging experiment, Atmos. Chem. Phys., 19, 13809–13825, grated path differential absorption LIDAR measurement of https://doi.org/10.5194/acp-19-13809-2019, 2019. CO2 , CH4 , and H2 O near 16 µm, Appl. Opt., 55, 6292, Loh, Z., Leuning, R., Zegelin, S., Etheridge, D., Bai, M., https://doi.org/10.1364/ao.55.006292, 2016. Naylor, T., and Griffith, D.: Testing Lagrangian atmo- Waxman, E. M., Cossel, K. C., Truong, G.-W., Giorgetta, F. spheric dispersion modelling to monitor CO2 and CH4 leak- R., Swann, W. C., Coburn, S., Wright, R. J., Rieker, G. age from geosequestration, Atmos. Environ., 43, 2602–2611, B., Coddington, I., and Newbury, N. R.: Intercomparison of https://doi.org/10.1016/j.atmosenv.2009.01.053, 2009. open-path trace gas measurements with two dual-frequency- Naylor, T. A., Wiedemann, S. G., Phillips, F. A., Warren, B., McGa- comb spectrometers, Atmos. Meas. Tech., 10, 3295–3311, han, E. J., and Murphy, C. M.: Emissions of nitrous oxide, am- https://doi.org/10.5194/amt-10-3295-2017, 2017. monia and methane from Australian layer-hen manure storage Werle, P., Mücke, R., and Slemr, F.: The limits of signal averaging in with a mitigation strategy applied, Anim. Prod. Sci., 56, 1367, atmospheric trace-gas monitoring by tunable diode-laser absorp- https://doi.org/10.1071/AN15584, 2016. tion spectroscopy (TDLAS), Appl. Phys. B-Photo., 57, 131–139, Nikodem, M., Plant, G., Sonnenfroh, D., and Wysocki, G.: Open- https://doi.org/10.1007/BF00425997, 1993. path sensor for atmospheric methane based on chirped laser Wunch, D., Toon, G. C., Blavier, J.-F. L., Washenfelder, dispersion spectroscopy, Appl. Phys. B-Lasers O., 119, 3–9, R. A., Notholt, J., Connor, B. J., Griffith, D. W., Sher- https://doi.org/10.1007/s00340-014-5938-3, 2015. lock, V., and Wennberg, P. O.: The Total Carbon Column Phillips, F. A., Wiedemann, S. G., Naylor, T. A., McGahan, Observing Network, Philos. T. Roy. Soc. A, 369, 2087, E. J., Warren, B. R., Murphy, C. M., Parkes, S., and Wilson, https://doi.org/10.1098/rsta.2010.0240, 2011. J.: Methane, nitrous oxide and ammonia emissions from pigs housed on litter and from stockpiling of spent litter, Anim. Prod. Sci., 56, 1390–1403, https://doi.org/10.1071/AN15650, 2016. Phillips, F. A., Naylor, T., Forehead, H., Griffith, D. W., Kirkwood, J., and Paton-Walsh, C.: Vehicle ammonia emissions measured in an urban environment in Sydney, Australia, using open path fourier transform infra-red spectroscopy, Atmosphere, 10, 208, https://doi.org/10.3390/ATMOS10040208, 2019. Atmos. Meas. Tech., 14, 3119–3130, 2021 https://doi.org/10.5194/amt-14-3119-2021
You can also read