Can Mitogenomes of the northern Wheatear (Oenanthe oenanthe) Reconstruct its phylogeography and Reveal the origin of Migrant Birds? - Heidelberg ...
←
→
Page content transcription
If your browser does not render page correctly, please read the page content below
www.nature.com/scientificreports

            OPEN           Can Mitogenomes of the Northern
                           Wheatear (Oenanthe oenanthe)
                           Reconstruct Its Phylogeography
                           and Reveal the Origin of Migrant
                           Birds?
                           Erjia Wang1 ✉, Dezhi Zhang2,3, Markus Santhosh Braun1, Agnes Hotz-Wagenblatt4,
                           Tomas Pärt5, Debora Arlt5, Heiko Schmaljohann6,7, Franz Bairlein6, Fumin Lei2,3,8 &
                           Michael Wink1 ✉
                           The Northern Wheatear (Oenanthe oenanthe, including the nominate and the two subspecies O. o.
                           leucorhoa and O. o. libanotica) and the Seebohm’s Wheatear (Oenanthe seebohmi) are today regarded
                           as two distinct species. Before, all four taxa were regarded as four subspecies of the Northern
                           Wheatear. Their classification has exclusively been based on ecological and morphological traits,
                           while their molecular characterization is still missing. With this study, we used next-generation
                           sequencing to assemble 117 complete mitochondrial genomes covering O. o. oenanthe, O. o. leucorhoa
                           and O. seebohmi. We compared the resolution power of each individual mitochondrial marker and
                           concatenated marker sets to reconstruct the phylogeny and estimate speciation times of three taxa.
                           Moreover, we tried to identify the origin of migratory wheatears caught on Helgoland (Germany) and
                           on Crete (Greece). Mitogenome analysis revealed two different ancient lineages that separated around
                           400,000 years ago. Both lineages consisted of a mix of subspecies and species. The phylogenetic trees,
                           as well as haplotype networks are incongruent with the present morphology-based classification.
                           Mitogenome could not distinguish these presumed species. The genetic panmixia among present
                           populations and taxa might be the consequence of mitochondrial introgression between ancient
                           wheatear populations.

                           Maternal inheritance in most taxa (such as birds), rare recombination, and appropriate gene content make mito-
                           chondrial DNA (mtDNA) the cornerstone of phylogeographic and taxonomic studies in birds and other organ-
                           isms1–3. In addition, mtDNA is conservative in size and organization, but nevertheless exhibits comparatively
                           high substitution rates, which makes it a good marker for evolutionary events during the last 20 million years4.
                           Moreover, methods of mtDNA analysis are well established, and do not require high-performance computing
                           power.
                              Avian mtDNA is a closed circular molecule containing 13 protein coding genes (PCGs), including ATPase sub-
                           unit 6 (ATP6) and subunit 8 (ATP8), cytochrome c oxidase subunit 1–3 (COX1, COX2 and COX3), cytochrome B
                           (CytB), NADH dehydrogenase subunits 1–6 and 4 l (ND1–6 and ND4l); 2 ribosomal RNAs (rRNAs); 22 transfer
                           RNAs (tRNAs) and a control region (CR). For DNA barcoding, even short stretches of DNA (e.g.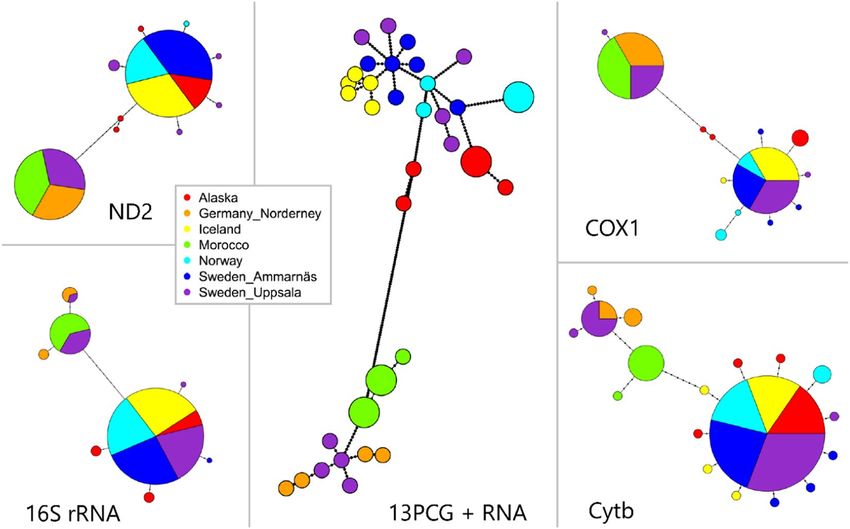
www.nature.com/scientificreports/ www.nature.com/scientificreports
has been used as a marker gene and confirmed the classification of >94% of bird species which had previously
been classified based on morphology5–10. Nevertheless, single mitochondrial markers are often inappropriate to
reliably reconstruct the phylogeography of populations below the species level. Concatenating several mitochon-
drial gene sequences obtained by traditional Sanger sequencing may improve the situation, but still does not
always yield satisfactory results11–13. With the advance of fast moving high-throughput sequencing technologies,
the field of phylogeography and population genetics might break the shackles of previous sequencing technolo-
gies as they are no longer restricted to a handful of molecular markers. It is now feasible to obtain sequences of
complete mitogenomes of large sample sizes to infer the phylogeographic histories of avian species in a short time.
Wheatears (genus Oenanthe) are small passerines in the family Muscicapidae (Old World flycatchers and
chats). They are specialized to open habitats and many of them inhabit savannah and desert ecosystems14. To date,
the genus Oenanthe sensu stricto comprises 29 species14. The Northern Wheatear (Oenanthe oenanthe) breeds
almost across the whole Holarctic. It consists of 3 subspecies, O. o. oenanthe (nominate), O. o. leucorhoa (the
“Greenland Wheatear” hereafter), and O. o. libanotica (southern Europe and Asia). In this study, we focused on
3 taxa, O. o. oenanthe, O. o. leucorhoa and O. seebohmi. Breeding sites of O. o. oenanthe range from continental
Europe and Great Britain to Siberia and Alaska, while O. o. leucorhoa breeds in Greenland, Iceland and the East
of Canada14. During autumn and spring migration, these two subspecies gather at stopover sites in Northern and
Western Europe15–18. The sedentary Seebohm’s Wheatear, however, is confined to the Atlas Mountains (Morocco)
and had traditionally been included in the Northern Wheatear (O. oenanthe) as a distinctive subspecies (O. o.
seebohmi). However, it has recently been separated and considered as a conspecific taxon, O. seebohmi14.
Wheatears exhibit a remarkable complexity and variety of color patterns, while they are rather congeneric with
respect to display behavior, foraging, and morphological traits19. Small, but distinctive differences exist between O. o.
leucorhoa and O. o. oenanthe. In the field, the 2 subspecies to a certain extent, can be distinguished by wing length and
plumage coloration15,20. In line with the current classification as a separate species, O. seebohmi, based on its plumage
coloration, can be readily told apart from O. oenanthe. Oenanthe seebohmi can be discriminated by its black throat, its
black underwing-coverts and its larger proportion of white on the forehead when compared to other wheatear species.
However, species status and particularly the delineation of subspecies within the wheatear genus, have been challenged
for decades based on ecological, geographical, morphological and genetic characters19,21–28. In spite of the numerous
investigations of the morphology and migration ecology of wheatears18,19,22,29–31, this controversial debate is still ongo-
ing and can only be resolved by molecular data.
In this study, we reconstructed the complete reference mitogenome of the Northern Wheatear and Seebohm’s
Wheatear. In order to obtain a comprehensive phylogenetic framework and robust population genetics, we inves-
tigated the mitogenome of 117 individuals from 7 breeding populations: Sweden (Ammarnäs, Uppsala, O. o.
oenanthe), Norway (O. o. oenanthe), Germany (Norderney, O. o. oenanthe), Alaska (O. o. oenanthe), Iceland (O. o.
leucorhoa), and Morocco (O. seebohmi). We compared the resolution power of single mtDNA markers, multiple
mtDNA markers and complete mitochondrial genomes for inferring phylogenetic relationships. We further used
mitogenomes of Northern Wheatears, which were sampled as passage migrants at two stop-over sites, Helgoland
and Crete, to test whether we could infer their origins based on complete mitogenome sequences. Finally, we
assessed whether the molecular data is in consensus with the recent morphological and ecological classification
of the Northern Wheatear and its closely related species Seebohm’s Wheatear.
Results and Discussion
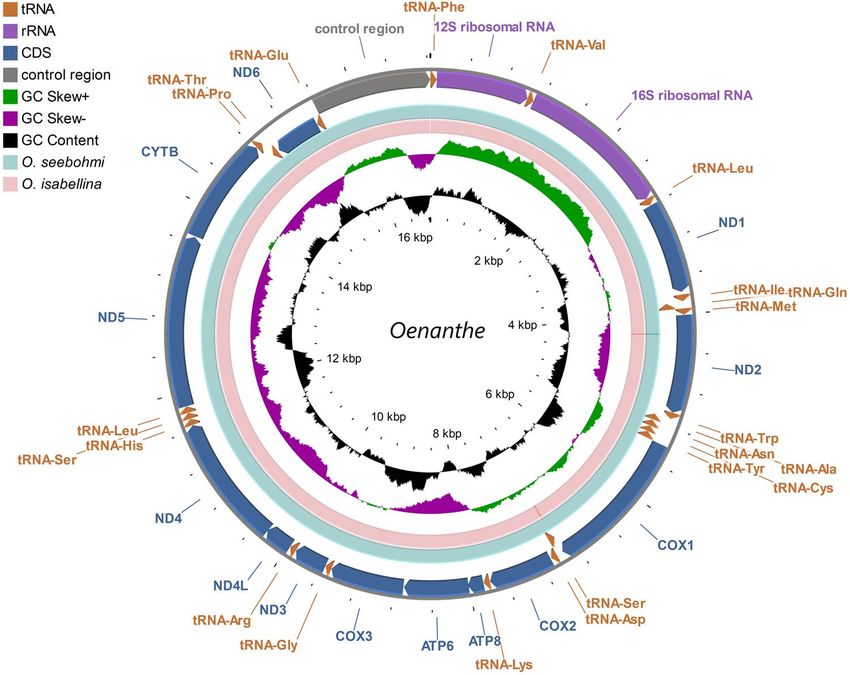
Mitogenome organization. Mitogenomes of 2 subspecies of the Northern Wheatear (O. o. oenanthe and
O. o. leucorhoa), 1 congeneric species (O. seebohmi), and the outgroup O. isabellina were assembled de novo and
the reads generated by massive parallel sequencing (NGS) of mtDNA were mapped. A mitogenome contraction
map (Fig. 1) was built. The total length of the mitochondrial DNA sequence of O. oenanthe ranged from 16,824 to
16,835 bp (Table 1). Except for ND6 and 8 tRNAs, all remaining genes [12 protein-coding genes (PCGs), 2 rRNAs
and 14 tRNAs] were located on the heavy DNA strand (H-strand). The arrangement of the whole mitogenome
of O. oenanthe, O. seebohmi and O. isabellina were identical to the typical mitogenome of birds, that was initially
established in Gallus gallus32. No gene rearrangements and duplications were found in our samples. However,
when compared to the O. oenanthe, a few deletions were detected in the mitogenome of O. isabellina inside
the non-coding area between ND1 and tRNA-Ile. Another deletion was found in the coding area of tRNA-Trp
(Table 1). The overall base compositions of O. oenanthe and O. seebohmi under study were also similar to the
related species O. isabellina. The relative abundance of nucleotides was C (32.8%) > A (30.0%) > T (22.9%)> G
(14.3%), and the GC skew was negative for the mitogenome.
The total length of the 13 PCGs was 11,405 bp, representing approximately 67.8% of the entire mitogenome of
3 study taxa. The GC content was 48.1% and 47.1% for the 13 PCG and the complete mitogenome, respectively.
The genes coding for individual tRNAs ranged from 67 bp to 75 bp and summed up to 1,547 bp in total length.
Since tRNAs play an important role in translating mRNA into protein, they are highly conserved. Accordingly,
polymorphisms among birds of the 7 different breeding sites were only detected in 5 out of 22 tRNAs (tRNA-Trp,
tRNA-Asn, tRNA-Lys, tRNA-Arg and tRNA-Gly). tRNAs adopted the conventional secondary structure of
four-armed cloverleaves and L-shaped tertiary structure33. Owing to the absence of the dihydrouridine arm
(D-arm), tRNA-Ser (GCT) did not fold into a cloverleaf conformation. This pattern has been known for other
species for decades and is particularly common in animal mitochondrial genomes34.
Phylogeography and population genetics based on the mitogenomic data. Minimum span-
ning network analysis of the 13 PCGs, rRNAs and tRNAs from 38 individuals from the 7 breeding populations
in Central and Northern Europe (Norway, Germany_Nordeney, Sweden_Ammarnäs and Sweden_Uppsala),
Iceland, Alaska and Morocco yielded 34 haplotypes with a maximum of 98 mutation steps (Fig. 2). The highest
level of haplotype diversity with maximum mutation steps for single markers was found in ND5 (Fig. S1, Fig. S2).
Scientific Reports | (2020) 10:9290 | https://doi.org/10.1038/s41598-020-66287-0 2
www.nature.com/scientificreports/                                                              www.nature.com/scientificreports

                           Figure 1. Circular map of the mitogenome of Oenanthe oenanthe assembled from NGS data. Features are
                           represented by different color blocks. Arrows indicate the orientation of the gene transcription. The GC content
                           and GC skew were calculated using a sliding window and plotted as the deviation from the average value of
                           the entire sequence. The BLAST comparisons of Oenanthe oenanthe with Oenanthe seebohmi and Oenanthe
                           oenanthe with Oenanthe isabellina are shown in divider rings.

                           Most of the genetic markers exhibited two haplotype groups (Figs. 2, S2). Exceptions were tRNAs and ATP8 being
                           either highly conservative or extraordinarily short in length (Fig. S2, Table 1). Figure 2 illustrates the minimum
                           spanning networks based on 4 commonly used markers in phylogeography and a concatenated set containing all
                           mitochondrial markers. When looking at the haplotype networks based on the single markers, the Norwegian O.
                           o. oenanthe shared the haplotypes with the other nominate Northern Wheatears from Ammarnäs (Sweden) and
                           Alaska, but also with the “Greenland Wheatears” (O. o. leucorhoa) breeding in Iceland. Hence, this first haplotype
                           group consisted of mixed samples of O. o. oenanthe and O. o. leucorhoa. Similarly, the Moroccan O. seebohmi
                           clustered with the O. o. oenanthe from Uppsala (Sweden) and Norderney (Germany) and constituted the second
                           group of haplotypes. Even when using the full resolution power of all mitochondrial markers, no clear separation
                           among the (sub)species was evident. Accordingly, a limited relationship between the geographic subdivision and
                           haplotype classification was observed. Indeed, these star-like topologies, i.e., a few dominant haplotypes sur-
                           rounded by less frequent mutations (Fig. 2, S2, Table S1), have often been reported in Eurasian birds11–13.
                               In order to calculate their evolutionary divergence, we firstly estimated the substitutions per site for all the
                           mitochondrial markers of 38 breeding Northern Wheatears. In general, RNA genes were more conservative,
                           resulting in low substitution rates. Among the 13 PCGs, ND2, the most commonly used genetic marker showed
                           the highest substitute rate, followed by ND5, ND6 and Cytb (Fig. S1). On the contrary, other frequently-used bar-
                           coding genes (16S rRNA and COX1), exhibited low levels of divergence among the Northern Wheatear popula-
                           tions (Fig. S1). In a next step, we compared the tree topologies of single molecular markers with the phylogenetic
                           tree based on the concatenated set of all mitochondrial markers. We found that all the individual markers could
                           differentiate between O. oenanthe and its sister species O. isabellina, but at the subspecies or population levels,
                           the use of single or a few concatenated markers yielded contradictory subdivisions and shallow trees (Fig. 3,
                           S3). Figure 3 shows inconsistent tree topologies generated from each of four frequently used markers in avian
                           phylogeny studies (16S rRNA, COX1, Cytb and ND2). 16S rRNA and COX1 had reduced substitution rates when
                           compared to ND2 and Cytb, but exhibited high congruence with the concatenated set of markers and separated
                           the two main haplotype clusters.
                               For phylogenetic analysis, we followed the most common of the traditional approaches by concatenating two
                           marker genes per analysis, namely ND2 | Cytb and 16S rRNA | COX1. The phylogenetic tree obtained from con-
                           catenated ND2 | Cytb was in agreement with the mitogenome results (Fig. S4, Fig. 3, Fig. S3). Furthermore, this
                           combination was much more superior in terms of resolution power, when compared to the tree reconstruc-
                           tions based on the single markers. On the other hand, concatenated 16S rRNA | COX1 was not superior to the
                           individual markers 16S rRNA and COX1, respectively, in terms of resolution (Fig. S4, Fig. 3, Fig. S3). Since our
                           analysis clearly indicated conflicting phylogeographies based on the use of different single or a few concatenated

Scientific Reports |   (2020) 10:9290 | https://doi.org/10.1038/s41598-020-66287-0                                                           3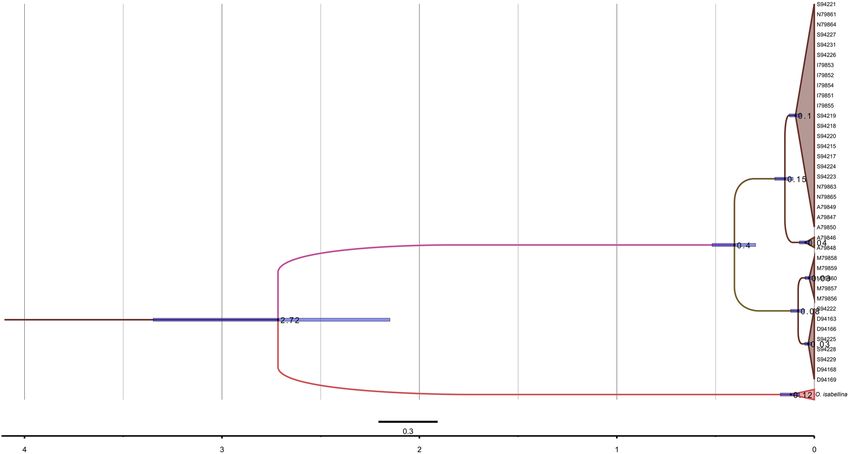
www.nature.com/scientificreports/                                                                 www.nature.com/scientificreports

                                                                                              Anti-   Start   Stop
                            Product             Start   End           Size   Strand   Name    code    codon   codon
                            tRNA-Phe            1       68            68     +        trnF    GAA
                            12S ribosomal RNA   69      1048          980    +        rrnS    −       AAA     TAC
                            tRNA-Val            1049    1118          70     +        trnV    TAC
                            16S ribosomal RNA   1119    2715          1597   +        rrnL    −       TGC     CCC
                            tRNA-Leu            2716    2790          75     +        trnL2   TAA
                            ND1                 2796    3773          978    +        nad1    −       ATG     AGA
                            tRNA-Ile            3794    3865          72     +        trnI    GAT
                            tRNA-Gln            3871    3941          71     −        trnQ    TTG
                            tRNA-Met            3941    4009          69     +        trnM    CAT
                            ND2                 4010    5049          1040   +        nad2    −       ATG     TA(A)
                            tRNA-Trp            5050    5120          71     +        trnW    TCA
                            tRNA-Ala            5122    5190          69     −        trnA    TGC
                            tRNA-Asn            5195    5267          73     −        trnN    GTT
                            tRNA-Cys            5268    5334          67     −        trnC    GCA
                            tRNA-Tyr            5334    5404          71     −        trnY    GTA
                            COX1                5406    6956          1551   +        cox1    −       GTG     AGG
                            tRNA-Ser            6948    7022          75     −        trnS2   TGA
                            tRNA-Asp            7026    7094          69     +        trnD    GTC
                            COX2                7102    7785          684    +        cox2    −       ATG     TAA
                            tRNA-Lys            7787    7854          68     +        trnK    TTT
                            ATP8                7856    8023          168    +        atp8    −       ATG     TAA
                            ATP6                8014    8697          684    +        atp6    −       ATG     TAA
                            COX3                8703    9486          784    +        cox3    −       ATG     T
                            tRNA-Gly            9487    9555          69     +        trnG    TCC
                            ND3                 9556    9906          351    +        nad3    −       ATG     TAA
                            tRNA-Arg            9908    9977          70     +        trnR    TCG
                            ND4L                9979    10275         297    +        nad4l   −       ATG     TAA
                            ND4                 10269   11646         1378   +        nad4    −       ATG     T
                            tRNA-His            11647   11717         71     +        trnH    TCG
                            tRNA-Ser            11718   11784         67     +        trnS1   GCT
                            tRNA-Leu            11784   11854         71     +        trnL1   TAG
                            ND5                 11855   13672         1818   +        nad5    −       ATG     AGA
                            CYTB                13681   14823         1143   +        cob     −       ATG     TAA
                            tRNA-Thr            14827   14895         69     +        trnT    TGT
                            tRNA-Pro            14902   14971         70     −        trnP    TGG
                            ND6                 14989   15507         519    −        nad6    −       ATG     TAG
                            tRNA-Glu            15509   15580         72     −        trnE    TTC
                            control region      15581   16824-16835          +        CR      −

                           Table 1. Annotation of assembled mitochondrial genome of Oenanthe oenanthe.

                           mitochondrial markers (Fig. 3, Fig. S3, Fig. S4), the significance of studies based on traditional approaches should
                           be critically re-examined as they might not mirror actual evolutionary processes. Complete mitogenomes how-
                           ever – as shown in this study – yield potentially enhanced phylogeographic resolution at species and population
                           levels35–37.
                              In this regard, it is important to mention that high transition-transversion ratios of avian mitochondrial DNA
                           result in a skewed base composition38. For this reason, model selection taking into account codon positions
                           greatly impacts efficiency and accuracy of mtDNA analyses39–41. Accordingly, the comparison of mitochondrial
                           gene trees based on partitioned and non-partitioned sequence data, respectively, (Fig. S4) confirmed that parti-
                           tion strategies can increase accuracy of phylogenetic predictions as well as statistical support42–44.

                           Can mitogenomes reveal the breeding origin of migrants captured at stop-over sites?                             Not
                           only for studying phylogenetics, phylogeography and population genetics, the mitochondrial markers have also
                           regarded as logbooks for migration studies. Different mitochondrial lineages can be distinguished by accumulating
                           mutations over time. Based on these mutations, individuals can be assigned to those lineages and their correspond-
                           ing commons ancestors45. The haplotype of a migrant bird might therefore theoretically predict its geographic
                           origin. In an ideal situation, populations with limited inter-lineage gene flow, contain conservative haplotypes or
                           closely related haplotypic groups corresponding to their geographic localities. The breeding area of migrants could
                           then be recognized by matching to the known breeding population haplotypes45. One of the purposes of this study

Scientific Reports |   (2020) 10:9290 | https://doi.org/10.1038/s41598-020-66287-0                                                           4
www.nature.com/scientificreports/ www.nature.com/scientificreports
Figure 2. Haplotype network for 38 individuals of Oenanthe. Size of the circles represent the frequency of
haplotypes. The breeding areas are coded by the colors. Each dot indicates one mutation step. Samples from
Morocco are Seebohmi Wheatears (Oenanthe seebohmi); samples from Iceland are Greenland Wheatears (O. o.
leucorhoa); samples from Alaska, Germany, Norway and Sweden are nominate wheatears (O. o. oenanthe). The
classification of (sub)species are identified by the morphological data.
is to test this scenario. We planned to predict the origins of migrating Northern Wheatears sampled on Helgoland
(Germany) and Crete (Greece) through comparing the haplotypes with those of breeding wheatears.
Given the present results, it was very unlikely that the origin of the migrant birds captured on the islands of
Helgoland and Crete could be determined, since even birds from different breeding populations could not reliably
be separated from each other. However, inadequate sampling46,47 could have contributed to the tree topology of
Fig. 3. In order to minimize these effects, we included the Helgoland and Crete birds. These individuals consisted
of 2 subspecies O. o. oenanthe and O. o. leucorhoa, that have been identified by morphology and whole genome
sequencing (data in preparation). In addition, sequences of the Southern Northern Wheatear (O. o. libanotica)21
obtained from GenBank were included in the analyses. However, the inclusion of additional data did not consid-
erably improve tree topology, and mitogenomic admixture among the subspecies was evident (Figs. 4, S5). This
holds true for both molecular classifications based on the single mitochondrial markers and the whole mitoge-
nomes. It was supported by high posterior probabilities implying gene flow among the 3 wheatear taxa (Fig. 3).
Moreover, since the breeding birds did not form clear clusters in the haplotype network, the origin of the migrants
could not be inferred using haplotype networks either (Fig. S6).
Hypotheses to resolve the conflict between phenotype and haplotype. In this study, we success-
fully detected the footprints of gene flow between ancient Northern Wheatear populations. Mitogenome data
identified two clades with about 1% sequence differences, corresponding to an estimate of divergence time of about
400,000 years ago (Figs. 3–5). However, the separation of lineages did not align with the phenotypic differences.
Northern Wheatears whose appearance was distinct, were genetically alike, and, vice versa. This finding stands in
sharp contrast to recent taxonomy considering the Seebohm’s Wheatear as a separate species.
The explanation might be that Northern Wheatears underwent speciation reversal upon secondary con-
tacts, causing recent introgression of mtDNA across (sub)species boundaries. Recent hybridizations between
ancient populations of Morocco and Europe introduced African genetic material into the mitogenome of nom-
inate Northern Wheatears. Due to selective sweep, these new haplotypes have become fixed in a few present
populations. This hypothesis is supported by the uniparental inheritance of mtDNA, which results in a lower
effective population size and correspondingly in high fixation rates of foreign mitogenomic lineages caused by
introgression48. This is in line with multimodal mismatch distributions and non-significant neutrality tests of the
3 taxa (Fig. S7). In addition, the paleoclimatological history corroborates the assumption of speciation reversal.
Past climates in the last 2 million years changed in 100,000-year cycles, with alternating warm and cold peri-
ods causing the northern hemisphere to repeatedly become inhospitable for most living species49–52. During the
glacial periods, large parts of North America, North and West Europe were covered by a thick layer of ice. Only
some ice-free Mediterranean areas served as refugia for survivors. For instance, Portugal and Spain, Italy, and the
Balkans were three potential refuges during the last glaciation53–55. Consequently, populations of different origins
regularly met and exchanged genetic material in the ice-free refugia. They could spread to different locations
Scientific Reports | (2020) 10:9290 | https://doi.org/10.1038/s41598-020-66287-0 5www.nature.com/scientificreports/ www.nature.com/scientificreports
Figure 3. MrBayes reconstruction of the Oenanthe oenanthe and it’s outgroup Oenanthe isabellina. Numbers
above nodes refer to the support values of Bayesian posterior probability. Sample name indicate the localities
by the capital letter, ‘A’ refers to Alaska; ‘D’ refers to Germany; ‘I’ refers to Iceland; ‘M’ refers to Morocco; ‘N’
refers to Norway and ‘S’ refers to Sweden. Samples from Morocco are black Seebohmi Wheatears (Oenanthe
seebohmi); samples from Iceland are Greenland Wheatears (O. o. leucorhoa); samples from Alaska, Germany,
Norway and Sweden are nominate wheatears (O. o. oenanthe).
when ice sheets receded, and suitable new vegetation zones appeared. The hypothesis of cyclical mitochondrial
introgression upon secondary contacts could explain that some ancestral mitochondrial polymorphisms are con-
served in multiple lineages of recent Northern Wheatear populations and subspecies, although nuclear gene flow
is limited (MS in preparation).
Inconsistencies between the mitogenome and morphology-based classifications are not a rare phenomenon.
A remarkable example is yellowhammers (Emberiza citrinella) and pine buntings (Emberiza leucocephalos); these
two species share similar mitochondrial haplotypes although they are morphologically divergent56. Similar pat-
terns of genetic and phenotypic discordance have also been reported in the other species57–60. In addition to
introgression, incomplete lineage sorting (ILS) can lead to non-monophyly and mito-nuclear incongruence,
when the species divergence has occurred recently61. Indeed, it is cumbersome to distinguish these two processes
because they generate similar genetic signatures62,63. Many recent studies have evaluated the high impact of ILS
on the coalescent analysis of reconstructing the speciation process61,64,65. However, we do not consider the ILS as
responsible for the unusual mtDNA divergence among these three (sub)species since only part of the nominate
populations (O. o. oenanthe) shared haplotypes with the Moroccan populations (O. seebohmi). Therefore, it is
more likely that introgressive hybridization (because of cyclic range expansions and reduction during warm and
cold periods) determined the haplotype patterns of Northern Wheatears.
Conclusion
Our study is the first one to describe the complete mitogenome of the Northern Wheatear and to reconstruct
phylogeographic relationships based on mitochondrial genomes using a large sample size. Our results based on
high-quality genetic data differ from the recent subspecies classification derived from morphological traits. The
subspecies O. o. oenanthe and O. o. leucorhoa and even O. seebohmi cannot be distinguished by mtDNA. This
might be the consequence of recent mitochondrial introgressive hybridizations between the taxa. High reso-
lution markers, such as genome-wide SNPs, should be used, as they could separate these 3 (sub)species (MS in
Scientific Reports | (2020) 10:9290 | https://doi.org/10.1038/s41598-020-66287-0 6www.nature.com/scientificreports/ www.nature.com/scientificreports
1 1
1
1 1
1
0.97 1
1 1
1
1
0.98 1
0.99 1 1
1
1
0.99 1
1
1 1
1 1
1
1
0.97 1
1 1
1
1
1
1
1
1
1
1
0.97 1
1
1
1
1
1
1
1
1 1
0.98 1
1
1 1
1
1
1
1
1
0.72 1
1
1
1
1
1
0.71 1
1 1
1
1
1
1
1
1
1
1
1
1
1
0.92 1
1
1 0.74 1 1
1 1
1 1
1
1 1
1 1
1
1
1
1
0.99 1 1
1
1
0.84 1
1
0.99 1
1 0.99 1
1
1
1 1 1
0.98 1
1 1
1
1
0.99 1
1
1 1
1
0.65 1
1
1
1
1
1
1 1
0.68 1
1
1
1
1
0.96 1
1
1
1
1 1
1 1
1
1 1
1 1 1
1
0.99 1
1
1
2.0
Figure 4. MrBayes reconstruction based on all the concatenated mitochondrial markers of 3 taxa of Oenanthe
and its outgroup. 38 breeding samples and 79 migrant samples (caught in Helgoland and Crete) were included.
Numbers above nodes refer to the support values of Bayesian posterior probability. Taxa identifications are color
coded based on the field data: outgroup (black), O. o. oenanthe (blue), O. o. leucorhoa (green) and O. seebohmi
(orange).
Figure 5. Phylogenetic relationships of O. o. oenanthe (blue), O. o. leucorhoa (green) O. seebohmi and O.
isabellina based on the mitogenome. The values indicate the split time calculated by BEAST 1.8. The Bayesian
posterior probabilities of all the nodes are 1. The blue bars show 95% highest posterior density (HPD) of
divergence times.
preparation). Although the mitogenome is not congruent with the morphological, ecological and nuclear classi-
fication of Northern Wheatears, it can still contribute to deciphering evolutionary processes. A big advantage of
mtDNA in phylogeography is its major contribution to detecting recent historical events, which might otherwise
have been overlooked if analyses are solely based on nuclear markers.
Scientific Reports | (2020) 10:9290 | https://doi.org/10.1038/s41598-020-66287-0 7www.nature.com/scientificreports/ www.nature.com/scientificreports
Materials and methods
Sample collection, DNA extraction and sequencing. In this study, we sampled 117 Northern
Wheatears (O. oenanthe) and Seebohm’s Wheatear (O. seebohmi), including samples from birds breeding in
Alaska (5), Iceland (5), Norway (4), Germany (4), Sweden (6 in Ammarnäs; 9 in Uppsala), Morocco (5) and sam-
ples of actively migrating birds from Greece (6 on Crete) and Germany (73 on Helgoland) (Table S2). As outgroup
we used O. isabellina66. All methods carried out in accordance with the relevant guidelines and regulations. In
Sweden, birds were captured and marked with permission from the Swedish Bird Ringing Centre. The sampling
for Uppsala was approved by the Uppsala animal ethics committee (permit no. C117/8), and for Ammarnäs by the
Umeå animal ethics committee M64–05 and M160–11). In Alaska, the sampling was under a license of the U.S.
Fish and Wildlife Service (Federal Fish and Wildlife Permits: MB207892-0, MB97904A-0) and the State of Alaska
Department of Fish and Game (Permits: 13–103, 14–009). In Germany, the sampling was under license of the
German Federal State of Lower Saxony (33.19-42502-04-16/2349) and Schleswig-Holstein (V 244-4829/2017 (33-
3/17)). The samples from Greece were provided from IPMB (Institute of Pharmacy and Molecular Biotechnology,
Heidelberg University, Germany). Total genomic DNA was extracted from the blood or tissue samples according
to the standard phenol-chloroform protocol67. DNA libraries were constructed according to the manufactur-
er’s instructions (Illumina) with 350 bp insertions. Whole genome sequencing was carried out on the Illumina
Novaseq. 6000 platform with a paired-end read length of 150 bp at Berry Genomics company (Beijing, China).
The average sequencing depth per individual was 15 folds. Adapter sequencing, low-quality reads were filtered to
obtain clean data. We further added sequences obtained from GenBank including more sampling localities (the
Netherland, Canada, Iran, Kazakhstan, Mongolia) for investigation (Table S3)21,68,69 6,7,9.
Mitochondrial sequence assembly and gene annotation. Complete mitogenomes were assembled
using the MITOBim 1.8 pipeline70, which relies on the baiting and iterative mapping strategy implemented in
MIRA471. BLASTn was used to determine the accuracy of the assembled mitogenomes by comparison with the
complete mitogenomes of the Collared Flycatcher (Ficedula albicollis) (NC_021621.1) and Isabelline Wheatear
(O. isabellina) (NC_040290.1). Protein coding genes, tRNAs and rRNAs were annotated by the MITOS
WebServer (http://mitos2.bioinf.uni-leipzig.de/index.py) and blasted against the NCBI database of mitochondrial
sequences. The PCG sequences were extracted and concatenated by custom python scripts. tRNA prediction was
further performed by tRNAscan-SE v1.3.172. Secondary structures of 16S and 12S RNA were derived using the
RNAfold WebServer (http://rna.tbi.univie.ac.at/cgi-bin/RNAWebSuite/RNAfold.cgi) with minimum free energy
(MFE) and partition function. Mitochondrial maps were generated by CGView73. As seen in the chicken Gallus
gallus32 and the outgroup O. isabellina66, the highly variable control regions (CR) of all investigated Oenanthe
spp. were located between the tRNA-Phe and tRNA-Glu. Since our mitogenome alignments were derived from
next-generation sequencing data, coverage became rapidly reduced in the CR. We therefore excluded the CR
from downstream phylogeographical analyses to avoid incomplete assemblies or ambiguous alignments.
Phylogenetic analysis. PCG sequences were aligned by MAFFT v7.03774. Neither indels nor interal stop
codons were detected in the alignments. SequenceMatrix v.1.7.875 was applied to concatenate the alignments for
different gene sets. PartitionFinder v.2.1.176 was applied to determine the best partition arrangement and optimal
substitution models of sequence evolution for downstream phylogenetic analyses. Four datasets were pre-defined
in the input configuration files (1) 13 PCGs, two rRNAs and combined 22 tRNAs with 15529 residues, (2) 13
PCGs with gene partition, (3) 13 PCGs with codon partition and (4) each single gene with or without partition.
The greedy algorithm with unlinked branch lengths estimation and Akaike information criterion with correction
(AICc) were used to search for appropriate partitions schemes77.
Phylogenetic trees were constructed based on the best-fit partition schemes suggested by PartitionFinder.
Bayesian inference (BI) analysis was applied by MrBayes version 3.2.278. The datasets were run with 2 simultane-
ous Markov Chain Monte Carlo (MCMC) runs on one cold and three heated chains to confirm the convergence
of posterior probability distributions79. Analyses were set to run for 10 million generations with sampling con-
ducted every 1,000 generations until stationarity was reached, i.e., average standard deviation of split frequencies
less than 0.01. The initial 25% of the total trees were discarded as burn-in. The speciation time was estimated
with the GTR substitution model implemented in BEAST 1.8.380–82. We tested a Yule speciation process with a
strict clock model (2.1% per million years for Cytb) and estimated the mutation rate for the remaining markers83.
All the analyses were performed in the CIPRES Science Gateway (http://www.phylo.org) and visualization was
achieved by FigTree version 1.4.1 (http://beast.bio.ed.ac.uk/FigTree). Population genetic analyses, neutrality tests
and mismatch distributions were calculated in ARLEQUIN version 3.5.1.384 and DnaSP version 5.185.
Received: 9 December 2019; Accepted: 15 May 2020;
Published: xx xx xxxx
References
1. Avise, J. C. et al. Intraspecific phylogeography: the mitochondrial DNA bridge between population genetics and systematics. Annu.
Rev. Ecol. Syst. 18, 489–522 (1987).
2. Avise, J. C. Phylogeography: the history and formation of species. (Harvard university press, 2000).
3. Zink, R. M., Pavlova, A., Drovetski, S. & Rohwer, S. Mitochondrial phylogeographies of five widespread Eurasian bird species. J.
Ornitol. 149, 399–413, https://doi.org/10.1007/s10336-008-0276-z (2008).
4. Lavrov, D. V. & Pett, W. Animal mitochondrial DNA as we do not know it: mt-genome organization and evolution in nonbilaterian
lineages. Genome Biol. Evol. 8, 2896–2913, https://doi.org/10.1093/gbe/evw195 (2016).
5. Aliabadian, M., Kaboli, M., Nijman, V. & Vences, M. Molecular identification of birds: performance of distance-based DNA
barcoding in three genes to delimit parapatric species. PLoS One 4, e4119 (2009).
6. Hebert, P. D., Stoeckle, M. Y., Zemlak, T. S. & Francis, C. M. Identification of birds through DNA barcodes. PLoS Biol. 2, e312 (2004).
Scientific Reports | (2020) 10:9290 | https://doi.org/10.1038/s41598-020-66287-0 8www.nature.com/scientificreports/ www.nature.com/scientificreports
7. Johnsen, A. et al. DNA barcoding of Scandinavian birds reveals divergent lineages in trans-Atlantic species. J. Ornitol. 151, 565–578
(2010).
8. Kerr, K. C. et al. Comprehensive DNA barcode coverage of North American birds. Mol. Ecol. notes 7, 535–543 (2007).
9. Kerr, K. C. et al. Filling the gap-COI barcode resolution in eastern Palearctic birds. Front. Zool. 6, 29 (2009).
10. Stoeckle, M. Y. & Thaler, D. S. DNA barcoding works in practice but not in (neutral) theory. PLoS One 9, e100755 (2014).
11. Wang, E., Van Wijk, R. E., Braun, M. S. & Wink, M. Gene flow and genetic drift contribute to high genetic diversity with low
phylogeographical structure in European hoopoes (Upupa epops). Mol. Phylogenet. Evol. 113, 113–125 (2017).
12. Carneiro de Melo Moura, C. et al. Pliocene origin,ice ages and postglacial population expansion have influenced a panmictic
phylogeography of the European Bee-Eater Merops apiaster. J. Divers. 11, 12 (2019).
13. Pârâu, L. G., Frias-Soler, R. C. & Wink, M. High Genetic Diversity among Breeding Red-Backed Shrikes Lanius collurio in the
Western Palearctic. Diversity 11, https://doi.org/10.3390/d11030031 (2019).
14. Rising, J. et al. Handbook of the Birds of the World Alive. (Lynx Edicions Barcelona, 2019).
15. Schmaljohann, H. et al. Proximate causes of avian protandry differ between subspecies with contrasting migration challenges. Behav.
Ecol. 27, 321–331 (2015).
16. Bairlein, F., Eikenaar, C. & Schmaljohann, H. Routes to genes: unravelling the control of avian migration—an integrated approach
using Northern Wheatear Oenanthe oenanthe as model organism. J. Ornitol. 156, 3–14, https://doi.org/10.1007/s10336-015-1224-3
(2015).
17. Bairlein, F. et al. Cross-hemisphere migration of a 25 g songbird. Biol. Lett., rsbl20111223 (2012).
18. Bairlein, F. Migratory birds under threat. Science 354, 547–548 (2016).
19. Kaboli, M., Aliabadian, M., Chamani, A., Pasquet, E. & Prodon, R. Morphological relationships of the Wheatears (genus Oenanthe).
Russ. J. Ecol. 44, 251–259, https://doi.org/10.1134/s1067413613030168 (2013).
20. Svensson, L. Identification guide to European passerines. (L. Svensson, 1992).
21. Aliabadian, M., Kaboli, M., Prodon, R., Nijman, V. & Vences, M. Phylogeny of Palaearctic wheatears (genus Oenanthe)–congruence
between morphometric and molecular data. Mol. Phylogenet. Evol. 42, 665–675, https://doi.org/10.1016/j.ympev.2006.08.018
(2007).
22. Kaboli, M., Aliabadian, M., Guillaumet, A., Roselaar, C. S. & Prodon, R. Ecomorphology of the wheatears (genus Oenanthe). Ibis
149, 792–805 (2007).
23. Förschler, M. I., Khoury, F., Bairlein, F. & Aliabadian, M. Phylogeny of the mourning wheatear Oenanthe lugens complex. Mol.
Phylogenet. Evol. 56, 758–767, https://doi.org/10.1016/j.ympev.2010.03.022 (2010).
24. Outlaw, R. K., Voelker, G. & Bowie, R. C. Shall we chat? Evolutionary relationships in the genus Cercomela (Muscicapidae) and its
relation to Oenanthe reveals extensive polyphyly among chats distributed in Africa, India and the Palearctic. Mol. Phylogenet. Evol.
55, 284–292, https://doi.org/10.1016/j.ympev.2009.09.023 (2010).
25. Alaei Kakhki, N. et al. Phylogeography of the Oenanthe hispanica-pleschanka-cypriaca complex (Aves, Muscicapidae: Saxicolinae):
Diversification history of open-habitat specialists based on climate niche models, genetic data, and morphometric data. J. Zool. Sys.
Evol. Res. 56, 408–427, https://doi.org/10.1111/jzs.12206 (2018).
26. Schweizer, M. & Shirihai, H. Phylogeny of the Oenanthe lugens complex (Aves, Muscicapidae: Saxicolinae): paraphyly of a
morphologically cohesive group within a recent radiation of open-habitat chats. Mol. Phylogenet. Evol. 69, 450–461, https://doi.
org/10.1016/j.ympev.2013.08.010 (2013).
27. Panov, E. N. Comparative ethology and molecular genetics as tools for phylogenetic reconstructions: The example of the genus.
Oenanthe. Biol. Bull. 38, 809–820, https://doi.org/10.1134/s106235901108005x (2011).
28. Schweizer, M. et al. Parallel plumage colour evolution and introgressive hybridization in wheatears. J. Evol. Biol. 32, 100–110 (2019).
29. Arizaga, J., Schmaljohann, H. & Bairlein, F. Stopover behaviour and dominance: a case study of the Northern Wheatear Oenanthe
oenanthe. Ardea 99, 157–165 (2011).
30. Corman, A.-M., Bairlein, F. & Schmaljohann, H. The nature of the migration route shapes physiological traits and aerodynamic
properties in a migratory songbird. Behav. Ecol. Sociobiol. 68, 391–402 (2014).
31. Hobson, K. A. & Wassenaar, L. I. Tracking animal migration with stable isotopes. (Academic Press, 2018).
32. Desjardins, P. & Morais, R. Sequence and gene organization of the chicken mitochondrial genome: a novel gene order in higher
vertebrates. J. Mol. Biol. 212, 599–634 (1990).
33. Jühling, F. et al. tRNAdb 2009: compilation of tRNA sequences and tRNA genes. Nucleic Acids Res. 37, D159–D162 (2008).
34. Watanabe, Y., Suematsu, T. & Ohtsuki, T. Losing the stem-loop structure from metazoan mitochondrial tRNAs and co-evolution of
interacting factors. Front. Genet. 5, 109, https://doi.org/10.3389/fgene.2014.00109 (2014).
35. Gibb, G. C., Kardailsky, O., Kimball, R. T., Braun, E. L. & Penny, D. Mitochondrial genomes and avian phylogeny: complex characters
and resolvability without explosive radiations. Mol. Biol. Evol. 24, 269–280, https://doi.org/10.1093/molbev/msl158 (2007).
36. Allcock, A. L., Cooke, I. R. & Strugnell, J. M. What can the mitochondrial genome reveal about higher-level phylogeny of the
molluscan class Cephalopoda? Zool. J. Linn. Soc. 161, 573–586 (2011).
37. Cabrera, A. A. et al. Fin whale (Balaenoptera physalus) mitogenomics: A cautionary tale of defining sub-species from mitochondrial
sequence monophyly. Mol. Phylogenet. Evol. 135, 86–97, https://doi.org/10.1016/j.ympev.2019.02.003 (2019).
38. Kumar, S. Patterns of nucleotide substitution in mitochondrial protein coding genes of vertebrates. Genetics 143, 537–548 (1996).
39. Braun, E. L. & Kimball, R. T. Examining basal avian divergences with mitochondrial sequences: model complexity, taxon sampling,
and sequence length. Syst. Biol. 51, 614–625 (2002).
40. Duchêne, S., Archer, F. I., Vilstrup, J., Caballero, S. & Morin, P. A. Mitogenome phylogenetics: the impact of using single regions and
partitioning schemes on topology, substitution rate and divergence time estimation. PloS one 6, e27138 (2011).
41. Leavitt, J. R., Hiatt, K. D., Whiting, M. F. & Song, H. Searching for the optimal data partitioning strategy in mitochondrial
phylogenomics: a phylogeny of Acridoidea (Insecta: Orthoptera: Caelifera) as a case study. Mol. Phylogenet. Evol. 67, 494–508,
https://doi.org/10.1016/j.ympev.2013.02.019 (2013).
42. Wang, N., Hosner, P. A., Liang, B., Braun, E. L. & Kimball, R. T. Historical relationships of three enigmatic phasianid genera (Aves:
Galliformes) inferred using phylogenomic and mitogenomic data. Mol. Phylogenet. Evol. 109, 217–225, https://doi.org/10.1016/j.
ympev.2017.01.006 (2017).
43. Richards, E. J., Brown, J. M., Barley, A. J., Chong, R. A. & Thomson, R. C. Variation across mitochondrial gene trees provides
evidence for systematic error: How much gene tree variation is biological? Syst. Biol. 67, 847–860 (2018).
44. Kainer, D. & Lanfear, R. The effects of partitioning on phylogenetic inference. Mol. Biol. Evol. 32, 1611–1627 (2015).
45. Wink, M. Use of DNA markers to study bird migration. J. Ornitol. 147, 234–244, https://doi.org/10.1007/s10336-006-0065-5 (2006).
46. Cummings, M. P. & Meyer, A. Magic bullets and golden rules: data sampling in molecular phylogenetics. Zoology 108, 329–336
(2005).
47. Hillis, D. M. Inferring complex phytogenies. Nature 383, 130 (1996).
48. Sloan, D. B., Havird, J. C. & Sharbrough, J. The on-again, off-again relationship between mitochondrial genomes and species
boundaries. Mol. Ecol. 26, 2212–2236, https://doi.org/10.1111/mec.13959 (2017).
49. Wink, M. Bird migration “Out of Africa”: The evolution of bird migration. Der Falke - Journal für Vogelbeobachter 60, 26–30 (2014).
50. Hewitt, G. M. Some genetic consequences of ice ages, and their role in divergence and speciation. Biol. J. Linn. Soc. 58, 247–276
(1996).
51. Hewitt, G. The genetic legacy of the Quaternary ice ages. Nature 405, 907–913, https://doi.org/10.1038/35016000 (2000).
Scientific Reports | (2020) 10:9290 | https://doi.org/10.1038/s41598-020-66287-0 9www.nature.com/scientificreports/ www.nature.com/scientificreports
52. Finlayson, C. et al. Ecological transitions — But for whom? A perspective from the Pleistocene. Palaeogeogr. Palaeoclimatol.
Palaeoecol. 329-330, 1–9, https://doi.org/10.1016/j.palaeo.2011.04.002 (2012).
53. Frenzel, B. Atlas of paleoclimates and paleoenvironments of the Northern Hemisphere. (Geographical Research Institute, Hungarian
Academy of Sciences, Budapest, Gustav Fischer Verlag, Stuttgart Jena New York., 1992).
54. Lundqvist, J. & Saarnisto, M. Summary of project IGCP-253. Quat. Int. 28, 9–18 (1995).
55. Taberlet, P., Fumagalli, L., Wust-Saucy, A. G. & Cosson, J. F. Comparative phylogeography and postglacial colonization routes in
Europe. Mol. Ecol. 7, 453–464 (1998).
56. Irwin, D. E., Rubtsov, A. S. & Panov, E. N. Mitochondrial introgression and replacement between yellowhammers (Emberiza
citrinella) and pine buntings (Emberiza leucocephalos)(Aves: Passeriformes). Biol. J. Linn. Soc. 98, 422–438 (2009).
57. Semenov, G. A., Koblik, E. A., Red’kin, Y. A. & Badyaev, A. V. Extensive phenotypic diversification coexists with little genetic
divergence and a lack of population structure in the White Wagtail subspecies complex (Motacilla alba). J. Evol. Biol. 31, 1093–1108,
https://doi.org/10.1111/jeb.13305 (2018).
58. Johnsen, A., Kearns, A. M., Omland, K. E. & Anmarkrud, J. A. Sequencing of the complete mitochondrial genome of the common
raven Corvus corax (Aves: Corvidae) confirms mitogenome-wide deep lineages and a paraphyletic relationship with the Chihuahuan
raven C. cryptoleucus. PLoS One 12, e0187316, https://doi.org/10.1371/journal.pone.0187316 (2017).
59. Kearns, A. M. et al. Genomic evidence of speciation reversal in ravens. Nat. Commun. 9, https://doi.org/10.1038/s41467-018-
03294-w (2018).
60. Palacios, C. et al. Shallow genetic divergence and distinct phenotypic differences between two Andean hummingbirds: Speciation
with gene flow? The Auk 136, ukz046 (2019).
61. Wang, K. et al. Incomplete lineage sorting rather than hybridization explains the inconsistent phylogeny of the wisent. Commun.
Biol. 1, 169, https://doi.org/10.1038/s42003-018-0176-6 (2018).
62. Wang, W. et al. Past hybridization between two East Asian long-tailed tits (Aegithalos bonvaloti and A. fuliginosus). Front. Zool. 11,
40 (2014).
63. McKay, B. D. & Zink, R. M. The causes of mitochondrial DNA gene tree paraphyly in birds. Mol. Phylogenet. Evol. 54, 647–650
(2010).
64. Choleva, L. et al. Distinguishing between incomplete lineage sorting and genomic introgressions: complete fixation of allospecific
mitochondrial DNA in a sexually reproducing fish (Cobitis; Teleostei), despite clonal reproduction of hybrids. PLoS One 9, e80641,
https://doi.org/10.1371/journal.pone.0080641 (2014).
65. He, S. et al. An examination of introgression and incomplete lineage sorting among three closely related species of chocolate-dipped
damselfish (genus: Chromis). Ecol. Evol. 9, 5468–5478, https://doi.org/10.1002/ece3.5142 (2019).
66. Li, S., Luo, A., Li, G. & Li, W. Complete mitochondrial genome of the isabelline wheatear Oenanthe isabellina (Passeriformes,
Muscicapidae). Mitochondrial DNA Part B 1, 355–356, https://doi.org/10.1080/23802359.2016.1167641 (2016).
67. Sambrook, J., Fritsch, E. & Maniatis, T. Molecular cloning: A laboratory manual+ Cold Spring Harbor. (New York: Cold spring
harbor laboratory press, 1989).
68. van Oosten, H. H., Mueller, J. C., Ottenburghs, J., Both, C. & Kempenaers, B. Genetic structure among remnant populations of a
migratory passerine, the Northern Wheatear Oenanthe oenanthe. Ibis 158, 857–867 (2016).
69. Randler, C. et al. Phylogeography, pre-zygotic isolation and taxonomic status in the endemic Cyprus Wheatear Oenanthe cypriaca.
J. Ornitol. 153, 303–312 (2012).
70. Hahn, C., Bachmann, L. & Chevreux, B. Reconstructing mitochondrial genomes directly from genomic next-generation sequencing
reads—a baiting and iterative mapping approach. Nucleic. Acids. Res. 41, e129–e129 (2013).
71. Chevreux, B., Wetter, T. & Suhai, S. in German conference on bioinformatics. 45-56 (Citeseer).
72. Lowe, T. M. & Chan, P. P. tRNAscan-SE On-line: integrating search and context for analysis of transfer RNA genes. Nucleic Acids Res.
44, W54–57, https://doi.org/10.1093/nar/gkw413 (2016).
73. Stothard, P. & Wishart, D. S. Circular genome visualization and exploration using CGView. Bioinformatics 21, 537–539 (2004).
74. Katoh, K. & Standley, D. M. MAFFT multiple sequence alignment software version 7: improvements in performance and usability.
Mol. Biol. Evol. 30, 772–780 (2013).
75. Vaidya, G., Lohman, D. J. & Meier, R. J. C. SequenceMatrix: concatenation software for the fast assembly of multi‐gene datasets with
character set and codon information. Cladistics 27, 171–180 (2011).
76. Lanfear, R., Frandsen, P. B., Wright, A. M., Senfeld, T. & Calcott, B. PartitionFinder 2: new methods for selecting partitioned models
of evolution for molecular and morphological phylogenetic analyses. Mol. Biol. Evol. 34, 772–773 (2016).
77. Lanfear, R., Calcott, B., Ho, S. Y. & Guindon, S. PartitionFinder: combined selection of partitioning schemes and substitution models
for phylogenetic analyses. Mol. Biol. Evol. 29, 1695–1701 (2012).
78. Ronquist, F. et al. MrBayes 3.2: efficient Bayesian phylogenetic inference and model choice across a large model space. Syst. Biol. 61,
539–542 (2012).
79. Altekar, G., Dwarkadas, S., Huelsenbeck, J. P. & Ronquist, F. Parallel metropolis coupled Markov chain Monte Carlo for Bayesian
phylogenetic inference. Bioinformatics 20, 407–415 (2004).
80. Drummond, A. J. & Rambaut, A. BEAST: Bayesian evolutionary analysis by sampling trees. BMC Evol. Biol. 7, 214 (2007).
81. Suchard, M. A. & Rambaut, A. Many-core algorithms for statistical phylogenetics. Bioinformatics 25, 1370–1376 (2009).
82. Lanave, C., Preparata, G., Sacone, C. & Serio, G. A new method for calculating evolutionary substitution rates. J. Mol. Evol. 20, 86–93
(1984).
83. Weir, J. T. & Schluter, D. Calibrating the avian molecular clock. Mol. Ecol. 17, 2321–2328, https://doi.org/10.1111/j.1365-
294X.2008.03742.x (2008).
84. Excoffier, L. & Lischer, H. E. Arlequin suite ver 3.5: a new series of programs to perform population genetics analyses under Linux
and Windows. Mol. Biol. Resour. 10, 564–567 (2010).
85. Librado, P. & Rozas, J. DnaSP v5: a software for comprehensive analysis of DNA polymorphism data. Bioinformatics 25, 1451–1452
(2009).
Acknowledgements
The authors are indebted to Hedwig Sauer-Gürth and Heidi Staudter for lab work support. The authors received
financial support from the Deutsche Forschungsgemeinschaft (SCHM 2647/2-1), the Swedish Research Council
VR, the County Administrative Board of Västerbotten (LUVRE project) and Ruprecht-Karls-Universität
Heidelberg within the funding program Open Access Publishing.
Author contributions
E.W. and M.W. designed with input from D.Z. and M.S.B. the study; D.Z., M.S.B. and F.L. improved the methods
for analyses. F.B., H.S., D.A., T.P. and F.L. collected samples; A.H.W. provided infrastructure for bioinformatics
analyses. F.B and H.S offered field data. E.W. conducted analyses and wrote the manuscript. M.S.B. and M.W.
improved the manuscript. All authors reviewed the manuscript.
Scientific Reports | (2020) 10:9290 | https://doi.org/10.1038/s41598-020-66287-0 10www.nature.com/scientificreports/ www.nature.com/scientificreports
Competing interests
The authors declare no competing interests.
Additional information
Supplementary information is available for this paper at https://doi.org/10.1038/s41598-020-66287-0.
Correspondence and requests for materials should be addressed to E.W. or M.W.
Reprints and permissions information is available at www.nature.com/reprints.
Publisher’s note Springer Nature remains neutral with regard to jurisdictional claims in published maps and
institutional affiliations.
Open Access This article is licensed under a Creative Commons Attribution 4.0 International
License, which permits use, sharing, adaptation, distribution and reproduction in any medium or
format, as long as you give appropriate credit to the original author(s) and the source, provide a link to the Cre-
ative Commons license, and indicate if changes were made. The images or other third party material in this
article are included in the article’s Creative Commons license, unless indicated otherwise in a credit line to the
material. If material is not included in the article’s Creative Commons license and your intended use is not per-
mitted by statutory regulation or exceeds the permitted use, you will need to obtain permission directly from the
copyright holder. To view a copy of this license, visit http://creativecommons.org/licenses/by/4.0/.
© The Author(s) 2020
Scientific Reports | (2020) 10:9290 | https://doi.org/10.1038/s41598-020-66287-0 11You can also read