Recent acceleration of Denman Glacier (1972-2017), East Antarctica, driven by grounding line retreat and changes in ice tongue configuration - Caltech
←
→
Page content transcription
If your browser does not render page correctly, please read the page content below
The Cryosphere, 15, 663–676, 2021
https://doi.org/10.5194/tc-15-663-2021
© Author(s) 2021. This work is distributed under
the Creative Commons Attribution 4.0 License.

Recent acceleration of Denman Glacier (1972–2017), East
Antarctica, driven by grounding line retreat and changes in ice
tongue configuration
Bertie W. J. Miles1 , Jim R. Jordan2 , Chris R. Stokes1 , Stewart S. R. Jamieson1 , G. Hilmar Gudmundsson2 , and
Adrian Jenkins2
1 Department   of Geography, Durham University, Durham, DH1 3LE, UK
2 Department   of Geography and Environmental Sciences, Northumbria University, Newcastle upon Tyne, NE1 8ST, UK

Correspondence: Bertie W. J. Miles (a.w.j.miles@durham.ac.uk)

Received: 16 June 2020 – Discussion started: 6 July 2020
Revised: 9 November 2020 – Accepted: 10 December 2020 – Published: 11 February 2021

Abstract. After Totten, Denman Glacier is the largest con-         1   Introduction
tributor to sea level rise in East Antarctica. Denman’s catch-
ment contains an ice volume equivalent to 1.5 m of global sea      Over the past 2 decades, outlet glaciers along the coast-
level and sits in the Aurora Subglacial Basin (ASB). Geolog-       line of Wilkes Land, East Antarctica, have been thinning
ical evidence of this basin’s sensitivity to past warm periods,    (Pritchard et al., 2009; Flament and Remy, 2012; Helm et
combined with recent observations showing that Denman’s            al., 2014; Schröder et al., 2019), losing mass (King et al.,
ice speed is accelerating and its grounding line is retreating     2012; Gardner et al., 2018; Shen et al., 2018; Rignot et al.,
along a retrograde slope, has raised the prospect that its con-    2019) and retreating (Miles et al., 2013, 2016). This has
tributions to sea level rise could accelerate. In this study, we   raised concerns about the future stability of some major out-
produce the first long-term (∼ 50 years) record of past glacier    let glaciers along the Wilkes Land coastline that drain the Au-
behaviour (ice flow speed, ice tongue structure and calving)       rora Subglacial Basin (ASB), particularly Totten, Denman,
and combine these observations with numerical modelling            Moscow University and Vanderford glaciers. This is because
to explore the likely drivers of its recent change. We find        their present-day grounding lines are close to deep retrograde
a spatially widespread acceleration of the Denman system           slopes (Morlighem et al., 2020), meaning there is clear poten-
since the 1970s across both its grounded (17 ± 4 % accel-          tial for marine ice sheet instability and future rapid mass loss
eration; 1972–2017) and floating portions (36 ± 5 % accel-         (Weertman, 1974; Schoof, 2007) unless ice shelves provide a
eration; 1972–2017). Our numerical modelling experiments           sufficient buttressing effect (Gudmundsson, 2013). Geologi-
show that a combination of grounding line retreat, ice tongue      cal evidence suggests that there may have been substantial
thinning and the unpinning of Denman’s ice tongue from a           retreat of the ice margin in the ASB during the warm inter-
pinning point following its last major calving event are re-       glacials of the Pliocene (Williams et al., 2010; Young et al.,
quired to simulate an acceleration comparable with observa-        2011; Aitken et al., 2016; Scherer et al., 2016), which poten-
tions. Given its bed topography and the geological evidence        tially resulted in global mean sea level contributions of up
that Denman Glacier has retreated substantially in the past,       to 2 m from the ASB (Aitken et al., 2016). This is important
its recent grounding line retreat and ice flow acceleration sug-   because these warm periods of the Pliocene may represent
gest that it could be poised to make a significant contribution    our best analogue for climate by the middle of this century
to sea level in the near future.                                   under unmitigated emission trajectories (Burke et al., 2018).
                                                                   Indeed, numerical models now predict future sea level con-
                                                                   tributions from the outlet glaciers which drain the ASB over
                                                                   the coming decades to centuries (Golledge et al., 2015; Ritz
                                                                   et al., 2015; DeConto and Pollard, 2016), but large uncertain-

Published by Copernicus Publications on behalf of the European Geosciences Union.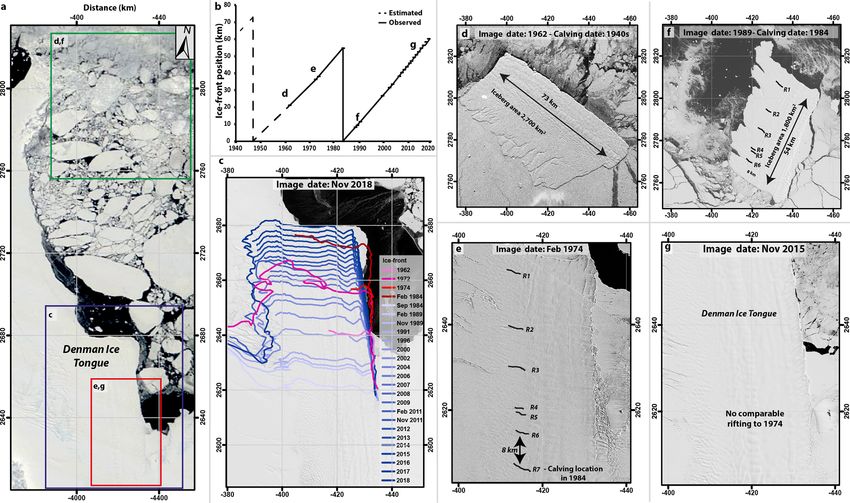
664                                                 B. W. J. Miles et al.: Recent acceleration of Denman Glacier (1972–2017)

ties exist over the magnitude and rates of any future sea level     that a major calving event took place shortly before the image
contributions.                                                      was acquired (Fig. S1 in the Supplement).
   At present, most studies in Wilkes Land have focused on
Totten Glacier, which is losing mass (Li et al., 2016; Mo-          2.2   Velocity
hajerani et al., 2019) in association with grounding line re-
treat (Li et al., 2015). This has been attributed to wind-forced    Maps of glacier velocity between 1972 and 2002 were
warm Modified Circumpolar Deep Water accessing the cav-             created using the COSI-Corr (CO-registration of Optically
ity below Totten Ice Shelf (Greenbaum et al., 2015; Rintoul         Sensed Images and Correlation) feature-tracking software
et al., 2016; Greene et al., 2017). However, given our most         (Leprince et al., 2007; Scherler et al., 2008). This requires
recent understanding of bedrock topography in Wilkes Land,          pairs of cloud-free images containing surface features that
Denman Glacier (Fig. 1) provides the most direct pathway to         can be identified in both images. We found three suitable
the deep interior of the ASB (Gasson et al., 2015; Brancato et      image pairs from the older satellite data: November 1972–
al., 2020; Morlighem et al., 2020). Moreover, a recent mass         February 1974, February 1989–November 1989 and Novem-
balance estimate (Rignot et al., 2019) has shown that between       ber 2001–December 2002. We used a window size of 128 ×
1979 and 2017 Denman Glacier’s catchment may have lost              128 pixels, before projecting velocities onto a WGS 84 grid
an amount of ice (190 Gt) broadly comparable with Totten            at a pixel spacing of 1 km.
Glacier (236 Gt). There have also been several reports of in-          To reduce noise, we removed all pixels for which ice speed
land thinning of Denman’s fast-flowing trunk (Flament and           was greater than ±50 % of the MEaSUREs ice velocity prod-
Remy, 2012; Helm et al., 2014; Young et al., 2015; Schröder         uct (Rignot et al., 2011b) and all pixels for which veloc-
et al., 2019), and its grounding line has retreated over the past   ity was < 250 m yr−1 . Errors are estimated as the sum of
20 years (Brancato et al., 2020). However, unlike Totten and        the co-registration error (estimated at 1 pixel) and the error
other large glaciers which drain marine basins in Antarctica,       in surface displacement (estimated at 0.5 pixels), which is
there has been no detailed study analysing any changes in its       quantified by comparing computed velocity values to esti-
calving cycle, velocity or ice tongue structure. This study re-     mates derived from the manual tracking of rifts in the histor-
ports on remotely sensed observations of ice front position         ical imagery (Fig. S2). This resulted in total errors ranging
and velocity change from 1962 to 2018 and then brings these         from 20 to 73 m yr−1 . Annual estimates of ice speed between
observations together with numerical modelling to explore           2005–2006 and 2016–2017 were taken from the annual MEa-
the possible drivers of Denman’s long-term behaviour. The           SUREs mosaics (Mouginot et al., 2017a). These products are
following section outlines the methods (Sect. 2) used to gen-       available at a 1 km spatial resolution and are created from the
erate the remote sensing observations (Sect. 3), and we then        stacking of multiple velocity fields from a variety of sensors
outline the numerical modelling experiments (Sect. 4) that          between July and June in the following year. To produce the
were motivated by these observations, followed by the dis-          ice speed time series, we extracted the mean value of all pix-
cussion (Sect. 5) and conclusion (Sect. 6).                         els within a defined box 10 km behind Denman’s grounding
                                                                    line (see Fig. 3). To eliminate any potential bias from miss-
                                                                    ing pixels, we placed boxes in locations where all pixels were
2     Methods                                                       present at each time step.
                                                                       We also estimated changes in the rate of ice front advance
2.1    Ice front and calving cycle reconstruction                   between 1962 and 2018. This is possible because inspection
                                                                    of the imagery reveals that there has been only one major
We use a combination of imagery from the ARGON                      calving event at Denman during this time period as the shape
(1962), Landsat-1 (1972–1974), Landsat-4–5 (1989–1991),             of its ice front remained largely unchanged throughout the
RADARSAT (1997) and Landsat-7–8 (2000–2018) satellites              observation period. Similar methods have been used else-
to create a time series of ice front position change from           where on ice shelves which have stable ice fronts, e.g. Cook
1962–2018. Suitable cloud-free Landsat imagery was first            East Ice Shelf (Miles et al., 2018). This has the benefit of
selected using the Google Earth Engine Digitisation Tool            acting as an independent cross-check on velocities close to
(Lea, 2018). Changes in ice front position were calculated          the front of the ice tongue that were derived from feature
using the box method, which uses an open-ended poly-                tracking. The ice front advance rate was calculated by divid-
gon to take into account any uneven changes along the ice           ing ice front position change by the number of days between
front (Moon and Joughin, 2008). To supplement the large             image pairs. Previous studies (e.g. Miles et al., 2013, 2016;
gap in the satellite archive between 1974 and 1989 we use           Lovell et al., 2017) have demonstrated that the errors asso-
the RESURS KATE-200 space-acquired photography from                 ciated with the manual mapping of ice fronts from satellites
September 1984. This imagery is hosted by the Australian            with a moderate spatial resolution (10–250 m) are typically
Antarctic Data Centre, and whilst we could not access the           1.5 pixels, with co-registration error accounting for 1 pixel
full resolution image, the preview image was sufficient to de-      and mapping error accounting for 0.5 pixels. This results in
termine the approximate location of the ice front and confirm       ice front advance rate errors ranging from 6 to 73 m yr−1 .

The Cryosphere, 15, 663–676, 2021                                                       https://doi.org/10.5194/tc-15-663-2021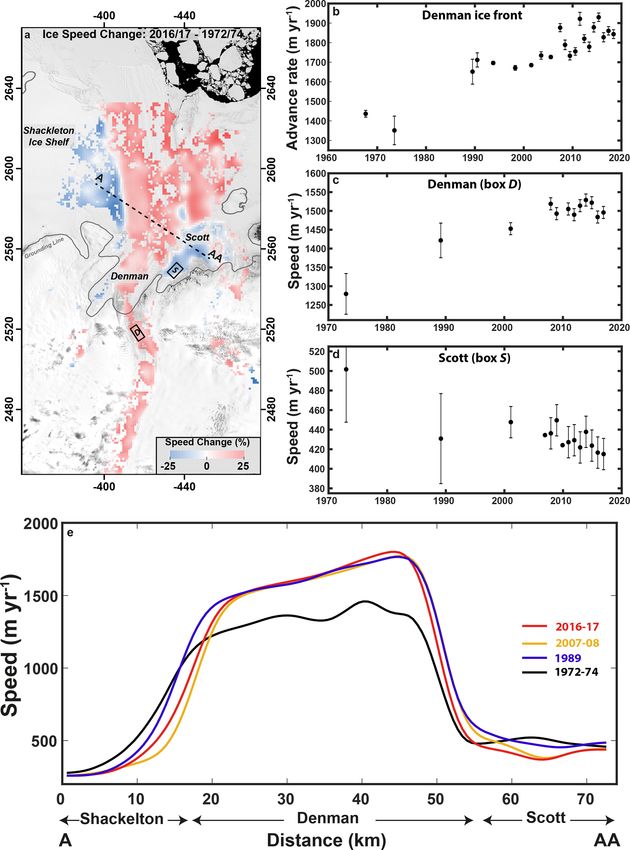
B. W. J. Miles et al.: Recent acceleration of Denman Glacier (1972–2017)                                                               665

Figure 1. Reference Elevation Model of Antarctica (REMA) mosaic (Howat et al., 2019) of the Denman Glacier and Shackleton Ice Shelf;
note the numerous pinning points on the Shackleton Ice Shelf. The MEaSUREs velocity product is overlain (Rignot et al., 2011b), and the
grounding line product is from Depoorter et al. (2013). The hatched blue lines represent regions where bedrock elevation is below sea level;
note how Denman Glacier drains the Aurora Subglacial Basin. A profile of bedrock elevation from BedMachine (Morlighem et al., 2020)
along the transect A0 –AA0 is located on the bottom left of the figure. Note the reverse bed slope. The coordinates are polar stereographic
(km).

The general pattern of ice front advance rates through time is          was approximately 6 km further advanced than its estimated
in close agreement with feature-tracking-derived changes in             calving front position immediately prior to the major calv-
velocity over the same time period.                                     ing event in 1984 (Fig. 2b, c). However, given the absence of
                                                                        any significant rifting or structural damage, a calving event in
                                                                        the next few years is unlikely. This suggests the next calving
3     Results                                                           event at Denman will take place from a substantially more
                                                                        advanced position (> 10 km) than its last observed event in
3.1    Ice tongue calving cycles and structure                          1984.
                                                                           Following the production of the large tabular iceberg from
Throughout our observational record (1962–2018) Denman
                                                                        Denman Glacier in 1984, it drifted ∼ 60 km northwards be-
Glacier underwent only one major calving event in 1984,
                                                                        fore grounding on the sea floor (Fig. 2f) and remained nearly
which resulted in the formation of a large 54 km long
                                                                        stationary for 20 years before breaking up and dispersing in
(1800 km2 ) tabular iceberg (Fig. 2). Since this calving event
                                                                        2004. Historical observations of sporadic appearances of a
in 1984 the ice front has re-advanced 60 km and there have
                                                                        large tabular iceberg in this location in 1840 (Cassin and
been no further major calving events (Fig. 2b, c), as indi-
                                                                        Wilkes, 1858) and 1914 (Mawson, 1915), but not in 1931
cated by minimal changes to the geometry of its 35 km wide
                                                                        (Mawson, 1932), suggest that these low-frequency, high-
ice front. As of November 2018, Denman Glacier’s ice front

https://doi.org/10.5194/tc-15-663-2021                                                            The Cryosphere, 15, 663–676, 2021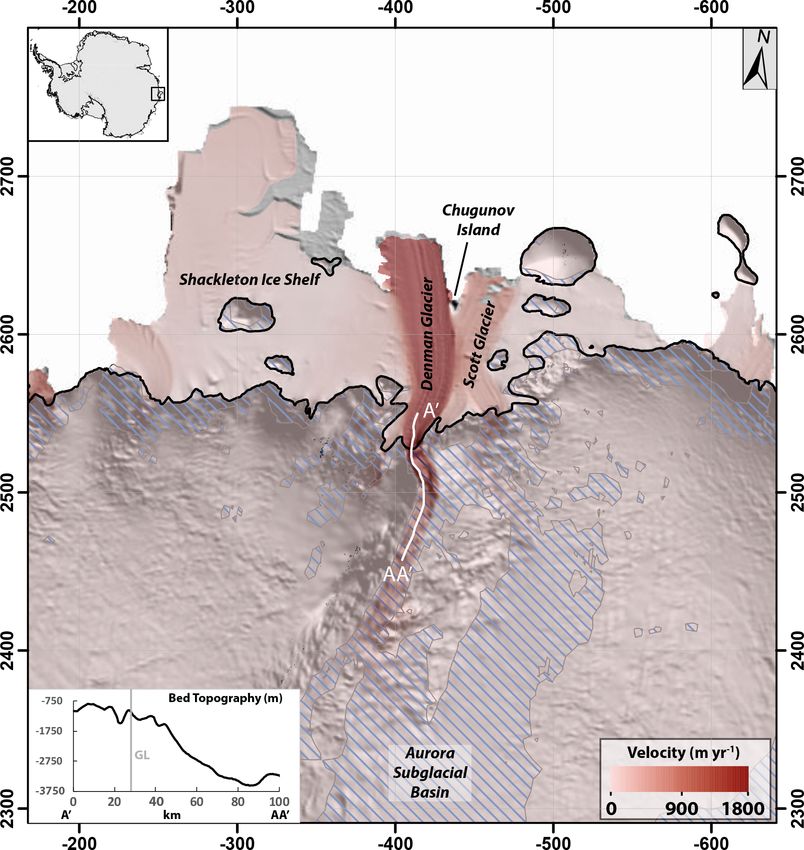
666                                                   B. W. J. Miles et al.: Recent acceleration of Denman Glacier (1972–2017)

Figure 2. (a) MODIS image from Worldview of the Denman ice tongue in November 2018, with the coloured boxes indicating the locations
of panels (c)–(g). (b) Reconstructed calving cycle of Denman Glacier 1940–2018. (c) Examples of ice front mapping 1962–2018. Note the
change in the angle of the ice shelf between its present (light blue–dark blue lines) and previous (pink–red lines) calving cycle. (d) ARGON
image of a large tabular iceberg in 1962, which likely calved from Denman at some point in the 1940s. (e) Landsat-1 image of the Denman
ice tongue in 1972; note the pattern of rifting, which is digitized in black for increased visibility and labelled R1–R7. (f) Landsat-4 image
of a large tabular iceberg which calved from Denman in 1984. Note the rifting pattern and the absence of R7, meaning R7 likely propagated
during its calving event in 1984. (g) Landsat-8 image of the Denman ice tongue in 2015. Note the absence of rifting. All Landsat images in
this figure have been made available courtesy of the U.S. Geological Survey.

magnitude calving events are typical of the long-term be-                section of the ice tongue, before being advected down-flow.
haviour of Denman Glacier. In 1962, our observations indi-               But a more detailed analysis of how the rifts form is not pos-
cate a similar large tabular iceberg was present at the same             sible because of the limited availability of satellite imagery
location (Fig. 2d), and, through extrapolation of the ice front          in the 1970s and 1980s. An analysis of the rifting pattern in
advance rate between 1962 and 1974 (Fig. 2b), we estimate                1974 and the iceberg formed in 1984 indicates that the ice-
that this iceberg was produced at some point in the mid-                 berg calved from R7 (Fig. 2e, f). In contrast, on the grounded
1940s. However, the iceberg observed in 1962 (∼ 2700 km2 )               iceberg observed in 1962 (Fig. 2d), which likely calved in the
was approximately 50 % larger in area than the iceberg pro-              1940s, and in the present-day calving cycle (1984–present;
duced in 1984 (∼ 1700 km2 ) and 35 % longer (73 km versus                Fig. 2g), similar rifting patterns are not observed.
54 km). Thus, whilst Denman’s next calving event will take
place from a substantially more advanced position than it did            3.2   Ice speed
in 1984, it may not be unusual in the context of the longer-
term behaviour of Denman Glacier (Fig. 2b).                              We observed widespread increases in ice speed across the
   There are clear differences in the structure of Denman                entire Denman system between 1972–1974 and 2016–2017,
Glacier between successive calving cycles. In all available              with an overall acceleration of 19 ± 5 % up to 50 km inland
satellite imagery between the 1940s and the calving event                of the grounding line along the main trunk of the glacier
in 1984 (e.g. 1962, 1972 and 1974) an increasing number                  (Fig. 3a). Specifically, at box D, 10 km inland of the ground-
of rifts (labelled R1 to R7) were observed on its ice tongue             ing line, ice flow speed increased by 17±4 % between 1972–
throughout this time (Fig. 2e, f). The rifts periodically form           1974 and 2016–2017 (Fig. 3c). The largest rates of accel-
∼ 10 km inland of Chugunov Island (Fig. 2e), on the western              eration at box D took place between 1972–1974 and 1989
                                                                         when there was a speed-up of 11 ± 5 %. Between 1989 and

The Cryosphere, 15, 663–676, 2021                                                              https://doi.org/10.5194/tc-15-663-2021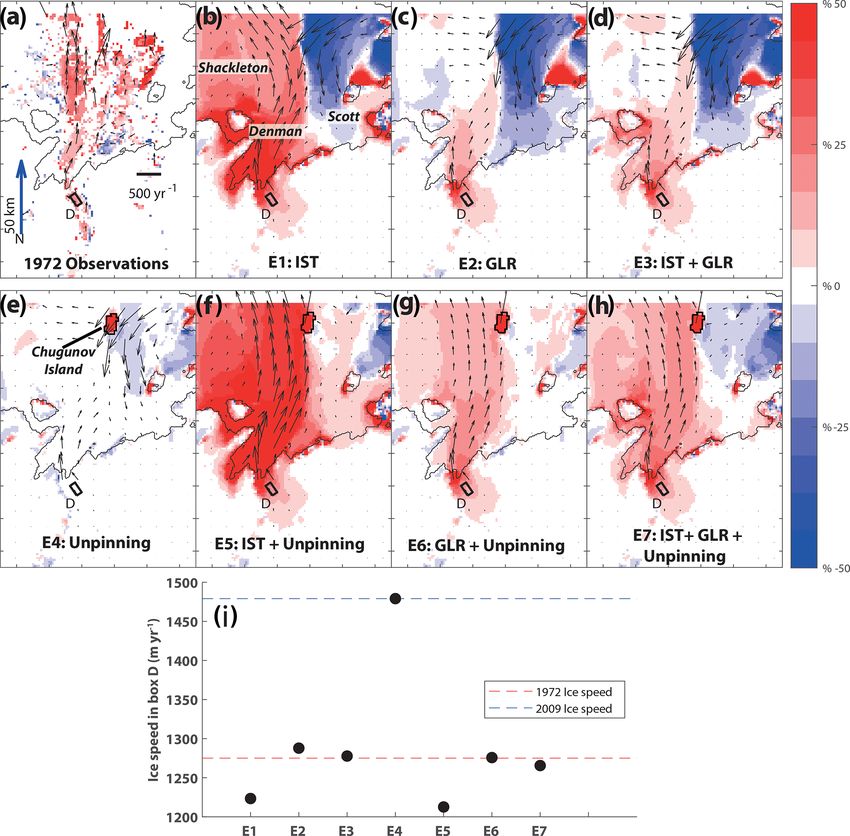
B. W. J. Miles et al.: Recent acceleration of Denman Glacier (1972–2017)                                                                667

Figure 3. (a) Percentage difference in ice speed between 2016–2017 and 1972–1974 overlain on a Landsat-8 image from November 2017
provided by the U.S. Geological Survey. Red indicates a relative increase in 2016–2017 and blue a relative decrease in 2016–2017. The
grounding line is in grey (Depoorter et al., 2013). (b) Time series of the advance rate of the Denman ice front 1962–2018. (c) Time series of
mean ice speed from box D, 1972–2017, approximately 10 km behind the Denman grounding line. (d) Time series of mean ice speed from
box S on Scott Glacier, 1972–2017. (e) Ice speed profiles across the Shackleton–Denman–Scott system from 1972–1974, 1989, 2007–2008
and 2016–2017. Note the lateral migration of the shear margins.

https://doi.org/10.5194/tc-15-663-2021                                                             The Cryosphere, 15, 663–676, 2021
668 B. W. J. Miles et al.: Recent acceleration of Denman Glacier (1972–2017)
2016–2017 there was a comparatively slower acceleration of Table 1. Summary of the perturbations included in each of our seven
3±2 % (Fig. 3c). The advance rate of the ice front followed a numerical modelling experiments.
similar pattern but accelerated at a much greater rate. The ice
front advance rate increased by 26±5 % between 1972–1974 Experiment Ice shelf Grounding line Unpinning from
and 1989, whilst it increased at a slower rate between 1989 thinning retreat Chugunov Island
and 2018 (9 ± 1 %; Fig. 3b). At box S on the neighbouring E1 X
Scott Glacier, we observed a 17 ± 10 % decrease in velocity E2 X
between 1972–1974 and 2016–2017 (Fig. 3d). Similar de- E3 X X
creases in ice flow speed are also observed near the shear E4 X
margin between Shackleton Ice Shelf and Denman Glacier E5 X X
(Fig. 3a, e). The net result of an increase in velocity at Den- E6 X X
man Glacier and decreases in velocity on either side of the E7 X X X
Shackleton Ice Shelf and Scott Glacier is a steepening of the
velocity gradient at the shear margins (Fig. 3e). Ice speed
profiles across Denman Glacier also indicate lateral migra- where A is the rate factor with its corresponding stress factor
tion of the shear margins of ∼ 5 km in both the east and west n, h is the vertical ice thickness, G is a grounding–flotation
directions through time (Fig. 3e). mask (1 for grounded ice, 0 for floating ice), C is the basal
slipperiness with its corresponding stress exponent m, ρ is
3.3 Lateral migration of Denman’s ice tongue the density of ice and g is the acceleration due to gravity.
Previously, the model has been used to understand rates and
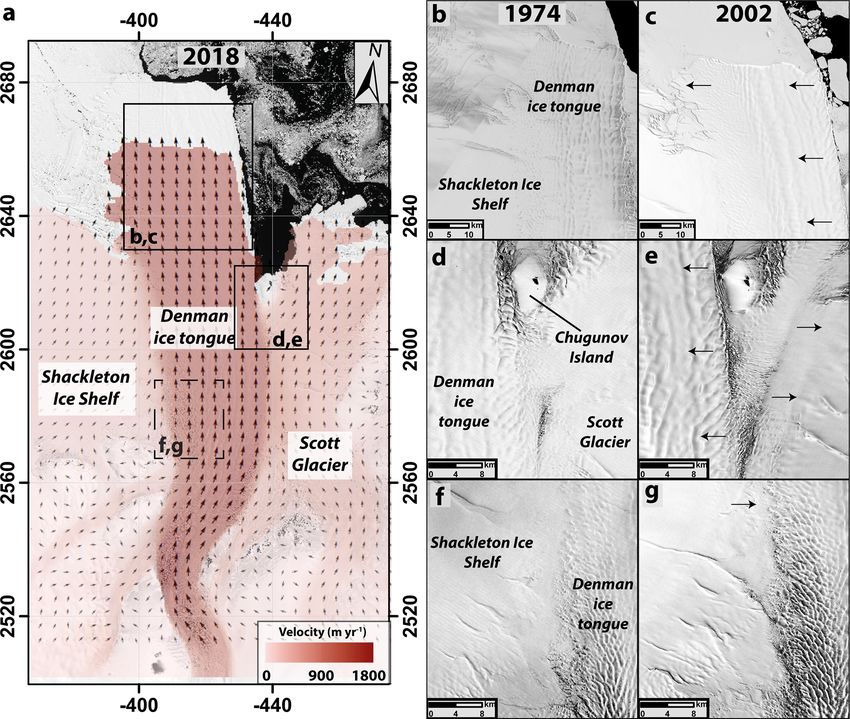
A comparison of satellite imagery between 1974 and 2002,
patterns of grounding line migration and glacier responses to
when Denman’s ice front was in a similar location (e.g.
ice shelf buttressing and ice shelf thickness (e.g. Reese et al.,
Fig. 4b, c), reveals a lateral migration of its ice tongue and
2018; Hill et al., 2018; Gudmundsson et al., 2019), and it has
a change in the characteristics of the shear margins. North of
been involved in several model intercomparison experiments
Chugunov Island, towards the ice front, we observe a bend-
(e.g. Pattyn et al., 2008, 2012; Leverman et al., 2020).
ing and westward migration of the ice tongue in 2002 com-
Modelled ice velocities are calculated on a finite-element
pared to its 1974 position (Fig. 4b, c). In 1974, the ice tongue
grid using a vertically integrated form of the momentum
was intensely shearing against Chugunov Island, as indicated
equations. The model domain consists of 93 371 elements
by the heavily damaged shear margins (Fig. 4d). However,
with horizontal dimensions ranging from 250 m near the
by 2002 the ice tongue made substantially less contact with
grounding line to 10 km further inland. Zero-flow conditions
Chugunov Island because this section of the ice tongue mi-
are applied along the inland boundaries, chosen to match
grated westwards (Fig. 4d, e). South of Chugunov Island
zero-flow contours from observations. The relationship be-
there was a greater divergence of flow between the Denman
tween creep and stress is assumed to follow Glen’s flow law
and Scott glaciers in 2002 compared to 1974, resulting in
using stress exponent n = 3, and basal sliding is assumed to
a more damaged shear margin (Fig. 4d, e). On the western
follow Weertman’s sliding law, with its own stress exponent,
shear margin between Shackleton Ice Shelf and Denman’s
m = 3. Other modelling parameters related to ice rheology
ice tongue there was no obvious change in structure between
and basal conditions are the basal slipperiness, C, and the
1974 and 2002 (Fig. 4f, g). However, velocity profiles in this
rate factor, A. We initialized the ice flow model by changing
region show an eastward migration of the fast-flowing ice
both the ice rate factor A (Fig. S3b) and basal slipperiness C
tongue (Fig. 3e).
(Fig. S3c) using an inverse approach (Vogel, 2002) and iterat-
ing until the surface velocities of the numerical model closely
4 Numerical modelling matched the 2009 measurements of ice flow (Fig. S3).
4.1 Model set-up and experimental design 4.2 Perturbation experiments
To help assess the possible causes of the acceleration of Den- To ascertain the most likely causes of the observed accel-
man Glacier since 1972 and the importance of changes we eration for Denman Glacier we start from a baseline set-up
observe on Denman’s ice tongue, we conduct diagnostic nu- representing the ice shelf in 2009, when both ice geometry
merical modelling experiments using the finite-element ice and velocity are well known, and compare to diagnostic sim-
dynamics model Úa (Gudmundsson et al., 2012). Úa is used ulations of reconstructed 1972 ice geometry. We chose 2009
to solve the equations of the shallow ice stream or “shelfy for this baseline set-up because the calving front is in ap-
stream” approximation (SSA; Cuffey and Paterson, 2010). proximately the same position as in 1972 when our glacier
This can be expressed for one horizontal dimension as observations start, thus ruling out any acceleration in re-
−1 1
−1 1 1 sponse to a change in ice front extent. We use the BedMa-
2∂x A n h(∂x u) n − GC m u m = ρgh∂x s + gh2 ∂x ρ, chine (Morlighem et al., 2020) ice thickness, bathymetry and
2
The Cryosphere, 15, 663–676, 2021 https://doi.org/10.5194/tc-15-663-2021B. W. J. Miles et al.: Recent acceleration of Denman Glacier (1972–2017) 669
Figure 4. (a) Landsat-8 image overlain with MEaSUREs velocity vectors (Rignot et al., 2011b). (b, d, f) Close-up examples of ice tongue
structure and position from a Landsat-1 image in 1974. (c, e, g) Close-up examples of ice tongue structure and position from a Landsat-7
image in 2002. In particular, note the reduction in contact between Denman Glacier and Chugunov Island between 1974 (d) and 2002 (e).
The arrows in panels (c), (e) and (g) represent the direction of migration of the Denman ice tongue since 1974. All Landsat images in this
figure have been made available courtesy of the U.S. Geological Survey.
grounding line position and MEaSUREs ice velocities for ice tongue and Scott Glacier. Similar to the methodol-
2009 (Mouginot et al., 2017a) as inputs. The baseline sim- ogy of Gudmundsson et al. (2019), we only apply this
ulation is then perturbed to test its response to a series of thickness change to fully floating nodes, with no change
potential drivers that may be responsible for the observed in ice thickness for grounded ice and ice directly over
changes in ice geometry since the 1970s. Specifically, we the grounding line. The total thickness change applied
apply observation-based perturbations to test Denman’s re- is shown in Fig. S4. We refer to this perturbation as
sponse to ice shelf thinning (i), grounding line retreat (ii) and “ice shelf thinning” because the majority of the float-
the unpinning of Denman’s ice tongue from Chugunov Is- ing portions of Denman’s ice tongue and Shackleton Ice
land (iii), which are detailed below. Shelf have thinned since 1994, although some sections
of Scott Glacier have actually thickened near its calving
i. To represent ice shelf thinning since 1972, we take
front (Fig. S4).
the mean annual rate of ice thickness change from the
1994–2012 ice shelf thickness change dataset (Paolo et
al., 2015) and scale it up to represent the total thickness ii. In the Úa ice model, the grounding line position is not
change over the 37 years between 1972 and 2009, as- explicitly defined by the user but is instead a direct re-
suming that the 1994–2012 mean annual rate remains sult of ice thickness, bedrock depth, and the relative
constant during this period. This thickness change is densities of ice and seawater. As such, the two ways
then applied to the 2009 ice geometry, which is mod- to perturb a given grounding line are to modify either
ified to better represent the estimated 1972 ice thick- the ice thickness or the bedrock depth. Modifying the
ness distribution of the Shackleton Ice Shelf, Denman bedrock depth is the less disruptive approach because
https://doi.org/10.5194/tc-15-663-2021 The Cryosphere, 15, 663–676, 2021670 B. W. J. Miles et al.: Recent acceleration of Denman Glacier (1972–2017)
the resulting effect upon velocity is not biased by an im- Below we compare the instantaneous change in ice veloc-
posed change in ice thickness at the grounding line ef- ity arising from each perturbation experiment to observed
fecting the regional ice velocity field due to flux conser- changes in velocity, and then we use these comparisons to
vation, in addition to that caused by shifting the ground- understand the relative importance of each process in con-
ing line. Note that raising the bedrock to meet the un- tributing to Denman’s behaviour over the past 50 years.
derside of the ice shelf in this way is not a representa-
tion of any real Earth processes; it is merely forcing the 4.3 Model results
model to have the grounding line in a particular location
that then enables a diagnostic simulation. To represent We show observed 2009 ice speed relative to each of the
grounding line retreat since 1972 we advanced Den- seven simulations which represent possible 1972 ice geome-
man’s grounding line from its position in the 2009 base- tries (E1–7, Fig. 5b–h). In all cases, positive (red) values in-
line set-up by 10 km to a possible 1972 position. This is dicate areas where ice was flowing faster and negative (blue)
achieved by raising the bedrock approximately ∼ 20– values show areas where ice was flowing slower in 2009 rela-
30 m in the area shown in Fig. S4. We justify a 10 km tive to each 1972 simulation. Perturbing ice shelf thickness to
retreat since 1972 based on the rate of grounding line represent ice shelf thinning since the 1970s results in higher
retreat observed between 1996 and 2017 (∼ 5 km; Bran- velocities over both the grounded and floating portions of the
cato et al., 2020). For the newly grounded area, values of Denman system (E1, Fig. 5b). However, the simulated accel-
the bed slipperiness, C, are not generated in our model eration on Denman’s ice tongue (E1, Fig. 5b) is much larger
inversion; we therefore prescribe nearest-neighbour val- than the observed acceleration, with the simulation show-
ues to those at the grounding line in the model inversion. ing a 50 % acceleration in the area just downstream of the
grounding line compared to the observed 20 % acceleration
iii. To represent the pinning of Denman’s ice tongue against between 1972 and 2009 (E1, Fig. 5b). Thus, it would appear
Chugunov Island in the 1972 observations (e.g. Fig. 4d, that ice shelf thinning alone is not consistent with the ob-
e), we artificially raise a small area of bedrock on the served velocity changes in the Denman system. Perturbing
western edge of Chugunov Island (Fig. S4). Bed slipper- the grounding line to account for a possible grounding line
iness was set to a value comparable to that immediately retreat since 1972 simulates changes in ice flow speeds com-
upstream of the grounding line. Note that, although past parable to observations near Denman’s grounding line (E2,
observations suggest that the ice in front of Chugunov Fig. 5c), but it is unable to reproduce the observed increases
Island has been damaged, possibly having an effect on in ice speed across Denman’s ice tongue (E2, Fig. 5c). Thus,
its rate factor, A, we have decided to limit our investiga- grounding line retreat alone is also unable to reproduce the
tion to the effect of pinning the ice on Chugunov Island observed pattern of velocity changes. Ice shelf thinning and
without changing the rate factor. To properly investigate retreating the grounding line result in very similar patterns in
the possible change in past rate factor we would need ice speed change (E3, Fig. 5d) to that of the grounding line
less spatially patchy 1972 velocities and an accurate un- retreat perturbation experiment (E2).
derstanding of past ice geometry (itself an unknown un- In isolation, simulating the unpinning of Denman’s ice
der investigation) to perform a model inversion for 1972 tongue from Chugunov Island has a very limited effect on
conditions. ice flow speeds, with no change in speed near the grounding
These three adjustments are applied, both individually and in line and a very spatially limited change on the ice tongue (E4;
combination with each other, to the baseline model set-up to Fig. 5e). However, when combining the unpinning perturba-
produce seven different simulations (E1–7), summarized in tion with either ice shelf thinning (E5; Fig. 5f) or ground-
Table 1, which respectively perturb the following: ing line retreat (E6; Fig. 5g), it is clear that the unpinning
from Chugunov Island causes an acceleration across Den-
E1. ice shelf thinning, man’s ice tongue. For E5 this results in an even larger over-
estimate of ice speed change across Denman’s ice tongue in
E2. grounding line retreat, comparison to experiment 1, which only perturbs ice shelf
E3. ice shelf thinning and grounding line retreat, thickness. However, for experiment 6 the additional inclu-
sion of the unpinning from Chugunov Island to grounding
E4. unpinning from Chugunov Island, line retreat results in a simulated pattern of ice flow speed
change very similar to observations. Specifically, the unpin-
E5. ice shelf thinning and unpinning from Chugunov Island, ning from Chugunov Island has caused an acceleration across
E6. grounding line retreat and unpinning from Chugunov Is- the ice tongue that was not present in experiment 2. Combin-
land, and ing all three perturbations (E7, Fig. 5h) produces changes in
ice velocity that are most comparable to observations. Both
E7. ice shelf thinning, grounding line retreat and unpinning the spatial pattern in ice speed change and the simulated ice
from Chugunov Island. speed within box D (Fig. 5i) are very similar to observations
The Cryosphere, 15, 663–676, 2021 https://doi.org/10.5194/tc-15-663-2021B. W. J. Miles et al.: Recent acceleration of Denman Glacier (1972–2017) 671
Figure 5. The effect of varying ice geometry on ice flow: ice velocity difference between 2009 observations and (a) observations from
1972; (b–h) seven experiments which perturb 2009 ice geometry to represent possible 1972 ice geometry configurations. In each experiment
combinations of ice shelf thinning (IST), grounding line retreat (GLR) and the unpinning from Chugunov Island are perturbed (see Table 1).
Note that red indicates areas where ice flowed faster in 2009, and blue indicates areas flowing slower, with arrows showing the direction
and magnitude of change when compared to the 1972 perturbations. (I) Mean speed from box D in each experiment; the dotted red line
represents the observed mean speed from box D in 1972, and the blue line represents observed speed from 2009. E7 most closely matches
the speed observed in box D, the spatial pattern of the observed acceleration and the westward bending of Denman’s ice tongue.
for both experiments, and the enhanced westward bending of calving cycle has remained broadly similar over the past
the directional component of ice velocity in experiment E7 is 200 years. It periodically produces a large tabular iceberg,
more consistent with the observed westward bending of the which then drifts ∼ 60 km northwards before grounding on
ice tongue (e.g. Fig. 2b). an offshore ridge and typically remains in place for around
20 years before disintegrating and/or dispersing. However,
more detailed observations and reconstructions of its past
5 Discussion three calving events have shown that there are clear differ-
ences in both the size of icebergs produced and in ice tongue
5.1 Variation in Denman Glacier’s calving cycle structure through time (Fig. 2). The large variation (50 %) in
both the size of icebergs produced and the location the ice
Our calving cycle reconstruction, combined with histori- front calved from indicates variability in its calving cycle.
cal observations (Cassin and Wilkes, 1858; Mawson, 1915, Extending observational records for ice shelves that calve
1932), hints that Denman’s multi-decadal high-magnitude at irregular intervals, sizes or locations is especially im-
https://doi.org/10.5194/tc-15-663-2021 The Cryosphere, 15, 663–676, 2021672 B. W. J. Miles et al.: Recent acceleration of Denman Glacier (1972–2017)
portant because it helps to distinguish between changes in water flood the continental shelf and cause increased basal
glacier dynamics caused by longer-term variations in its calv- melt rates (Rintoul et al., 2016; Greene et al., 2017) and
ing cycle and changes in glacier dynamics forced by climate. grounding line retreat (Li et al., 2015). It is possible that
For example, there have been large variations in ice flow a similar process may be responsible for some of the ob-
speed at the Brunt Ice Shelf over the past 50 years (Gud- served changes at Denman Glacier. Hydrographic data col-
mundsson et al., 2017), but these large variations can be ex- lected from the Marine Mammals Exploring the Oceans Pole
plained by internal processes following interactions with lo- to Pole consortium (Treasure et al., 2017) show water tem-
cal pinning points during the ice shelf’s calving cycle (Gud- peratures of −1.31 to −0.26 ◦ C at depths between 550 and
mundsson et al., 2017). In contrast, the widespread accelera- 850 m on the continental shelf in front of Denman (Brancato
tion of outlet glaciers in the Amundsen Sea sector (Mouginot et al., 2020). Thus, whilst not confirmed, there is clear poten-
et al., 2014) is linked to enhanced intrusions of warm ocean tial for warm water to reach Denman’s grounding zone and
water increasing basal melt rates (e.g. (Thoma et al., 2008; enhance melt rates.
Jenkins et al., 2018), leading to ice shelf thinning (Paolo et Recent observations of grounding line migration at Den-
al., 2015) and grounding line retreat (Rignot et al., 2011a). man have shown a 5 km retreat along its western flank be-
Thus, in the following section we discuss whether the ob- tween 1996 and 2017 (Brancato et al., 2020). However, over
served speed-up of Denman since the 1970s (Fig. 3) is more this time period there was a limited change in the speed
closely linked to variations in its calving cycle (e.g. Brunt Ice of Denman (2001–2017; 3 ± 2 % acceleration; Fig. 3c), and
Shelf) or if it has been driven by climate and ocean forcing our time series indicates that the acceleration initiated ear-
(e.g. Amundsen Sea). lier at some point between 1972 and 1990 (Fig. 3c). Recon-
structions of the bed topography near the grounding line of
5.2 What has caused Denman Glacier’s acceleration Denman Glacier show that the western flank of Denman’s
since the 1970s? grounding line was resting on a retrograde slope in 1996 a
few kilometres behind a topographic ridge (Brancato et al.,
We observe a spatially widespread acceleration of both Den- 2020). One possibility is that Denman’s grounding line re-
man’s floating and grounded ice. This is characterized by a treat initiated much earlier at some point in the 1970s in re-
17 ± 4 % increase in ice flow speed near the grounding line sponse to increased ocean temperatures enhancing melting
between 1972 and 2017 (Fig. 3c) and a 36±5 % acceleration of the ice tongue base. This initial grounding line retreat and
in ice front advance rate from 1972–2017, or a 30 ± 5 % in- possible ocean-induced ice tongue thinning may have caused
crease in the ice front advance rate between 1962 and 2017 the initial rapid acceleration between 1972 and 1990, before
(Fig. 3b). Our estimates of the acceleration of the ice front continuing at a slower rate. However, our numerical mod-
advance rate are of a comparable magnitude to the 36 % ac- elling shows that whilst the combination of the retreat of
celeration of the ice tongue between 1957 and 2017 based Denman’s grounding line and ice tongue thinning can pro-
on averaged point estimates across the ice tongue from re- duce a magnitude of acceleration near the grounding line
peat aerial surveys (Dolgushin, 1966; Rignot et al., 2019). similar to observations (E3; Fig. 5d), these modelled pro-
Taken together, this suggests a limited change in ice tongue cesses cannot explain the widespread acceleration across the
speed between 1957 and 1972, before a rapid acceleration ice tongue (e.g. E4; Fig. 5e).
between 1972 and 2017. However, the rate of acceleration In order to simulate a comparable spatial acceleration
throughout this period has not been constant (Fig. 3b, c). Be- across both Denman’s grounded and floating ice to obser-
tween 1972 to 1990, observations indicate that ice acceler- vations, the unpinning of ice from Chugunov Island follow-
ated 26 ± 5 % on the ice tongue (Fig. 3b) and 11 ± 5 % at ing Denman’s last calving event in 1984 is required (e.g.
the grounding line (Fig. 3c) in comparison to more limited E6 and 7; Fig. 5g, h). In isolation, the reduction in contact
accelerations of 9 ± 1 % and 3 ± 2 %, respectively, between with Chugunov Island has had no effect on ice flow speeds at
1990 and 2017. When comparing these observations against both Denman’s grounding line and ice tongue (E4; Fig. 5e).
our numerical modelling experiments we find that grounding However, when combined with grounding line retreat and ice
line retreat, changes in ice shelf thickness and the unpinning tongue thinning, the spatial pattern of simulated ice speed
of ice from Chugunov Island (Fig. 5h) are all required to ex- change across the ice tongue more closely resemble obser-
plain an acceleration of a comparable magnitude and spatial vations (E6 and 7; Fig. 5g, h). Specifically, the unpinning
pattern across the Denman system. of the ice tongue from Chugunov Island has caused an ac-
Averaged basal melt rates across the Shackleton–Denman celeration across much of Denman’s ice tongue. The most
system are comparable to the Getz Ice Shelf (Depoorter et al., likely explanation as to why the unpinning from Chugunov
2013; Rignot et al., 2013). Close to Denman’s deep ground- Island only influences ice speed patterns in combination with
ing line, melt rates have been estimated at 45 m yr−1 (Bran- ice tongue thinning and grounding line retreat, and not in
cato et al., 2020), suggesting the presence of modified Cir- isolation, is that ice tongue thinning and grounding line re-
cumpolar Deep Water in the ice shelf cavity. At nearby Totten treat have caused a change in the direction of flow of the ice
Glacier (Fig. 1a), wind-driven periodic intrusions of warm tongue since the 1970s. In all simulations that perturb either
The Cryosphere, 15, 663–676, 2021 https://doi.org/10.5194/tc-15-663-2021B. W. J. Miles et al.: Recent acceleration of Denman Glacier (1972–2017) 673
ice tongue thickness or retreat the grounding line (Fig. 5b, c, 5.3 Future evolution of Denman Glacier
e, f, g, h), there is a clear westward bending in ice flow di-
rection near Chugunov Island, which results in a reduction in In the short term, an important factor in the evolution of the
contact between the ice tongue and Chugunov Island. This is wider Denman–Shackleton system is Denman’s next calving
consistent with observations that show a distinctive westward event. Whilst our observations do not suggest that a calving
bending of Denman’s ice tongue since the 1970s (Fig. 2b). event is imminent (next 1–2 years), our calving cycle recon-
These findings therefore suggest that the reduction in contact struction indicates that a calving event at some point in the
with Chugunov Island following Denman’s calving event in 2020s is highly likely. Because the calving cycle of Denman
1984 caused an instantaneous acceleration across large sec- Glacier has demonstrated some variability in the past (e.g.
tions of its ice tongue, meaning that this calving event had a Fig. 2), the precise geometry of its ice tongue after this calv-
direct impact on the spatial pattern of acceleration observed ing event cannot be accurately predicted. In particular, it is
between 1972 and 2017. However, because of the westward unclear how Denman’s ice tongue will realign in relation to
bending of Denman’s ice tongue during its re-advance fol- Chugunov Island following its next calving event. For ex-
lowing its 1984 calving event, the ice tongue now makes lim- ample, if following Denman’s next calving event the direc-
ited contact with Chugunov Island (e.g. Fig. 4e) and has a tion of ice flow shifts eastwards to a similar configuration to
very limited effect on ice flow speeds (e.g. E4; Fig. 5e). the 1970s and the ice tongue makes contact with Chugunov
The acceleration of Denman’s ice tongue following its last Island, the increased resistance could slow down Denman’s
major calving event in 1984 may have also caused a series ice tongue for the duration of its calving cycle, but it is un-
of positive feedbacks, resulting in further acceleration. We clear if any slowdown could propagate to the grounding line.
observe a steepening of the velocity gradient across Den- Thus, this calving event may have important implications for
man’s shear margins, a pattern of acceleration of the dom- the evolution of the Denman–Shackleton system for multiple
inant Denman ice tongue, and a slowdown of the neighbour- decades because it could influence both ice flow speed and
ing Shackleton Ice Shelf and Scott Glacier (Fig. 3a). We also direction.
observe the lateral migration of the shear margins at sub- In the medium term (next 50 years) atmospheric warm-
decadal timescales (Fig. 3e). These distinctive patterns in ing could also have a direct impact on the stability of
ice speed change are very similar to those reported at the the Denman–Shackleton system. Following the collapse of
Stancomb–Wills Ice Shelf (Humbert et al., 2009) and be- Larsen B in 2002, Shackleton is now the most northerly ma-
tween the Thwaites Ice Tongue and Eastern Ice Shelf (Moug- jor ice shelf remaining in Antarctica, with most of the ice
inot et al., 2014; Miles et al., 2020); they are symptomatic of shelf lying outside the Antarctic Circle. Numerous surface
a weakening of shear margins. Therefore, we suggest that at meltwater features have been repeatedly reported on its sur-
Denman, after the initial acceleration following the reduc- face (Kingslake et al., 2017; Stokes et al., 2019; Arthur et al.,
tion in contact with Chugunov Island, the shear margins may 2020). There is no evidence that these features currently have
have weakened, causing further acceleration. We do not in- a detrimental impact on its stability, but there is a possibility
clude this process in our numerical experiments, and it may that projected increases in surface melt (Trusel et al., 2015)
explain the divergence between observations and simulated could increase the ice shelves’ vulnerability to meltwater-
ice speed change in the neighbouring Shackleton Ice Shelf induced hydrofracturing.
and Scott Glacier (Figs. 3a, 5).
Overall, our observations and numerical simulations sug-
6 Conclusion
gest that the cause of Denman’s acceleration since the 1970s
is complex and likely reflects a combination of processes We have reconstructed Denman Glacier’s calving cycle to
linked to the ocean and a reconfiguration of Denman’s ice show that its previous two calving events (∼ 1940s and 1984)
tongue. One possibility is that the acceleration of ice across varied in size by 50 %, and there have been clear differ-
Denman’s grounding line has almost entirely been driven by ences in ice tongue structure, with a notable unpinning from
warm ocean forcing driving grounding line retreat and ice Chugunov Island following the 1984 calving event. We also
tongue thinning, with the unpinning of Denman’s ice tongue observe a long-term acceleration of Denman Glacier across
from Chugunov Island only causing a localized acceleration both grounded and floating sections of ice, with both the ice
across floating ice. An alternative explanation is that warm front advance rate and ice near the grounding line accelerat-
ocean forcing has caused ice tongue thinning and grounding ing by 36±5 % and 17±4 %, respectively, between 1972 and
line retreat, but the acceleration behind the grounding line 2017. We show that in order to simulate a post-1972 accelera-
has been enhanced through time by changes in ice tongue tion that is comparable with observations, its grounding line
configuration. Either way, our results highlight the fact that must have retreated since the 1970s. We also highlight the
both oceanic processes and the changes in ice tongue struc- importance of the reconfiguration of the Denman ice tongue
ture associated with Denman’s calving event have been im- system in determining the spatial pattern of acceleration ob-
portant in causing Denman’s observed acceleration. served.
https://doi.org/10.5194/tc-15-663-2021 The Cryosphere, 15, 663–676, 2021674 B. W. J. Miles et al.: Recent acceleration of Denman Glacier (1972–2017)
The recent changes in the Denman system are important Financial support. This research has been supported by NERC
because Denman’s grounding line currently rests on a retro- (grant no. NE/R000824/1).
grade slope which extends 50 km into its basin (Morlighem
et al., 2020; Brancato et al., 2020), suggesting clear potential
for marine ice sheet instability. Given the large catchment Review statement. This paper was edited by Bert Wouters and re-
size, it has potential to make globally significant contribu- viewed by Chad Greene and two anonymous referees.
tions to mean sea level rise in the coming decades (1.49 m;
Morlighem et al., 2020). Crucial to assessing the magnitude
of any future sea level contributions is improving our under- References
standing of regional oceanography and determining whether
the observed changes at Denman are the consequence of a Aitken, A. R. A., Roberts, J. L., van Ommen, T. D., Young, D.
longer-term ocean warming. This is in addition to monitoring A., Golledge, N. R., Greenbaum, J. S., Blankenship, D. D., and
and understanding the potential impact of any future changes Siegert, M. J.: Repeated large-scale retreat and advance of Totten
in the complex Shackleton–Denman ice shelf system. Glacier indicated by inland bed erosion, Nature, 533, 385–389,
2016.
Arthur, J. F., Stokes, C. R., Jamieson, S. S. R., Carr, J. R., and Lee-
son, A. A.: Distribution and seasonal evolution of supraglacial
Code and data availability. Landsat and the declassified historical
lakes on Shackleton Ice Shelf, East Antarctica, The Cryosphere,
imagery from 1962 is freely available and can be downloaded
14, 4103–4120, https://doi.org/10.5194/tc-14-4103-2020, 2020.
via Earth Explorer (https://earthexplorer.usgs.gov/, last access:
Brancato, V., Rignot, E., Milillo, P., Morlighem, M., Mouginot,
1 February 2020). COSI-Corr is available at http://www.tectonics.
J., An, L., Scheuchl, B., Jeong, S., Rizzoli, P., Bueso Bello,
caltech.edu/slip_history/spot_coseis/download_software.html (last
J. L., and Prats-Iraola, P.: Grounding line retreat of Denman
access: 1 February 2020). The source code for Úa is avail-
Glacier, East Antarctica, measured with COSMO-SkyMed radar
able at https://doi.org/10.5281/zenodo.3706624 (Gudmundsson,
interferometry data, Geophys. Res. Lett., 47, e2019GL086291,
2020). MEaSUREs annual ice velocity maps are available
https://doi.org/10.1029/2019GL086291, 2020.
at https://doi.org/10.5067/9T4EPQXTJYW9 (Mouginot et al.,
Burke, K. D., Williams, J. W., Chandler, M. A., Haywood, A. M.,
2017b). The historical ice velocities and ice front shapefiles are
Lunt, D. J., and Otto-Bliesner, B. L.: Pliocene and Eocene pro-
available at https://doi.org/10.5285/42504802-313C-4F7C-AC8C-
vide best analogs for near-future climates, P. Natl. Acad. Sci.
104EF9B4E077 (Miles et al., 2021).
USA, 115, 13288–13293, 2018.
Cassin, J. and Wilkes, C.: United States Exploring Expedition: Dur-
ing the Years 1838, 1839, 1840, 1841, 1842, Under the Com-
Supplement. The supplement related to this article is available on- mand of Charles Wilkes, USN. Mammalogy and Ornithology,
line at: https://doi.org/10.5194/tc-15-663-2021-supplement. JB Lippincott & Company, Philadelphia, 1858.
Cuffey, K. M. and Paterson, W. S. B.: The physics of
glaciers, Fourth edition, Amsterdam, J. Glaciol., 57, 383–384,
Author contributions. All authors contributed to the design of the https://doi.org/10.3189/002214311796405906, 2010.
study. BWJM collected and analysed the remote sensing data. JRJ DeConto, R. M. and Pollard, D.: Contribution of Antarctica to past
undertook the numerical modelling. BWJM led the paper writing and future sea-level rise, Nature, 531, 591–597, 2016.
with input from all authors. Depoorter, M. A., Bamber, J. L., Griggs, J. A., Lenaerts, J. T. M.,
Ligtenberg, S. R. M., van den Broeke, M. R., and Moholdt, G.:
Calving fluxes and basal melt rates of Antarctic ice shelves, Na-
Competing interests. The authors declare that they have no conflict ture, 502, 89–92, 2013.
of interest. Dolgushin, L. D.: New data on the rates of movement of Antarctic
glaciers, Soviet Antarctic Expedition Information Bulletin, 55,
41–42, 1966.
Acknowledgements. Landsat imagery was provided free of charge Flament, T. and Remy, F.: Dynamic thinning of Antarctic glaciers
by the US Geological Survey Earth Resources Observation Science from along-track repeat radar altimetry, J. Glaciol., 58, 830–840,
Center. We also acknowledge the use of imagery from the NASA 2012.
Worldview application (https://worldview.earthdata.nasa.gov, last Gardner, A. S., Moholdt, G., Scambos, T., Fahnstock, M.,
access: 1 February 2020), part of the NASA Earth Observing Ligtenberg, S., van den Broeke, M., and Nilsson, J.: In-
System Data and Information System (EOSDIS). We also thank creased West Antarctic and unchanged East Antarctic ice dis-
Eric Rignot for providing digitized estimates of ice flow speed charge over the last 7 years, The Cryosphere, 12, 521–547,
across parts of Denman’s ice tongue based on the mapped estimates https://doi.org/10.5194/tc-12-521-2018, 2018.
of Dolgushin (1966). We would like to thank Chad Greene and two Gasson, E., DeConto, R., and Pollard, D.: Antarctic bedrock topog-
anonymous reviewers, along with the editor Bert Wouters, for pro- raphy uncertainty and ice sheet stability, Geophys. Res. Lett., 42,
viding constructive comments which led to the improvement of this 5372–5377, 2015.
paper. Golledge, N. R., Kowalewski, D. E., Naish, T. R., Levy, R. H., Fog-
will, C. J., and Gasson, E. G. W.: The multi-millennial Antarctic
commitment to future sea-level rise, Nature, 526, 421–425, 2015.
The Cryosphere, 15, 663–676, 2021 https://doi.org/10.5194/tc-15-663-2021B. W. J. Miles et al.: Recent acceleration of Denman Glacier (1972–2017) 675 Greenbaum, J. S., Blankenship, D. D., Young, D. A., Richter, T. science and Remote Sensing Symposium, 1–12, 1943–1946, G., Roberts, J. L., Aitken, A. R. A., Legresy, B., Schroeder, D. https://doi.org/10.1109/Igarss.2007.4423207, 2007. M., Warner, R. C., van Ommen, T. D., and Siegert, M. J.: Ocean Levermann, A., Winkelmann, R., Albrecht, T., Goelzer, H., access to a cavity beneath Totten Glacier in East Antarctica, Nat. Golledge, N. R., Greve, R., Huybrechts, P., Jordan, J., Leguy, G., Geosci., 8, 294–298, 2015. Martin, D., Morlighem, M., Pattyn, F., Pollard, D., Quiquet, A., Greene, C. A., Blankenship, D. D., Gwyther, D. E., Silvano, A., and Rodehacke, C., Seroussi, H., Sutter, J., Zhang, T., Van Breedam, van Wijk, E.: Wind causes Totten Ice Shelf melt and acceleration, J., Calov, R., DeConto, R., Dumas, C., Garbe, J., Gudmunds- Sci. Adv., 3, e1701681, 2017. son, G. H., Hoffman, M. J., Humbert, A., Kleiner, T., Lipscomb, Gudmundsson, H.: GHilmarG/UaSource: Ua2019b (Version W. H., Meinshausen, M., Ng, E., Nowicki, S. M. J., Perego, M., v2019b), Zenodo, https://doi.org/10.5281/zenodo.3706624, Price, S. F., Saito, F., Schlegel, N.-J., Sun, S., and van de Wal, 2020. R. S. W.: Projecting Antarctica’s contribution to future sea level Gudmundsson, G. H.: Ice-shelf buttressing and the stabil- rise from basal ice shelf melt using linear response functions of ity of marine ice sheets, The Cryosphere, 7, 647–655, 16 ice sheet models (LARMIP-2), Earth Syst. Dynam., 11, 35– https://doi.org/10.5194/tc-7-647-2013, 2013. 76, https://doi.org/10.5194/esd-11-35-2020, 2020. Gudmundsson, G. H., Krug, J., Durand, G., Favier, L., and Gagliar- Li, X., Rignot, E., Morlighem, M., Mouginot, J., and Scheuchl, B.: dini, O.: The stability of grounding lines on retrograde slopes, Grounding line retreat of Totten Glacier, East Antarctica, 1996 to The Cryosphere, 6, 1497–1505, https://doi.org/10.5194/tc-6- 2013, Geophys. Res. Lett., 42, 8049–8056, 2015. 1497-2012, 2012. Li, X., Rignot, E., and Mouginot, J.: Ice flow dynamics and mass Gudmundsson, G. H., de Rydt, J., and Nagler, T.: Five decades of loss of Totten Glacier, East Antarctica, from 1989 to 2015, Geo- strong temporal variability in the flow of Brunt Ice Shelf, Antarc- phys. Res. Lett., 43, 6366–6373, 2016. tica, J. Glaciol., 63, 164–175, 2017. Lovell, A., Stokes, C., and Jamieson, S.: Sub-decadal variations in Gudmundsson, G. H., Paolo, F. S., Adusumilli, S., and Fricker, outlet glacier terminus positions in Victoria Land, Oates Land H. A.: Instantaneous Antarctic ice- sheet mass loss driven by and George V Land, East Antarctica (1972–2013), Antarct. Sci., thinning ice shelves, Geophys. Res. Lett., 46, 13903–13909, 29, 468–483, 2017. https://doi.org/10.1029/2019GL085027, 2019. Mawson, D.: The Home of the Blizzard, Heinemann, London, 1915. Helm, V., Humbert, A., and Miller, H.: Elevation and elevation Mawson, D.: The BANZ Antarctic Research Expedition, 1929–31, change of Greenland and Antarctica derived from CryoSat- Geograph. J., 80.2, 101–126, 1932. 2, The Cryosphere, 8, 1539–1559, https://doi.org/10.5194/tc-8- Miles, B., Jordan, J., Stokes, C., Jamieson, S., Gudmundsson, 1539-2014, 2014. G. H., and Jenkins, A.: Ice front position and velocities Hill, E. A., Gudmundsson, G. H., Carr, J. R., and Stokes, C. R.: for Denman Glacier 1962–2018, Polar Data Centre,Natural Velocity response of Petermann Glacier, northwest Greenland, to Environment Research Council, UK Research & Inno- past and future calving events, The Cryosphere, 12, 3907–3921, vation, https://doi.org/10.5285/42504802-313c-4f7c-ac8c- https://doi.org/10.5194/tc-12-3907-2018, 2018. 104ef9b4e077, 2021. Howat, I. M., Porter, C., Smith, B. E., Noh, M.-J., and Morin, P.: Miles, B. W. J., Stokes, C. R., Vieli, A., and Cox, N. J.: Rapid, The Reference Elevation Model of Antarctica, The Cryosphere, climate-driven changes in outlet glaciers on the Pacific coast of 13, 665–674, https://doi.org/10.5194/tc-13-665-2019, 2019. East Antarctica, Nature, 500, 563–566, 2013. Humbert, A., Kleiner, T., Mohrholz, C. O., Oelke, C., Greve, R., Miles, B. W. J., Stokes, C. R., and Jamieson, S. S. R.: Pan–ice-sheet and Lange, M. A.: A comparative modeling study of the Brunt glacier terminus change in East Antarctica reveals sensitivity of Ice Shelf/Stancomb-Wills Ice Tongue system, East Antarctica, J. Wilkes Land to sea-ice changes, Sci. Adv., 2, e1501350, 2016. Glaciol., 55, 53–65, 2009. Miles, B. W. J., Stokes, C. R., and Jamieson, S. S. R.: Velocity in- Jenkins, A., Shoosmith, D., Dutrieux, P., Jacobs, S., Kim, T. W., creases at Cook Glacier, East Antarctica, linked to ice shelf loss Lee, S. H., Ha, H. K., and Stammerjohn, S.: West Antarctic Ice and a subglacial flood event, The Cryosphere, 12, 3123–3136, Sheet retreat in the Amundsen Sea driven by decadal oceanic https://doi.org/10.5194/tc-12-3123-2018, 2018. variability, Nat. Geosci., 11, 733–738, 2018. Miles, B. W. J., Stokes, C. R., Jenkins, A., Jordan, J. R., Jamieson, King, M. A., Bingham, R. J., Moore, P., Whitehouse, P. L., Bentley, S. S. R., and Gudmundsson, G. H.: Intermittent structural weak- M. J., and Milne, G. A.: Lower satellite-gravimetry estimates of ening and acceleration of the Thwaites Glacier Tongue between Antarctic sea-level contribution, Nature, 491, 586–589, 2012. 2000 and 2018, J. Glaciol., 66, 485–495, 2020. Kingslake, J., Ely, J. C., Das, I., and Bell, R. E.: Widespread move- Mohajerani, Y., Velicogna, I., and Rignot, E.: Evaluation of Re- ment of meltwater onto and across Antarctic ice shelves, Nature, gional Climate Models Using Regionally Optimized GRACE 544, 349–352, 2017. Mascons in the Amery and Getz Ice Shelves Basins, Antarctica, Lea, J. M.: The Google Earth Engine Digitisation Tool (GEEDiT) Geophys. Res. Lett., 46, 13883–13891, 2019. and the Margin change Quantification Tool (MaQiT) – sim- Moon, T. and Joughin, I.: Changes in ice front position on Green- ple tools for the rapid mapping and quantification of chang- land’s outlet glaciers from 1992 to 2007, J. Geophys. Res.-Earth, ing Earth surface margins, Earth Surf. Dynam., 6, 551–561, 113, F02022, 2008. https://doi.org/10.5194/esurf-6-551-2018, 2018. Morlighem, M., Rignot, E., Binder, T., Blankenship, D., Drews, R., Leprince, S., Ayoub, F., Klinger, Y., and Avouac, J. P.: Co- Eagles, G., Eisen, O., Ferraccioli, F., Forsberg, R., Fretwell, P., Registration of Optically Sensed Images and Correlation Goel, V., Greenbaum, J. S., Gudmundsson, H., Guo, J. X., Helm, (COSI-Corr): an operational methodology for ground defor- V., Hofstede, C., Howat, I., Humbert, A., Jokat, W., Karlsson, N. mation measurements, Igarss: 2007 Ieee International Geo- B., Lee, W. S., Matsuoka, K., Millan, R., Mouginot, J., Paden, https://doi.org/10.5194/tc-15-663-2021 The Cryosphere, 15, 663–676, 2021
You can also read