Two-dimensional monitoring of air pollution in Madrid using a Multi-AXis Differential Optical Absorption Spectroscopy two-dimensional (MAXDOAS-2D) ...
←
→
Page content transcription
If your browser does not render page correctly, please read the page content below
Atmos. Meas. Tech., 14, 2941–2955, 2021
https://doi.org/10.5194/amt-14-2941-2021
© Author(s) 2021. This work is distributed under
the Creative Commons Attribution 4.0 License.

Two-dimensional monitoring of air pollution in Madrid using
a Multi-AXis Differential Optical Absorption Spectroscopy
two-dimensional (MAXDOAS-2D) instrument
David Garcia-Nieto1,2 , Nuria Benavent1,2 , Rafael Borge2 , and Alfonso Saiz-Lopez1
1 Department of Atmospheric Chemistry and Climate, Institute of Physical Chemistry Rocasolano,
CSIC, Madrid 28006, Spain
2 Universidad Politécnica de Madrid, UPM, 28006 Madrid, Spain

Correspondence: Alfonso Saiz-Lopez (a.saiz@csic.es)

Received: 17 June 2020 – Discussion started: 15 July 2020
Revised: 12 February 2021 – Accepted: 15 February 2021 – Published: 17 April 2021

Abstract. Trace gases play a key role in the chemistry of ur-     1   Introduction
ban atmospheres. Therefore, knowledge about their spatial
distribution is needed to fully characterize air quality in ur-   Air pollution in urban areas has become a concern in our so-
ban areas. Using a new Multi-AXis Differential Optical Ab-        ciety because it represents a major risk to human health and
sorption Spectroscopy two-dimensional (MAXDOAS-2D)                the environment (WHO, 2019). Air quality is often expressed
instrument, along with an inversion algorithm (bePRO), we         as the state of air pollution in terms of gaseous pollutant
report the first two-dimensional maps of nitrogen dioxide         concentrations, as well as the size and number of particulate
(NO2 ) and nitrous acid (HONO) concentrations in the city of      matter that may affect human health, ecosystems and climate
Madrid, Spain. Measurements were made during 2 months             (Monks et al., 2009). Integral understanding of air pollution
(6 May–5 July 2019), and peak mixing ratios of 12 and             requires knowledge about the sources, pollutants, chemical
0.7 ppbv (parts per billion by volume) for NO2 and HONO,          composition and spatial distribution and their transport phe-
respectively, were observed in the early morning in the south-    nomena in the atmosphere (EEA, 2019).
ern part of the downtown area. We found good general agree-          Madrid, Spain, has suffered from severe air pollution in
ment between the MAXDOAS-2D mesoscale observations                recent years with episodes of large nitrogen dioxide (NO2 )
– which provide a typical spatial range of a few kilometers       and ozone (O3 ) concentrations. In an effort to control and
– and the in situ measurements provided by Madrid’s air           reduce high-pollution events, the local government has en-
quality monitoring stations. In addition to vertical profiles,    forced some traffic restriction measures (Izquierdo et al.,
we studied the horizontal gradients of NO2 in the surface         2020) and has set up several in situ air quality monitoring
layer by applying the different horizontal light path lengths     stations over the city’s metropolitan area. These in situ in-
in the two spectral regions included in the NO2 spectral anal-    struments – as of today – cannot measure some important
ysis: ultraviolet (UV, at 360 nm) and visible (VIS, 477 nm).      trace gases present in the atmosphere, and their values are
We also investigate the sensitivity of the instrument to infer    only representative of the immediate surrounding of the in-
vertically distributed information on aerosol extinction co-      struments and at surface level. There is therefore a need
efficients and discuss possible future ways to improve the        for mesoscale analysis (both horizontal and vertical in the
retrievals. The retrieval of two-dimensional distributions of     order of 10 km) of urban air pollution that could comple-
trace gas concentrations reported here provides valuable spa-     ment the in situ measurements. With this aim, we have de-
tial information for the study of air quality in the city of      ployed a Multi AXis Differential Optical Absorption Spec-
Madrid.                                                           troscopy (MAXDOAS) instrument for air pollution measure-
                                                                  ments in Madrid. MAXDOAS is a widely used technique
                                                                  for the detection of trace gases in the atmosphere, and it is

Published by Copernicus Publications on behalf of the European Geosciences Union.
2942 D. Garcia-Nieto et al.: Two-dimensional monitoring of air pollution in Madrid
based on the wavelength-dependent absorption of scattered 2 Brief introduction to the DOAS method
sunlight by atmospheric constituents (Platt and Stutz, 2008).
In addition to routinely monitored species such as NO2 and The DOAS basic idea is described by the Beer–Lambert law
O3 , MAXDOAS provides mesoscale measurements of other which models the exponential attenuation of spectral irradi-
trace gases that are relevant to understand atmospheric chem- ance when it traverses a certain sample that contains some
istry, such as nitrous acid (HONO), formaldehyde (HCHO) absorbers:
or glyoxal (CHOCHO). Over the past few years, we have re- L
ported trace gas measurements in Madrid using the MAX- X Z
DOAS technique (Wang et al., 2016; Garcia-Nieto et al., I (λ, L) = I0 (λ) exp − i
σi (λ) ρi (s) ds , (1)
2018; Benavent et al., 2019), as well as pollutant trend anal- 0
ysis and chemical transport modeling (Borge et al., 2018;
where λ is wavelength, σi and ρi stand for – respectively
Cuevas et al., 2014; Saiz-Lopez et al., 2017).
– the absorption cross section and concentration of a given
For this work, a new two-dimensional MAXDOAS instru-
absorber i along the path, and the pair I0 and I represent the
ment (which will be described in Sect. 3 and will be here-
spectral irradiances at the beginning and end of the process
after referred to as MAXDOAS-2D) has been built, tested
under study. The absorption processes are integrated over the
and set up to take continuous measurements in Madrid. This
photon paths (with infinitesimal path ds) and summed over
instrument represents a follow-up development to our previ-
every present absorber (Platt and Stutz, 2008).
ous one-dimensional instrument (MAXDOAS-1D; see Wang
Specifically, the MAXDOAS technique is based on the
et al., 2016) that incorporates the capability of moving in
study of the differential spectral absorption structures that are
the azimuthal dimension, therefore allowing the collection
produced in the measured scattered sunlight spectra (Hön-
of spectra pointing at any angular direction. This additional
ninger et al., 2004; Plane and Saiz-Lopez, 2006; Platt and
capability allows for the measurement of both the horizon-
Stutz, 2008). The main principle is based on identifying the
tal and vertical trace gas (e.g., NO2 ) distribution through-
narrowband absorption features within the measured optical
out the city and in turn the generation of two-dimensional
density taking out the broadband optical density, mainly gen-
maps of trace gas concentrations. Several works using two-
erated by Rayleigh and Mie scattering, as well as by instru-
dimensional MAXDOAS instruments have been carried out
mental effects. On the other hand, an analogous process is
in recent years (e.g., Ortega et al., 2016; Yang et al., 2019;
done on the trace gas absorption cross sections by means of
Schreier et al., 2020; Dimitropoulou et al., 2020). These stud-
filtering out the broadband spectral features, hence produc-
ies were mostly focused on mapping the NO2 distribution in
ing the so-called differential absorption cross sections which
urban environments and assessing its role for air quality mon-
are unique for each trace gas, acting as their “fingerprints”
itoring.
and therefore enabling their specific detection.
Here we present 2 months of MAXDOAS-2D measure-
For MAXDOAS, I0 stands for the solar spectrum (known
ments of scattered sunlight spectra. The measurements were
as the Fraunhofer spectrum with no Earth atmospheric ab-
taken from 6 May to 5 July 2019 with a focus on the eval-
sorptions), while I represents the recorded ground-based
uation of NO2 vertical concentration profiles and the char-
spectrum, which includes all the absorption and scattering
acterization of horizontal light path lengths. We also pro-
processes. However, and since the actual photon path is dif-
vide the retrieval of HONO as an example of the potential
ficult to determine with accuracy (see Sect. 4), the MAX-
of the MAXDOAS-2D to provide spatial information also on
DOAS calculations are done using relative absorptions be-
other trace gases relevant to urban atmospheric chemistry.
tween two different optical paths: a zenith spectrum that con-
An assessment of the relation between the MAXDOAS data
tains less absorptions and is assumed as a reference spectrum
and the in situ measurements of NO2 in the city was car-
and another spectrum pointing to a given elevation angle.
ried out. Section 2 provides details of the DOAS technique,
Therefore, the direct product of the method is the differential
while Sect. 3 describes the experimental setup. The inversion
slant column density (DSCD), which can be defined as the
methods and the atmospheric parameters chosen for the anal-
difference in the integrated concentration of a given absorber
ysis are detailed in Sect. 4. The two-dimensional NO2 and
between the two selected pointing directions (more details
HONO distributions, an evaluation of the light path geome-
about the numerical procedure that lies behind can be found
tries, along with their relative probabilities, and an assess-
in Honninger et al., 2004; Plane and Saiz-Lopez, 2006, and
ment of horizontal mixing ratio gradients near the surface
Platt and Stutz, 2008). Finally, these DSCDs are used as the
are discussed in Sect. 5.
main input for the profile retrieval algorithms which simulate
the state of the atmosphere with the purpose of reproducing
the measured DSCDs. This final step yields the optimal ver-
tical concentration profiles.
Atmos. Meas. Tech., 14, 2941–2955, 2021 https://doi.org/10.5194/amt-14-2941-2021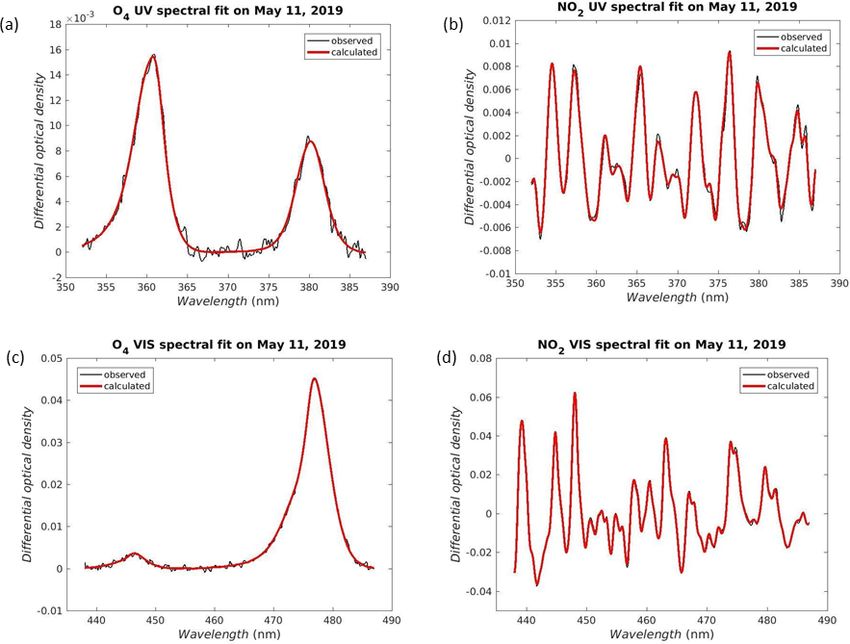
D. Garcia-Nieto et al.: Two-dimensional monitoring of air pollution in Madrid                                                2943

Figure 1. MAXDOAS-2D geometry diagram, the background of this picture represents the Madrid city center taken from © Google Maps.

3     Experiment                                                   maintain the spectrometer temperature as steady as possible
                                                                   – for both mechanical and wavelength calibration purposes –
Briefly, MAXDOAS-1D instruments consist of a light col-            a Peltier cell was included. Additionally, a UPS device pro-
lector attached to a stepper motor that scans the atmosphere       vides the power supply and eliminates possible strong power
at different viewing elevation angles (VEAs; see Fig. 1). The      peaks. Two webcams take pictures of the cloud cover at each
main feature added to the MAXDOAS-2D instrument is an              VAA and monitor the instrument itself. The instrument is
additional stepper motor for the azimuthal movement, hence         autonomous, and it runs on homemade Java software. This
allowing the light collector to freely point to any angular di-    software controls the movement, the spectrum collection and
rection in the atmosphere. This allows for the evaluation of       recording, and the surrounding accessories and automatically
trace gases absorptions for different viewing azimuth angles       keeps it continuously measuring as long as the Sun is over the
(VAAs; Fig. 1).                                                    horizon.

3.1    MAXDOAS-2D description                                      3.2   Location

A MAXDOAS-2D instrument (Fig. 2) was built by the At-              The MAXDOAS-2D instrument is located at the main cam-
mospheric Chemistry and Climate group at the Institute of          pus of the Spanish National Research Council (CSIC) in
Physical Chemistry Rocasolano (IQFR-CSIC). Its main el-            Madrid, Spain. It is placed on the roof of the Instituto de
ements are based on our previous MAXDOAS-1D instru-                Ciencias Agrarias (ICA) at a latitude of 40.4419◦ N and a
ment: a light collector attached to a stepper motor, along         longitude of 3.6875◦ W. The height of the building is ap-
with a focusing lens (80 mm focal length) are responsible          proximately 70 m a.g.l (above ground level). This location in
for collecting the scattered sunlight. An Ocean Optics SMA         downtown Madrid can be classified as an urban site with the
905 optical fiber of 1 m length conducts the light through an      usual weather of continental areas at midlatitudes (i.e., hot
Ocean Optics HR4000 spectrometer (which incorporates a             and dry summers and cold winters) and with a prevalence of
linear silicon charge-coupled device array as a detector). The     clear sky days during the year. NO2 typically presents strong
spectrometer wavelength ranges roughly from 300 to 500 nm          spatial concentration gradients in urban areas, and traffic hot-
and offers an estimated spectral resolution (full width at half    spots have been reported in Madrid (Borge et al., 2016). This
maximum) of about 0.5 nm. An additional stepper motor was          makes it difficult to clearly predict how NO2 will be dis-
included for azimuthal movement. The instrument incorpo-           tributed; i.e., there is not a clear azimuthal direction pref-
rates all its components in an outdoor unit. Therefore, to         erence for higher NO2 at a certain time. However, mesoscale

https://doi.org/10.5194/amt-14-2941-2021                                             Atmos. Meas. Tech., 14, 2941–2955, 2021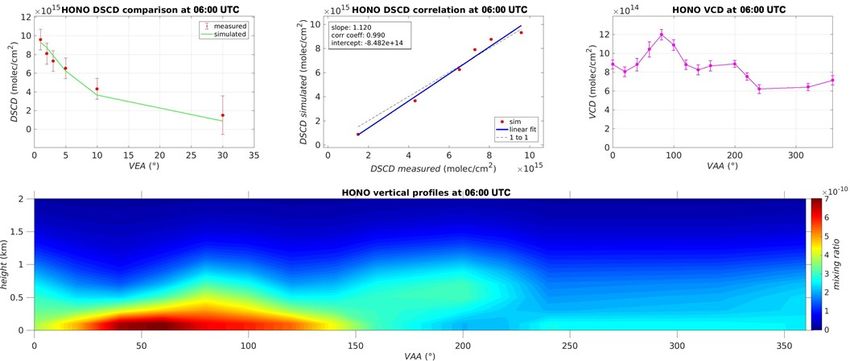
2944                                         D. Garcia-Nieto et al.: Two-dimensional monitoring of air pollution in Madrid

Figure 2. (a) Aluminum tower with the instrument installed on top of it; (b) MAXDOAS-2D instrument; (c) MAXDOAS-2D scheme.

simulations suggest that higher NO2 mixing ratios can be ex-       gular direction were automatically calculated. More specif-
pected in the southern part of Madrid, considering population      ically, for this study we set the goal of completing an az-
distribution and commuting patterns (Picornell et al., 2019).      imuthal lap in approximately 1 h (mainly for an easier inter-
   Due to some obstacles that blocked a clear view in some of      pretation of the results and for the subsequent comparison
the VAAs, a small aluminum tower was built to overcome the         with in situ instruments of Madrid’s air quality monitoring
viewing obstacles, and the MAXDOAS-2D instrument was               network). Hence, we chose 24 s as the maximum exposure
fixed on top of it (see Fig. 2). Once the instrument was set up,   time in each angular combination.
we aligned it for both angular movements – azimuthal and              The main advantage of this setup is that we can observe
zenithal – with respect to the geographical north and the lo-      the daily NO2 variability over the entire city with a moder-
cal horizontal (i.e., perpendicular to the gravitational plumb),   ate temporal resolution (1 h). The main disadvantage is that
respectively. This process was performed in two steps. First,      observations for each VAAs averaged over such a short inte-
the light collector was coarsely oriented using levels and a       gration period may be affected by microscale phenomena.
compass. Then, the alignment was refined doing a vertical          Nonetheless, NO2 concentration gradients are particularly
scan of the Sun (which has a very well-known position vec-         strong in space (Borge et al., 2016). Therefore, this time res-
tor) and its angular surroundings at several different times of    olution may be well suited to characterize both the azimuthal
a clear sky day. The angular differences between the mea-          and the horizontal gradients of NO2.
surements and the center of intensity of the registered spec-
tra (a similar approach was done in Ortega et al., 2016) were
estimated and the associated correction applied to the instru-
ment.                                                              4   Analysis methods

3.3    Measurements setup                                          The absorptions of the molecular oxygen dimer (O4 ) and
                                                                   NO2 were measured for the entire campaign and for two
In order to sample and analyze a representative portion of the     spectral windows: 352–387 nm (UV region) and 438–487 nm
atmosphere over Madrid, selected angular directions were           (VIS region). The analysis settings applied for the UV and
chosen. Starting at a VAA of 0◦ (pointing to the north), the       VIS regions are summarized in Tables 1 and 2, respectively.
MAXDOAS-2D rotated clockwise using steps of 20◦ in az-             These configurations mainly follow those used in Wagner et
imuth. In each azimuth direction, the ensuing VEA vector           al. (2019).
was used: 1, 2, 3, 5, 10, 30 and 90◦ . Therefore, an entire az-       The selected differential absorption cross sections – along
imuthal lap was completed when the light collector was back        with the spectral window and parameters included in Tables
again at a VAA of 0◦ .                                             1 and 2 – were adjusted to the measured differential opti-
   For every measured spectrum, the spectrometer was able          cal density using the QDOAS spectral fitting software (http:
to correct for both electronic offset and dark current effects.    //uv-vis.aeronomie.be/software/QDOAS/, last access: Octo-
Other important parameters for the measurements such as the        ber 2017). Figure 3 shows examples of the spectral detection
integration time and the number of scans taken in each an-         of O4 and NO2 for both the UV and VIS regions.

Atmos. Meas. Tech., 14, 2941–2955, 2021                                             https://doi.org/10.5194/amt-14-2941-2021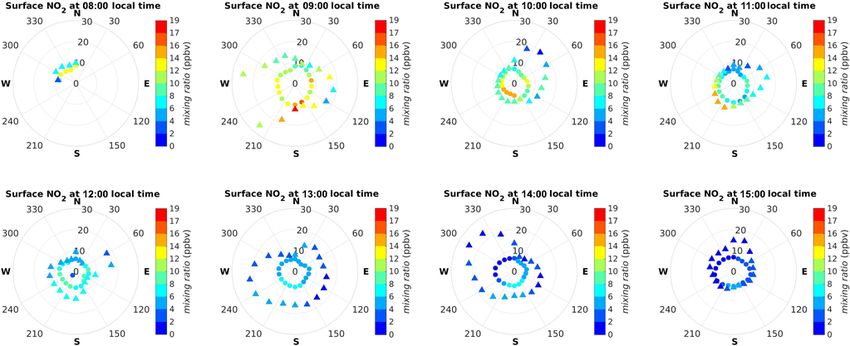
D. Garcia-Nieto et al.: Two-dimensional monitoring of air pollution in Madrid                                                    2945

Table 1. DOAS spectral settings for the retrieval of O4 and NO2 in the UV.

            Parameter                 Value
            Fitting window            352–387 nm
            Wavelength calibration    Based on reference solar atlas (Chance and Kurucz, 2010)
            Zenith reference          Scan
            Polynomial order          5
            Intensity offset          Order 2
            Shift                     The measured spectra and ring were allowed to shift and stretch (order 1) in wavelength.
            Molecule                  Cross section
            O4                        293 K (Thalman and Volkamer, 2013)
            NO2                       298 K (Vandaele et al., 1998)
            O3 _a                     273 K (Serdyuchenko et al., 2014)
            O3 _b                     223 K (Serdyuchenko et al., 2014)
            HCHO                      297 K (Meller and Moortgat, 2000)
            HONO                      296 K (Stutz et al., 2000)
            Ring_a                    Calculated by QDOAS
            Ring_b                    Ring_a spectrum multiplied by λ−4

Table 2. DOAS spectral settings for the retrieval of O4 and NO2 in the VIS.

            Parameter                 Value
            Fitting window            438–487 nm
            Wavelength calibration    Based on reference solar atlas (Chance and Kurucz, 2010)
            Zenith reference          Scan
            Polynomial order          5
            Intensity offset          Order 2
            Shift                     The measured spectra and ring were allowed to shift and stretch (order 1) in wavelength.
            Molecule                  Cross section
            O4                        293 K (Thalman and Volkamer, 2013)
            NO2                       298 K (Vandaele et al., 1998)
            O3 _a                     273 K (Serdyuchenko et al., 2014)
            O3 _b                     223 K (Serdyuchenko et al., 2014)
            H2 O                      296 K (Rothman et al., 2010)
            Glyoxal                   296 K (Volkamer et al., 2005)
            Ring_a                    Calculated by QDOAS
            Ring_b                    Ring_a spectrum multiplied by λ−4

4.1   Cloud-screening and quality filtering                            imuthal direction as the light collector. We estimated the
                                                                       cloud cover using a code that gets the RGB coordinates – the
                                                                       three chromatists of the blue, green and red – and changes
The algorithms for MAXDOAS retrievals of trace gas ver-                them into LCh coordinates – L indicates lightness, C rep-
tical profiles are based on estimating the light paths (along          resents chroma, and h is the hue angle. Based on criteria of
with their corresponding scattering probability). A signifi-           luminosity, color and saturation, the code estimates the cloud
cant cloud cover could noticeably impact the calculations,             index (percentage of estimated cloud cover in a given az-
mainly because of multiple scattering effects, adding large            imuthal sky view). Filtering out cloudy skies with precision
uncertainties to the retrieval process. For this reason, the set       is rather challenging; therefore, we established a threshold to
of measured spectra was cloud-screened using the cloud-                get as many clear sky views as possible. In order to do that,
free AERosol RObotic NETwork (AERONET) database. The                   we first crossed our measured DSCDs with the AERONET
AERONET databases are reported with three quality lev-                 2.0 database, and subsequently, using the photos, we dis-
els; in particular, we used the Level 2.0 (cloud-screened and          carded the cycles taken with an estimated cloud index higher
quality-assured) database provided by the AERONET instru-              than 40 %.
ment in Madrid. This information is combined with the pho-                In addition to cloud screening, several other quality fil-
tos taken by the camera installed on the MAXDOAS. As                   ters were applied to the DSCDs. Firstly, every DSCD that
mentioned in Sect. 3.1, this webcam points at the same az-

https://doi.org/10.5194/amt-14-2941-2021                                                  Atmos. Meas. Tech., 14, 2941–2955, 2021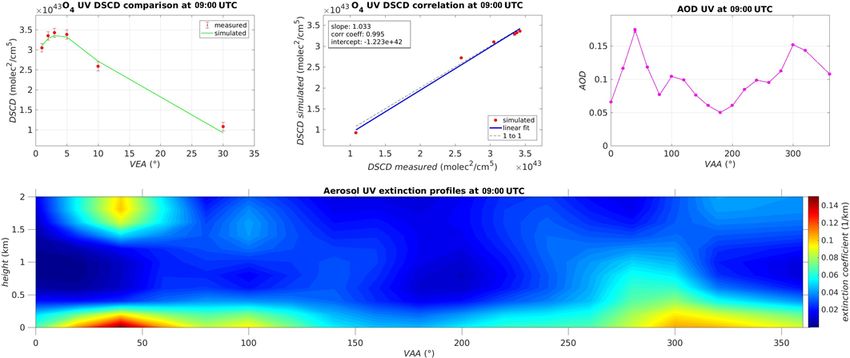
2946                                            D. Garcia-Nieto et al.: Two-dimensional monitoring of air pollution in Madrid

Figure 3. Spectral detection of O4 (a) and (c) and NO2 (b) and (d). Red lines represent the calculated optical densities, and black lines are
the measured optical densities. The viewing geometry of each detection was (a) VEA 2◦ and solar zenith angle, SZA, 26.4◦ , (b) VEA 3◦ and
SZA 24.7◦ , (c) VEA 1◦ and SZA 22.6◦ , and (d) VEA 1◦ and SZA 48.7◦ .

yielded either a relative uncertainty larger than 1 or a residual        DSCDs; then, the target trace gas vertical concentration pro-
root mean square (RMS) higher than 0.01 (in optical density              file is retrieved using the corresponding light paths and mea-
units) was rejected. After that, we estimated the DSCD de-               sured absorption. In order to do that, bePRO simulates the
tection limit for a given trace gas as the ratio of the residual         atmospheric state characterizing several different physical
RMS (in optical density units) associated with each DSCD                 phenomena including pressure and temperature vertical pro-
and the maximum value of the differential cross section of               files, Rayleigh and Mie scattering events (along with their
that trace gas. Then, we discarded the DSCDs that had an                 respective phase functions), the effect of the surface albedo,
absolute value lower than twice the derived detection limit              the light path geometries, and the irradiance extinction pro-
(a similar approach was carried out in Peters et al., 2012).             cesses. Once the atmospheric vector state is defined, its com-
Finally, we used the daily plus/minus 3 standard deviation               bination with a certain vertical concentration profile results
criterion that AERONET applies for its cloud-filtered data,              in the simulated DSCDs. This vertical profile is iterated un-
keeping the DSCD that falls within plus/minus 3 standard                 til the generated set of simulated DSCDs is optimized with
deviations from each daily mean.                                         respect to the measured DSCDs so that the residual is min-
                                                                         imized. As a result, an optimal vertical profile is obtained
4.2    Inversion algorithm and vertical profiles                         when the iteration is finished for each MAXDOAS cycle.
                                                                             The measured O4 DSCDs are used to estimate the light
An inversion algorithm method is applied to the measured                 paths for each VEA since they are related to the square of the
DSCDs to estimate the light paths and subsequently derive                atmospheric O2 profiles, which are well known. This profile
the trace gas vertical concentration profile. For this work              is fairly steady during the day and does not heavily depend on
we have used the bePRO inversion algorithm (Clémer et                    chemistry factors. Therefore, the measured O4 DSCDs can
al., 2010). The original calculation was built based on the              provide information on the irradiance extinction in the atmo-
optimal estimation method (OEM; Rodgers, 2000), and it                   sphere. This extinction profile is usually associated with the
comprises two steps: first, the light paths and the vertical             aerosol extinction coefficients, and thus its vertical integra-
profiles of irradiance extinction are calculated using the O4            tion yields the aerosol optical depth (AOD). These aerosol

Atmos. Meas. Tech., 14, 2941–2955, 2021                                                    https://doi.org/10.5194/amt-14-2941-2021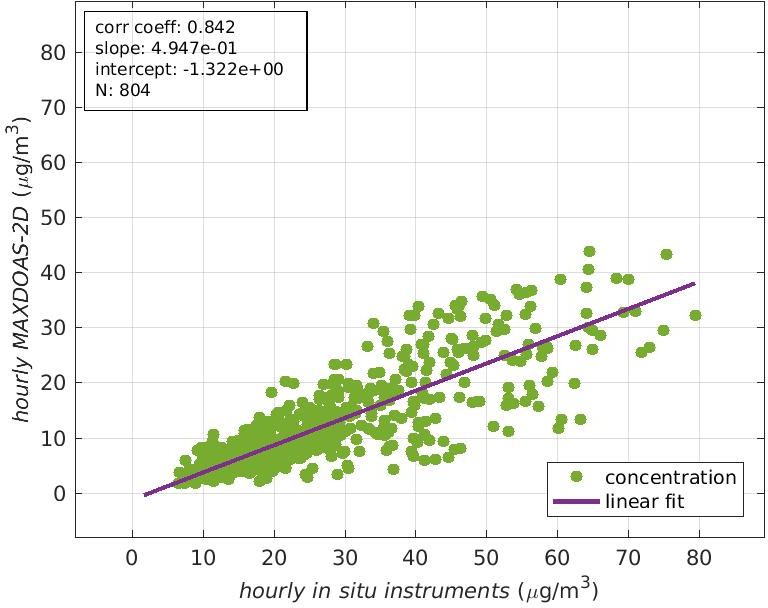
D. Garcia-Nieto et al.: Two-dimensional monitoring of air pollution in Madrid                                                    2947

Figure 4. Comparison of retrieved aerosols using two different atmospheric profiles: the US standard (atmosphere A) and the US standard
adapted to the altitude above sea level of Madrid (atmosphere B). The comparison was carried out for a clear sky day (11 May 2019).

extinction profiles are required to subsequently evaluate trace       vertical grid of the retrievals, we chose the following lay-
gas profiles since they strongly affect the relative light paths      ers: from the ground to 8 km height we used layers of 200 m
and hence the concentration profiles derived from them.               thickness. Then, we divided the remaining height, up to
   Once the light paths are computed, and with the purpose of         90 km, in levels of 2 km thickness each. We use the air num-
best simulating the measured DSCDs, a linear analysis pro-            ber density vertical profile since it is directly related to the
cess is performed for the measured DSCDs of the target trace          number of O4 absorptions and therefore to the O4 DSCDs.
gas, yielding the optimal vertical concentration profile. The         Hence the relative differences, particularly for lower VEAs,
vertical integration of this concentration profile is called the      between the measured and simulated O4 DSCDs are usually
vertical column density (VCD).                                        assigned to aerosol extinction. Note, however, as shown be-
   The retrieval consists of an iterative, nonlinear system of        low, that uncertainties in the air number density profiles –
equations, and hence there is no unique solution. This means          arising from uncertainties in the values or shape of the tem-
that an a priori profile is needed both for starting the itera-       perature and pressure profiles – could also contribute to such
tions and to avoid the final solution being nonrealistic (i.e.,       differences (Fig. 4).
with no physical meaning). In order to construct these a priori          Here we compare the simulation of O4 DSCDs using two
profiles, we used exponentially decreasing curves as follows:         different sets of atmospheric profiles: (i) the US standard and
                                                                    (ii) the same profile but interpolating the pressure profile to
          VCi         −z
ap (z) =       exp         ,                                 (2)      Madrid’s height above sea level (mean value of 667 m). This
           sh         sh                                              means that the temperature profile is assumed to be the same,
where ap (z) is the a priori vertical profile at a certain altitude   but the pressure profile is shifted less than 10 %, so there
z, VCi is the vertical integration of the profile for the MAX-        are no major variations within the profiles. The lower row in
DOAS cycle i, and sh is the scaling height constant. We used          Fig. 4 shows that both atmospheric profiles result in almost
0.5 km as the scaling height constant for all the a priori pro-       the same set of simulated O4 DSCDs; however, the aerosol
files (Hendrick et al., 2014). Regarding the VC, we assumed           extinction coefficients differ significantly (although less for
an AOD of 0.05 for the O4 retrieval, while for NO2 we ap-             the surface layer coefficients, defined as the extinction coeffi-
plied the geometrical approximation followed in Hönninger             cients within the ground layer, between 0 and 200 m height),
et al. (2004), taking the measured DSCD at VEA 30◦ for                and consequently, the AOD also varies. From this we infer
every MAXDOAS cycle. This approximation assumes that                  the following.
most of the absorption events are located below the scatter-
ing height.                                                             i. The retrieval is mainly driven by the measured DSCDs,
   With respect to the remaining atmospheric parameters, we                which leaves a relatively low weight for the chosen at-
chose typical values for urban environments: surface albedo                mospheric profiles (pressure and temperature). There-
of 0.07, correlation length of 0.4 km and an a priori covari-              fore, we can obtain consistent correlations between the
ance factor of 1 (see Hendrick et al., 2014). Concerning the               measured and simulated O4 DSCDs.

https://doi.org/10.5194/amt-14-2941-2021                                                Atmos. Meas. Tech., 14, 2941–2955, 2021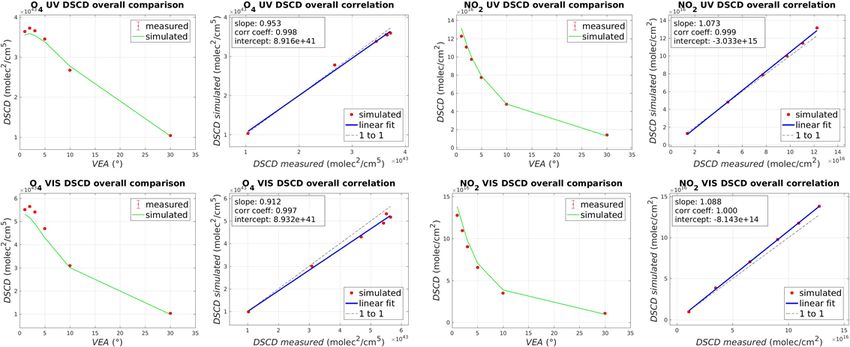
2948                                          D. Garcia-Nieto et al.: Two-dimensional monitoring of air pollution in Madrid

Figure 5. NO2 retrieval comparison using two different atmospheric profiles: the US standard (atmosphere A) and the US standard adapted
to the altitude above sea level of Madrid (atmosphere B). The comparison was carried out for a clear sky day (11 May 2019), considered as
representative of the measurement period.

 ii. We cannot reliably assign the extinction coefficients at          Table 3. Summary of average uncertainties of the retrieval in both
     each layer to aerosols (especially for atmospheric lay-           spectral regions.
     ers above the surface layer) but rather consider them as
     irradiance extinction coefficients.                                     Variable/trace gas      NO2 UV (%)      NO2 VIS (%)

Furthermore, we have assessed the impact of the pressure                     Irradiance extinction            7.7              5.1
and temperature profile choice on the trace gas retrieval. As                DSCD                             4.8              3.2
can be noted in Fig. 5, there is no significant effect coming                Surface mixing ratio             5.0              8.7
from this choice on the simulated NO2 DSCDs. These are                       Total                             10               11
basically the same (and with very good agreement with the
measured DSCDs), as well as the derived concentration co-
efficients and their integration (VCD).
   We further evaluated if a similar behavior can be expected          the horizontal distribution of NO2 . We use the estimated hor-
for larger variations in the pressure and temperature pro-             izontal light paths at two wavelengths, 360.8 and 477 nm, for
files. We first obtained the average surface temperature and           the surface layer (0–200 m height). The different light paths
pressure values during the campaign (May–July 2019). With              at 360.8 and 477 nm provide information about the horizon-
the inclusion of these values in the retrieval, we found that,         tal distribution of NO2 mixing ratios within the surface layer.
within the first 10 km height, the RMS values of the rela-             In order to evaluate these horizontal paths, we have a code
tive variations with respect to the standard atmosphere were           that implements the radiative transfer model (RTM) equa-
about 8 %. Although it is a small change, it is indeed not neg-        tions based on previous pioneering work (Solomon et al.,
ligible. Nonetheless, when evaluating light paths, the relative        1987). These equations yield a vector of scattering events
changes were below 2 %. Therefore, here we use the US stan-            along with their respective probabilities. If we take a VEA of
dard atmospheric profiles for the NO2 retrievals.                      0◦ (i.e., horizontal viewing), then the scalar product of such
   Table 3 summarizes the average uncertainties (using 1               vectors produces the length of the horizontal light path.
standard deviation for each component) of the retrieval,                  We computed this for every MAXDOAS cycle and for
along with their relative contributions, for the ground layer          both wavelengths, yielding typical – representative – hori-
(0–200 m height). The mean, overall uncertainty for NO2 in             zontal distances of about 8–10 km for the UV (at 360.8 nm)
both spectral regions is in the order of 10 %.                         and between 15 and 20 km for the VIS window (at 477 nm).
                                                                       The next step follows the “onion-peeling” approach proposed
4.3    Estimation of NO2 horizontal gradients                          by Ortega et al. (2016) (the strong dependence of scatter-
                                                                       ing with wavelength means that shorter wavelengths result in
Making use of the different paths that photons travel through          shorter light paths). We assign the UV (i.e., 360.8 nm) mix-
the atmosphere for different wavelengths, we can estimate              ing ratios (mruv ) and their expected horizontal paths (duv ) to

Atmos. Meas. Tech., 14, 2941–2955, 2021                                                  https://doi.org/10.5194/amt-14-2941-2021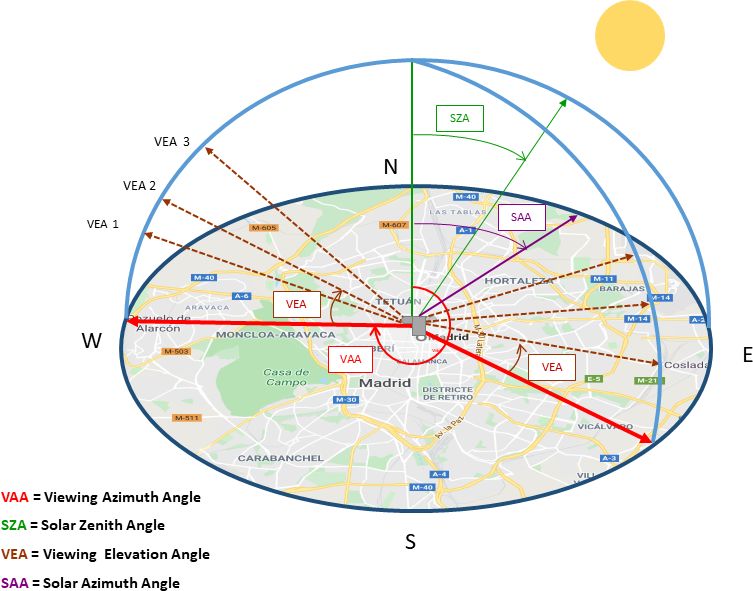
D. Garcia-Nieto et al.: Two-dimensional monitoring of air pollution in Madrid                                                     2949

Figure 6. Comparison between simulated and measured DSCDs of O4 and NO2 . Red dots represent the measured DSCDs for each VEA
averaged over the entire campaign.

Figure 7. Example of O4 and AOD retrievals in the UV region at 09:00 UTC on 11 May 2019. These contour plots are smoothed from
adjacent VAA data points separated by 20◦ in order to estimate the azimuthal distribution of the irradiance extinction coefficients over
Madrid.

the first peel (mrA , meaning zone A). Then the second peel           5     Results
(zone B, mrB ) can be derived as follows:
        mrvis × dvis − mruv × duv                                     5.1    O4 and NO2 DSCDs assessment
mrB =                             ,                           (3)
                   dvis
thereby deriving mixing ratios (mrA and mrB .) representative         An estimation of the overall goodness of the profile retrieval
of two different horizontal distances for each VAA.                   comes from the correlation between the measured and simu-
                                                                      lated DSCDs for the entire campaign (Fig. 6). The fit between
                                                                      the measured and the simulated DSCDs shows correlations
                                                                      (r 2 ) very close to 1 for both O4 and NO2 in the UV and VIS
                                                                      regions.

https://doi.org/10.5194/amt-14-2941-2021                                                 Atmos. Meas. Tech., 14, 2941–2955, 2021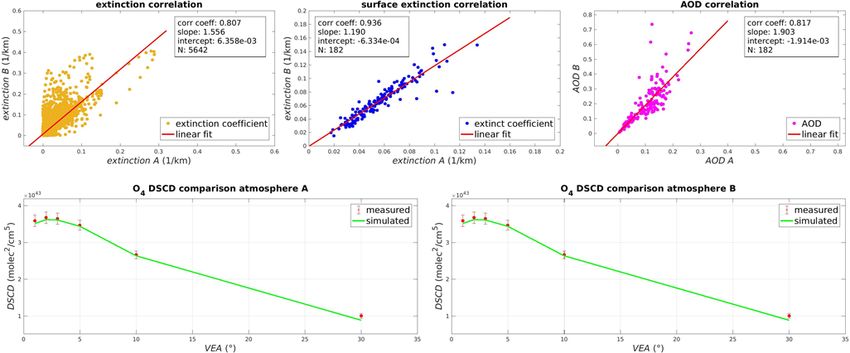
2950                                          D. Garcia-Nieto et al.: Two-dimensional monitoring of air pollution in Madrid

Figure 8. NO2 vertical distribution retrieved in the UV region at 06:00 UTC (a) and at 12:00 UTC (b) on 11 May 2019. These contour plots
are smoothed from adjacent VAA data points separated by 20◦ in order to estimate the azimuthal distribution of NO2 over Madrid.

5.2    Two-dimensional maps                                           to uplift of particulate matter emitted by traffic (there is a
                                                                      main road at that location) (Carnerero et al., 2018). Further
We now combine the VAA and height for each azimuthal                  research is needed to better establish the vertical distribution
cycle of the MAXDOAS-2D to generate a two-dimensional                 of aerosols in Madrid and their diurnal evolution.
concentration map. Figure 7 shows an example of the O4 re-               Figure 8 shows a two-dimensional representation of
trieval in the UV for a given azimuthal cycle. Figure 7 also          NO2 on 11 May 2019 at two different hours (06:00 and
shows the comparison and correlation of measured and sim-             12:00 UTC, respectively). Both contour plots show maxi-
ulated DSCDs for that azimuthal cycle along with the evo-             mum NO2 values of 12 ppbv (parts per billion by volume)
lution of retrieved AOD. The AOD varies between 0.05 and              at 06:00 UTC and 8 ppbv at 12:00 UTC when the instru-
0.18 within this azimuthal cycle (Fig. 7, upper panel). The           ment is pointing south (i.e., VAA of 180◦ ). We chose to
contour plot shows the irradiance extinction coefficient pro-         show this day as an example since it was a clear sky day
files with maximum values of 0.14 km−1 (near the ground               and yielded NO2 mixing ratios that were representative of
and at around 40◦ VAA) associated with aerosol extinction             the period of measurements. These values correspond to the
(see discussion in Sect. 4.2). Note the enhanced extinction at        layer near the ground and are in good agreement with our
about 2 km height pointing at 50◦ VAA. This could be due              previous MAXDOAS observations in Madrid (Garcia-Nieto

Atmos. Meas. Tech., 14, 2941–2955, 2021                                                 https://doi.org/10.5194/amt-14-2941-2021
D. Garcia-Nieto et al.: Two-dimensional monitoring of air pollution in Madrid 2951
Figure 9. HONO vertical distribution retrieved in the UV region at 06:00 UTC. These contour plots are smoothed from adjacent VAA data
points separated by 20◦ in order to estimate the azimuthal distribution of HONO over Madrid.
et al., 2018). The retrieved azimuthal distribution of NO2 located at the center of the plot. The highest mixing ratios
agrees with previous reports that show higher pollution lev- occur during the first sunlit hours (07:00–08:00 UTC), coin-
els in the southern part of Madrid (Picornell et al., 2019). cident with the morning peak of NOx emissions in Madrid
NO2 VCDs range from 5 × 10¹⁵ molec. cm−2 (at 12:00 UTC (Quaassdorff et al., 2016). This early morning peak is fol-
and pointing at 300◦ VAA) up to 15 × 1015 molec. cm−2 lowed by a gradual decrease in surface layer NO2 mixing
(at 12:00 UTC and pointing at 200◦ VAA), with an aver- ratios during the day. Note that NO2 is predominantly lo-
age value of 1 × 10¹⁶ molec. cm−2 . Although there are dif- cated in the southern part of the semisphere (VAA from 90 to
ferent NOx emission rates at both times of the day (06:00 270◦ ). In follow up work we will combine the horizontal dis-
and 12:00 UTC), the increase in the boundary layer height tribution of NO2 with a chemical transport model to further
(de la Paz et al., 2016) during the day contributes to the simi- understand NO2 transport dynamics throughout the day.
lar values of VCDs at both hours but generally lower surface
mixing ratios at 12:00 UTC. 5.4 Correlation with Madrid’s in situ air quality
We have also analyzed HONO DSCDs using the monitoring stations
same DOAS analysis configuration as in Garcia-Nieto et
al. (2018). Figure 9 shows a two-dimensional representation We suggest that MAXDOAS-2D mesoscale observations
of HONO on 11 May 2019 at 06:00 UTC. We retrieve sur- may complement the information provided by the local air
face layer peak values of 0.7 ppbv pointing at 50◦ VAA in quality monitoring network based on reference analytical
the early morning, which is in agreement with previous stud- techniques (according to Directive 2008/50/EC). While air
ies for HONO in urban environments (see Hendrick et al., quality monitors of the reference network provide infor-
2014; Ryan et al., 2018). The VCDs at 06:00 UTC range mation about ambient concentrations in their specific lo-
from 6 × 10¹⁴ to 1.2 × 10¹⁵ molec. cm−2 . cations (currently 24 air quality monitoring stations mea-
sure NO2 within the city; see AM, 2019), MAXDOAS-2D
5.3 Horizontal distribution of NO2 observations produce near-ground-level concentrations av-
eraged over the optical path in a given direction. That pre-
Based on Eq. (3), we derive the horizontal distribution of vents us from quantitatively comparing both types of obser-
NO2 in the surface layer (0–200 m height) using the mea- vations. Nonetheless, we analyzed their correspondence us-
sured NO2 DSCDs at a VEA of 1◦ (which can safely be re- ing the NO2 concentrations measured by the in situ instru-
garded as almost horizontal viewing since its mean scatter- ments throughout the entire city and the NO2 mixing ratios
ing height typically falls below 200 m height, i.e., within our within the surface layer derived from our MAXDOAS-2D
ground layer). Figure 10 shows an example of surface layer instrument over the 2-month period (May–June, 2019). For
NO2 mixing ratios over two radial distances horizontally this comparison, we considered the air quality monitoring
measured from the MAXDOAS-2D instrument (using the stations within a distance from the MAXDOAS-2D equal to
UV and the VIS NO2 , respectively, as explained in Sect. 4.3), or lower than 10 km (thus 20 air quality monitoring stations
https://doi.org/10.5194/amt-14-2941-2021 Atmos. Meas. Tech., 14, 2941–2955, 20212952 D. Garcia-Nieto et al.: Two-dimensional monitoring of air pollution in Madrid
Figure 10. Polar plots of NO2 within the surface layer (0–200 m height) for 11 May 2019. Please note that these polar plots extend over a
direction perpendicular to those shown in Fig. 8. Here, circles are used for the UV (shorter horizontal light path) and triangles for the VIS
(larger horizontal light path). Both symbols stand for the mean horizontal light path within the surface layer at each spectral region.
Despite the different spatial representativeness, Fig. 11
shows a reasonably good correlation coefficient of 0.842 be-
tween both datasets for the 2-month campaign. The slope
is lower than 1; this can be explained by the typical NO2
vertical profiles in urban environments. Simulations per-
formed over Madrid with a high-resolution Eulerian air qual-
ity model (Borge et al., 2018) yielded a NO2 profile exponen-
tially decreasing with height. Therefore, the MAXDOAS-2D
mixing ratios, which represent an average across the surface
layer (0–200 m height), are not expected to quantitatively
match the values of in situ instruments located close to the
surface (between 0–10 m height). Similar conclusions – and
slopes comparable to the one retrieved above – regarding the
correlation between in situ and MAXDOAS instruments can
be found in previous works (Schreier et al., 2020; Kramer et
al., 2008; Chan et al., 2020). In addition, there is a good tem-
Figure 11. Correlation between in situ observations from Madrid’s poral correlation between in situ and MAXDOAS-2D mea-
air quality monitoring network and those derived from the surements over an extended period of time.
MAXDOAS-2D instrument for the surface layer (0–200 m height).
6 Summary and conclusions
remain). Since this is the typical horizontal light path for the An analysis of O4 , NO2 and HONO vertical concentration
UV region, we decided to include only the NO2 values re- profiles in the urban atmosphere of Madrid (Spain) has been
trieved in the UV region for the comparison. Strong gradi- performed over 2 months (from 6 May to 5 July 2019).
ents between the values measured by the in situ instruments We analyzed the absorptions and derived the corresponding
are typical. Therefore, and considering that we are mainly DSCDs for both trace gases in the UV and VIS regions. Then,
interested in their temporal correlation with respect to our the corresponding profiles were retrieved using an RTM. In
measurements, we compare both the in situ NO2 and surface this step, we assessed the impact of different atmospheric
layer MAXDOAS-2D hourly averaged data. Note that for the profiles (pressure and temperature) in the retrieval results and
MAXDOAS-2D, this approximately corresponds to averag- found that the set of chosen atmospheric profiles has a small
ing the surface layer values for each azimuthal lap, given that impact on the O4 retrieval and the estimation of light paths.
each azimuthal lap takes approximately 1 h to complete. However, there is a noticeable change in the irradiance ex-
Atmos. Meas. Tech., 14, 2941–2955, 2021 https://doi.org/10.5194/amt-14-2941-2021D. Garcia-Nieto et al.: Two-dimensional monitoring of air pollution in Madrid 2953
tinction profiles which makes it difficult to quantitatively as- the TECNAIRE project (“Técnicas innovadoras para la evaluación y
sign extinction due to aerosols, especially in heights above mejora de la calidad del aire urbano”) S2013/MAE-2972. We would
the boundary layer. also like to thank Juan Ramón Moreta González (PI) and his staff for
The overall comparison of measured and simulated trace establishing and maintaining the AERONET sites in Madrid used in
gas DSCDs showed that they were in very good agreement this investigation. We acknowledge support of the publication fee
by the CSIC Open Access Publication Support Initiative through its
(with correlation coefficients close to 1), supporting the reli-
Unit of Information Resources for Research (URICI)
ability of the observations. The MAXDOAS-2D instrument
provides the first two-dimensional view (in height and VAA)
of pollution concentration in the city of Madrid. Explor- Financial support. This research has been supported by the
ing 1 d (11 May 2019) we compared two hours: the peak TECNAIRE PROJECT (grant no. S2013/mae-2972).
rush hour and noon time, obtaining NO2 maximum val-
ues of 12 and 8 ppbv, respectively, both maxima pointing We acknowledge support of the publication fee by the CSIC
in the southern direction. Two-dimensional HONO measure- Open Access Publication Support Initiative through its Unit of
ments were also made with mixing ratio peaks of 0.7 ppbv Information Resources for Research (URICI).
in the early morning and VCDs ranging from 6 × 10¹⁴ to
1.2 × 10¹⁵ molec. cm−2 .
We have also inferred information on the horizontal gradi- Review statement. This paper was edited by Daniel Perez-Ramirez
ent of NO2 within the surface layer making use of the strong and reviewed by three anonymous referees.
dependence between wavelengths and light paths across the
NO2 absorption spectrum. The resulting “onion-peeling” fig-
ures indicate peak values of NO2 in the early morning and in References
the southern section of the city (around 180◦ VAA), and it re-
sulted in a gradual decrease in NO2 mixing ratios during the Ayuntamiento de Madrid (AM): Madrid 2016 Annual Air Quality
day, with maximum values of NO2 appearing in the south- Assessment Report (Calidad del aire Madrid 2019), General Di-
ern part of the semisphere. Finally, we suggest that the new rectorate of Sustainability and Environmental Control, Madrid
mesoscale information provided by the MAXDOAS-2D in- City Council Available online, only Spanish version, avail-
able at: http://www.mambiente.munimadrid.es/opencms/calaire/
strument helps in the study of pollution transport dynamics.
Publicaciones/memoria_2019.html (last access: April 2020),
MAXDOAS-2D and in situ instruments provide different in-
2019.
formation, and thus combining both can improve our under- Benavent, N., Garcia-Nieto, D., Wang, S., and Saiz-Lopez, A.:
standing of the complex issue of air pollution in the city of MAX-DOAS measurements and vertical profiles of glyoxal and
Madrid. formaldehyde in Madrid, Spain, Atmos. Environ., 199, 357–367,
2019.
Borge, R., Narros, A., Artínano, B., Yagüe, C., Gómez-Moreno, F.
Code availability. The DOAS software and bePRO inversion algo- J., Paz, D. d. l., Román-Cascón, C., Díaz, E., Maqueda, G., Sas-
rithm used for this study are available at http://uv-vis.aeronomie. tre, M., and Quaassdorff, C., Dimitroulopoulou, C., Vardoulakis,
be/software (last access: 2 September 2017, Danckaert et al., 2017), S.: Assessment of micro-scale spatio-temporal variation of air
while the RTM codes applied to derive the light paths are available pollution at an urban hotspot in Madrid (Spain) through an ex-
upon request. tensive field campaign, Atmos. Environ., 140, 432–445, 2016.
Borge, R., Santiago, J. L., de la Paz, D., Martín, F., Domingo,
J., Valdés, C., Sánchez, B., Rivas, E., Rozas, M. T.,
Data availability. All study data are included in the article. Lázaro, S., Pérez, J., and Fernández, Á.: Application of a
short term air quality action plan in Madrid (Spain) un-
der a high-pollution episode – Part II: Assessment from
Author contributions. ASL devised the research. DGN and NB car- multi-scale modelling, Sci. Total Environ., 635, 1574–1584,
ried out the measurements and analyzed the data. DGN, NB, RB https://doi.org/10.1016/j.scitotenv.2018.04.323, 2018.
and ASL analyzed and interpreted the results. DGN wrote the Carnerero, C., Pérez, N., Reche, C., Ealo, M., Titos, G., Lee, H.-
manuscript with contributions from all coauthors. K., Eun, H.-R., Park, Y.-H., Dada, L., Paasonen, P., Kermi-
nen, V.-M., Mantilla, E., Escudero, M., Gómez-Moreno, F. J.,
Alonso-Blanco, E., Coz, E., Saiz-Lopez, A., Temime-Roussel,
B., Marchand, N., Beddows, D. C. S., Harrison, R. M., Petäjä,
Competing interests. The authors declare that they have no conflict
T., Kulmala, M., Ahn, K.-H., Alastuey, A., and Querol, X.: Ver-
of interest.
tical and horizontal distribution of regional new particle forma-
tion events in Madrid, Atmos. Chem. Phys., 18, 16601–16618,
https://doi.org/10.5194/acp-18-16601-2018, 2018.
Acknowledgements. The authors want to thank Manuel Perez and Chan, K. L., Wiegner, M., van Geffen, J., De Smedt, I., Alberti,
David Armenteros for technical assistance with the instrument and C., Cheng, Z., Ye, S., and Wenig, M.: MAX-DOAS measure-
David de la Paz for model assistance. This work was supported by ments of tropospheric NO2 and HCHO in Munich and the
https://doi.org/10.5194/amt-14-2941-2021 Atmos. Meas. Tech., 14, 2941–2955, 20212954 D. Garcia-Nieto et al.: Two-dimensional monitoring of air pollution in Madrid comparison to OMI and TROPOMI satellite observations, At- pact assessment by the implementation of Madrid City mos. Meas. Tech., 13, 4499–4520, https://doi.org/10.5194/amt- air-quality plan in 2020, Environ. Res., 183, 109021, 13-4499-2020, 2020. https://doi.org/10.1016/j.envres.2019.109021, 2020. Chance, K. and Kurucz, R. L.: An improved high-resolution solar Kramer, L. J., Leigh, R. J., Remedios, J. J., and Monks, reference spectrum for earth’s atmosphere measurements in the P. S: Comparison of OMI and ground-based in situ and ultraviolet, visible, and near infrared, Special Issue Dedicated to MAX-DOAS measurements of tropospheric nitrogen dioxide Laurence S. Rothman on the Occasion of his 70th Birthday 111, in an urban area, J. Geophys. Res.-Atmos., 113, D16S39, J. Quant. Spectrosc. Ra., 9, 1289–1295, 2010. https://doi.org/10.1029/2007JD009168, 2008. Clémer, K., Van Roozendael, M., Fayt, C., Hendrick, F., Hermans, Meller, R. and Moortgat, G. K.: Temperature dependence of the ab- C., Pinardi, G., Spurr, R., Wang, P., and De Mazière, M.: Multiple sorption cross sections of formaldehyde between 223 and 323 K wavelength retrieval of tropospheric aerosol optical properties in the wavelength range 225–375 nm, J. Geophys. Res.-Atmos., from MAXDOAS measurements in Beijing, Atmos. Meas. Tech., 105, 7089–7101, 2000. 3, 863–878, https://doi.org/10.5194/amt-3-863-2010, 2010. Monks, P. S., Granier, C., Fuzzi, S., Stohl, A., Williams, M. Cuevas, C., Notario, A., Adame, J., Hilboll, A., Richter, A., L., Akimoto, H., Amann, M.,Baklanov, A., Baltensperger, U., Burrows, J. P, and Saiz-Lopez, A.: Evolution of NO2 lev- Bey, I., Blake, N., Blake, R. S., Carslaw, K., Cooper, O. R., els in Spain from 1996 to 2012, Sci. Rep., 4, 5887, Dentener, F., Fowler, D., Fragkou, E., Frost, G. J., Generoso, https://doi.org/10.1038/srep05887, 2014. S., and von Glasow, R.: Atmospheric composition change – Danckaert, T., Fayt, C., Van Roozendael, M., De Smedt, I., global and regional air quality, Atmos. Environ., 43, 5268–5350, Letocart, V., Merlaud, A., and Pinardi, G.: QDOAS Software https://doi.org/10.1016/j.atmosenv.2009.08.021, 2009. user manual, Belgian Institute for Space Aeronomy, avail- Ortega, I., Coburn, S., Berg, L. K., Lantz, K., Michalsky, J., Ferrare, able at: https://uv-vis.aeronomie.be/software/QDOAS/QDOAS_ R. A., Hair, J. W., Hostetler, C. A., and Volkamer, R.: The CU manual.pdf, last access: 2 September 2017. 2-D-MAX-DOAS instrument – Part 2: Raman scattering prob- de la Paz, D., Borge, R., and Martilli, A.: Assessment of a ability measurements and retrieval of aerosol optical properties, high resolution annual WRF-BEP/CMAQ simulation for the ur- Atmos. Meas. Tech., 9, 3893–3910, https://doi.org/10.5194/amt- ban area of Madrid (Spain), Atmos. Environ., 144, 282–296, 9-3893-2016, 2016. https://doi.org/10.1016/j.atmosenv.2016.08.082, 2016. Peters, E., Wittrock, F., Großmann, K., Frieß, U., Richter, A., Dimitropoulou, E., Hendrick, F., Pinardi, G., Friedrich, M. M., Mer- and Burrows, J. P.: Formaldehyde and nitrogen dioxide over laud, A., Tack, F., De Longueville, H., Fayt, C., Hermans, C., the remote western Pacific Ocean: SCIAMACHY and GOME-2 Laffineur, Q., Fierens, F., and Van Roozendael, M.: Validation validation using ship-based MAX-DOAS observations, Atmos. of TROPOMI tropospheric NO2 columns using dual-scan multi- Chem. Phys., 12, 11179–11197, https://doi.org/10.5194/acp-12- axis differential optical absorption spectroscopy (MAX-DOAS) 11179-2012, 2012. measurements in Uccle, Brussels, Atmos. Meas. Tech., 13, 5165– Picornell, M., Ruiz, T., Borge, R., García-Albertos, P., de la 5191, https://doi.org/10.5194/amt-13-5165-2020, 2020. Paz, D., and Lumbreras, J.: Population dynamics based on European Environment Agency (EEA): Air quality in mobile phone data to improve air pollution exposure as- Europe – 2019 report, EEA Technical Report No sessments, J. Expo. Sci. Environ. Epidemiol., 29, 278–291, 10/2019, ISBN: 978-92-9480-088-6, available at: https: https://doi.org/10.1038/s41370-018-0058-5, 2019. //www.eea.europa.eu/publications/air-quality-in-europe-2019 Plane, J. M. C. and Saiz-Lopez, A.: UV-Visible Differential Optical (last access: May 2020), 2019. Absorption Spectroscopy (DOAS), in: Analytical Techniques for Hendrick, F., Müller, J.-F., Clémer, K., Wang, P., De Mazière, Atmospheric Measurement, edited by: Heard, D. E., Blackwell M., Fayt, C., Gielen, C., Hermans, C., Ma, J. Z., Pinardi, G., Publishing, Oxford, 553 pp., 2006. Stavrakou, T., Vlemmix, T., and Van Roozendael, M.: Four Platt, U. and Stutz, J.: Differential Optical Absorption Spec- years of ground-based MAX-DOAS observations of HONO and troscopy: Principles and Applications, Springer Berlin Heidel- NO2 in the Beijing area, Atmos. Chem. Phys., 14, 765–781, berg, Berlin, Heidelberg, 608 pp., 2008. https://doi.org/10.5194/acp-14-765-2014, 2014. Quaassdorff, C., Borge, R., Pérez, J., Lumbreras, J., de la Garcia-Nieto, D., Benavent, N., and Saiz-Lopez, A.: Measurements Paz, D., and de Andrés, J. M.: Microscale traffic simula- of atmospheric HONO vertical distribution and temporal evolu- tion and emission estimation in a heavily trafficked round- tion in Madrid (Spain) using the MAXDOAS technique, Sci. To- about in Madrid (Spain), Sci. Total Environ., 566, 416–427, tal Environ., 643, 957–966, 2018. https://doi.org/10.1016/j.scitotenv.2016.05.051, 2016. Gorshelev, V., Serdyuchenko, A., Weber, M., Chehade, W., and Rodgers, C. D.: Inverse Methods for Atmospheric Sounding: Burrows, J. P.: High spectral resolution ozone absorption cross- Theory and Practice, World Scientific Publishing, Singapore, sections – Part 1: Measurements, data analysis and comparison 256 pp., 2000. with previous measurements around 293 K, Atmos. Meas. Tech., Rothman, L. S., Gordon, I. E., Barber, R. J., Dothe, H., Gamache, 7, 609–624, https://doi.org/10.5194/amt-7-609-2014, 2014. R. R., Goldman, A., Perevalov, V. L., Tashkum, S. A., Hönninger, G., von Friedeburg, C., and Platt, U.: Multi axis dif- and Tennyson, J.: HITEMP, the high-temperature molecular ferential optical absorption spectroscopy (MAX-DOAS), At- spectroscopic database, J. Quant. Spectrosc. Ra. 111, 2139, mos. Chem. Phys., 4, 231–254, https://doi.org/10.5194/acp-4- https://doi.org/10.1016/j.jqsrt.2010.05.001, 2010. 231-2004, 2004. Ryan, R. G., Rhodes, S., Tully, M., Wilson, S., Jones, N., Frieß, Izquierdo, R., García Dos Santos, S., Borge, R., Paz, D. de U., and Schofield, R.: Daytime HONO, NO2 and aerosol distri- la, Sarigiannis, D., Gotti, A., and Boldo, E.: Health im- butions from MAX-DOAS observations in Melbourne, Atmos. Atmos. Meas. Tech., 14, 2941–2955, 2021 https://doi.org/10.5194/amt-14-2941-2021
D. Garcia-Nieto et al.: Two-dimensional monitoring of air pollution in Madrid                                                             2955

   Chem. Phys., 18, 13969–13985, https://doi.org/10.5194/acp-18-          Volkamer, R., Spietz, P., Burrows, J., and Platt, U.: High-resolution
   13969-2018, 2018.                                                        absorption cross-section of glyoxal in the UV-vis and IR spectral
Saiz-Lopez, A., Borge, R., Notario, A., Adame, J. A., Paz, D.,              ranges, J. Photochem. Photobiol. Chem., 172, 35–46, 2005.
   Querol, X., Artíñano, B., Gómez-Moreno, F. J., and Cuevas,             Wagner, T., Beirle, S., Benavent, N., Bösch, T., Chan, K. L., Don-
   C. A.: Unexpected increase in the oxidation capacity of the              ner, S., Dörner, S., Fayt, C., Frieß, U., García-Nieto, D., Gielen,
   urban atmosphere of Madrid, Spain, Sci. Rep., 7, 45956,                  C., González-Bartolome, D., Gomez, L., Hendrick, F., Henzing,
   https://doi.org/10.1038/srep45956, 2017.                                 B., Jin, J. L., Lampel, J., Ma, J., Mies, K., Navarro, M., Peters,
Schreier, S. F., Richter, A., Peters, E., Ostendorf, M., Schmal-            E., Pinardi, G., Puentedura, O., Puk, ıte, J., Remmers, J., Richter,
   wieser, A. W., Weihs, P., and Burrows, J. P: Dual ground-based           A., Saiz-Lopez, A., Shaiganfar, R., Sihler, H., Van Roozendael,
   MAX-DOAS observations in Vienna, Austria: Evaluation of hor-             M., Wang, Y., and Yela, M.: Is a scaling factor required to ob-
   izontal and temporal NO2 , HCHO, and CHOCHO distributions                tain closure between measured and modelled atmospheric O4
   and comparison with independent data sets, Atmos. Environ., 5,           absorptions? An assessment of uncertainties of measurements
   https://doi.org/10.1016/j.aeaoa.2019.100059, 2020.                       and radiative transfer simulations for 2 selected days during
Solomon, S., Sanders, R. W., and Schmeltekopf, A. L.: On the Inter-         the MAD-CAT campaign, Atmos. Meas. Tech., 12, 2745–2817,
   pretation of Zenith Sky Absorption Measurements, J. Geophys.             https://doi.org/10.5194/amt-12-2745-2019, 2019.
   Res., 92, 8311–8319, 1987.                                             Wang, S., Cuevas, C. A., Frieß, U., and Saiz-Lopez, A.: MAX-
Stutz, J., Kim, E. S., Platt, U., Bruno, P., Perrino, C., and Febo, A.:     DOAS retrieval of aerosol extinction properties in Madrid, Spain,
   UV-visible absorption cross sections of nitrous acid, J. Geophys.        Atmos. Meas. Tech., 9, 5089–5101, https://doi.org/10.5194/amt-
   Res.-Atmos., 105, 14585–14592, 2000.                                     9-5089-2016, 2016.
Thalman, R. and Volkamer, R.: Temperature dependent absorption            World Health Statistics (WHO): monitoring health for the SDGs,
   cross-sections of O2 -O2 collision pairs between 340 and 630 nm          Wold Health Organization, available at: https://apps.who.int/iris/
   and at atmospherically relevant pressure, Phys. Chem. Chem.              handle/10665/324835 (last access: May 2020), 2019.
   Phys., 15, 15371–15381, 2013.                                          Yang, T., Si, F., Luo, Y., Zhan, K., Wang, P., Zhou, H., Zhao, M.,
Vandaele, A. C., Hermans, C., Simon, P. C., Carleer, M., Colin,             and Liu, W.: Source contribution analysis of tropospheric NO2
   R., Fally, S., Mérienne, M. F., Jenouvrier, A., and Coquart,             based on two-dimensional MAX-DOAS measurements, Atmos.
   B.: Measurements of the NO2 absorption cross-section from                Environ., 210, 186–197, 2019.
   42 000 cm−1 to 10 000 cm−2 (238–1000 nm) at 220 K and
   294 K, J. Quant. Spectrosc. Ra., 59, 171–184, 1998.

https://doi.org/10.5194/amt-14-2941-2021                                                     Atmos. Meas. Tech., 14, 2941–2955, 2021
You can also read