Natural photonics for industrial inspiration
←
→
Page content transcription
If your browser does not render page correctly, please read the page content below
Downloaded from http://rsta.royalsocietypublishing.org/ on May 10, 2015

                                                    Phil. Trans. R. Soc. A (2009) 364, 1759–1782
                                                                       doi:10.1098/rsta.2009.0016

                                              REVIEW

        Natural photonics for industrial inspiration
                                B Y A NDREW R. P ARKER 1,2, *
       1
        Department of Zoology, Natural History Museum, London SW7 5BD, UK
   2
       Department of Biological Sciences, University of Sydney, NSW 2006, Australia

There are two considerations for optical biomimetics: the diversity of submicrometre
architectures found in the natural world, and the industrial manufacture of these.
A review exists on the latter subject, where current engineering methods are considered
along with those of the natural cells. Here, on the other hand, I will provide a modern
review of the different categories of reflectors and antireflectors found in animals,
including their optical characterization. The purpose of this is to inspire designers within
the $2 billion annual optics industry.
                           Keywords: optics; biomimetics; photonics

                                        1. Introduction

The evolution of optical reflectors in animals began soon after the first eye
evolved. Trilobites are the first animals known to host image-forming eyes, of ca
521 Ma (figure 1); eyes that contain efficient optics in their own right (Parker
1998, 2003). In the absence of vision, any incidental iridescence appearing before
the Cambrian period would have been neutrally selective. But with the evolution
of the eye, the size, shape, colour and behaviour of animals were revealed for the
first time. Consequently, adaptive optical devices in nature were born.
   Soon after the first eyes, at least by 508 Ma (Parker 1998; new date for the
Burgess Shale fossils), animals began to evolve sophisticated optical reflectors—
nanostructures that interact with (reflect, refract and diffract) light rays, such
as surface corrugations or internal stacks of thin layers. Today we find an array
of optical reflectors in animals that have resulted from millions of years
of evolutionary ‘fine-tuning’. For example, the corrugations on the surface of
cypridinid ostracod (crustacean) setae that diffract a spectrum used as a
courtship display have improved in optical efficiency throughout the evolution of
the group (Parker 1995). Maybe, then, nature’s optical designs can be useful for
commerce. Indeed, the first butterfly scale reflectors have been reproduced
recently using industrial methods (Wong et al. 2003; Parker & Townley 2007).

* Address for correspondence: Department of Zoology, Natural History Museum, London SW7
5BD, UK (a.parker@nhm.ac.uk).
One contribution of 9 to a Theme Issue ‘Biomimetics II: fabrication and applications’.

                                                 1759           This journal is q 2009 The Royal Society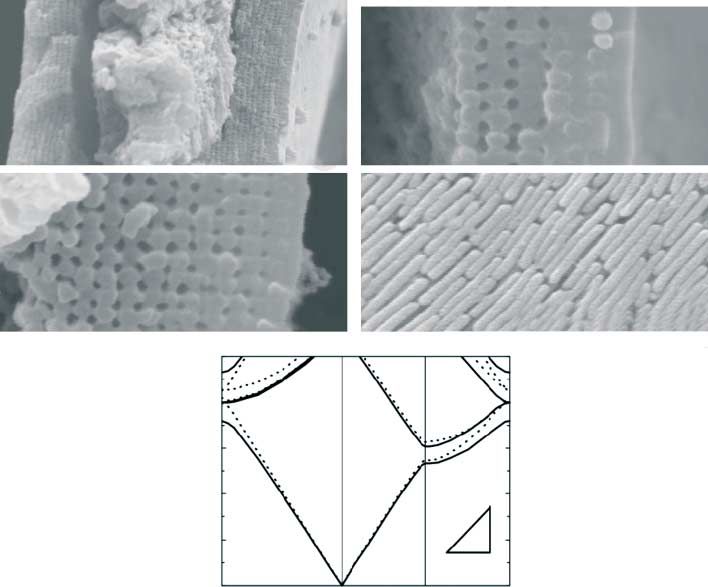
Downloaded from http://rsta.royalsocietypublishing.org/ on May 10, 2015

1760                                         A. R. Parker

Figure 1. Cambropallas trilobite from Morocco, ca 521 Ma, anterior view (widthZ12 cm). Eyes are
protruding from the head shield (left eye is casting a shadow)—this was one of the first animals
on Earth with an image-forming eye.

   The relatively bright, directional effect of most optical reflectors in nature
(including their ultraviolet component) is termed structural colour, which
separates it from the comparatively duller, diffuse effect of chemical pigments.
However, matt colours, similar to those of pigments, are also known to result
from some structures (e.g. Kertész et al. 2006). Traditionally, biologists have
found helpful the classification of structural colours into the categories of
(random) scattering, diffraction gratings, multilayer reflectors and liquid
crystals. The last paper thoroughly reviewing these structures in nature,
beginning with the first identified (Newton’s study of peacock feathers in
1704) and detailing their diversity and biological functions, was published in
2000 (Parker 2000). All of these structures fall into a category of optical devices
that I will term ‘simple’ optics because the single-scattering approximation
(or ‘first Born approximation’) applies to them. That is, once a light ray is
scattered/reflected for the first time within the structure, it is not scattered
again. This is an estimation—indeed, wavelength is a factor (this approxima-
tion is even more appropriate for X-rays, which are difficult to scatter, but less
appropriate for electrons)—but provides justification to employ non-rigorous
physics to explain reflections. This is particularly useful for biologists.
However, in 2001 the first reflector requiring ‘complex’ optics was identified in
animals (Parker et al. 2001), which attracted groups of physicists and
engineers to the subject. In complex optical reflectors, each individual light
ray is scattered more than once (sometimes many times, depending on the
complexity of the nanostructure)—it is reflected from optical boundary to
optical boundary.

                                2. Simple optical reflectors

                                    (a ) Scattering structures
Forms of random scattering can result in either a white, diffuse appearance, or
a blue coloured, diffuse effect (red when the system is viewed in transmission).

Phil. Trans. R. Soc. A (2009)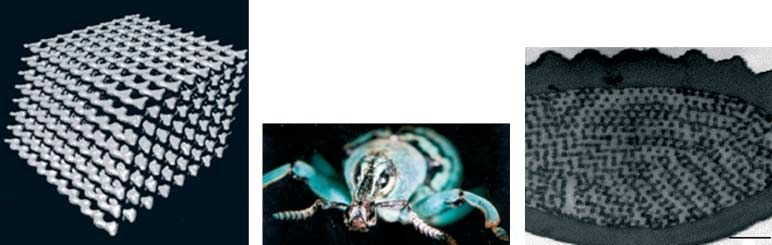
Downloaded from http://rsta.royalsocietypublishing.org/ on May 10, 2015

                      Review. Natural photonics for industrial inspiration                 1761

                                      reflected light

                  incident
                                                                           transmitted
                     white
                                                                           light
                      light

                                      reflected light

Figure 2. Diagrammatic representation of a scattering system. Horizontal lines represent incident
                             light, other lines are scattered light.

(i) White scattering structures
   Simple, equal scattering of all spectral wavelengths results in the observation
of a diffuse white effect. This commonly arises from the effects of some non-
periodic arrangements of colloidally dispersed matter where the different
materials involved have different refractive indices (e.g. figure 2), or from solid
colourless materials in relatively concentrated, thick layers (Fox 1976). In some
colloidal systems, where the particles are larger than the wavelength of light and
are spaced at distances greater than their size, they can be thought of as mirrors
oriented in all directions. The reflection is polarized unless the incident light is at
normal incidence on the system and, in the colloidal system, spherical or
randomly arranged particles are involved.
   Many white bird feathers are so coloured due to non-periodic arrangements of
reflecting elements, causing the random scattering of all wavelengths into all
directions and thus a diffuse white reflection.
   From some scales of extant butterfly wings, light is scattered uniformly and
completely in all directions, due to the chaotic disposition of the surfaces. Matt or
pearly whites may be observed depending on the complexity or the arrangement
of the structures, which affects the relative degree of scattering (Mason 1927).
   The colloidal system involves either a gas-in-solid, gas-in-liquid, liquid-
in-liquid (emulsions) or solid-in-liquid (Fox 1976). For example, the gas-in-liquid
system is partly responsible for the white body and/or tentacles of certain
anemones today (Fox 1976). Light is reflected and refracted at the surfaces of the
particles of matter or spaces (with dimensions greater than 1 mm; Mason 1927).
An unordered (as opposed to periodic) group of closely spaced setae, such as
those in patches on the extant fly Amenia sp., may form a white reflection via
random scattering or reflection.
   Reflection and refraction that occur at the interfaces of strata with different
refractive indices may result in the display of white light. The degree of whiteness
depends on the difference in refractive indices (Fox 1976). This mechanism
is evident in the shells of many lamellibranch molluscs (Verne 1930). Between
the outer, often pigmented layer and the mantle is a thick middle layer of
crystalline calcium carbonate. In most species, these laminations are sufficiently
thick (greater than 1 mm) to render the inner lining white.

Phil. Trans. R. Soc. A (2009)
Downloaded from http://rsta.royalsocietypublishing.org/ on May 10, 2015
1762 A. R. Parker
(ii) Blue scattering structures
Tyndall or Mie scattering occurs in a colloidal system where the particle size
approximates the wavelength of light. Here, diffraction is important. Light is
diffracted from the scattering elements but the reflection is inversely proportional
to the fourth power of the wavelength. This means that shorter wavelength blues
are diffracted more than the longer wavelength reds, and the reflection appears
blue (the transmitted portion appears red). Rayleigh scattering may also occur in
molecules in a two-photon process by which a photon is absorbed and raises the
molecule to an exited electronic state from which it re-radiates a photon when it
returns to the ground state. Diffraction is not involved here.
Tyndall scattered light is polarized under obliquely incident light. The relative
sizes of particles determine the shade of blue. If the particles responsible for the
scattering coalesce to form particles with a diameter greater than approximately
1 mm, then white light is observed (see §2a(i) above). A gradation from blue to
white scattering (‘small’ to ‘large’ particles) occurs on the wings of the extant
dragonfly Libellula pulchella (Mason 1927).
Scattered blues can also be found in other extant dragonflies. In the aeschnids
and agrionids, the epidermal cells contain ‘minute’ colourless granules and a dark
base. The males of libellulids and agrionids produce a waxy secretion that
scatters light similarly over their dark cuticle. The green of the female Aeschna
cyanea is the combined result of Tyndall scattering and a yellow pigment, both
within the epidermal cells (degradation of the yellow pigment turns the dead
dragonfly blue; Fox & Vevers 1960).
Scattered blues are also observed from the skin of the extant cephalopod
(Mollusca) Octopus bimaculatus (Fox 1976), where a broad blue ring surrounds
ocelli. Blue light is scattered from this region as a result of fine granules of purine
material within cells positioned above melanophore cells (Fox 1976). The colour
and conspicuousness of the ring are controlled by the regulation of the
melanophores, by varying the distribution of melanin and consequently
the density of the absorbing screen. The squid Onychia caribaea can produce
rapidly changing blue colours, similarly (Herring 1994). Importantly, there is no
constructive interference between the reflected rays from both white and blue
scattering systems where their particles are dispersed at distances larger than
their diameter—they are known as ‘incoherent’ reflectors.
Not all assumptions of blue scattering are correct, however. As far back as 1934,
C. V. Raman doubted that scattering was the cause of all blue bird feathers (Raman
1934). Then, in 1971 Jan Dyck suggested that the reflecting elements within blue
bird feathers (such as small air spaces within a spongy matrix) may actually provide
a coherent reflection, whereby they act as ‘layers’ within a multilayer reflector
(Dyck 1971). Rick Prum and his colleagues substantiated this idea to great effect
using a two-dimensional Fourier analysis to demonstrate that the blues of some
extant bird feathers, previously thought to result from scattering structures, were in
fact the result of coherent reflectors (Prum et al. 1998, 1999; see §2d,e).
(b ) Diffraction gratings
When light interacts with a periodic surface consisting for example of a series
of parallel grooves, it may be deviated from the direction of simple transmission
or reflection. For this to happen, the light that is scattered or diffracted from
Phil. Trans. R. Soc. A (2009)Downloaded from http://rsta.royalsocietypublishing.org/ on May 10, 2015
Review. Natural photonics for industrial inspiration 1763
first-order spectrum
x
grating
y
normal
incident beam
diffracted
beams second-
order
spectrum
diffraction grating
Figure 3. Reflection-type diffraction grating dividing white light into spectra. Rays scattered from
different points on the grating interfere either constructively or destructively.
successive grooves should be out of phase by integral values of 2p. This occurs
when for a given direction of propagation the optical path difference via
successive grooves is ml, where m is an integer known as the diffraction order.
This may be expressed by the grating equation
2wðsin qi Ksin qm Þ Z ml;
where qi and qm are the angles of incidence and diffraction, respectively, and w is
the period (figure 3).
A diffraction grating gives rise to coloration because constructive interference
for different wavelengths is fulfilled under different angles according to the above
equation. For a ‘non-blazed’ grating, although the effect changes with angle of
incidence it is less critical than it is with multilayer reflectors (see below) and the
visual appearance is different. For a parallel beam of white light incident upon a
multilayer, a family of wavelengths will be reflected as determined by the
so-called ‘Bragg condition’, although often only one of these wavelengths falls
within the visible range. The same beam incident upon a non-blazed grating will
be dispersed into spectra. The complete spectrum reflected nearest to the
perpendicular (grating normal) is the first order. The first-order spectrum is
reflected over a smaller angle than the second-order spectrum, and the colours
are more saturated and appear brighter within the former. Diffraction gratings
have polarizing properties, but this is strongly dependent on the grating profile.
The earliest known examples of diffraction gratings, or indeed any form of
structural colour, are from the Cambrian period and belong to the famous
Burgess Shale animals of the Canadian Rockies, 508 Ma (Parker 1998). These
linear, two-dimensional diffraction gratings have not survived in their entirety,
rather as mosaics (e.g. figure 4), but always run in the same direction relative to
a spine, even where it curves (suggesting that the gratings are not artefacts of
geological processes). Therefore, to observe the original colours, the surface must
be reconstructed in photoresist. Most colours in sunlight would have existed in
the original environments of the Burgess animals, and their colours probably
functioned as warnings to predators with eyes—to emphasize the strong,
protective spines on which they are accommodated.
Phil. Trans. R. Soc. A (2009)Downloaded from http://rsta.royalsocietypublishing.org/ on May 10, 2015
1764 A. R. Parker
(a)
(b)
(c)
(d )
Figure 4. Micrographs of the Burgess stem-group polychaete Canadia spinosa at increasing
magnification—from !10 to !4000. (a) The anterior half of the animal, (b,c) details of paleae
(spines) and (d ) the surface of a palea as removed from the rock matrix, revealing the remnants of
a diffraction grating with a ridge spacing of 900 nm.
Today diffraction gratings are particularly common in butterflies (Ingram &
Parker 2008; Ingram et al. 2008) and on the setae or setules (hairs) of
crustaceans. The ostracod (seed shrimp) Euphilomedes carcharodonta, for
example, houses a diffraction grating on the rostrum, a continuous flattened
area of the carapace that is corrugated to form periodic ridges. Cylindroleberidid
ostracods possess a comb on their maxilla bearing numerous fine setules on each
Phil. Trans. R. Soc. A (2009)Downloaded from http://rsta.royalsocietypublishing.org/ on May 10, 2015
Review. Natural photonics for industrial inspiration 1765
(b)
(a)
Figure 5. (a) Scanning electron micrograph of the diffraction grating on a single halophore of the
cypridinid ostracod Azygocypridina lowryi (left, ridge spacingZ600 nm). (b) Frame from a video
recording of a mating pair of the cypridinid ostracod Skogsbergia sp. (length of individualZapprox.
2 mm). The male is above and has released its iridescent hairs (arrowed) from within its shell, and
consequently iridescence is displayed to the female (below).
seta, collectively forming a grating with a periodicity of approximately 500 nm.
Cypridinid ostracods (Myodocopida) contain diffraction gratings on their
halophores (setules) of their first antennae (Parker 1995). This character is
sexually dimorphic and employed by males as a courtship display (figure 5).
Also, many polychaetes possess gratings on their setae. For example, the opheliid
Lobochesis longiseta bears gratings with periodicities of the order of 500 nm.
(c ) ‘Liquid crystals’
Chiral forms of liquid crystals are found in nature. The helicoidal arrangement
of the microfibrils comprising the outer 5–20 mm of the cuticle (the ‘exocuticle’)
of certain scarabeid beetles, such as Plusiotis resplendens, gives rise to metallic
colours (Neville & Caveney 1969). Here, the fibrils are arranged in layers, with
the fibril axis in each layer arranged at a small angle to the one above, so that
after a number of layers the fibrillar axis comes to lie parallel to the first layer.
Thus, going vertically down through the cuticle, one corresponding peak and
trough of a diffraction grating will be encountered with every 3608 rotation of the
fibrils—the ‘pitch’ of the system. Polarized light encounters an optically
reinforcing plane every half turn of the helix. The system provides a peak
reflectance at lZ2nd, where d is the separation of analogous planes, or half the
pitch of the helix (figure 6). In fact, it approximates a diffraction grating except
for the polarization properties; the helical arrangement of fibrils reflects light that
is circularly or elliptically polarized (Nassau 1983).
(d ) Narrowband (coloured) multilayer reflectors (including single thin films)
Light may be strongly reflected by constructive interference between
reflections from the different interfaces of a stack of thin films (of actual
thickness d ) of alternately high and low refractive index (n). For this to occur,
Phil. Trans. R. Soc. A (2009)Downloaded from http://rsta.royalsocietypublishing.org/ on May 10, 2015
1766 A. R. Parker
Figure 6. A ‘liquid crystal’ composed of nanofibres arranged in layers, where the nanofibres of one
layer lie parallel to each other, yet are orientated slightly differently to those of adjacent layers.
Hence, spiral patterns can be distinguished within the structure. The height of the section shown
here—one ‘period’ of the system—is approximately 200 nm.
the reflections from successive interfaces must emerge with the same phase
and this is achieved when the Bragg condition is fulfilled (figures 7 and 8). The
optical path difference between the light reflected from successive interfaces is an
integral number of wavelengths and is expressed in the equation
2nd cos Q Z ðm C 1=2Þl;
from which it can be seen that the effect varies with angle of incidence
(Q, measured to the surface normal), wavelength (l) and the optical thickness of
the layers (nd ). There is a phase change of half a wavelength in waves reflected
from every low-to-high refractive index interface only (figure 7). The optimal
narrowband reflection condition is therefore achieved where the optical thickness
(nd ) of every layer in the stack is a quarter of a wavelength. In a multilayer
consisting of a large number of layers with a small variation in index, the process
is more selective than one with a smaller number of layers with a large difference
of index. The former therefore gives rise to more saturated colours corresponding
to a narrow spectral bandwidth and these colours therefore vary more with a
change of angle of incidence. Both conditions can be found in animals—different
coloured effects are appropriate for different functions under different conditions.
For an oblique angle of incidence, the wavelength of light that interferes
constructively will be shorter than that for light at normal incidence. Therefore,
as the angle of the incident light changes, the observed colour also changes.
Iridescence caused by such interference disappears after (complete) gold coating
because transmission of light through the outer surface is prevented.
If the dimensions of the multilayer system deviate from the quarter-
wave condition (i.e. nd is not equal for all layers), then the reflector is known
as ‘non-ideal’ (Land 1972) in a theoretical sense (but may be ideal in
a behavioural sense). Non-ideal reflectors provide a reduced proportional reflectance
and narrower bandwidth for a given number of layers. However, a narrow
bandwidth, and a less conspicuous reflection, is sometimes selected for in animals.
Phil. Trans. R. Soc. A (2009)Downloaded from http://rsta.royalsocietypublishing.org/ on May 10, 2015
Review. Natural photonics for industrial inspiration 1767
half-wavelength
phase change air
no phase film
change (e.g. fly’s wing)
air
Figure 7. Light rays affected by a single thin layer, such as a fly’s wing, in air. The layer is shown in
cross section; the light ray path and wave profiles are illustrated as solid lines (incoming light) and
dashed lines (reflected light).
Figure 8. A narrowband (‘ideal’) multilayer reflector composed of thin (approx. 100 nm thick)
layers of alternating refractive index, where the light rays reflected from each interface in the
system superimpose either constructively or destructively (some degree of refraction occurs).
Reflected rays are in phase when all the layers are approximately a quarter of their wavelength in
optical thickness.
Multilayer reflectors polarize light incident at Brewster’s angles. This is
approximately 548 for a quarter-wave stack of guanine and cytoplasm. At very
oblique angles, all wavelengths are strongly reflected from a multilayer.
Single-layer reflectors are found commonly in nature today, where light is
reflected, and interferes, from the upper and lower boundaries (figure 7).
A difference in the thickness of the layer provides a change in the colour observed
from unidirectional polychromatic light. The wings of some houseflies act as
a single thin film and reflect different wavelengths as a result of this phenomenon
(Fox & Vevers 1960). A single quarter-wavelength film of guanine in cytoplasm,
for example, reflects approximately 8 per cent of the incident light (Land 1978).
Phil. Trans. R. Soc. A (2009)Downloaded from http://rsta.royalsocietypublishing.org/ on May 10, 2015
1768 A. R. Parker
Figure 9. Transmission electron micrograph of the iridescent cuticle of the swimming crab Ovalipes
molleri. Layers are approximately 100 nm thick.
However, in a multilayer reflector with 10 or more high index layers, reflection
efficiencies can reach 100 per cent (Land 1972; figure 9b). Thus, animals possessing
such reflectors may appear highly metallic.
Multilayer reflectors are the most common form of structural colour in animals
today. They are usually extracellular, produced by periodic secretion and deposition,
but sometimes occur within cells. Guanine (nZ1.83) is a common component in
invertebrate reflectors because it is one of the very few biological materials with a
high refractive index and is readily available to most invertebrates as a nitrogen-
ous metabolite (Herring 1994). However, arthropods, including insects, crustaceans
and spiders, have largely ignored guanine in favour of pteridines (Herring 1994).
Also surprising is that the reflector material of closely related species, e.g. the
molluscs Pecten (scallop) and Cardium (cockle), may differ (Herring 1994).
Multilayers produce optical effects in living and fossil beetle cuticle from
highly metallic colours (‘ideal’ system) to rather dull greens (non-ideal system in
combination with scattering; Parker et al. 1998a; Parker & McKenzie 2003;
Vigneron et al. 2005, 2007). They are also responsible for the colours reflected
from the wings of many butterflies (Ingram & Parker 2008), where layers of
chitin (nZapprox. 1.56) are supported by ribs protruding vertically from the
scales. Air (nZ1.0) fills in the spaces and provides the alternate layers of
the system. A layer of melanin (a black or brown pigment) often underlies the
reflector and intensifies the metallic coloured effect by absorbing the transmitted
portion of incident light. For example, in beetles the elytra of Anoplognathus
parvulus appear metallic gold, green or yellow in reflected light and diffuse
brown in transmitted light (Parker et al. 1998a). Individual butterfly scales have
been examined in detail to reveal a number of variations in quarter-wave stacks,
sometimes in combination with other optical structures, to provide a range of
coloured effects (e.g. Ghiradella 1989; Vukusic et al. 2000; Kinoshita et al. 2002).
Butterfly scales are three-dimensional submicrometre structures in their basic
form, and this has provided a foundation for evolution to produce the
most diverse array of optical devices in any taxon, forming a subject in their
own right.
Phil. Trans. R. Soc. A (2009)Downloaded from http://rsta.royalsocietypublishing.org/ on May 10, 2015
Review. Natural photonics for industrial inspiration 1769
(a) (b) (c)
Figure 10. Three ways of achieving a broadband wavelength-independent reflector in a multilayer
reflector (high refractive index material is shown shaded; Parker et al. 1998a). (a) Three quarter-
wave (narrowband) stacks, each tuned to a different wavelength, such as a ‘red’, ‘green’ and ‘blue’.
(b) A ‘chirped’ stack, where layer thickness, and consequently the wavelength reflected in phase,
decreases systematically with depth in the stack. (c) A ‘chaotic’ stack, where layers of different
thickness are arranged randomly within the stack. The first type can be found in the herring
(Denton 1970); the second type in an amphipod (Parker 1999b) and a copepod ( Nishida et al.
2002) (Crustacea); and the third type in many other silvery fishes.
The crustaceans Limnadia (Conchostraca), Tanais tenuicornis (Tanaidacea),
Ovalipes molleri (Decapoda) and the males of Sapphirina (Copepoda) all bear
multilayer reflectors in their cuticles, in different forms. In contrast to the usual
continuous thin layers, male sapphirinids have 10–14 layers of interconnecting
hexagonal platelets within the epidermal cells of the dorsal integument (Chae &
Nishida 1994). The reflector of O. molleri comprises layers that are corrugated
and also slightly out of phase (figure 9). The corrugations function to broaden
the reflectance band, at the expense of reducing the intensity of reflection
(Parker et al. 1998b).
(e ) Broadband multilayer reflectors (silver and gold ‘mirrors’ )
‘Broadband’ multilayer reflectors (figure 10), as opposed to the narrowband
types described above, reflect a broad range of wavelengths, such as all of those
in white light, thus forming a mirror effect. Simply, they contain layers of
different optical thicknesses that each reflects a different wavelength in a given
direction. The different wavelengths combine to form an optical effect with a
broad range of colours. When all the wavelengths in white light are reflected, the
appearance is silver, and when all but blue and violet are reflected, the
appearance is gold, for instance. The metallic effect (e.g. silver rather than white)
is due to the directional nature of the reflectance; since all rays are reflected into
the same direction, the relative intensity is high (the reflection appears bright).
Broadband reflectors, or mirrors, are employed in animals such as the
chrysalis of the butterfly Euploea core, the tortoise beetle and many silvery fishes
to provide camouflage. The surrounding environment is reflected from the
mirrored surface so that the animals cannot be seen (Denton 1970; Land 1972;
Phil. Trans. R. Soc. A (2009)Downloaded from http://rsta.royalsocietypublishing.org/ on May 10, 2015
1770 A. R. Parker
Parker 1999b; Vigneron et al. 2007). However, this means of camouflage can only
be achieved in an environment with diffuse light to prevent a strong, direct
reflection from the Sun. Euploea core indeed lives in forests with diffuse light
conditions. Many fishes take advantage of such conditions, to achieve the same
effect, in the sea (Denton 1990). Similarly, iridophores camouflage the parts of
squids and cuttlefishes that cannot, by their nature, be made transparent, such
as eyes and ink sacs (Land 1972).
3. Antireflectors: zero-order gratings
When the periodicity of a grating reduces much below the wavelength of light, it
becomes a zero-order grating and its effect on light waves changes (see Hutley
1982). This difference in optical effect occurs because when the periodicity of the
grating is below the wavelength of light, the freely propagating diffracted orders
are suppressed and only the zero order is reflected when the illumination is
normal to the plane of the grating. To describe accurately the optical properties
of a zero-order grating, rigorous electromagnetic theory is required. In an optical
system that accepts only the zero order, what is seen is white light minus that
diffracted into the G1 order. This may result in no reflection at all (i.e. total
transmission), where the structures become ‘antireflective’.
In 1976, in Poland, a 45-million-year-old fly’s eye preserved in Baltic amber
was photographed in an electron microscope to demonstrate the detail of
preservation (figure 11). An unusual feature of the cornea was a series of fine
parallel ridges. A model of the corneal surface was made in photoresist by
lithographic methods and its reflectivity was compared with the same
photoresist material with a smooth surface. The fly eye model was found to
have excellent antireflective properties over a wide angular range, at least 608 on
either side of the surface normal (Parker et al. 1998c). This would have aided
the fly’s vision by permitting more light to pass through the surface of the eye
and therefore reach the retina. However, it was found that this new antireflector
design provides a 10 per cent increase in energy capture when applied to
the surfaces of solar panels (Parker 1999a). Hence, this fly eye antireflector is
now manufactured, moulded on large plastic sheets with refractive index
matching glue.
Zero-order diffraction gratings that cause total transmission (i.e. there is no
reflection) are also found on the corneal surface of Zalea minor (Diptera) today.
The periodicity of the corneal gratings of this fly, which have the same profile as
that of the Eocene fly above, is 242 nm (Parker et al. 1998c).
Another form of antireflection grating is found on the transparent wings of the
hawkmoth Cephonodes hylas (Yoshida et al. 1996) and on the corneal surface of
each ommatidium of the compound eyes of moths (Miller et al. 1966) and
butterflies (e.g. figure 12). Here, optical impedance matching is achieved by means
of a hexagonal array of tapered cylindrical protuberances, each of approximately
250 nm diameter (Miller et al. 1966), thus forming a ‘tri-grating’ with grooves
transecting at 1208 (figure 12). The protuberances provide a graded transition of
refractive index between the air and the cornea/wing. Hence, the refractive index
at any depth is the average of that of air and the corneal/wing material.
Phil. Trans. R. Soc. A (2009)Downloaded from http://rsta.royalsocietypublishing.org/ on May 10, 2015
Review. Natural photonics for industrial inspiration 1771
Figure 11. Scanning electron micrograph of the corneal surfaces of four ommatidia from the
compound eye of a 45 Ma dolichopodid fly preserved in Baltic amber, showing antireflective
gratings. Micrograph by P. Mierzejewski. Scale bar, 3 mm.
Figure 12. Scanning electron micrograph of the corneal surface of a single ommatidium from the
compound eye of the butterfly Vanessa kershawi. Protuberance spacing is approximately 250 nm.
4. Complex optical reflectors: photonic crystals
In the 1980s the photonic crystal concept was introduced within physics.
Photonic crystals are ordered, often complex, subwavelength (nano) lattices that
can control the propagation of light at the single wave scale in the manner that
atomic crystals control electrons (see Yablonovitch 1999). This is because light of
a certain wavelength is completely reflected, regardless of the direction of the
incident light.
Phil. Trans. R. Soc. A (2009)Downloaded from http://rsta.royalsocietypublishing.org/ on May 10, 2015
1772 A. R. Parker
Photonic crystals are complex optical reflectors, where a single wave is
scattered more than once, even leading to rays of certain wavelengths becoming
trapped when surrounded by ‘forbidden zones’ (regions where rays of some
wavelengths are inadmissible) within the structure. Here, the light of a certain
wavelength encounters a region from where it is back reflected in every direction
it can travel. To identify a photonic crystal, rigorous electromagnetic scattering
theory must be applied (such as the ‘multipole’ method; see Parker et al. 2001),
since all the probabilities for ray paths should be considered rather than simply
the average ray path as considered in simple optical reflectors. For such complex
optical structures, the single-scattering approximation is no longer appropriate
due to the multiple scattering of a single light ray. Nonetheless, all reflectors
found in nature (when described by wave optics rather than light ray scattering)
remain solvable by Maxwell’s equations, and so do not require quantum optical
methods. New collaborations between biologists and optical physicists are
realizing that some of nature’s reflectors may involve at least partial band gaps,
where a forbidden zone for a ray’s path exists in some but not all directions.
An introduced ‘nanotunnel’ (known as a ‘defect’) in the photonic crystal can
open up a pathway, along which light of the wavelength affected must travel.
This is what ‘controlling’ the path of light means; an achievement previously
reserved for the considerably larger fibre optics (see Joannopoulos et al. 2008).
Defects are yet to be found in natural photonic crystals, however.
Forbidden zones are the product of periodic arrays of elements, or variations in
refractive index, in two or three dimensions within a submicrometre structure
(a multilayer reflector has a periodicity in only one dimension). Consider again a
quarter-wave stack, where alternating thin layers (a quarter of the wavelength of
light in thickness) of different refractive indices are stacked (this happens to be
the type of multilayer reflector shown in figure 8, where alternate layers are equal
in thickness; see Land 1972). A photonic crystal is the generalization of this
principle for submicrometre structures with periodic arrays in two or three
dimensions. If the periodicity is constant in two or three dimensions, at
approximately twice the wavelength of light, light rays may be forbidden to
propagate in many or all directions (the latter case is known as a complete or full
photonic band gap; the former case is partial)—in some or all directions it will
encounter a forbidden zone. Therefore, a complete photonic band-gap structure
will reflect light of a certain wavelength of any polarization incident at any angle.
Note that in physics ‘reciprocal space representations’ (or ‘band diagrams’) are
made to represent the photonic band-gap effect. Such diagrams are given for
some of the photonic crystals in this paper, and so I will provide a brief
explanation for a two-dimensional lattice below (three-dimensional lattices
complicate matters considerably).
(a ) Band diagrams
Each component of a photonic crystal, such as a single nanotube, is considered
in cross section and marked with a point at its centre. A ‘Bragg plane’ is drawn
as a line that is perpendicular to, and transects at its centre, the line connecting
this point to one of its nearest neighbours. If four points are equidistant to the
original point, then four Bragg planes are drawn, forming a square (figure 13a).
The first ‘Brillouin zone’ for the original point is the area within the square.
Phil. Trans. R. Soc. A (2009)Downloaded from http://rsta.royalsocietypublishing.org/ on May 10, 2015
Review. Natural photonics for industrial inspiration 1773
(a)
(b)
propagation
first
Brillouin
zone
(c) (i)
no photonic band gap
energy or
wavelength
(ii)
photonic band gap
Figure 13. (a) Diagrammatic cross section of a stack of nanorods (shaded), with black dots drawn
at their centres. (b) Centres of rods illustrated by the same black dots, but the rods themselves are
removed to reveal the first Brillouin zone (square shaped in this case) and the irreducible zone;
light is propagating in the direction of the arrow. (c) The irreducible zone is ‘folded out’ to reveal
the energy dispersion relation for a photon; (i)(ii) two different relations are given, where only one
shows a photonic band gap.
A right-angled triangle is constructed by drawing a line from the centre point
of the square to one corner and then to the halfway of one side—this is known as
the ‘irreducible zone’ (figure 13b). Now the energy dispersion relation for a
photon within the structure can be calculated and revealed diagrammatically, as
shown in figure 13c. The momentum (or wavevector) of the photon moving along
the perimeter of the triangle is exposed for different wavelengths of light
(or energy). Horizontal gaps in this diagram represent wavelength regions where
propagating photons are not allowed and will find it impossible to traverse the
structure—this is a photonic band gap. If the gap is continuous across
Phil. Trans. R. Soc. A (2009)Downloaded from http://rsta.royalsocietypublishing.org/ on May 10, 2015
1774 A. R. Parker
the diagram (i.e. along the entire perimeter of the irreducible zone), then the
photonic band gap is known as ‘full’; if the gap covers only part of the diagram it
is known as ‘partial’.
(b ) The sea mouse Aphrodita and a bee
In 2001, the first ‘photonic crystal fibre’ (a two-dimensional photonic crystal)
in nature was identified as such in Aphrodita sp. (a sea mouse)—a marine
polychaete worm (Parker et al. 2001). The sea mouse is covered in iridescent
hairs (neurochaetae) and spines (notochaetae) that approximate photonic crystal
fibres (figure 14a), causing the coloured effect to change dramatically with
orientation of the hairs/spines with respect to the light source (figure 14b,c).
Exactly 88 submicrometre tubes make up the wall of a spine (itself a tube), which
have consistent external diameters of 510 nm and a precise packing constant
(figure 14d,e). A multipole method was applied to this lattice and used to explain
this reflectance pattern and reveal a photonic band gap (figure 14f,g; Parker et al.
2001). Essentially, the stack of submicrometre tubes forms a multilayer reflector
in any direction within the transverse plane of the spine, although light reflected
by this reflector will meet further optical boundaries in the form of the curved
surfaces of surrounding submicrometre tubes. Hence, individual light rays will be
reflected multiple times. This does not apply, however, to light incident in the
longitudinal plane (along the length) of the spine.
Preliminary investigations have revealed ‘photonic crystal fibres’ within the
setae of a diversity of polychaetes. A further example has been discovered in a
blue-banded bee, Amegilla sp. (Fung 2005). The scales on the dorsal surface of
these insects vary from green to yellowish green as the light source is rotated
around them by 908, achieving a peak reflectivity of 63 per cent (i.e. 63% of the
incident light is reflected when the orientation of the scale is most compliant;
Fung 2005). Within each scale exists a hexagonal array of submicrometre tubes,
each 200G80 nm in external diameter, which, when packed together, form an
effective stack of nanoholes approximately 10 layers deep and with a slight tilt
with respect to the scale surface (figure 14e; Fung 2005). This cross-sectional
architecture (figure 14e) is considered for its effect on light rays just as the
architecture shown in figure 13c; only here rays reflected for the first time
encounter optical boundaries in the horizontal as well as vertical direction.
Hence, they are likely to be reflected again. Such multiple reflection events
complicate mathematical modelling significantly. A similar two-dimensional
stack of fibres was identified as the cause of iridescence in the ctenophore Beroë
cucumis, although here the fibres were parallelogram packed (Welch et al. 2005).
Reflectance was modelled using a ‘transfer matrix’ approach, based on a two-
dimensional ‘Bravais’ lattice (Welch et al. 2005).
(c ) Peacock feathers
Another two-dimensional ‘photonic crystal’ (figure 15a–d ) has been revealed
as the cause of peacock iridescence (Zi et al. 2003). The surface of the barbules
of the feather consists of a thin keratin layer. Beneath the surface keratin layer
there is a photonic crystal-like structure composed of an array of short rods,
running parallel to the barbule surface, connected by keratin. The remaining
hollows in the structure are air holes, although these represent spaces between
Phil. Trans. R. Soc. A (2009)Downloaded from http://rsta.royalsocietypublishing.org/ on May 10, 2015
Review. Natural photonics for industrial inspiration 1775
(a) (b) (c)
(d ) (e)
( f )1.0 ( g)
3.5
0.8 3.0
2.5
0.6
R 2.0
0.4 1.5 M K
1.0 G
0.2
0.5
0 0
0.40 0.45 0.50 0.55 0.60 0.65 0.70 K G M K
Figure 14. ‘Photonic crystals’ of (a–d ) the sea mouse Aphrodita sp. (Polychaeta) and (e) the bee
Amegilla sp. (Insecta). (a) Scanning electron micrograph of an abraded cross section through the
wall of a spine (notoseta), constructed of submicrometre tubes; internal diameters of the
individual submicrometre tubes increase systematically with depth in the stack. (b,c) Light
micrographs of the length of the spine showing the different colours obtained when the direction
of the light source changes by 908 (light is incident along the length of the spine in (b) and from
the side in (c)). (d ) Transmission electron micrograph of a section through a hair (neuroseta);
internal diameters of the submicrometre tubes are constant. (e) Transmission electron
micrograph of a section through a dorsal scale (micrograph by K. K. Fung, reproduced with
permission). ( f ) Modelled reflectance (R) of both polarizations (‘E’, solid curve; ‘H’, dashed
curve) at normal incidence for an Aphrodita sp. spine. A multipole method was used to calculate
the scattering matrix of each layer, and a transfer matrix method was used to calculate the
properties of the stack. (g) Band diagram for the Aphrodita sp. spine in ‘E’ polarization.
A multipole method was used to calculate the photonic band diagram for an idealized model
corresponding to an array whose geometric parameters correspond to the average from the
micrograph in (a) (Parker et al. 2001; McPhedran et al. 2003). Scale bars: (a) 8 mm, (d ) 5 mm
and (e) 1 mm.
Phil. Trans. R. Soc. A (2009)Downloaded from http://rsta.royalsocietypublishing.org/ on May 10, 2015
1776 A. R. Parker
(a) (c)
2 µm 500 nm
(b) (d )
500 nm 1 µm
(e) 0.5
0.4
frequency (c/a)
0.3
0.2 M
0.1
G X
0
M G X M
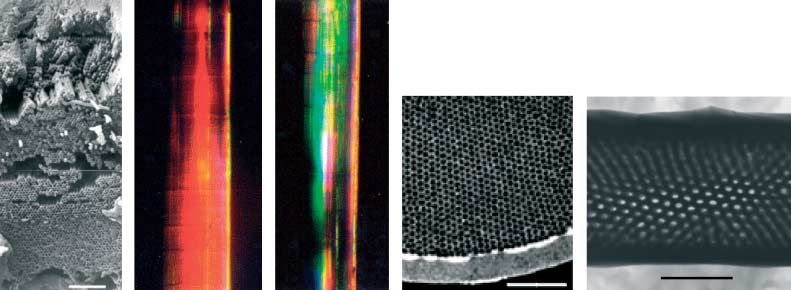
Figure 15. The barbule structures of a peacock feather. (a–d ) Scanning electron micrographs.
(a) Transverse cross section of a green barbule; the outer cortex layer contains a periodic
structure, the central part is the medullar layer. (b,c) Transverse cross section of the cortex
under higher magnification is shown for the green (b) and brown (c) barbules. The rods embedded
in the surface keratin layer can be seen clearly. (d ) Longitudinal cross section of the green
barbule with the surface keratin layer removed. (e) Calculated photonic band structure of an
infinite two-dimensional photonic crystal based on the rods (although the nanorods in the
peacock feather are of finite length), for E (solid lines) and H (dashed lines) polarizations.
Frequency is in units of c/a, where c is the speed of light in vacuum and a is the lattice constant.
The inset of (e) shows the irreducible Brillouin zone; G, X and M are the centre, edge centre and
corner of the first Brillouin zone, respectively. Note that the G–X direction is along the direction
normal to the cortex surface. From Zi et al. (2003), with permission from the authors. Scale bars:
(a) 2 mm, (b,c) 500 nm and (d ) 1 mm.
juxtaposed rods, rather than holes within nanotubes as in the previous
examples. Cylindrical, hexagonally packed holes, however, have been identified
in the feather barbules of the black-billed magpie ( Vigneron et al. 2006).
Similar to those unidentified micrographs of butterfly ‘photonic crystals’, bird
reflectors previously thought to be multilayer reflectors may reveal photonic
band gaps (e.g. figure 15e), and feathers may become a common subject of
quantum optics in the future. Indeed, electron micrographs of bird reflectors
have been published widely, and most reveal either semi-ordered spongy
lattices (e.g. Prum et al. 1998) or ordered stacks of rods (e.g. Land 1972) that
probably also accommodate partial band gaps.
Phil. Trans. R. Soc. A (2009)Downloaded from http://rsta.royalsocietypublishing.org/ on May 10, 2015
Review. Natural photonics for industrial inspiration 1777
(d ) Weevils containing ‘opal’
Opal is an example of a three-dimensional photonic crystal that both occurs
naturally and was identified as a photonic crystal soon after the concept was formed.
The ultrastructure of opal was originally revealed in 1964 as a square or more usually
hexagonally close packed array of spheres approximately 250 nm in diameter
(Sanders 1964). Many Australian fossils have become opalized, particularly those
from the Late Cretaceous period, ca 110 Ma (e.g. figure 16a). Although this opal had
no biological origin, recently opal has been discovered in a live animal—a beetle.
That this opal is made by a living organism has important implications—the optical
engineer is presented with a manufacturing process that may be copied.
To demonstrate the optical effect of opal, it is worthwhile making the contrast
with the effect of a multilayer reflector in other species of beetle. In tropical
forests, many beetles employ structural colours for display purposes (Schultz
1986). Where multilayer reflectors are involved, only part of the beetle is visible
(as a ‘spot’ of light) from any direction in direct sunlight because such structures
cause mirror-like reflections from its curved surfaces. However, a beetle (weevil) does
exist with metallic coloration visible from all body regions from every direction, due
to a photonic crystal with a structure analogous to that of opal (Parker et al. 2003).
The weevil Metapocyrtus sp. (formerly identified as Pachyrhynchus sp.) possesses
scales, approximately 0.1 mm in diameter, occurring in patches on the top and sides
of its ‘hemispherical’ body. Individually, the scales are flat, lying parallel with the
body, and consist of two parts—an outer shell and an inner structure. The inner
structure of the scales is a solid array of transparent spheres, each 250 nm in diameter
(Parker et al. 2003; figure 16b). These spheres are arranged in flat layers and have a
precise, hexagonal close-packing order. They cause reflection of a narrow range of
wavelengths over a wide range of angles of incidence (figure 16c). Metapocyrtus sp.,
however, is currently the only animal known with the opal-type photonic crystal.
(e ) Butterflies and weevils containing inverse opal
Three-dimensional photonic crystals in the form of inverse opal (figure 17a),
with the same periodicities as the opal lattice, have been observed in electron
micrographs of butterfly scales for some time (e.g. Ghiradella 1989) but have
only recently received photonic band-gap identification (McPhedran et al. 2003;
Ingram & Parker 2008). This has followed considerable effort to manufacture the
inverse opal lattice (see Shore et al. 1997).
The weevil Eupholus nickerli (figure 17b; unrelated to Metapocyrtus) is again
covered in thin flat scales, which also provide the same structural colour to
Metapocyrtus sp. (i.e. the visual effect is equal for all directions of incident light),
except here the lattice within the scales is the inverse—the nanospheres are in
this case spaces, and the spaces are here chitin (figure 17c). Several recent
investigations have revealed further cases of this ‘inverse opal’ in weevils and
butterflies (e.g. Kertész et al. 2006).
5. Evolutionary research
Optical reflectors can make suitable phenotypes for the study of evolution, since,
unlike many other morphologies, they can be quantified. This has led to the
Phil. Trans. R. Soc. A (2009)Downloaded from http://rsta.royalsocietypublishing.org/ on May 10, 2015
1778 A. R. Parker
(a) (b) (c)
Figure 16. The opal structure. (a) A 110 Ma opalized bivalve (Mollusca) shell from Australia
(widthZapprox. 3 cm). (b,c) The weevil Metapocyrtus sp. (b) Scanning electron micrograph of
the opal analogue positioned within a single scale; white scale bar, 1 mm. (c) Whole animal
(body lengthZ11 mm); the opal structure lies within the turquoise scales.
(a)
(c)
(b)
Figure 17. The ‘inverse opal’ structure. (a) Three-dimensional reconstruction of the inverse opal in
the wing scale of the butterfly Teinopalus imperialus (periodicityZ250 nm). (b,c) Eupholus
nickerli. (b) Whole animal (body widthZ9 mm). (c) Transmission electron micrograph of a
transverse section through the scale of a foot, showing the inverse opal structure arranged in
domains (this is how the inverse opal structure appears in a single section); scale bar, 1 mm.
conclusion that some invertebrate taxa may have evolved with light as the major
stimulus. In this situation, the evolution of structural colours may correlate with
the evolution of species.
Many species of cypridinid ostracods (seed shrimps) possess diffraction
gratings on the halophores (the setules) of their first antennae, which cause
iridescence (figure 5a). The least derived living cypridinid appears to be
Azygocypridina (approx. 350 Myr old; Parker 1995). The subsequent evolution of
Cypridinidae reveals a consistent improvement in the physics of the diffraction
gratings. One group of cypridinids continued this trend to the point where the
most derived species have very dense ‘iridescent fans’ (collection of iridescent
hairs) with theoretically near-perfect reflectors in males. The females of these
derived species, such as Skogsbergia sp., possess very sparse iridescent fans,
appearing similar to those of less derived male and female species of
Cypridinidae. The males’ iridescence is known to be functional. In at least one
species of Skogsbergia, when a male ostracod approaches a female its iridescent
fan is displayed, which is otherwise held within the carapace that encloses the
body (figure 5b). The female then becomes sexually receptive to the light
displayed and mating follows (Parker 1995). Divergence in sexual light displays
may have generated sufficient sexual isolation among populations to lead to
Phil. Trans. R. Soc. A (2009)Downloaded from http://rsta.royalsocietypublishing.org/ on May 10, 2015
Review. Natural photonics for industrial inspiration 1779
Figure 18. The epidermal (exoskeletal) cell of a beetle in the midst of secreting an unusual addition
to a multilayer reflector, giving the structure a unique, three-dimensional quality. Melanin granules
appear to pass through the smooth endoplasmic reticulum (ER), out of the cell and into ready-
made (possibly also by the smooth ER) nanotubes. Magnification: !13 000.
speciation (see Verrell 1991). In fact, the whole of the Cypridinidae appear to
have evolved with light as the major stimulus (Parker 1995).
Also, in butterflies, optical structures are known to be involved in speciation
through influencing population structures (Bálint et al. 2005) and in sexual
selection (Bálint et al. 2006).
A new aim in the study of animal optical structures is to decipher and emulate the
animal’s manufacturing process. Animals contain the ultimate factories—they
engineer via nanomachinery and molecular self-assembly, and the results are perfect,
as demonstrated by the micrographs in this paper. Maybe, in the not-too-distant
future, living cells can be cultured and photonic crystals ‘grown’ and harvested.
This in turn would provide an opportunity for novel evolutionary study.
Self-assembly and the engineering processes within cells are not easy to
decipher. Considering the lessons learnt from the construction of the tobacco
mosaic virus, there may be intermediate stages involved in the manufacture of
nature’s photonic crystals—stages that are not evident from the finished article.
However, research on the self-assembly of the Aphrodita sp. and Metapocyrtus sp.
photonic crystals is underway, beginning with live-cell imaging (e.g. figure 18).
Then there are plans to probe the genome of the sea mouse and find the genes that
code for its photonic crystals. When compared with the genotypes and phenotypes
of its sister species, this will help to explain the evolution of morphologies. This
would contrast well with current evolutionary developmental biological studies
where patterns on butterflies’ wings are considered (e.g. Xi et al. 2001). Patterns
result from the concerted actions of groups of cells, and the study of their
development through the life history of the animal is very much distinct from the
consideration of individual scale manufacture by individual cells (individual scales
provide colour; combined scales provide pattern shapes).
The first study of the manufacture of a specific phenotype by a single cell has
been made already, where a model for the development of butterfly scales
containing a three-dimensional optical reflector (now known to be inverse opal)
was proposed (Ghiradella 1989). Here, the smooth endoplasmic reticulum (ER)
Phil. Trans. R. Soc. A (2009)Downloaded from http://rsta.royalsocietypublishing.org/ on May 10, 2015
1780 A. R. Parker
was considered to form a lattice with the architecture of the inverse opal itself.
This would draw in the cell membrane to form a ‘negative’ of the lattice, into
which chitin would be secreted to form the ‘positive’ structure (Ghiradella 1989).
If this idea can be confirmed using live-cell imaging techniques, and coupled with
the genetic data to code for the structure, we may learn much about the complete
process of evolution, where the much overlooked engineering capabilities of the
cell are influential. This may, for instance, explain how a butterfly and a weevil—
two unrelated insects—can evolve identical photonic crystals (as shown in
figure 17a,c). At first sight, these appear as highly complex structures that
require the control of many genes and consequently significant evolutionary
steps. However, if the cells themselves carry out much of the work then such
structural parallelism, and consequently evolutionary convergence, is not so
surprising. This is because the ability to manufacture this photonic crystal could
be inherent within insect cells in general, where only (minimal) mutation in the
genes to control the developmental process is required. The limited range of
photonic crystals found in animals, in comparison with the potential range in
physics (where lattices may also contain sharp edges and corners, etc.), further
substantiates this idea. So, as a consequence of their production by single cells,
photonic crystals make ideal phenotypes for evolutionary study in the future.
This work was funded by the Royal Society and the Australian Research Council. Thanks to Peter
Collins (Oxford University) for help with the work on E. nickerli.
References
Bálint, Zs., Vértesy, Z. & Biró, L. P. 2005 Micro- and nanostructures of high Andean Penaincisalia
eumaeine lycaenid butterfly scales (Lepidotera: Lycaenidae): descriptions and interpretations.
J. Nat. Hist. 39, 2935–2952. (doi:10.1080/00222930500140629)
Bálint, Z., Boyer, P., Dahners, H. W., Salazar-Escobar, J. A. & Kertész, K. 2006 Comments on the
systematics and natural history of Aveexcrenota, a genus of rare Andean eumaeine Lycaenidae
(Lepidoptera). Acta Zool. Acad. Sci. Hung. 52, 331–352.
Chae, J. & Nishida, S. 1994 Integumental ultrastructure and color patterns in the iridescent
copepods of the family Sapphirinidae (Copepoda: Poecilostomatoida). Mar. Biol. 119, 205–210.
(doi:10.1007/BF00349558)
Denton, E. J. 1970 On the organization of reflecting surfaces in some marine animals. Phil. Trans.
R. Soc. Lond. B 258, 285–313. (doi:10.1098/rstb.1970.0037)
Denton, E. J. 1990 Light and vision at depths greater than 200 metres. In Light and life in the sea
(eds P. J. Herring, A. K. Cambell, M. Whitfield & L. Maddock), pp. 127–148. Cambridge, UK:
Cambridge University Press.
Dyck, J. 1971 Structure and spectral reflectance of green and blue feathers of the rosefaced lovebird
(Agapornis roseicollis). Biol. Skr. 18, 1–67.
Fox, D. L. 1976 Animal biochromes and structural colours. Berkeley, CA: University of
California Press.
Fox, H. M. & Vevers, G. 1960 The nature of animal colours. London, UK: Sidgwick and
Jackson Ltd.
Fung, K. K. 2005 Photonic iridescence of a blue-banded bee. Proc. Microsc. Microanal. 11(Suppl. 2),
1202–1203. (doi:10.1017/S1431927605500813)
Ghiradella, H. 1989 Structure and development of iridescent butterfly scales: lattices and laminae.
J. Morphol. 202, 69–88. (doi:10.1002/jmor.1052020106)
Herring, P. J. 1994 Reflective systems in aquatic animals. Comp. Biochem. Physiol. 109A, 513–546.
(doi:10.1016/0300-9629(94)90192-9)
Phil. Trans. R. Soc. A (2009)You can also read