Impact of agricultural emission reductions on fine-particulate matter and public health
←
→
Page content transcription
If your browser does not render page correctly, please read the page content below
Atmos. Chem. Phys., 17, 12813–12826, 2017
https://doi.org/10.5194/acp-17-12813-2017
© Author(s) 2017. This work is distributed under
the Creative Commons Attribution 3.0 License.

Impact of agricultural emission reductions on fine-particulate
matter and public health
Andrea Pozzer1 , Alexandra P. Tsimpidi1 , Vlassis A. Karydis1 , Alexander de Meij2,a , and Jos Lelieveld1,3
1 Atmospheric  Chemistry Department, Max Planck Institute for Chemistry, Mainz, Germany
2 Noveltis,Sustainable Development, Rue du Lac, 31670 Labege, France
3 Energy, Environment and Water Research Center, The Cyprus Institute, Nicosia, Cyprus
a now at: MetClim, Varese, Italy

Correspondence to: Andrea Pozzer (andrea.pozzer@mpic.de)

Received: 27 April 2017 – Discussion started: 11 May 2017
Revised: 29 August 2017 – Accepted: 26 September 2017 – Published: 27 October 2017

Abstract. A global chemistry-climate model has been used        1   Introduction
to study the impacts of pollutants released by agriculture
on fine-particulate matter (PM2.5 ), with a focus on Europe,    Atmospheric aerosol particles are a major constituent of am-
North America, East and South Asia. Simulations reveal that     bient air and have a large impact on atmospheric chem-
a relatively strong reduction in PM2.5 levels can be achieved   istry, clouds, radiative transfer and climate and also induce
by decreasing agricultural emissions, notably of ammonia        adverse human health effects that contribute to mortality
(NH3 ) released from fertilizer use and animal husbandry. The   (IPCC, 2013; Lelieveld et al., 2015). Particulate matter (PM)
absolute impact on PM2.5 reduction is strongest in East Asia,   with an aerodynamic diameter smaller than 2.5 µm (PM2.5 )
even for small emission decreases. Conversely, over Europe      contributes to air pollution through intricate interactions be-
and North America, aerosol formation is not immediately         tween emissions of primary particles and gaseous precursors,
limited by the availability of ammonia. Nevertheless, reduc-    photochemical transformation pathways and meteorological
tion of NH3 can also substantially decrease PM2.5 concentra-    processes that control transport and deposition.
tions over the latter regions, especially when emissions are       As shown by Lelieveld et al. (2015) and Bauer et al.
abated systematically. Our results document how reduction       (2016), agricultural emissions play a leading role in the for-
of agricultural emissions decreases aerosol pH due to the       mation of PM2.5 in various regions of the world, for exam-
depletion of aerosol ammonium, which affects particle liq-      ple in central and eastern Europe. Agricultural emissions are
uid phase and heterogeneous chemistry. Further, it is shown     mostly related to animal husbandry and fertilizer use and to
that a 50 % reduction of agricultural emissions could prevent   a lesser extent also to the burning of crop residues (Aneja
the mortality attributable to air pollution by ∼ 250 000 peo-   et al., 2008): around 10 % of worldwide biomass burning
ple yr−1 worldwide, amounting to reductions of 30, 19, 8 and    emissions can be ascribed to agricultural activities (Doering
3 % over North America, Europe, East and South Asia, re-        et al., 2009b). The general importance of agricultural emis-
spectively. A theoretical 100 % reduction could even reduce     sions for air quality was also previously identified by a num-
the number of deaths globally by about 800 000 per year.        ber of studies (e.g., Zhang et al., 2008; Tsimpidi et al., 2007;
                                                                Megaritis et al., 2013) and recognized through environmen-
                                                                tal policies, (e.g., the establishment of ceilings for national
                                                                emissions for ammonia by the European Union Clean Air
                                                                Program).

Published by Copernicus Publications on behalf of the European Geosciences Union.
12814 A. Pozzer et al.: Impact of agricultural emissions The dominant trace gas emitted by agricultural activities is ammonia (NH3 ). Around 80–90 % of the atmospheric NH3 emissions in industrialized regions are from the agricultural sector (Sotiropoulou et al., 2004; Lamarque et al., 2011; van Vuuren et al., 2011a, b). NH3 is formed and released dur- ing the decomposition of manure and organic matter, mostly from animal farming and the associated manure storage and Figure 1. Regions addressed in this study, i.e., North America field application, with an additional contribution from (syn- (blue), Europe (green), South Asia (purple) and East Asia (red). thetic) nitrogen fertilizer use. NH3 is a toxic gas at very high concentrations, with a pungent smell that irritates the eyes and respiratory system. NH3 is also a major alkaline gas in the atmosphere and plays an important role in neutralizing Paulot et al., 2016; Wang et al., 2011), mostly with a regional acids in the aerosol and cloud liquid phase, forming ammo- rather than a global view. nium sulfate and ammonium nitrate (ammonium salts) (Be- As PM2.5 has been clearly associated with many health im- hera et al., 2013). Therefore NH3 contributes to secondary pacts, including acute lower respiratory infections (ALRI), aerosol formation and the overall particulate matter burden, cerebrovascular disease (CEV), ischaemic heart disease and decreases the acidity of the aerosols, which in turn in- (IHD), chronic obstructive pulmonary disease (COPD) and creases the solubility of weak acids (e.g., HCOOH, SO2 ). lung cancer (LC) (Burnett et al., 2014). Due to its strong The aerosol pH plays an important role in the reactive up- contribution to the PM2.5 mass, control strategies in NH3 take and release of gases, which can affect ozone chemistry, emissions could possibly reduce the mortality attributable particle properties such as hygroscopic growth and scattering to air pollution, and air quality policy in Europe does in- efficiency of sunlight and deposition processes (Zhang et al., deed include ceilings for NH3 emissions (Kuklinska et al., 2007; Thornton et al., 2010; Pathak et al., 2011). 2015). Studies on PM2.5 reduction due to NH3 control have Tsimpidi et al. (2007) showed that a 50 % reduction of been performed regionally both for Europe (Brandt et al., NH3 emissions would lead to a 4 and 9 % decrease in PM2.5 2013) and the USA (Paulot and Jacob, 2014; Muller and over the eastern USA in July and January, respectively. The Mendelsohn, 2007), while a detailed analysis on the global reduction of NH3 emissions was found to be the most ef- scale was performed by Lee et al. (2015), who showed the fective PM2.5 control measure for the winter period over the importance of ammonia as a contributor to mortality at- eastern USA compared to similar reductions of SO2 , NOx tributable to air pollution. Nevertheless, Lee et al. (2015) and VOC emissions (Pinder et al., 2008; Tsimpidi et al., assumed an ammonia reduction of 10 %, and the health ef- 2007, 2008; Karydis et al., 2011). Megaritis et al. (2013) and fects were linearized around the present-day concentrations. Bessagnet et al. (2014) found that over Europe the reduc- As the exposure-response functions, linking PM2.5 to mortal- tion of NH3 emissions is the most effective control strategy ity attributable to air pollution, are highly nonlinear at rela- used to mitigate PM2.5 in both summer and winter, mainly tively low concentrations, the mortality reduction estimation due to a significant decrease of ammonium nitrate. Further, could change drastically for strong reductions of ammonia De Meij et al. (2009), showed that reducing the NH3 emis- emissions. Therefore, in this work, more aggressive reduc- sions from agriculture by 50 % could result in a decrease tions are studied (see Sect. 2). of PM2.5 concentrations up to 2.4 µg m−3 over the Po Val- Furthermore, there is a need to not only investigate the ley region (Italy). This confirms the finding of de Meij et al. impact of NH3 emission reductions on PM2.5 concentra- (2006), who showed that for short-lived species like NOx tions, but also account for particle acidity and aerosol com- and NH3 , short-term fluctuations of the emissions play an position. The goal of this work is to understand the impact important role in the formation of nitrate aerosol. Accord- of global agricultural emissions on model-simulated PM2.5 ing to Wang et al. (2011), NH3 emissions contribute 8–11 % concentrations, the effects on aerosol pH and the poten- to PM2.5 concentrations in eastern China, which is compara- tial consequences for human health, with a focus on four ble to the contributions of SO2 (9–11 %) and NOx (5–11 %) continental regions where air quality limits and guidelines emissions. However, the air quality benefits of controlling for PM2.5 are often exceeded, i.e., North America, Europe, NH3 emissions could be offset by the potential enhancement South and East Asia. North America is defined as the re- of aerosol acidity. Weber et al. (2016) showed that, despite gion that encompasses the USA and Canada; Europe is rep- the large investments in sulfur dioxide emission reductions, resented by the European continent (including Turkey) ex- the acid/base gas particle system in the southeastern USA cluding Russia; South Asia includes India; Sri Lanka, Pak- is buffered by the partitioning of semivolatile NH3 , making istan, Bangladesh, Nepal and Buthan; while the East Asia re- the pH insensitive to SO2 controls. Several studies have been gion includes China, North and South Korea and Japan (see performed on the impact of NH3 on aerosol nitrate (Pye et al., Fig. 1). 2009; Heald et al., 2012; Schaap et al., 2004; Pinder et al., This work may also support policy actions aimed at con- 2007; Holt et al., 2015) and sulfate (Redington et al., 2009; trolling ammonia emissions, e.g., formulated in the European Atmos. Chem. Phys., 17, 12813–12826, 2017 www.atmos-chem-phys.net/17/12813/2017/
A. Pozzer et al.: Impact of agricultural emissions                                                                              12815

                                                                            (a)

                                                                            (b)

Figure 2. Scatter plot of observed and modeled yearly averaged         Figure 3. (a) Observed annual mean PM2.5 from (van Donkelaar
concentrations of PM2.5 (in µg m−3 ). The colors denote the regions,   et al., 2010), (b) simulated annual mean PM2.5 (REF simulation),
i.e., blue is North America, green is Europe, purple is South Asia     both in µg m−3 .
and red is East Asia. Black are locations outside these regions.

Union Clean Air Program (http://www.consilium.europa.eu/               gas-aerosol partitioning are calculated by the Global Modal-
en/policies/clean-air/), which sets ceilings for national emis-        aerosol eXtension (GMXe) aerosol module (Pringle et al.,
sions for sulfur dioxide, nitrogen oxides, volatile organic            2010a, b). Gas/aerosol partitioning is calculated using the
compounds, fine-particulate matter and ammonia.                        ISORROPIA-II model (Fountoukis and Nenes, 2007; Nenes
                                                                       et al., 1998a, b). Following the approach of Pozzer et al.
                                                                       (2012b), the year 2010 is used as the reference year, the
2   Methodology                                                        feedback between chemistry and dynamics was switched off,
                                                                       and therefore all simulations described here are based on the
In this study the EMAC (ECHAM5/MESSy Atmospheric                       same (binary identical) dynamics and consequent transport
Chemistry) model version 1.9 was used. EMAC is a combi-                of tracers.
nation of the general circulation model ECHAM5 (Roeckner                  Although Pozzer et al. (2012a) evaluated the model for the
et al., 2006, version 5.3.01) and the Modular Earth Submodel           same configuration and emissions database, the emissions re-
System (Jöckel et al., 2005, MESSy, version 1.9). Extensive            ferred to the year 2005, while here the emissions for the year
evaluation of the model can be found in Jöckel et al. (2006),          2010 are used. Therefore the model is re-evaluated for the
Pozzer et al. (2007, 2012a), Pringle et al. (2010a) and de Meij        species of interest (i.e., SO2−     −     +
                                                                                                    4 , NO3 , NH4 and PM2.5 ). The
et al. (2012a). ECHAM5 has been used at the T106L31                    model results of this study have been evaluated against satel-
resolution, corresponding to a horizontal resolution of ∼              lite based PM2.5 estimates (van Donkelaar et al., 2010); the
1.1 × 1.1◦ of the quadratic Gaussian grid and with 31 ver-             results are shown in Fig. 2 and are summarized in Table 1,
tical levels up to 10 hPa in the lower stratosphere. The model         also focusing on the four regions focus of this study (i.e.,
setup is the same as that presented by Pozzer et al. (2012a,           North America, Europe, South and East Asia). Compared
b) and is briefly summarized here. The anthropogenic emis-             to global satellite-derived PM2.5 concentrations this model
sions are for the year 2010 from the EDGAR-CIRCE (Do-                  version, with prescribed dust emissions, consistently overes-
ering et al., 2009a, c, Emission Database for Global Atmo-             timates PM2.5 over desert areas (see Fig. 2). However, the
spheric Research) database, distributed vertically to account          average concentration of PM2.5 at the surface in the regions
for different injection altitudes (Pozzer et al., 2009). Bulk          of interest is within 30 % of the observations. For Europe
natural aerosol emissions (i.e., desert dust and sea spray),           and South Asia, 95 % of the simulated PM2.5 concentrations
are treated using offline monthly emissions files based on             are within a factor of 2 of the observations, while for North
AEROCOM (Dentener et al., 2006) and hence are inde-                    America and East Asia this is about 80 %.
pendent of the meteorological conditions. The atmospheric                 Further, SO2−          −         +
                                                                                       4 , NO3 and NH4 have been compared
chemistry is simulated with the MECCA (Module Efficiently              with station observations from different databases, such as
Calculating the Chemistry of the Atmosphere) submodel by               from EPA (United States Environmental Protection Agency),
Sander et al. (2005, 2011), and the aerosol microphysics and           EMEP (European Monitoring and Evaluation Programme)

www.atmos-chem-phys.net/17/12813/2017/                                               Atmos. Chem. Phys., 17, 12813–12826, 2017
12816 A. Pozzer et al.: Impact of agricultural emissions
Table 1. Summary of the comparison of model data to pseudo-
observations of PM2.5 concentrations (van Donkelaar et al., 2010).
OAM and MAM are the spatial arithmetic mean of the observations
and of the model results (REF simulation), respectively (in µg m−3 ),
based on the annual averages. The model results were masked in lo-
cations where no observations are available. PF2 is the percentage
of model results within a factor of 2 of the observations.
Region MAM OAM MAM/OAM PF2
Europe 9.00 11.96 0.75 0.95
North America 4.31 5.89 0.72 0.80
South Asia 24.49 24.95 0.98 0.95
East Asia 33.60 27.56 1.22 0.81
World 22.58 13.02 1.73 0.75
Table 2. Summary of the comparison of model data to the observa-
tions of aerosol component concentrations. OAM and MAM are the
spatial arithmetic mean of the observations and the model, respec-
tively (in µg m−3 ). PF2 is the percentage of model results within a
factor of 2 in the observations. Figure 4. Simulated mean concentrations of PM2.5 components
(SO2− − +
4 , NO3 and NH4 ) in µg m
−3 at the surface for the year 2010,
Species Network MAM OAM MAM/OAM PF2 with observations from EPA, EMEP and EANET (averaged over the
SO2− EPA 1.22 1.18 1.03 85.5 same period) overlaid.
4
SO2−
4 EMEP 1.36 1.70 0.79 86.5
SO2−
4 EANET 1.54 3.30 0.46 88.8
NO− EPA 0.65 0.42 1.54 63.0 and observations above 0.7 and 0.5, respectively). However,
3
NO− EMEP 2.08 1.15 1.81 32.6 this is not the case on the east coast of the USA, where
3
NO− EANET 1.11 1.37 0.81 68.3 the correlation is below 0.2. As suggested by Pozzer et al.
3
NH+ EPA 0.77 0.79 0.97 88.0 (2012a), this is due to the wrong seasonality of the ammo-
4
NH+
4 EMEP 1.11 1.07 1.03 74.6 nia emissions, driven by an underestimation of the livestock
NH+
4 EANET 0.77 0.96 0.79 80.6 emissions, which have a maximum in summer and should
account for 80 % of the annual NH3 emissions in the region
(Battye et al., 2003). The agricultural emissions of ammo-
and EANET (Acid Deposition Monitoring Network in East nia in this region in the model reproduce mostly the fertilizer
Asia) for the year 2010. The results are shown in Fig. 4 and application as described by Goebes et al. (2003) and there-
summarized in Table 2. fore the real seasonality of the ammonia emissions is miss-
While sulfate is well reproduced, with more than ∼ 85 % ing (Paulot et al., 2014). The seasonal results over the USA
of the model results within a factor of 2 compared to the ob- should hence be taken with caution. Further evaluation can be
servations, nitrate is overestimated in North America and Eu- found in Pozzer et al. (2012a, b) and de Meij et al. (2012b).
rope by ∼ 50 %, although nitric acid is reproduced accurately In the current analysis four simulations with the EMAC
by the model (based on comparison with observations from model have been performed to study the impacts on PM2.5
Emmons et al., 2000; see Jöckel et al., 2006). As the nitrate components: the evaluated reference simulation (REF) and
concentrations seem to be on the high end of the observa- three sensitivity calculations in which the agricultural emis-
tions, it must be acknowledged that the effect of reducing sions have been reduced by different percentages, 50 %
ammonia emissions from agriculture could be overestimated. in simulation REF_50, 75 % in simulation REF_75 and
On the other hand, nitrate predictions are in good agreement 100 % (i.e., removing all agricultural emissions) in simula-
with the measurements over East Asia. Further, ammonium tion REF_100.
concentrations are well captured by the model, with more The NOx emissions from agriculture are 0.7 Tg(N) yr−1 ,
than 75 % of the modeled results being within a factor of 2 i.e., only ∼ 1.7 % of the total NOx emissions. Most impor-
compared to the observations. For ammonium, the annual av- tantly, 34.3 Tg(N) yr−1 of NH3 are emitted by agricultural
erages estimated from model results compare well with the activities, such as livestock manure and N mineral fertilizers,
observations (see Table 2). Further, as shown by Pozzer et al. accounting for ∼ 80 % of the anthropogenic and ∼ 67 % of
(2012a), simulated seasonal cycle of ammonium concentra- the total global ammonia emissions.
tions compares well with the observed one, both for Europe
and Asia (with temporal correlations between model results
Atmos. Chem. Phys., 17, 12813–12826, 2017 www.atmos-chem-phys.net/17/12813/2017/A. Pozzer et al.: Impact of agricultural emissions 12817
Agricultural waste burning is responsible for the emissions fects are found over Europe, North America and China;
of 0.1 Tg(S) yr−1 of SO2 (less than 1 % of the total SO2 emis- the latter have a smaller relative intensity. A 50, 75 and
sions) and 23.2 Tg(C) yr−1 of CO (∼ 5 % of the total CO 100 % reduction of ammonia emissions would reduce the
emissions), as well as 0.4 and 1.9 Tg(C) yr−1 of black carbon annual and geographical mean PM2.5 levels over Europe
(BC) and organic carbon (OC), respectively, representing in by ∼ 1.0 µg m−3 (11 %), 1.8 µg m−3 (19 %) and 3.1 µg m−3
both cases ∼ 5 % of their total emissions. (34 %) compared to the reference annual surface concentra-
Considering these emission magnitudes, the main effects tion of 8.9 µg m−3 . The same relative emission decreases in
of agricultural emissions on PM2.5 are expected from NH3 North America lead to PM2.5 concentration reductions of
through gas-particle partitioning. Therefore, the ammonia 0.3 µg m−3 (8 %), 0.5 µg m−3 (12 %) and 0.69 µg m−3 (16 %),
emissions used in this work have been compared to other respectively, compared to a reference annual surface concen-
used databases, such as EDGARv4.3.1 (Emission Database tration of 4.0 µg m−3 . Over East Asia the absolute decrease
for Global Atmospheric Research, Crippa et al., 2016) and in the annual average PM2.5 concentration near the surface is
RCP85 (Representative Concentration Pathways van Vu- 1.6 µg m−3 (5 %), 2.7 µg m−3 (8 %) and 4.08 µg m−3 (13 %)
uren et al., 2011b, a). These data sets differ globally by ∼ for the three scenarios. Although the absolute changes in
15 % (40.26, 47.49 and 40.62 Tg yr−1 for EDGAR-CIRCE, East Asia (relative to a reference value of 31.1 µg m−3 ), are
EDGARv4.3.1 and RCP85). This reflects the uncertainties larger than the corresponding changes estimated over Eu-
in the emission estimates of ammonia, which could be up to rope and North America, the relative changes are smaller.
50 % on a local scale (Beusen et al., 2008). The implementa- In fact, the fraction of fine-particle mass that is directly am-
tion of bidirectional exchange of ammonia between the soil monia sensitive (i.e., (NH+ −
4 + NO3 ) / PM2.5 ) is relatively
and atmosphere may improve the emissions from livestock, smaller in East Asia (∼ 13 %) than in Europe (∼ 27 %) and
although this approach is still associated with underestimates North America (∼ 17 %), and a reduction of NH3 emissions
of emissions (Zhu et al., 2015). Further, ammonia emitted would mainly decrease the nitrate and ammonium compo-
from traffic is included (∼ 1 % of total ammonia emissions), nents rather than the predominant components of PM2.5 in
although toward the lower end of what has been estimated by this part of the world. Over South Asia, this effect is even
Sun et al. (2016). more pronounced. The decreased emissions, in fact, have a
As shown by Lorenz and Steffens (1997), Webb et al. negligible impact on annual average PM2.5 , reducing it by
(2006) and Kai et al. (2008), a sustainable reduction of am- 0.62 (2 %), 0.76 (3 %) and 1.44 (6 %) µg m−3 , for reductions
monia emissions between 20 to 90 % could be achieved, de- of ammonia emissions of 50, 75 and 100 %. The fraction
pending on the emission process and the methodology ap- of fine-particle mass sensitive to ammonia in this region is
plied (e.g., slurry acidification, adjustment in slurry applica- very low (3 %), since more than 90 % of the aerosol mass
tion, under-floor drying of broiler manure in buildings, re- is not formed by the ammonium-sulfate-nitrate components,
placing urea with ammonium nitrate). As the efficiencies of but rather by organic carbon (∼ 45 % of the total mass) and
the abatement processes are not well established (Missel- dust (∼ 35 % of the total mass).
brook et al., 2002), fixed relative reductions have been ap- In all four regions considered here, the impact of NH3
plied here to all agricultural emissions. Webb et al. (2006) emission reduction on PM2.5 concentrations is strongest in
showed that for the United Kingdom a moderate reduction winter. This is related to the enhanced NH4 NO3 partitioning
in ammonia emission is easily affordable, while the costs are in the gas phase due to the higher temperatures in summer,
likely to increase exponentially for reductions above 25 %. so that a reduction of NH3 influences the gas-phase concen-
The same control measures would be even more difficult to trations more strongly than the particulate phase during this
apply in countries in which livestock production is projected season. The opposite happens during the winter season. Ad-
to largely increase (such as Asia; Delgado et al., 2001), where ditionally, in the REF simulation, the winter total nitrate (gas
they should be adopted on a large scale. and aerosol) concentrations are somewhat higher than dur-
ing the summer over Europe (5.3 vs 4.5 µg m−3 ), USA (1.5
vs 1.0 µg m−3 ), South Asia (10.0 vs 3.4) and East Asia (8.2
3 Results and discussion vs 4.5 µg m−3 ). This is related to the lower boundary layer
height in winter, causing less dilution of the emitted tracers,
3.1 Impact on PM2.5 although in the Northern Hemisphere the ammonia winter
emissions are generally lower than in summertime.
In Figure 5 the relative annual average surface PM2.5 con- The total PM2.5 sulfate (i.e., SO2− −
4 +HSO4 ) is not directly
centration changes between simulations REF_50, REF_75, affected by NH3 emission reductions since it can exist in the
REF_100 and REF are presented. These simulations reflect aerosol phase in the form of ammonium sulfate or ammo-
the impact on PM2.5 of policies imposing an overall de- nium bisulfate, depending on the ammonium concentration.
crease in the agricultural emissions of 50, 75 and 100 %, However, sulfate formation in the aqueous phase is limited
respectively. In Table 3 the predicted PM2.5 concentrations by high acidity. As a consequence, the SO2− 4 concentration
and pH for all simulations are also listed. The largest ef- in PM2.5 decreases, annually averaged, by 11, 23 and 75 %
www.atmos-chem-phys.net/17/12813/2017/ Atmos. Chem. Phys., 17, 12813–12826, 2017A. Pozzer et al.: Impact of agricultural emissions
www.atmos-chem-phys.net/17/12813/2017/
Table 3. Average concentration of PM2.5 and PM2.5 components (in µg m−3 ). SO42− represents total sulfate (i.e., SO42− and HSO4− ). pH average values are also listed.
Region REF simulation REF_50 simulation REF_75 simulation REF_100 simulation
NH4+ NO3− SO42− PM2.5 pH NH4+ NO3− SO42− PM2.5 pH NH4+ NO3− SO42− PM2.5 pH NH4+ NO3− SO42− PM2.5 pH
All year
Europe 0.94 1.80 1.25 8.95 2.04 0.72 1.32 1.20 7.93 1.68 0.53 0.92 1.19 7.22 1.42 0.09 0.27 1.19 5.89 0.98
North America 0.27 0.45 0.56 4.07 1.60 0.20 0.30 0.55 3.73 1.43 0.15 0.21 0.54 3.58 1.31 0.06 0.11 0.54 3.38 1.09
South Asia 0.50 0.39 1.41 23.27 2.87 0.46 0.25 1.41 22.65 2.31 0.42 0.18 1.41 22.51 1.88 0.16 0.12 1.40 21.83 1.15
East Asia 1.56 2.43 2.51 31.12 1.95 1.12 1.47 2.49 29.50 1.59 0.77 0.80 2.49 28.43 1.33 0.14 0.10 2.49 27.04 0.83
World 0.10 0.21 0.32 9.23 1.84 0.08 0.16 0.32 9.05 1.75 0.06 0.13 0.32 8.98 1.68 0.02 0.10 0.32 8.89 1.53
Summer
Europe 0.90 1.02 1.89 7.74 2.26 0.74 0.70 1.88 7.07 1.80 0.60 0.45 1.91 6.72 1.50 0.11 0.10 1.87 5.70 1.04
North America 0.22 0.13 0.68 5.51 1.93 0.18 0.08 0.68 5.32 1.73 0.14 0.06 0.66 5.29 1.59 0.06 0.05 0.67 5.23 1.34
South Asia 0.17 0.19 0.75 16.76 2.96 0.16 0.18 0.74 16.49 2.44 0.14 0.17 0.74 16.44 2.07 0.06 0.16 0.73 16.16 1.40
East Asia 1.21 0.98 3.00 19.33 1.87 0.89 0.50 2.98 18.40 1.57 0.61 0.19 2.94 17.69 1.36 0.09 0.02 2.93 17.04 0.95
World 0.09 0.13 0.36 7.39 1.94 0.07 0.11 0.36 7.25 1.85 0.05 0.09 0.36 7.23 1.78 0.01 0.08 0.36 7.20 1.64
Winter
Atmos. Chem. Phys., 17, 12813–12826, 2017
Europe 1.08 2.48 0.80 11.12 1.90 0.80 1.96 0.75 9.84 1.59 0.55 1.46 0.74 8.86 1.35 0.06 0.47 0.74 6.94 0.90
North America 0.43 1.01 0.48 3.98 1.39 0.29 0.68 0.45 3.36 1.22 0.20 0.47 0.44 2.98 1.10 0.06 0.19 0.43 2.48 0.87
South Asia 0.71 0.57 1.75 29.63 2.95 0.64 0.33 1.75 28.65 2.40 0.58 0.20 1.75 28.48 1.90 0.24 0.11 1.75 27.54 1.03
East Asia 2.07 4.25 2.00 40.16 2.18 1.53 2.96 1.91 37.96 1.73 1.06 1.84 1.90 36.27 1.39 0.18 0.21 1.93 33.61 0.72
World 0.13 0.33 0.30 11.39 1.78 0.10 0.25 0.29 11.14 1.68 0.07 0.19 0.29 11.02 1.60 0.02 0.12 0.29 10.85 1.43
12818A. Pozzer et al.: Impact of agricultural emissions 12819
(a)
(b)
(c)
Figure 5. Relative annual average surface PM2.5 concentration changes (in %) from the three scenarios with agricultural emissions reductions
of 50, 75 and 100 % (a, b and c, respectively).
over Europe, by 15, 28 and 57 % over North America, by 3, On the other hand, the absolute reduction in PM2.5 de-
7 and 50 % over South Asia and by 18, 36 and 74 % over pends on the fraction of fine-particulate mass that is directly
East Asia for a reduction of 50, 75 and 100 % of agricultural ammonia sensitive. As a consequence, Europe has the over-
emissions. This is counterbalanced by an increase of HSO− 4 all largest potential of reducing annual averaged PM2.5 by
concentrations. strongly controlling NH3 emissions (up to 34 %), followed
For Europe and North America, the simultaneous decrease by North America (up to 16 %) and East Asia (up to 13 %),
of nitrate and ammonium makes the reduction of agricultural while South Asia has very limited potential (up to 6 %). Thus
emissions very effective, especially in winter, in accordance it follows that, although the emission decrease needed in Eu-
with the findings of Tsimpidi et al. (2007) and Megaritis et al. rope to reach the ammonia-limited regime is larger than in
(2013). Furthermore, the relationship between ammonia and North America, the effective gain of further reduction – once
PM2.5 concentrations is not linear and is governed by the sul- this regime is reached – is considerably larger. In East Asia,
fate / nitrate ratio (Tsimpidi et al., 2007). Our EMAC simu- where PM2.5 is not ammonia limited, even strong emission
lations reveal that the PM2.5 response to NH3 emissions is decreases would reduce the PM2.5 mass by up to 13 % on the
more linear in winter (compared to summer), since the sul- annual average.
fate / nitrate ratio is generally lower.
Following Makar et al. (2009), the particle neutralization 3.2 Impact on particle pH
2−
ratio (PNR, i.e., (NH+ − −
4 )/(2(SO4 + HSO4 ) + NO3 )) calcu-
lations indicate that in Europe and East Asia (both with In addition to the significant reductions in PM2.5 from am-
PNR equal to 0.20) ammonia concentrations must be de- monia emission controls, which are considered beneficial to
creased relatively more strongly than in North America and human health, we note that the aerosol pH can change sub-
South Asia (PNR equal to 0.13 for both regions) to reach the stantially. This has the potential of altering the particle liq-
ammonia-limited regime, i.e., before PM2.5 can be efficiently uid phase and heterogeneous chemistry, including reactive
controlled by decreasing NH3 emissions. uptake coefficients, the outgassing of relatively weak acids
and the pH of cloud droplets that grow on aerosols, which
in turn affects aqueous-phase sulfate formation. Ammonia is
www.atmos-chem-phys.net/17/12813/2017/ Atmos. Chem. Phys., 17, 12813–12826, 201712820 A. Pozzer et al.: Impact of agricultural emissions
(a)
(b)
(c)
Figure 6. Absolute annual average surface aerosol pH changes (all modes) from three scenarios with agricultural emission reductions of 50,
75 and 100 % (a, b and c, respectively).
in fact the most abundant and efficient base for controlling have a strong influence on halogen activation and aerosol-gas
the aerosol composition over anthropogenically influenced equilibrium of weak acids in the atmosphere.
regions and neutralizes sulfuric, nitric and other acids. Contrary to what was found for PM2.5 , the reduction of pH
In the REF simulation, the particles over the focal regions is larger in summer than in winter. This is due to the lower
are highly acidic, consisting mainly of ammonium sulfate concentrations of ammonia in the aerosol phase in summer
and ammonium nitrate, as also shown by Weber et al. (2016). (see Sect. 3.1), i.e., with relatively low neutralization capabil-
Figure 6 illustrates how the aerosol pH can drop due to ity in this season. Therefore, any further reduction of ammo-
NH3 emission decreases. Over Europe, the calculated mean nia emissions would strongly reduce the neutralization po-
aerosol pH decreases by 0.35, 0.62 and 1.05 pH units for the tential and therefore increase even more drastically the acid-
REF_50, REF_75 and REF_100 simulations. The calcula- ity of the particles.
tions indicate similar decreases over East Asia (0.35, 0.62 It should be mentioned that in the present calculations the
and 1.11 pH units) and smaller decreases over North Amer- chemical impact of alkaline desert dust is not taken into ac-
ica (0.16, 0.29 and 0.51 pH units), while the largest decreases count, which can contribute significantly to PM2.5 over areas
are present over South Asia (0.56, 0.99 and 1.72 pH units). downwind of the deserts (Karydis et al., 2016), e.g., over the
Over South Asia, the impact of ammonia emissions reduc- Indian subcontinent in the dry season and over eastern China
tion on pH is the largest (see Fig. 6) despite the relatively in spring (Wang et al., 2013), so that the pH effect described
small impact of the same changes on PM2.5 . This is due to here is probably an upper limit. This topic is subject of a
the high sulfate concentrations, which are neutralized in de- publication in preparation.
creasing order by the presence of ammonium in the three
sensitivity simulations. The pH of PM2.5 is therefore more 3.3 Impact on public health
sensitive to ammonia emissions (and its atmospheric concen-
trations) than sulfate, as shown by Weber et al. (2016). This From the simulated PM2.5 concentrations, the mortality at-
increase of acidity for reduced ammonia emissions would tributable to air pollution has been calculated following
the method of Lim et al. (2013) and described in detail
in Lelieveld et al. (2015). The exposure-response func-
Atmos. Chem. Phys., 17, 12813–12826, 2017 www.atmos-chem-phys.net/17/12813/2017/A. Pozzer et al.: Impact of agricultural emissions 12821
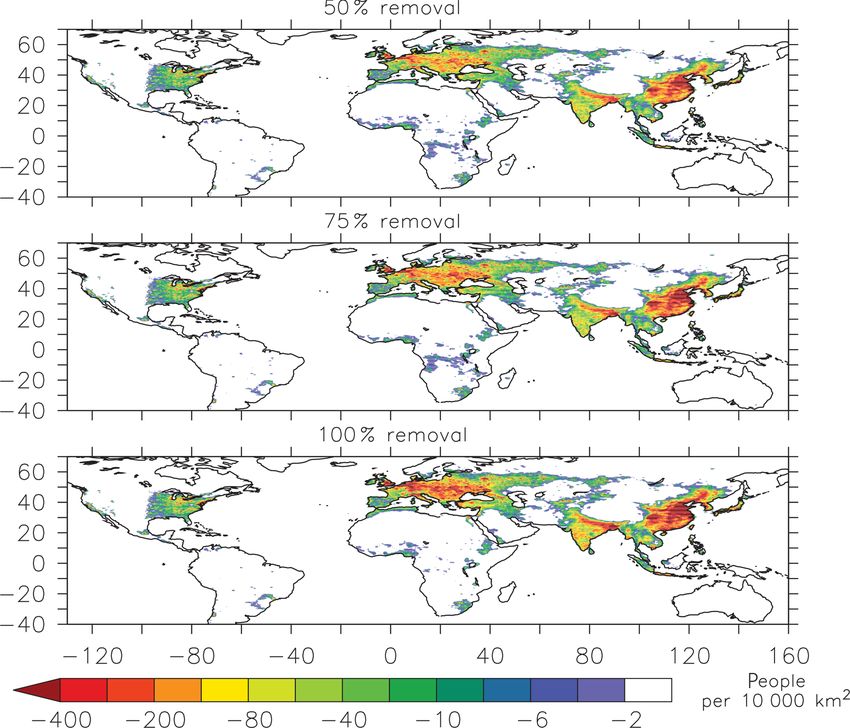
Figure 7. Annual average mortality attributable to PM2.5 concentration changes (in people/10 000 km2 ) from the three scenarios with agri-
cultural emissions reductions of 50, 75 and 100 % (a, b and c, respectively).
Table 4. Mortality attributable to air pollution in 1000 people yr−1 . In parenthesis the minimum-maximum range.
Region REF REF_50 REF_75 REF_100
average range average range average range average range
Europe 277 (148–414) 225 (107–361) 176 (66–313) 55 (9–165)
North America 54 (21–100) 38 (11–81) 26 (6–65) 14 (4–39)
South Asia 778 (410–1140) 753 (396–1107) 750 (395–1102) 696 (365–1030)
East Asia 1381 (607–1929) 1275 (553–1812) 1195 (514–1719) 1037 (447–1527)
World 3155 (1523–4603) 2905 (1375–4313) 2739 (1280–4123) 2353 (1106–3619)
tions of Burnett et al. (2014) are used, which shows how discussed in the supplement of Lelieveld et al. (2015), an
fine-particulate matter is associated with health impacts, uncertainty range of about ±50 % is estimated for the mor-
through chronic obstructive pulmonary disease (COPD), tality attributable to air pollution. The results, presented in
acute lower respiratory infections (ALRI), cerebrovascular Table 4 and Fig. 7, show that a reduction of 50 % in agricul-
disease (CEV), ischaemic heart disease (IHD) and lung can- tural emissions could have a large impact on air-pollution-
cer (LC). Here mortality attributable to PM2.5 at 50 % rel- related mortality, reducing it worldwide by ∼ 8 %, i.e., af-
ative humidity has been estimated; thus it does not account fecting 250 000 people yr−1 (95 % confidence interval (CI):
for ozone-related mortality through COPD, which is ∼ 5 % 148–290). North America would benefit from a large relative
of the total mortality attributable to air pollution (Lelieveld change, reducing the number of deaths by ∼ 30 % (16 000
et al., 2015). The model results were interpolated to the people yr−1 ; 95 % CI: 10–19), followed by Europe (∼ 19 %,
finer grid of the population map (Center for International 52 000 people yr−1 ; 95 % CI: 41–53) and East Asia (∼ 8 %,
Earth Science Information Network , CIESIN) and, due to 105 000 people yr−1 ; 95 % CI: 53–116), while almost no ef-
the coarse model resolution used in this study, it is expected fects are found over South Asia (∼ 3 %, 25 000 people yr−1 ;
to have an underestimation of exposure in urban areas. As 95 % CI: 14–33). The relatively large effect in North America
www.atmos-chem-phys.net/17/12813/2017/ Atmos. Chem. Phys., 17, 12813–12826, 201712822 A. Pozzer et al.: Impact of agricultural emissions
is explained by the shape of the integrated response function (3 %) µg m−3 , respectively) when particulate ammonium ni-
(Burnett et al., 2014), which predicts a steep change in the at- trate concentrations are typically higher than in summer.
tributable fraction at relatively low PM2.5 concentrations. If Our model simulations underscore the strong nonlinear-
it were possible to fully phase out agricultural emissions, the ity that plays a role in the sulfate-nitrate-ammonia system,
global reduction of PM2.5 -related mortality would reduce by which affects the efficiency of PM2.5 controls, especially in
about 801 000 people yr−1 (95 % CI: 417–984). In Europe summer when the sulfate / nitrate ratio is high. A strong re-
the number would be reduced by about 222 000 (95 % CI: duction of PM2.5 in response to NH3 emission regulation is
139–249), in North America by 40 000 (95 % CI: 17–61), in expected once the ammonia-limited regime is reached. As a
East Asia by about 343 000 per year (95 % CI: 159-401) and result, the possible PM2.5 reduction could be as large as ∼ 34
in South Asia by 82 000 per year (95 % CI: 45-110) (Table 4). and ∼ 17 % in Europe and North America, respectively. Our
Ammonia reduction policies should consider the intricate results also suggest that ammonia emission controls could re-
and nonlinear effects through gas-aerosol partitioning and duce the particle pH up to 1.5 pH units in East Asia in winter
multiphase chemistry (including aerosol pH changes), and and more than 1.7 pH units in South Asia, theoretically as-
therefore a coherent decrease of ammonia, nitrogen and sul- suming complete agricultural emission removal, which could
fur emissions is recommended. A coupled reduction of NH3 have repercussions for the reactive uptake of gases from the
and acid precursor emissions (e.g., SO2 ) cannot only limit gas phase and the outgassing of relative weak acids.
the decrease in aerosol pH but can also lead to a more effi- Furthermore, the global mortality attributable to PM2.5
cient reduction of PM2.5 concentrations than an NH3 emis- could be reduced by ∼ 250 000 (95 % CI: 148–290) peo-
sion control alone, as shown by (Tsimpidi et al., 2007). In the ple yr−1 worldwide worldwide by decreasing agricultural
electronic supplement, a table showing the changes in mor- emissions by 50 %, with a gain of 16 000 (30 %), 52 000
tality for the top 100 most populated countries is presented. (19 %), 25 000 (3 %) and 105 000 (8 %) people yr−1 in North
Consistently with the results of Lee et al. (2015), central and America, Europe, South and East Asia, respectively. A total
eastern European countries would benefit strongly from agri- phase-out of agricultural emissions would even reduce the
cultural emission reductions, drastically decreasing the per mortality attributable to air pollution worldwide by about
capita air-pollution-related mortality. This can be seen also in 801 000 people yr−1 (25 %), in Europe by about 222 000
Fig. 5, as the strongest relative changes in PM2.5 due to agri- people yr−1 (80 %), in North America by about 40 000 peo-
cultural emissions reduction are found in central and east- ple yr−1 (74 %), in South Asia by about 82 000 people yr−1
ern Europe, where a 50 % emission reduction would decrease (10 %) and in East Asia by about 343 000 people yr−1 (25 %).
mortality attributable to air pollution by ∼ 15–20 %. These strong impacts are related to the nonlinear responses
It must be emphasized that, although many epidemiolog- in both the sulfate-nitrate-ammonia system and the exposure-
ical studies have linked long-term PM2.5 exposure to pub- response functions at relatively low PM2.5 concentrations.
lic health outcome, it is yet unclear whether any particular Therefore, emission control policies, especially in North
aerosol components and/or source categories are predomi- America and Europe, should involve strong ammonia emis-
nantly responsible for air-pollution-related mortality. The de- sion decreases to optimally reduce PM2.5 concentrations as
bate is open and firm conclusions of a specific relationship well as further reductions in sulfur and nitrogen oxides emis-
have not been reached (Harrison and Yin, 2000; Reiss et al., sions to avoid strong acidification of particles.
2007), although it is expected that some aerosol components
may be more toxic than others (Shiraiwa et al., 2012; Mar
et al., 2006; Ito et al., 2006). Data availability. The data from all model integrations are avail-
able from the authors upon request.
4 Conclusions
The Supplement related to this article is available
Pinder et al. (2007) showed that in North America emis- online at https://doi.org/10.5194/acp-17-12813-2017-
sion controls of SO2 and NOx are likely to be very costly supplement.
and probably less efficient than decreasing agricultural emis-
sions. Therefore, the regulation of ammonia emissions from
agricultural activities offers the possibility of relatively cost- Competing interests. The authors declare that they have no conflict
of interest.
effective control policies for PM2.5 . Our model simulations
indicate that a 50 % decrease of ammonia emissions could
reduce the annual, geographical average near-surface PM2.5
Special issue statement. This article is part of the special issue
concentrations up to ∼ 1.0 (11 %), 0.3 (8 %), 1.6 (5 %) and “The Modular Earth Submodel System (MESSy) (ACP/GMD inter-
0.6 (2 %) µg m−3 in Europe, North America, East Asia and journal SI)”. It is not associated with a conference.
South Asia, respectively. The reduction can even be larger
in winter (up to ∼ 1.3 (11 %), 0.6 (15 %), 2.2 (5 %) and 1.0
Atmos. Chem. Phys., 17, 12813–12826, 2017 www.atmos-chem-phys.net/17/12813/2017/A. Pozzer et al.: Impact of agricultural emissions 12823
Acknowledgements. Vlassis A. Karydis acknowledges support Crippa, M., Janssens-Maenhout, G., Dentener, F., Guizzardi, D.,
from a FP7 Marie Curie Career Integration Grant (project refer- Sindelarova, K., Muntean, M., Van Dingenen, R., and Granier,
ence 618349). Alexandra P. Tsimpidi acknowledges support from C.: Forty years of improvements in European air quality: re-
a DFG Individual Grant Programme (project reference TS 335/2-1). gional policy-industry interactions with global impacts, Atmos.
Chem. Phys., 16, 3825–3841, https://doi.org/10.5194/acp-16-
The article processing charges for this open-access 3825-2016, 2016.
publication were covered by the Max Planck Society. Delgado, C., Rosegrant, M., Steinfeld, H., Ehui, S., and Courbois,
C.: Livestock to 2020: the next food revolution, Outlook Agr.,
Edited by: Qiang Zhang 30, 27–29, 2001.
Reviewed by: two anonymous referees de Meij, A., Krol, M., Dentener, F., Vignati, E., Cuvelier, C., and
Thunis, P.: The sensitivity of aerosol in Europe to two different
emission inventories and temporal distribution of emissions, At-
mos. Chem. Phys., 6, 4287–4309, https://doi.org/10.5194/acp-6-
4287-2006, 2006.
References De Meij, A., Thunis, P., Bessagnet, B., and Cuvelier, C.: The sensi-
tivity of the CHIMERE model to emissions reduction scenarios
Aneja, V. P., Blunden, J., Roelle, P. A., Schlesinger, W. H., on air quality in Northern Italy, Atmos. Environ., 43, 1897–1907,
Knighton, R., Niyogi, D., Gilliam, W., Jennings, G., and Duke, 2009.
C. S.: Workshop on agricultural air quality: state of the science, de Meij, A., Pozzer, A., and Lelieveld, J.: Trend analy-
Atmos. Environ., 42, 3195–3208, 2008. sis in aerosol optical depths and pollutant emission esti-
Battye, W., Aneja, V. P., and Roelle, P. A.: Evaluation and im- mates between 2000 and 2009, Atmos. Environ., 51, 75–85,
provement of ammonia emissions inventories, Atmos. Environ., https://doi.org/10.1016/j.atmosenv.2012.01.059, 2012a.
37, 3873–3883, https://doi.org/10.1016/S1352-2310(03)00343- de Meij, A., Pozzer, A., Pringle, K., Tost, H., and Lelieveld,
1, 2003. J.: EMAC model evaluation and analysis of atmospheric
Bauer, S. E., Tsigaridis, K., and Miller, R.: Significant atmospheric aerosol properties and distribution with a focus on the
aerosol pollution caused by world food cultivation, Geophys. Mediterranean region, Atmos. Res., 114–115, 38–69,
Res. Lett., 43, 5394–5400, 2016. https://doi.org/10.1016/j.atmosres.2012.05.014, 2012b.
Behera, S. N., Sharma, M., Aneja, V. P., and Balasubramanian, R.: Dentener, F., Kinne, S., Bond, T., Boucher, O., Cofala, J., Gen-
Ammonia in the atmosphere: a review on emission sources, at- eroso, S., Ginoux, P., Gong, S., Hoelzemann, J. J., Ito, A.,
mospheric chemistry and deposition on terrestrial bodies, Envi- Marelli, L., Penner, J. E., Putaud, J.-P., Textor, C., Schulz, M.,
ron. Sci. Pollut. R., 20, 8092–8131, 2013. van der Werf, G. R., and Wilson, J.: Emissions of primary
Bessagnet, B., Beauchamp, M., Guerreiro, C., de Leeuw, F., Tsyro, aerosol and precursor gases in the years 2000 and 1750 pre-
S., Colette, A., Meleux, F., Rouïl, L., Ruyssenaars, P., Sauter, scribed data-sets for AeroCom, Atmos. Chem. Phys., 6, 4321–
F., Velders, G. J. M., Foltescu, V. L., and van Aardenne, J.: Can 4344, https://doi.org/10.5194/acp-6-4321-2006, 2006.
further mitigation of ammonia emissions reduce exceedances of Doering, U., Monni, S., Pagliari, V., Orlandini, L., van Aardenne,
particulate matter air quality standards?, Environ. Sci. Policy, 44, J., and SanMartin, F.: CIRCE report D8.1.1 : Emission inventory
149–163, 2014. for the past period 1990–2005 on 0.1x0.1 grid, Tech. rep., Project
Beusen, A., Bouwman, A., Heuberger, P., Van Drecht, G., and Van FP6: 6.3 , No. 036961, 2009a.
Der Hoek, K.: Bottom-up uncertainty estimates of global ammo- Doering, U., van Aardenne, J., Monni, S., Pagliari, V., Orlandini, L.,
nia emissions from global agricultural production systems, At- and SanMartin, F.: CIRCE report D8.1.2 – Evaluation emission
mos. Environ., 42, 6067–6077, 2008. database 1990–2005, Tech. rep., Project FP6: 6.3, No. 036961,
Brandt, J., Silver, J. D., Christensen, J. H., Andersen, M. S., Bøn- 2009b.
løkke, J. H., Sigsgaard, T., Geels, C., Gross, A., Hansen, A. B., Doering, U., van Aardenne, J., Monni, S., Pagliari, V., Orlandini,
Hansen, K. M., Hedegaard, G. B., Kaas, E., and Frohn, L. M.: L., and SanMartin, F.: CIRCE report D8.1.3 – Update of grid-
Contribution from the ten major emission sectors in Europe and ded emission inventories, addition of period 1990–1999 to 2000-
Denmark to the health-cost externalities of air pollution using 2005 dataset, Tech. rep., Project FP6: 6.3, No. 036961, 2009c.
the EVA model system – an integrated modelling approach, At- Emmons, L. K., Hauglustaine, D. A., Müller, J.-F., Carroll, M. A.,
mos. Chem. Phys., 13, 7725–7746, https://doi.org/10.5194/acp- Brasseur, G. P., Brunner, D., Staehelin, J., Thouret, V., and
13-7725-2013, 2013. Marenco, A.: Data composites of airborne observations of tropo-
Burnett, R. T., Pope III, C. A., Ezzati, M., Olives, C., Lim, S. S., spheric ozone and its precursors, J. Geophys. Res., 105, 20497–
Mehta, S., Shin, H. H., Singh, G., Hubbell, B., Brauer, M., Ross, 20538, 2000.
A. H., Smith, K. R., Balmes, J. R., Bruce, N. G., Kan, H., Laden, Fountoukis, C. and Nenes, A.: ISORROPIA II: a computa-
F., Prüss-Ustün, A., Turner, M. C., Gapstur, S. M., Diver, W. R., tionally efficient thermodynamic equilibrium model for K+ –
2−
and Cohen, A.: An integrated risk function for estimating the Ca2+ –Mg2+ –NH+ + − −
4 –Na –SO4 –NO3 –Cl –H2 O aerosols, At-
global burden of disease attributable to ambient fine particulate mos. Chem. Phys., 7, 4639–4659, https://doi.org/10.5194/acp-7-
matter exposure, Environ. Health Perspect., 122, 397–403, 2014. 4639-2007, 2007.
Center for International Earth Science Information Net- Goebes, M. D., Strader, R., and Davidson, C.: An ammonia emis-
work (CIESIN), (FAO), and de Agricultura Tropical (CIAT): sion inventory for fertilizer application in the United States, At-
Gridded Population of the World, Version 3 (GPWv3): Popula-
tion Count Grid, Future Estimates., 2005.
www.atmos-chem-phys.net/17/12813/2017/ Atmos. Chem. Phys., 17, 12813–12826, 201712824 A. Pozzer et al.: Impact of agricultural emissions mos. Environ., 37, 2539–2550, https://doi.org/10.1016/S1352- Lee, C. J., Martin, R. V., Henze, D. K., Brauer, M., Cohen, A., and 2310(03)00129-8, 2003. Donkelaar, A. V.: Response of global particulate-matter-related Harrison, R. M. and Yin, J.: Particulate matter in the atmosphere: mortality to changes in local precursor emissions, Environ. Sci. which particle properties are important for its effects on health?, Technol., 49, 4335–4344, 2015. Sci. Total Environ., 249, 85–101, 2000. Lelieveld, J., Evans, J., Fnais, M., Giannadaki, D., and Pozzer, A.: Heald, C. L., Collett Jr., J. L., Lee, T., Benedict, K. B., Schwandner, The contribution of outdoor air pollution sources to premature F. M., Li, Y., Clarisse, L., Hurtmans, D. R., Van Damme, M., mortality on a global scale, Nature, 525, 367–371, 2015. Clerbaux, C., Coheur, P.-F., Philip, S., Martin, R. V., and Pye, H. Lim, S. S., Vos, T., Flaxman, A. D., Danaei, G., Shibuya, K., Adair- O. T.: Atmospheric ammonia and particulate inorganic nitrogen Rohani, H., AlMazroa, M. A., Amann, M., Anderson, H. R., An- over the United States, Atmos. Chem. Phys., 12, 10295–10312, drews, K. G., et al.: A comparative risk assessment of burden of https://doi.org/10.5194/acp-12-10295-2012, 2012. disease and injury attributable to 67 risk factors and risk factor Holt, J., Selin, N. E., and Solomon, S.: Changes in inorganic fine clusters in 21 regions, 1990–2010: a systematic analysis for the particulate matter sensitivities to precursors due to large-scale Global Burden of Disease Study 2010, Lancet, 380, 2224–2260, US emissions reductions, Environ. Sci. Technol., 49, 4834–4841, 2013. 2015. Lorenz, F. and Steffens, G.: Effect of application techniques on am- IPCC: Climate Change 2013: The Physical Science Basis. Contri- monia losses and herbage yield following slurry application to bution of Working Group I to the Fifth Assessment Report of the grassland, edited by: Jarvis, S. C. and Pain, B. F., Gaseous Nitro- Intergovernmental Panel on Climate Change, edited by: Stocker, gen Emissions from Grasslands, CAB International, Wallingford T., Qin, D., Plattner, G.-K., Tignor, M., Allen, S., Boschung, J., 287–292, 1997. Nauels, A., Xia, Y., Bex, V., and Midgley, P., vol. 2, Cambridge Makar, P. A., Moran, M. D., Zheng, Q., Cousineau, S., Sassi, University Press, 2013. M., Duhamel, A., Besner, M., Davignon, D., Crevier, L.-P., and Ito, K., Christensen, W. F., Eatough, D. J., Henry, R. C., Kim, E., Bouchet, V. S.: Modelling the impacts of ammonia emissions re- Laden, F., Lall, R., Larson, T. V., Neas, L., Hopke, P. K., and ductions on North American air quality, Atmos. Chem. Phys., 9, Thurston, G. D.: PM source apportionment and health effects: 7183–7212, https://doi.org/10.5194/acp-9-7183-2009, 2009. 2. An investigation of intermethod variability in associations be- Mar, T. F., Ito, K., Koenig, J. Q., Larson, T. V., Eatough, D. J., tween source-apportioned fine particle mass and daily mortality Henry, R. C., Kim, E., Laden, F., Lall, R., Neas, L., Stälzel, M., in Washington, DC, J. Expo. Sci. Env. Epid., 16, 300–320, 2006. Paatero, P., and Hopke, P. K., and Thurston, G. D.: PM source ap- Jöckel, P., Sander, R., Kerkweg, A., Tost, H., and Lelieveld, J.: portionment and health effects. 3. Investigation of inter-method Technical Note: The Modular Earth Submodel System (MESSy) variations in associations between estimated source contributions – a new approach towards Earth System Modeling, Atmos. of PM2.5 and daily mortality in Phoenix, AZ, J. Expo. Sci. Env. Chem. Phys., 5, 433–444, https://doi.org/10.5194/acp-5-433- Epid., 16, 311, 2006. 2005, 2005. Megaritis, A. G., Fountoukis, C., Charalampidis, P. E., Pilinis, C., Jöckel, P., Tost, H., Pozzer, A., Brühl, C., Buchholz, J., Ganzeveld, and Pandis, S. N.: Response of fine particulate matter concen- L., Hoor, P., Kerkweg, A., Lawrence, M. G., Sander, R., Steil, trations to changes of emissions and temperature in Europe, At- B., Stiller, G., Tanarhte, M., Taraborrelli, D., van Aardenne, J., mos. Chem. Phys., 13, 3423–3443, https://doi.org/10.5194/acp- and Lelieveld, J.: The atmospheric chemistry general circulation 13-3423-2013, 2013. model ECHAM5/MESSy1: consistent simulation of ozone from Misselbrook, T. H., Smith, K. A., Johnson, R. A., and Pain, B. F.: the surface to the mesosphere, Atmos. Chem. Phys., 6, 5067– Slurry Application Techniques to reduce Ammonia Emissions: 5104, https://doi.org/10.5194/acp-6-5067-2006, 2006. Results of some UK Field-scale Experiments, Biosyst. Eng., 81, Kai, P., Pedersen, P., Jensen, J., Hansen, M. N., and Sommer, S. G.: 313–321, 2002. A whole-farm assessment of the efficacy of slurry acidification in Muller, N. Z. and Mendelsohn, R.: Measuring the damages of air reducing ammonia emissions, Eur. J. Agron., 28, 148–154, 2008. pollution in the United States, J. Environ. Econ. Manag., 54, 1– Karydis, V. A., Tsimpidi, A. P., Lei, W., Molina, L. T., and Pandis, 14, 2007. S. N.: Formation of semivolatile inorganic aerosols in the Mexico Nenes, A., Pandis, S. N., and Pilinis, C.: ISORROPIA: A City Metropolitan Area during the MILAGRO campaign, Atmos. new thermodynamic equilibrium model for multiphase multi- Chem. Phys., 11, 13305–13323, https://doi.org/10.5194/acp-11- component inorganic aerosols, Aquat. Geochem., 4, 123–152, 13305-2011, 2011. https://doi.org/10.1023/A:1009604003981, 1998a. Karydis, V. A., Tsimpidi, A. P., Pozzer, A., Astitha, M., and Nenes, A., Pandis, S. N., and Pilinis, C.: Continued Development Lelieveld, J.: Effects of mineral dust on global atmospheric and Testing of a New Thermodynamic Aerosol Module for Ur- nitrate concentrations, Atmos. Chem. Phys., 16, 1491–1509, ban and Regional Air Quality Models, Atmos. Environ., 33, https://doi.org/10.5194/acp-16-1491-2016, 2016. 1553–1560, 1998b. Kuklinska, K., Wolska, L., and Namiesnik, J.: Air quality policy in Pathak, R. K., Wang, T., Ho, K., and Lee, S.: Characteristics of sum- the US and the EU – a review, Atmospheric Pollution Research, mertime PM 2.5 organic and elemental carbon in four major Chi- 6, 129–137, 2015. nese cities: implications of high acidity for water-soluble organic Lamarque, J., Kyle, G., Meinshausen, M., Riahi, K., Smith, S., van carbon (WSOC), Atmos. Environ., 45, 318–325, 2011. Vuuren, D., Conley, A., and Vitt, F.: Global and regional evo- Paulot, F. and Jacob, D. J.: Hidden cost of US agricultural exports: lution of short-lived radiatively-active gases and aerosols in the particulate matter from ammonia emissions, Environ. Sci. Tech- Representative Concentration Pathways, Climatic Change, 109, nol., 48, 903–908, 2014. 191–212, https://doi.org/10.1007/s10584-011-0155-0, 2011. Atmos. Chem. Phys., 17, 12813–12826, 2017 www.atmos-chem-phys.net/17/12813/2017/
A. Pozzer et al.: Impact of agricultural emissions                                                                                      12825

Paulot, F., Jacob, D. J., Pinder, R., Bash, J., Travis, K., and Henze,     Roeckner, E., Brokopf, R., Esch, M., Giorgetta, M., Hagemann, S.,
   D.: Ammonia emissions in the United States, European Union,               Kornblueh, L., Manzini, E., Schlese, U., and Schulzweida, U.:
   and China derived by high-resolution inversion of ammonium                Sensitivity of simulated climate to horizontal and vertical reso-
   wet deposition data: Interpretation with a new agricultural emis-         lution in the ECHAM5 atmosphere model, J. Climate, 19, 3771–
   sions inventory (MASAGE_NH3), J. Geophys. Res., 119, 4343–                3791, 2006.
   4364, 2014.                                                             Sander, R., Kerkweg, A., Jöckel, P., and Lelieveld, J.: Tech-
Paulot, F., Fan, S., and Horowitz, L.: Contrasting seasonal responses        nical note: The new comprehensive atmospheric chem-
   of sulfate aerosols to declining SO2 emissions in the Eastern US:         istry module MECCA, Atmos. Chem. Phys., 5, 445–450,
   implications for the efficacy of SO2 emission controls, Geophys.          https://doi.org/10.5194/acp-5-445-2005, 2005.
   Res. Lett., 44, https://doi.org/10.1002/2016GL070695, 2016.             Sander, R., Baumgaertner, A., Gromov, S., Harder, H., Jöckel, P.,
Pinder, R., Gilliland, A., and Dennis, R.: Environmental impact              Kerkweg, A., Kubistin, D., Regelin, E., Riede, H., Sandu, A.,
   of atmospheric NH3 emissions under present and future con-                Taraborrelli, D., Tost, H., and Xie, Z.-Q.: The atmospheric chem-
   ditions in the eastern United States, Geophys. Res. Lett., 35,            istry box model CAABA/MECCA-3.0, Geosci. Model Dev., 4,
   https://doi.org/10.1002/2016GL070695, 2008.                               373–380, https://doi.org/10.5194/gmd-4-373-2011, 2011.
Pinder, R. W., Adams, P. J., and Pandis, S. N.: Ammonia emission           Schaap, M., van Loon, M., ten Brink, H. M., Dentener, F. J., and
   controls as a cost-effective strategy for reducing atmospheric par-       Builtjes, P. J. H.: Secondary inorganic aerosol simulations for
   ticulate matter in the eastern United States, Environ. Sci. Tech-         Europe with special attention to nitrate, Atmos. Chem. Phys., 4,
   nol., 41, 380–386, 2007.                                                  857–874, https://doi.org/10.5194/acp-4-857-2004, 2004.
Pozzer, A., Jöckel, P., Tost, H., Sander, R., Ganzeveld, L.,               Shiraiwa, M., Selzle, K., and Pöschl, U.: Hazardous components
   Kerkweg, A., and Lelieveld, J.: Simulating organic species                and health effects of atmospheric aerosol particles: reactive oxy-
   with the global atmospheric chemistry general circulation                 gen species, soot, polycyclic aromatic compounds and allergenic
   model ECHAM5/MESSy1: a comparison of model results                        proteins, Free Radical Res., 46, 927–939, 2012.
   with observations, Atmos. Chem. Phys., 7, 2527–2550,                    Sotiropoulou, R., Tagaris, E., and Pilinis, C.: An estimation of
   https://doi.org/10.5194/acp-7-2527-2007, 2007.                            the spatial distribution of agricultural ammonia emissions in the
Pozzer, A., Jöckel, P., and Van Aardenne, J.: The influence of the           Greater Athens Area, Sci. Total Environ., 318, 159–169, 2004.
   vertical distribution of emissions on tropospheric chemistry, At-       Sun, K., Tao, L., Miller, D. J., Pan, D., Golston, L. M., Zondlo,
   mos. Chem. Phys., 9, 9417–9432, https://doi.org/10.5194/acp-9-            M. A., Griffin, R. J., Wallace, H. W., Leong, Y. J., Yang,
   9417-2009, 2009.                                                          M. Y. M., Zhang, Y., Mauzerall, D. L., and Zhu, T.: Vehi-
Pozzer, A., de Meij, A., Pringle, K. J., Tost, H., Doering, U. M., van       cle Emissions as an Important Urban Ammonia Source in the
   Aardenne, J., and Lelieveld, J.: Distributions and regional bud-          United States and China, Environ. Sci. Technol., 51, 2472–2481,
   gets of aerosols and their precursors simulated with the EMAC             https://doi.org/10.1021/acs.est.6b02805, 2016.
   chemistry-climate model, Atmos. Chem. Phys., 12, 961–987,               Thornton, J. A., Kercher, J. P., Riedel, T. P., Wagner, N. L., Cozic,
   https://doi.org/10.5194/acp-12-961-2012, 2012a.                           J., Holloway, J. S., Dubé, W. P., Wolfe, G. M., Quinn, P. K., Mid-
Pozzer, A., Zimmermann, P., Doering, U. M., van Aar-                         dlebrook, A. M., Alexander, B., and Brown, S. S.: A large atomic
   denne, J., Tost, H., Dentener, F., Janssens-Maenhout, G., and             chlorine source inferred from mid-continental reactive nitrogen
   Lelieveld, J.: Effects of business-as-usual anthropogenic emis-           chemistry, Nature, 464, 271–274, 2010.
   sions on air quality, Atmos. Chem. Phys., 12, 6915–6937,                Tsimpidi, A. P., Karydis, V. A., and Pandis, S. N.: Response of inor-
   https://doi.org/10.5194/acp-12-6915-2012, 2012b.                          ganic fine particulate matter to emission changes of sulfur diox-
Pringle, K. J., Tost, H., Message, S., Steil, B., Giannadaki, D.,            ide and ammonia: The eastern United States as a case study, J.
   Nenes, A., Fountoukis, C., Stier, P., Vignati, E., and Lelieveld, J.:     Am. Waste Manage. Assoc., 57, 1489–1498, 2007.
   Description and evaluation of GMXe: a new aerosol submodel              Tsimpidi, A. P., Karydis, V. A., and Pandis, S. N.: Response of fine
   for global simulations (v1), Geosci. Model Dev., 3, 391–412,              particulate matter to emission changes of oxides of nitrogen and
   https://doi.org/10.5194/gmd-3-391-2010, 2010a.                            anthropogenic volatile organic compounds in the Eastern United
Pringle, K. J., Tost, H., Pozzer, A., Pöschl, U., and Lelieveld, J.:         States, J. Am. Waste Manage. Assoc., 58, 1463–1473, 2008.
   Global distribution of the effective aerosol hygroscopicity pa-         van Donkelaar, A., Martin, R. V., Brauer, M., Kahn, R., Levy, R.,
   rameter for CCN activation, Atmos. Chem. Phys., 10, 5241–                 Verduzco, C., and Villeneuve, P. J.: Global Estimates of Ambi-
   5255, https://doi.org/10.5194/acp-10-5241-2010, 2010b.                    ent Fine Particulate Matter Concentrations from Satellite-Based
Pye, H., Liao, H., Wu, S., Mickley, L., Jacob, D., Henze, D., and            Aerosol Optical Depth: Development and Application, Envi-
   Seinfeld, J.: Effect of changes in climate and emissions on future        ron. Health Perspect., 118, https://doi.org/10.1289/ehp.0901623,
   sulfate-nitrate-ammonium aerosol levels in the United States, J.          2010.
   Geophys. Res., 114, 1–18, 2009.                                         van Vuuren, D., Edmonds, J., Kainuma, M., Riahi, K., Thomson, A.,
Redington, A., Derwent, R., Witham, C., and Manning, A.: Sensi-              Hibbard, K., Hurtt, G., Kram, T., Krey, V., Lamarque, J.-F., Ma-
   tivity of modelled sulphate and nitrate aerosol to cloud, pH and          sui, T., Meinshausen, M., Nakicenovic, N., Smith, S., and Rose,
   ammonia emissions, Atmos. Environ., 43, 3227–3234, 2009.                  S.: The representative concentration pathways: an overview, Cli-
Reiss, R., Anderson, E. L., Cross, C. E., Hidy, G., Hoel, D., Mc-            matic Change, 109, 5–31, https://doi.org/10.1007/s10584-011-
   Clellan, R., and Moolgavkar, S.: Evidence of health impacts of            0148-z, 2011a.
   sulfate-and nitrate-containing particles in ambient air, Inhal. Tox-    van Vuuren, D., Edmonds, J., Kainuma, M., Riahi, K., and
   icol., 19, 419–449, 2007.                                                 Weyant, J.: A special issue on the RCPs, Climatic Change, 109,
                                                                             https://doi.org/10.1007/s10584-011-0157-y, 2011b.

www.atmos-chem-phys.net/17/12813/2017/                                                    Atmos. Chem. Phys., 17, 12813–12826, 2017
You can also read