Amplification of light absorption of black carbon associated with air pollution
←
→
Page content transcription
If your browser does not render page correctly, please read the page content below
Atmos. Chem. Phys., 18, 9879–9896, 2018
https://doi.org/10.5194/acp-18-9879-2018
© Author(s) 2018. This work is distributed under
the Creative Commons Attribution 4.0 License.

Amplification of light absorption of black carbon associated
with air pollution
Yuxuan Zhang1,2 , Qiang Zhang1 , Yafang Cheng3,2 , Hang Su3,2 , Haiyan Li4 , Meng Li1,2 , Xin Zhang1 , Aijun Ding5 , and
Kebin He4
1 Ministry   of Education Key Laboratory for Earth System Modeling, Department of Earth System Science,
Tsinghua University, Beijing 100084, China
2 Multiphase Chemistry Department, Max Planck Institute for Chemistry, 55128 Mainz, Germany
3 Institute for Environmental and Climate Research, Jinan University, Guangzhou 510630, China
4 State Key Joint Laboratory of Environment Simulation and Pollution Control, School of Environment,

Tsinghua University, Beijing 100084, China
5 Institute for Climate and Global Change Research, School of Atmospheric Sciences, Nanjing University, Nanjing, China

Correspondence: Qiang Zhang (qiangzhang@tsinghua.edu.cn)

Received: 21 October 2017 – Discussion started: 26 January 2018
Revised: 15 June 2018 – Accepted: 25 June 2018 – Published: 13 July 2018

Abstract. The impacts of black carbon (BC) aerosols on air       from regional sources outside of Beijing. These regionally
quality, boundary layer dynamics and climate depend not          sourced BC-containing particles were characterized by more
only on the BC mass concentration but also on the light ab-      coating materials on BC surfaces due to more coating pre-
sorption capability of BC. It is well known that the light ab-   cursors within more polluted air, which contributed ∼ 75 %
sorption capability of BC depends on the amount of coating       of the increase in theoretical light absorption capability of
materials (namely other species that condense and coagulate      BC observed in Beijing during the polluted period (PM1 of
on BC). However, the difference of light absorption capa-        ∼ 230 µg m−3 ) compared to that in the clean period (PM1 of
bility of ambient BC-containing particles under different air    ∼ 10 µg m−3 ). Due to the increase in theoretical light absorp-
pollution conditions (e.g., clean and polluted conditions) re-   tion capability of BC associated with air pollution, the di-
mains unclear due to the complex aging process of BC in the      rect radiative forcing of BC was estimated to be increased
atmosphere. In this work, we investigated the evolution of       by ∼ 18 % based on a simple radiation transfer model. Our
light absorption capability for BC-containing particles with     work identified an amplification of theoretical light absorp-
changing pollution levels in urban Beijing, China. During        tion and direct radiative forcing under a more polluted air
the campaign period (17 to 30 November 2014), with an in-        environment due to more coating materials on BC. The air
crease in PM1 concentration from ∼ 10 to ∼ 230 µg m−3 , we       pollution control measures may, however, break the amplifi-
found that the mass-weighted averages of the aging degree        cation effect by reducing emissions of both BC and the coat-
and theoretical light absorption capability of BC-containing     ing precursors and achieve co-benefits of both air quality and
particles increased by ∼ 33 % and ∼ 18 %, respectively, indi-    climate.
cating stronger light absorption capability of BC-containing
particles under more polluted conditions due to more coat-
ing materials on the BC surface. By using an effective emis-
sion intensity (EEI) model, we further found that aging dur-     1   Introduction
ing regional transport plays an important role in the differ-
ence in the light absorption capability of BC-containing par-    Black carbon (BC) is an important aerosol component that
ticles under different air pollution levels. During the pol-     absorbs visible sunlight and contributes to heating of the at-
lution episode, ∼ 63 % of the BC over Beijing originated         mosphere (Menon et al., 2002; Bond and Bergstrom, 2006;
                                                                 Gustafsson and Ramanathan, 2016). Atmospheric BC can

Published by Copernicus Publications on behalf of the European Geosciences Union.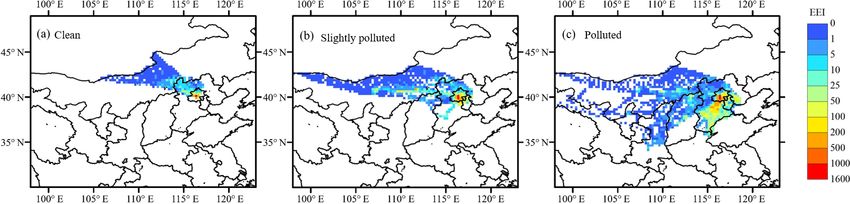
9880                                                        Y. Zhang et al.: Amplification of light absorption of black carbon

impact climate through radiative effects, which are strongly        developed and developing countries (Peng et al., 2016), and
associated with the optical properties of BC, especially light      this difference is likely due to the differences in air pollution
absorption (Jacobson, 2000; Lesins et al., 2002; Cheng et           levels.
al., 2006; Ramanathan and Carmichael, 2008). Estimating                To date, whether and how the aging degree and light ab-
the climate effects of BC is one of the major challenges            sorption capability of BC-containing particles will change
in climate change research, partly due to large uncertain-          with air pollution development is still unclear. Although the
ties in the light absorption capability of BC-containing parti-     enhancement of BC light absorption due to coating materi-
cles under ambient conditions (Cappa et al., 2012; Liu et al.,      als on BC surfaces has already been intensively investigated
2015; Gustafsson and Ramanathan, 2016; Liu et al., 2017).           (Schnaiter et al., 2005; Moffet et al., 2009; Shiraiwa et al.,
The light absorption capability of atmospheric BC is com-           2010; Zhang et al., 2016), there are few studies on the evolu-
plex and poorly quantified, and it changes with the mor-            tion of the light absorption capability of BC-containing par-
phology, density and mixing state of the BC-containing par-         ticles with changing air pollution levels. The variation in the
ticles (Schnaiter et al., 2005; Zhang et al., 2008; Knox et         light absorption capability of BC-containing particles asso-
al., 2009; Peng et al., 2016). Previous theoretical (Jacobson,      ciated with air pollution can lead to different effects of BC
2001; Moffet et al., 2009; Zhang et al., 2016) and observa-         aerosols on air quality and climate under different pollution
tional (Knox et al., 2009; Cappa et al., 2012; Peng et al.,         levels. To improve the evaluation of BC-related effects on air
2016) studies showed a broad range of absorption enhance-           quality and climate, some models have considered BC inter-
ments (1.05–3.05) of BC-containing particles during the at-         nally mixed with other species (namely coating materials on
mospheric aging process. To date, conflicts remain between          BC surface), which can affect the light absorption capability
model- and observation-based studies of the light absorption        of BC-containing particles. However, the difference of coat-
capability of atmospheric BC-containing particles (Jacobson,        ing materials on BC under different air pollution conditions
2001; Cappa et al., 2012; Liu et al., 2015; Liu et al., 2017).      remains unclear.
   The light absorption capability of BC-containing particles          In this work, we conducted an intensive field measure-
depends strongly on the particle mixing state (Liu et al.,          ment campaign in urban Beijing, China, to investigate the
2015; Liu et al., 2017), i.e., the degree of internal mixing        difference of the theoretical light absorption capability of at-
between BC and other particle species (i.e., non-BC com-            mospheric BC-containing particles under different pollution
ponents) by the atmospheric aging process (i.e., condensa-          levels. First, we analyzed the evolution of theoretical light
tion, coagulation and heterogeneous oxidation). The non-            absorption capability of BC with increasing air pollution lev-
BC species (i.e., coating materials) on the surface of BC           els and estimated the relationship between the changing rate
cores can enhance BC light absorption via the lensing effect        in the theoretical light absorption capability of BC and that
(namely, the coating materials act as a lens to focus more          in the PM1 or BC mass concentrations. We then explored the
photons on BC; Fuller et al., 1999; Jacobson, 2001; Bond et         cause of the evolution of theoretical light absorption capabil-
al., 2006; Lack and Cappa, 2010). In terms of individual BC-        ity of BC with increasing air pollution levels and evaluated
containing particles, more coating materials result in stronger     the relative importance of regional transport. Finally, we dis-
light absorption capability. The coating materials on the BC        cussed the impact of changes in BC light absorption capabil-
surface are controlled by secondary processes (e.g., photo-         ity with pollution levels on BC radiative forcing.
chemical production) (Metcalf et al., 2013).
   The production of secondary aerosols in the atmosphere           2     Methods
varies significantly with pollution levels (Cheng, 2008; Yang
et al., 2015; Zheng et al., 2016; Mu et al., 2018), indicat-        2.1    Sampling site and measurements
ing that BC-containing particles most likely exert different
light absorption capability values under different pollution        The in situ measurements were conducted on the cam-
levels. Compared with clean air conditions, polluted peri-          pus of Tsinghua University (Tsinghua site, 40◦ 000 1700 N,
ods feature more secondary aerosols, especially secondary           116◦ 190 3400 E) from 17 to 30 November 2014. The Tsinghua
inorganic species such as sulfate (Guo et al., 2014; Sun et         site (Fig. S1 in the Supplement) is located in urban Beijing,
al., 2014; Zheng et al., 2015). Whether the changes of sec-         China. The megacity Beijing is adjacent to Hebei Province
ondary aerosols with air pollution will affect the coating ma-      and the megacity Tianjin (Fig. S1), in which considerable
terials on the BC is complex, and not only depends on the           industrial manufacturing has led to heavy emissions of air
increase in BC vs. secondary aerosols amount but also con-          pollution, especially in southern Hebei.
trolled by secondary material condensation on BC- vs. non-             Ambient aerosol particles were collected by a PM1 cy-
BC-containing particles. Recent BC aging measurements in            clone and then passed through a diffusion silica gel dryer, and
Beijing and Houston using an environmental chamber (flow-           they were finally analyzed using an Aethalometer (AE33,
ing ambient air fed with lab-generated fresh BC) have re-           Magee Scientific Corporation), an aerosol chemical specia-
vealed that a clear distinction in the light absorption capabil-    tion monitor (ACSM, Aerodyne Research Inc.) and a single-
ity of BC-containing particles exists between urban cities in       particle soot photometer (SP2, Droplet Measurement Tech-

Atmos. Chem. Phys., 18, 9879–9896, 2018                                              www.atmos-chem-phys.net/18/9879/2018/
Y. Zhang et al.: Amplification of light absorption of black carbon                                                         9881

nologies Inc.). The AE33 can measure the absorption coef-        2.2     SP2 data analysis
ficient (σab ) of sampled aerosols in seven spectral regions
(370, 470, 520, 590, 660, 880 and 950 nm). At a wavelength       2.2.1    Aging degree of BC-containing particles
of 880 nm, the absorption of aerosol particles is dominated
by the BC component because the light absorbed by other          Based on the rBC core mass (mrBC ) and scattering cross sec-
aerosol components is significantly less (Sandradewi et al.,     tion (Cs ) of the BC-containing particle derived from the SP2
2008; Drinovec et al., 2015). In this study, the σab at 880 nm   measurements, the size of the BC-containing particle (Dp ),
measured by the AE33 was used to characterize the theo-          including the rBC core and the coating materials, was calcu-
retical light absorption of the BC-containing particles. More    lated using Mie theory with a shell-and-core model (Zhang
details on the AE33 measurement can be found in the work         et al., 2016). In Mie calculation, the Dp is retrieved from Cs ,
of Drinovec et al. (2015). Considering the filter-loading ef-    the size of the rBC core (Dc ) and the refractive indices of the
fect and multiple-scattering effect (Weingartner et al., 2003;   non-BC shell (RIs ) and rBC core (RIc ).
Segura et al., 2014; Drinovec et al., 2015), the Aethalome-         The RIs values used in this study are 1.50-0i based on the
ter data were corrected by compensation factors described        chemical compositions of coating materials during the cam-
in the Supplement (Fig. S2 and the associated discussion).       paign period (Fig. S4 and the associated discussion in the
The ACSM and SP2 instruments measured the mass concen-           Supplement). In terms of RIc , we evaluated the sensitivity of
trations of non-refractory (NR) submicron-scale components       Dp values retrieved with Mie mode to the RIc values (Fig. S5
(NR-PM1 , i.e., sulfate, nitrate, ammonium, chloride and or-     and the associated discussion in the Supplement). In the fol-
ganics) and refractory BC (rBC), respectively, and the sum of    lowing calculation, the RIc of 2.26–1.26i was used (Taylor et
these two measurements was used to estimate the PM1 mass         al., 2015).
concentration. The ACSM instrument used in our study was            The Dc is calculated using the mrBC and rBC core density
described by H. Li et al. (2017).                                (ρc , 1.8 g cm−3 used in this study; Cappa et al., 2012) assum-
   The SP2 instrument measures a single BC-containing par-       ing a void-free sphere for the rBC core, as given in Eq. (1).
ticle using a 1064 nm Nd : YAG intra-cavity laser beam.          The size distribution of rBC cores under different pollution
As the light-absorbing rBC passes through the laser beam         levels during the campaign period is displayed in Fig. S6.
and is heated to its vaporization temperature (∼ 4000 K),
                                                                           6mrBC
                                                                                     1/3
it will emit incandescent light (i.e., visible thermal radi-     Dc =             ρc                                          (1)
                                                                              π
ation), which is linearly proportional to the mass of the
rBC (Schwarz et al., 2006; Metcalf et al., 2012; Moteki          As in previous studies (Sedlacek et al., 2012; Liu et al., 2013;
and Kondo, 2010; Sedlacek et al., 2012). In this study,          Zhang et al., 2016), the aging degree of BC-containing par-
the calibration curve of rBC mass vs. incandescence signal       ticles was characterized by the Dp / Dc ratio in this study. A
was obtained from the incandescence signal of size-resolved      higher Dp / Dc ratio for BC-containing particles indicates a
Aquadag particles (their effective density obtained from Gy-     higher aging degree, i.e., more coating materials on the BC
sel et al., 2011) using a DMA (differential mobility ana-        surface.
lyzer) and SP2 measurement system. Considering the differ-          In terms of the Dp / Dc ratio of BC-containing particles,
ent sensitivity of the SP2 to different rBC types (Gysel et      we focused on the rBC core size (Dc ) above detection limit of
al., 2011; Laborde et al., 2012), we corrected the SP2 cal-      SP2 incandescence (Dc > 75 nm), while the detection limit of
ibration curve by scaling the peak height of incandescence       SP2 scattering for the whole particle size (Dp ) was not con-
signal for Aquadag particles at each rBC mass based on           sidered in this study. If the BC-containing particles with rBC
the relationship between the sensitivity of SP2 to Aquadag       cores larger than ∼ 75 nm are large enough to be detected
and ambient rBC (Laborde et al., 2012). The particle-to-         by the SP2 scattering channel, we would calculated their
particle mass of ambient rBC can be determined by mea-           whole particle size (Dp ) using the LEO method based on
suring its incandescence signal and comparing it to the cal-     their scattering signal. If not, we would assume that the Dp
ibration curve. The mass concentration of rBC is calculated      was equal to the rBC core size (Dc ). This assumption might
from the particle-to-particle mass of rBC and the sampled        lead to the underestimation of the Dp / Dc ratio of the BC-
flow (∼ 0.12 L min−1 ). Note that the SP2 detection efficiency   containing particles with a size above the incandescence limit
(Fig. S3) has been considered in the calculation of rBC mass     and below the scattering limit. To evaluate the uncertainty of
concentration. Furthermore, the scattering cross section of a    the Dp / Dc ratio, we calculated the detection efficiency of
BC-containing particle is obtained from its scattering signal    SP2 scattering (Fig. S7 in the Supplement). In terms of BC-
using the leading-edge-only (LEO) fit method (Gao et al.,        containing particles with a rBC core larger than 75 nm (SP2
2007). Zhang et al. (2016) has demonstrated the validity of      size cut for incandescence) observed in our site during the
the LEO fit method for ambient BC-containing particles in        campaign period, most of them (∼ 90–100 %, Fig. S7) exhib-
China.                                                           ited a particle size (180–500 nm shown in Fig. S8) larger than
                                                                 SP2 size cut for scattering due to a large amount of coating
                                                                 materials on rBC cores. This indicated that the uncertainty of

www.atmos-chem-phys.net/18/9879/2018/                                             Atmos. Chem. Phys., 18, 9879–9896, 2018
9882 Y. Zhang et al.: Amplification of light absorption of black carbon
the Dp / Dc ratio calculated in this study due to mismatch in 2.3 BC effective emission intensity
the SP2 size cut for incandescence vs. scattering is no more
than 10 %. High detection efficiency of SP2 scattering for To evaluate the impact of regional transport on BC-
BC-containing particles observed at our site can be attributed containing particles, we used a variant of the effective emis-
to their large size (180–500 nm, Fig. S8). sion intensity (EEI) defined by Lu et al. (2012) to quantify
the amounts of BC over the observation site from different
2.2.2 BC optical properties source regions. In this study, the spatial origin of the BC
observed at our site was divided into local sources in Bei-
Based on the size information on BC-containing particles jing and regional sources in other areas (i.e., Hebei, Tian-
(i.e., Dc and Dp ) obtained from the SP2 measurement (dis- jin, Shanxi and Inner Mongolia; Fig. S1). The EEI takes
cussed in Sect. 2.2.1), we used Mie theory with a shell- into account emission, transport, hydrophilic-to-hydrophobic
and-core model to retrieve the optical properties of BC- conversion and removal processes (i.e., dry and wet deposi-
containing particles, including the absorption enhancement tion) of BC throughout the whole atmospheric transport pro-
(Eab ) of rBC, the mass absorption cross section (MAC) of cess from the origin of the BC emission to the receptor site.
BC-containing particles and bare rBC cores, the mass scatter- A novel back-trajectory approach was developed by Lu et
ing cross section of bare BC core (MSCcore ), and the absorp- al. (2012) to calculate EEI values.
tion coefficient (σab ) of BC-containing particles. The calcu- In this study, the back-trajectory analysis was performed
lation of these parameters is described below. by the Hybrid Single-Particle Lagrangian Integrated Trajec-
The Eab characterizes the increase in BC light absorption tory (HYSPLIT) model to obtain the transport pathways of
due to the lensing effect of coating materials on the BC sur- BC to the observation site (40◦ 00’1700 N, 116◦ 19’3400 E) dur-
face and is used to quantify the theoretical light absorption ing the campaign period (17–30 November 2014). The 72 h
capability of BC-containing particles in this study. The Eab back trajectory at 100 m every hour was calculated with
is determined by the ratio of the absorption cross section of the meteorological fields of NCEP Global Data Assimila-
the entire BC-containing particle (Cab,p ) to that of the bare tion System at a 1◦ × 1◦ resolution. An anthropogenic BC
BC core (Cab,c ), as expressed in Eq. (2): emission inventory of China in the year 2012 at a resolu-
tion of 0.25◦ × 0.25◦ was used to support the back-trajectory
Cab,p (Dc , Dp , RIs , RIc )
Eab = , (2) analysis. The gridded BC emission data are from the Multi-
Cab,c (Dc , RIc ) resolution Emission Inventory for China (MEIC) developed
by Tsinghua University (http://www.meicmodel.org, last ac-
where Cab,p is determined by the Dc , Dp , RIs and RIc using
cess: 20 June 2018).
Mie calculation, and Cab,c is determined by the Dc and RIc .
We calculated the EEI of BC at a resolution of
The MAC of BC-containing particles (MACp ) and bare
0.25◦ × 0.25◦ based on the algorithm developed by Lu et
rBC cores (MACc ) is defined as the Cab,p and Cab,c per unit
al. (2012). Following a trajectory l every hour, the fresh BC
rBC mass, as Eqs. (3) and (4), respectively:
emitted from a series of spatial grids in sequence (i.e., l1 , l2 ,
Cab,p (Dc , Dp , RIs , RIc ) . . . , li,... ) is transported to the receptor grid (i.e., ln ). The EEI
MACp = , (3) of trajectory l at the surface grid point i (EEIi,l ) was deter-
mrBC
mined by Eq. (7):
Cab,c (Dc , RIc ) EEIi,l = Ei × TEi,l , (7)
MACc = . (4)
mrBC where Ei is the BC emission at surface grid point i, and TEi,l
MSCcore is the scattering cross sections of bare rBC cores represents the BC transport efficiency of trajectory l from
(Csca,c ) per unit of rBC mass, as calculated by Eq. (5): grid point i to the receptor site, as calculated by Eqs. (1)–(4)
in Lu et al. (2012).
Csca,c (Dc , RIc ) The total EEI of trajectory l characterizes the total amount
MSCcore = . (5) of BC transported to the observation site every hour, ex-
mrBC
pressed as Eq. (8):
The σab of BC-containing particles is calculated based on the
n
MAC and the rBC mass concentration (CrBC ) measured by X
EEItotal = EEIi,l . (8)
the SP2, as expressed in Eq. (6). The uncertainties of σab i=1
related to the MAC of bare rBC cores from Mie calculation
were evaluated in the Supplement (Fig. S9 and the associated
discussion). 2.4 BC radiative efficiency
σab,calculated = MACp × CrBC = MACc × Eab × CrBC (6) In this study, we use a parameter of the simple forcing ef-
ficiency (SFE) to roughly evaluate the radiative forcing of
Atmos. Chem. Phys., 18, 9879–9896, 2018 www.atmos-chem-phys.net/18/9879/2018/Y. Zhang et al.: Amplification of light absorption of black carbon 9883
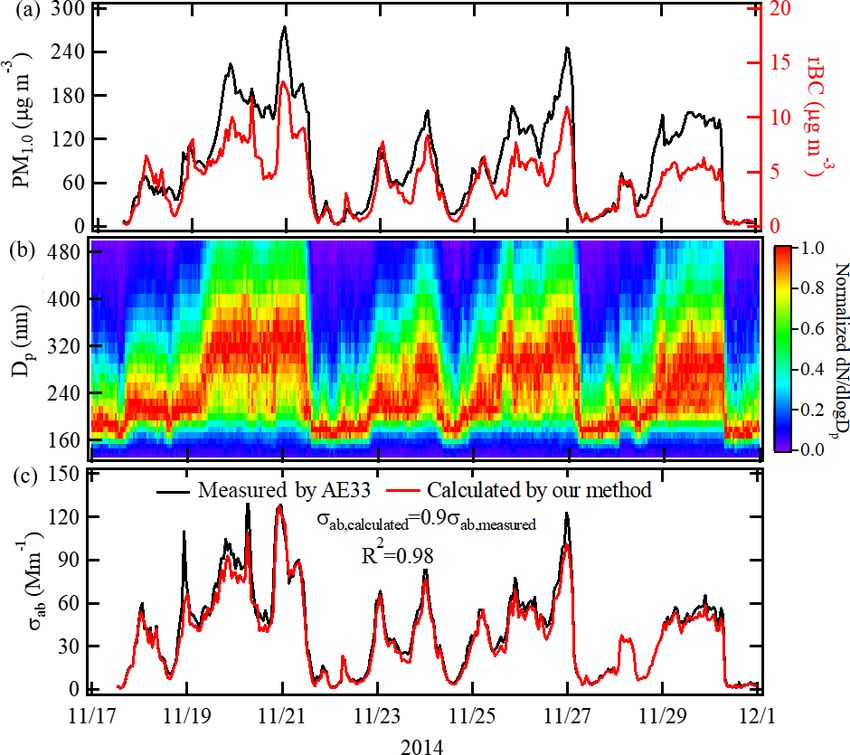
Figure 1. Time series of (a) the PM1 and rBC mass concentrations, (b) the diameter of BC-containing particles (Dp ), and (c) the light
absorption coefficient (σab ) at 880 nm. The correlation between the calculated σab (σab, calculated ) using Mie theory combined with SP2
measurements and the measured σab (σab, measured ) from the AE33 is also shown in (c).
BC-containing particles. The SFE is defined as normalized 3 Results
radiative forcing by BC mass, which is wavelength depen-
dent (Chylek and Wong, 1995; Bond and Bergstrom, 2006; 3.1 Light absorption of BC-containing particles during
Chen and Bond, 2010; Saliba et al., 2016). The wavelength- the campaign period
dependent SFE for BC-containing particles is determined by
Eq. (9): Figure 1 shows the time series of the PM1 and rBC mass con-
centration, the diameter of BC-containing particles (Dp ) and
dSFE 1 dS (λ) 2 h
=− τatm (λ) (1 − Fc ) × 2(1 − αs )2 β (λ) the measured and calculated light absorption coefficient (σab )
dλ 4 dλ i at 880 nm. During the campaign period, four episodes with
· MSCcore (λ) − 4αs × MAC (λ) , (9) different PM1 evolution processes (Fig. 1a) were observed:
18–21, 23–24, 25–26 and 28–30 November. The hourly PM1
in which a wavelength (λ) of 550 nm is used in this mass concentration ranged from 3.5 to 275 µg m−3 , with
study; dS (λ) / dλ is the spectral solar irradiance, the value an average value of 91 µg m−3 during the observed period.
of which is from the ASTM G173-03 Reference Spectra The rBC mass concentration accounted for ∼ 5 % of PM1 .
(1.86 W m−2 nm−1 at 550 nm) and the parameters τatm , Fc , The Dp including rBC cores and coating materials shown
αs and β are the atmospheric transmission (0.79), cloud frac- in Fig. 1b exhibited an excellent temporal coherence with
tion (0.6), urban surface albedo (0.15) and backscatter frac- the rBC mass concentration. Figure 1b shows that the num-
tion (0.17), respectively (Chen and Bond, 2010; Park et al., ber distribution of Dp for BC-containing particles exhibited a
2011; Jeong et al., 2013; Saliba et al., 2016). peak at 180–320 nm, significantly larger than the peak value
(Dc of ∼ 95 nm) for number size distribution of bare rBC
cores (Fig. S5a) due to an abundance of coating materials
on BC surfaces. The size information (namely entire parti-
cle size and rBC core size) of BC-containing particles ob-
served in our study was consistent with that (Dp of ∼ 200–
300 nm and Dc of ∼ 70–100 nm) in previous studies in China
(Huang et al., 2013; Wang et al., 2014b; Gong et al., 2016).
www.atmos-chem-phys.net/18/9879/2018/ Atmos. Chem. Phys., 18, 9879–9896, 20189884 Y. Zhang et al.: Amplification of light absorption of black carbon
Moreover, the Dp exhibited sustained growth from ∼ 180 nm and how the aging degree and light absorption capability of
to ∼ 400 nm during a pollution episode, which could be a BC-containing particles will change under different pollution
consequence of the increase in either Dc or coating materi- levels remain unclear. During the campaign period, we found
als, or both. Figure S6a shows a slight change in Dc with that the mass-averaged values of the Dp / Dc ratio and calcu-
pollution development. However, the coating thickness of lated Eab of BC-containing particles increased with increas-
BC-containing particles increased with PM1 concentration ing air pollution levels.
(Fig. S10a). Therefore, the sustained growth of Dp during Figure 2a shows the Dp / Dc ratio and calculated Eab of
a pollution episode was dominated by more coating mate- BC-containing particles with rBC cores at 75–300 nm un-
rials under more polluted conditions. Figure S10 shows the der different PM1 concentrations in the range of 1.2–3.5
simultaneous increase in the rBC mass concentration and the and 1.3–3.1, respectively. In terms of BC-containing parti-
amount of coating materials on the BC surface, which could cles with a certain rBC core size, their Dp / Dc ratio and
significantly enhance the light absorption of BC-containing calculated Eab were greater under higher PM1 concentra-
particles. Figure S11 shows that the measured absorption co- tions, which could be attributed to more coating materials on
efficient (σab, measured ) at 880 nm (dominated by BC compo- BC surfaces under an environment with more pollution. The
nent at this wavelength; Drinovec et al., 2015) for the aerosol increase in both primary and secondary components under
particles measured with the AE33 exhibited an 18-fold in- more polluted conditions was favorable to BC aging by coag-
crease in conjunction with an increase in the PM1 concen- ulation and condensation, which happen mostly between BC
tration from ∼ 10 to ∼ 230 µg m−3 , larger than the increase and non-BC species. On average (i.e., mass-weighted mean
(∼ 14 times) in rBC mass concentration. across rBC core size larger than ∼ 75 nm), the Dp / Dc and
To validate SP2 measurements and Mie calculation used in calculated Eab for observed BC-containing particles in SP2
this study, we compared the calculated light absorption coef- under different PM1 concentrations during the campaign pe-
ficient (σab, calculated ) of BC-containing particles using Eq. (6) riod varied in the range of 1.6–2.2 and 1.6–2.0, respectively
with the measured light absorption coefficient (σab, measured ) (Fig. 2b). Correspondingly, the mass-averaged values of the
from AE33, as shown in Fig. 1c. The σab, calculated values for Dp / Dc and calculated Eab of BC-containing particles in-
BC-containing particles showed an excellent agreement with creased by ∼ 33 % and ∼ 18 %, respectively, with increas-
the σab, measured values measured by the AE33, with a differ- ing PM1 concentrations from ∼ 10 to ∼ 230 µg m−3 (com-
ence of ∼ 10 % (R 2 = 0.98). The difference was dominated panied with rBC mass concentration increasing from ∼ 0.7
by the uncertainties from the compensation algorithm used in to ∼ 11 µg m−3 ).
the AE33 measurements (∼ 15 %; details shown in Fig. S2 Figure 3 shows the increase of the Dp / Dc ratio and
and the associated discussion in the Supplement) and Mie calculated Eab (IRD p /D c and IRE ab , respectively) for BC-
calculation (10–20 %; Figs. S4, S5 and S9 and the associ- containing particles with increasing PM1 concentrations
ated discussion in the Supplement). The uncertainty evalu- form 10 to 230 µg m−3 as a function of rBC core size. Based
ation revealed that the difference between σab, calculated and on the Dp / Dc ratio and calculated Eab of BC-containing
σab, c measured (∼ 10 %) shown in Fig. 1c is reasonable. The particles with size-resolved rBC cores in SP2 measurement
comparison between the σab, calculated and σab, measured values under different PM1 concentrations (shown in Fig. 2a), we
implied that the optical properties (i.e., σab , MAC and Eab ) can obtain the measured IRD p /D c and IRE ab as a function of
of the BC-containing particles derived from Mie calculation rBC core size. When PM1 concentration increases from ∼ 10
combined with SP2 measurements (i.e., rBC concentrations, to ∼ 230 µg m−3 during the campaign period, the Dp / Dc ra-
Dp and Dc ) were reliable in our case. tio and calculated Eab of BC-containing particles with rBC
cores at 75–200 nm increased by 28–48 % and 13–36 %, re-
3.2 Enhancement of the theoretical light absorption spectively. The size-dependent increase in Dp / Dc ratio and
capability of black carbon associated with air calculated Eab associated with air pollution indicated that the
pollution aging process of smaller rBC was relatively more sensitive to
air pollution levels. This could be attributed to the fact that
3.2.1 The Dp / Dc ratio and calculated Eab under the condensational growth associated with air pollution due
different PM1 concentrations to the formation of secondary components is more effective
for smaller particles in terms of increasing the diameter (Met-
Previous theoretical studies reported that the coating mate- calf et al., 2013).
rials on the BC surface can significantly enhance the light Meanwhile, following a semiquantitative analysis used in
absorption of BC via the lensing effect (Fuller et al., 1999; Metcalf et al. (2013), we calculated the IRD p /D c and IRE ab
Jacobson, 2001; Moffet et al., 2009; Lack and Cappa, 2010). based on the diffusion-controlled growth law (Seinfeld and
In other words, the aging degree of BC-containing particles Pandis, 2006). The calculated IRD p /D c and IRE ab compare
(characterized by the Dp / Dc ratio in this study) determines with the measured ones from SP2.
their theoretical light absorption capability (characterized by According to the diffusion-controlled growth law (Sein-
the calculated MAC and Eab in this study). However, whether feld and Pandis, 2006), the evolution of the size of BC-
Atmos. Chem. Phys., 18, 9879–9896, 2018 www.atmos-chem-phys.net/18/9879/2018/Y. Zhang et al.: Amplification of light absorption of black carbon 9885
Figure 2. (a) The aging degree (Dp / Dc ratio) and light absorption enhancement (calculated Eab ) of BC-containing particles with size-
resolved rBC cores (Dc ) under different PM1 concentrations; (b) variations in the mass-averaged values of the Dp / Dc ratio and calculated
Eab of BC-containing particles with PM1 and rBC concentrations.
in which dD P
dt represents the diffusion-controlled growth rate;
A is the parameter. Integrating Eq. (10) with Dp (t = 0) = Dc :
Dp2 = Dc2 + 2At = Dc2 + B, (11)
in which Dc is rBC core diameter and B (i.e., equal to 2At) is
the parameter, varying under different PM1 concentrations.
Following Eq. (11), the Dp / Dc ratio is given:
1/2
Dp B
= + 1 , (12)
Dc Dc2
Figure 3. The increase in the Dp / Dc ratio and calculated where the parameter B is determined by the value of the mea-
Eab (IRD p /D c and IRE ab ) for BC-containing particles with sured Dp / Dc ratio with Dc of 160 nm under different PM1
PM1 concentration increasing from 10 to 230 µg m−3 . The cal-
concentrations.
culated IRD p /D c and IRE ab values were determined based on The IRD p /D c for BC-containing particles with PM1 con-
Eqs. (13) and (14). The measured IRD p /D c and IRE ab values were centration increasing from 10 to 230 µg m−3 can be calcu-
obtained from SP2 measurements. lated by Eq. (13):
Dp Dp
containing particles (Dp ) is shown: Dc 230 − Dc 10
dDP A IRD p /D c =
Dp
= , (10) Dc 10
dt DP
www.atmos-chem-phys.net/18/9879/2018/ Atmos. Chem. Phys., 18, 9879–9896, 20189886 Y. Zhang et al.: Amplification of light absorption of black carbon
Figure 4. (a) Correlation between the changing rate of calculated Eab (kE ab ) and the changing rates of PM1 concentrations (kPM1 ) during the
campaign period. (b) Frequency distribution of kE ab , kPM1 and kE ab / kPM1 . The kE ab and kPM1 values represent an apparent changing rate of
calculated Eab and PM1 concentration, respectively, and are from point-by-point differences of hourly Eab and PM1 concentration, namely
kE ab = (Eab,t2 -Eab,t1 ) / (Eab,t1 *(t2 -t1 )) and kPM1 = (PM1,t2 - PM1,t1 ) / (PM1,t1 *(t2 -t1 )). The sensitivity of the change in calculated Eab
with changing PM1 concentrations was obtained by plotting kE ab vs. kPM1 (i.e., kE ab / kPM1 ).
1/2 1/2 1/2 1/2
B230
Dc2
+1 − BD102 + 1 k230 × B230
Dc2
+1 − k10 × BD102 + 1
c c
= 1/2 , (13) = 1/2 . (14)
B10
D 2 + 1 k10 × BD102 + 1
c c
Dp Dp We compared the calculated IRD p /D c and IRE ab based on
where Dc 230 and Dc 10 represent the Dp / Dc ratio when
Eqs. (13) and (14) with those from SP2 measurements, as
PM1 concentrations are 230 and 10 µg m−3 , respectively; shown in Fig. 3. The agreement indicated that the increase in
B230 and B10 are parameter B with PM1 concentrations of Dp / Dc and Eab for BC-containing particles with increasing
230 and 10 µg m−3 , respectively. PM1 concentrations follows the diffusion-controlled growth
The IRE ab for BC-containing particles with a PM1 con- law.
centration increasing from 10 to 230 µg m−3 can be derived
based on Eab = k × (Dp / Dc ), as expressed in Eq. (5): 3.2.2 Changing rate of the theoretical light absorption
capability of black carbon
D D
k230 × Dpc − k10 × Dpc
230 10
IRE ab = Dp
Figure 4a explores the relationship between the changing rate
k10 × Dc of calculated Eab (kE ab ) and the changing rates of PM1 con-
10
Atmos. Chem. Phys., 18, 9879–9896, 2018 www.atmos-chem-phys.net/18/9879/2018/Y. Zhang et al.: Amplification of light absorption of black carbon 9887
centrations (kPM1 ) with pollution development. Linear rela- Table 1. The average PM1 mass concentration, rBC mass con-
tionships were estimated, i.e., kE ab ≈ 0.051 kPM1 , revealing centration, normalized EEItotal , EEIoutside / EEItotal ratio, mass-
that rapid increases in air pollution levels could lead to rapid averaged values of the Dp / Dc ratio and calculated Eab during
increases in BC light absorption capability. When the PM1 clean, slightly polluted and polluted periods. EEIoutside is the EEI
concentration exhibited a sharp increase related to an ex- of BC from areas outside Beijing; the EEIoutside / EEItotal ratio re-
flects the amount of BC contributed by regional transport to the total
treme haze episode (Zheng et al., 2015), the increase in BC
amount of BC observed at our site. The clean (PM2.5 ≤ 35 µg m−3 ),
light absorption capability was dramatic. slightly polluted (35 µg m−3 < PM2.5 ≤ 115 µg m−3 ) and polluted
Figure 4b shows frequency distribution of kE ab , kPM1 and (PM2.5 >115 µg m−3 ) periods were classified according to the Air
kE ab / kPM1 ratio. During the campaign period, most of kE ab Quality Index (Zheng et al., 2015).
and kPM1 values were in the range of −50 to 50 and −4 to
4 % h−1 , respectively, revealing a lower changing rate for BC Clean Slightly polluted Polluted
aging than that for PM1 concentration. The peak value of fre-
quency distribution of kE ab was around zero, indicating the PM1 (µg m−3 ) 12.57 54.26 141.93
BC-containing particles were shrinking as often as they were rBC (µg m−3 ) 0.82 2.89 6.07
Normalized EEItotal 3.68 9.19 16.87
growing. The kE ab / kPM1 ratio characterized the sensitivity
EEIoutside / EEItotal 0.21 0.39 0.63
of the change in calculated Eab with changing PM1 concen-
Dp / Dc 1.62 1.81 2.04
trations. The frequency distribution of the kE ab / kPM1 ratio Calculated Eab 1.66 1.81 1.91
showed that ∼ 60 % values were in the range of 0–1, with
a peak value around 0.05. Smaller values of the kE ab / kPM1
ratio indicated that the change of calculated Eab was not sen-
sitive to variations in PM1 concentrations. The growth rate in calculated Eab of BC with PM1 increase was neglected in
of Eab (for BC samples with kE ab > 0: 0.1–7.3 % h−1 ) ob- this study, the theoretical light absorption of BC-containing
served at our study was consistent with the BC aging rate particles would be underestimated by ∼ 18 % under polluted
(0.2–7.8 % h−1 ) in previous studies (Moteki et al., 2007; Shi- conditions.
raiwa et al., 2007; Cheng et al., 2012).
Moreover, we found that the growth rate of Eab decreased 3.3 Contribution of regional transport
with increasing PM1 mass concentrations (Fig. S12a), in-
dicating that the increase in the theoretical light absorp- BC aging in the atmosphere, namely BC internally mix-
tion capability of BC-containing particles slowed with fur- ing with other aerosol components, is associated with at-
ther pollution development. This can be explained by larger mospheric transport (Gustafsson and Ramanathan, 2016). In
BC-containing particles when PM1 concentration is higher Beijing, the rapid increase in aerosol particle concentrations
(Fig. S12b). The net change in diameter for a given amount of during pollution episodes is most likely caused by regional
material deposited decreases with increasing particle size due transport of polluted air mass (Yang et al., 2015; Zheng et al.,
to surface-to-volume scaling, which would expect the growth 2015). Therefore, regional transport of pollution may play an
rate of particles to decrease with increasing PM1 concentra- important role in the enhancement of BC light absorption ca-
tion and thus the kE ab would also decrease (Fig. S12a). pability associated with air pollution. In this study, we used
The evolution of theoretical light absorption of BC with the EEI analysis (Lu et al., 2012) to explore the effects of re-
pollution levels depends on the change in both rBC mass con- gional transport on the increase in theoretical light absorption
centrations and calculated Eab . Figure S13 shows markedly capability of BC with increasing pollution levels.
smaller kE ab than the changing rate of rBC mass concentra- Figure 5 shows the spatial distribution (0.25◦ × 0.25◦ ) of
tions (krBC ) (i.e., kE ab ≈ 0.027 krBC ), indicating the change of the EEI for BC transported to the observation site under dif-
calculated Eab was significantly slower than that of rBC mass ferent pollution levels (i.e., clear, slightly polluted and pol-
concentrations under different pollution levels. Due to less luted periods) during the campaign period. The spatial origin
sensitivity of calculated Eab to change in air pollution levels of the BC observed at our site varied significantly among the
compared with that of rBC mass concentrations, some pre- different pollution periods. In this study, the spatial origin
vious measurements (Andreae et al., 2008; Ram et al., 2009; of total BC at the site was classified into local Beijing and
McMeeking et al., 2011; Wang et al., 2014b) would not have other regions (i.e., outside of Beijing is considered to be re-
been able to easily discern a difference of Eab among dif- gional origins in this study). Noted that the local region (i.e.,
ferent pollution levels and thus just focus on the change of Beijing) defined in this study is smaller than areas outside
BC mass concentration. This would lead to uncertainties in of Beijing (e.g., Hebei, Tianjin, Shanxi and Inner Mongo-
estimation of BC light absorption. In our case, Fig. 2b re- lia; Fig. S1). Table 1 lists the contribution of BC from re-
veals the mass-weighted average of calculated Eab increased gional origins (i.e., EEIoutside / EEItotal ratio). During a pol-
by ∼ 18 % with the PM1 concentration increasing from ∼ 10 luted period, the contributions of BC from regional origins
to ∼ 230 µg m−3 (accompanied by the rBC mass concentra- was ∼ 63 %, larger than that from local Beijing (∼ 37 %).
tion increasing from ∼ 0.7 to ∼ 11 µg m−3 ). If the increase This was partly due to comparing the contributions from a
www.atmos-chem-phys.net/18/9879/2018/ Atmos. Chem. Phys., 18, 9879–9896, 20189888 Y. Zhang et al.: Amplification of light absorption of black carbon Figure 5. Spatial distribution (0.25◦ × 0.25◦ ) of the effective emission intensity (EEI, units of tons per grid per year) for BC transported to the observation site (40◦ 00’1700 N, 116◦ 19’3400 E) during clean, slightly polluted and polluted periods. The clean (PM2.5 ≤ 35 µg m−3 ), slightly polluted (35 µg m−3 < PM2.5 ≤ 115 µg m−3 ) and polluted (PM2.5 > 115 µg m−3 ) periods were classified according to the Air Quality Index (Zheng et al., 2015). The site location and the boundaries of inside the region (i.e., Beijing) vs. outside the region (i.e., other areas such as Tianjin, Hebei, Inner Mongolia, Shanxi and Shandong) are shown in Fig. S1. Note that these regions are defined based on political boundaries. small region (Beijing) and a large region (outside of Beijing). other adjacent areas) is dominated by its local emissions due In this study, we focus on comparing the contributions of BC to adverse meteorology. from outside of Beijing (considered to be regional origins Under different pollution levels, regional transport not in this study) among different pollution levels (i.e., clean, only influenced the BC mass concentrations but also the BC slight polluted and polluted periods). The BC from regional aging process and timescale. Table 1 shows that the mass- origins (i.e., outside of Beijing) accounted for ∼ 21, ∼ 39 average value of the Dp / Dc ratio of BC-containing parti- and ∼ 63 % of total BC amount at the site during the clean, cles at our site was ∼ 2.04 during the polluted period, sig- slightly polluted and polluted periods, respectively. This re- nificantly higher than that observed during the clean period vealed that the regional contribution to BC over Beijing in- (∼ 1.62) and slightly polluted period (∼ 1.81). On the one creased as the air pollution levels increased. hand, under more polluted conditions, more BC-containing Due to the increase in the regional contribution, the to- particles in Beijing were from regional sources and thus tal BC amount transported to the observation site, charac- had undergone a longer aging time during the transport than terized by the EEI (EEItotal ) in this study, increased under the BC from local sources in Beijing. On the other hand, more polluted conditions. Table 1 shows that the EEItotal was compared with the BC carried in the clean air mass from 4.6 times higher during the polluted period than during the the northwest of Beijing during the clean period (Fig. 5a), clean period, revealing that the polluted air mass brought the BC-containing particles in the polluted air mass under- more BC to Beijing. BC concentration at the site strongly went regional transport from the region south of Beijing (i.e., depends on both total BC amount (transported from local Hebei, one of the most polluted provinces in China, with high Beijing and other regions, characterized by EEItotal in this pollutant emissions) during the polluted periods (Fig. 5c). study) and local meteorology. Table 1 shows that the BC Peng et al. (2016) pointed out higher BC aging rates under concentrations from the clean period are ∼ 7.4 times lower more polluted environments, indicating that BC-containing than in the polluted period. The increase in EEItotal (∼ 4.6 particles passing though polluted regions would show higher times) accounted for an ∼ 62 % increase in BC mass concen- aging rates during atmospheric transport than those from trations (∼ 7.4 times). This indicated that the adverse local clean regions. The mass-average values of calculated Eab meteorology contributed ∼ 38 % of the increase in BC mass for BC-containing particles observed at our site were ∼ 1.66, concentration at the site from the clean period to the polluted ∼ 1.81 and ∼ 1.91 during the clean, slightly polluted and pol- period. Compared with regional transport, less of an effect of luted periods, respectively (Table 1), showing that the theo- adverse local meteorology might be attributed to relatively retical light absorption capability of BC-containing particles small areas defined as the local region (i.e., Beijing) in this observed at our site increased with increasing regional contri- study. Polluted events in China always occur over a large re- butions. Our results demonstrated the importance of regional gion, e.g., North China Plain (Zheng et al., 2015; Yang et transport in the enhancement of BC light absorption capabil- al., 2017). For our case, the adverse meteorology during pol- ity associated with air pollution. luted days in the whole large region including Beijing and To further explore the importance of aging during regional other areas can lead to the increase in pollutants and then transport, its contributions were compared with those of local more transport of pollutants into Beijing. Yang et al. (2017) chemical processes with respect to increases in Dp / Dc ratio found that the increases in BC concentration under polluted and theoretical light absorption capability of BC-containing conditions over the North China Plain (including Beijing and particles associated with air pollution. Considering the im- Atmos. Chem. Phys., 18, 9879–9896, 2018 www.atmos-chem-phys.net/18/9879/2018/
Y. Zhang et al.: Amplification of light absorption of black carbon                                                                 9889

Figure 6. (a) Time series of the normalized EEItotal , Dp / Dc ratios and Eab of BC-containing particles and the O3 concentration during
the campaign period. (b) Variations in the Dp / Dc and Eab of BC-containing particles with the normalized EEItotal and O3 concentration.
Normalized EEItotal (EEItotal, normalized ) was calculated by scaling by a factor of 10−3 , namely EEItotal, normalized = EEItotal /1000.

portance of photochemical oxidation in coating formation               photochemical processing is not the only possible pathway in
on BC surface (Metcalf et al., 2013; Peng et al., 2016), we            the BC aging process and other pathways were not discussed
evaluated the capability of local photochemical production             in this study. The local aging process of BC might be en-
by the changes of O3 concentrations in the atmosphere. Con-            hanced by other pathways. For example, high concentrations
versely, the changes in the amount of BC from regional trans-          of aerosols under a polluted environment may compensate
port were characterized by variation in EEItotal , which was           for the adverse photochemical conditions for BC aging. In
used to evaluate the contributions of regional transport to            summary, the increases in the aging degree and theoretical
BC aging. Figure 6a shows that the EEItotal per hour exhib-            light absorption capability of BC-containing particles with
ited a temporal coherence with the mass-averaged values of             increasing air pollution were more likely caused by aging
the Dp / Dc ratio and calculated Eab of BC-containing par-             during regional transport than by local photochemical pro-
ticles. In contrast, the O3 concentrations showed a differ-            duction.
ent temporal trend. When PM1 concentrations were higher                   According to the evolution of the EEItotal values and
than ∼ 120 µg m−3 , O3 concentrations decreased to ∼ 2 ppb.            O3 concentrations with increasing air pollution levels
Zheng et al. (2015) has demonstrated the weakened impor-               (Fig. 6b1 and b2), we separated the pollution levels into
tance of photochemistry in the production and aging of sec-            two periods. When PM1 concentrations were lower than
ondary aerosols in Beijing under polluted conditions due to            ∼ 120 µg m−3 and rBC mass concentrations were lower than
a decrease in oxidant concentrations. This indicated that the          ∼ 6 µg m−3 , the normalized EEItotal increased from ∼ 3 to
photochemical processing in BC aging may be weakened un-               ∼ 18 with increasing air pollution levels, and the O3 con-
der higher polluted levels (i.e., PM1 > 120 µg m−3 ). Note that        centrations decreased from ∼ 20 ppb to ∼ 2 ppb, indicating

www.atmos-chem-phys.net/18/9879/2018/                                                    Atmos. Chem. Phys., 18, 9879–9896, 2018
9890                                                          Y. Zhang et al.: Amplification of light absorption of black carbon

Figure 7. Variations in MAC, SFE and DRF of BC-containing particles under different pollution levels. The DRF values for BC-containing
particles were obtained by scaling the average DRF (0.31 W m−2 , Table S1) of externally mixed BC from various climate models (Bond et
al., 2013). The DRFwith and DRFwithout values respectively represent DRF with and without considering the differences of light absorption
capability of ambient BC-containing particles under different pollution levels; namely, the DRFwith was calculated with scaling factors
of the Eab and rBC mass concentration (CrBC ) and the DRFwithout was calculated with a scaling factor of CrBC . Variations in DRFwith
under different pollution levels were due to the change of both the light absorption capability and mass concentration of BC; variations in
DRFwithout were only attributed to the change of rBC mass concentrations.

enhanced regional contributions and weakened local photo-               the increase in calculated Eab of BC-containing particles
chemical production at the observation site. In this period,            (from ∼ 1.9 to ∼ 2.0) might be attributed to local chemical
Fig. 6b3 and b4 show that the mass-averaged values of cal-              production (e.g., heterogeneous reaction) in Beijing.
culated Eab and the Dp / Dc ratio of BC-containing particles
increased from ∼ 1.6 to ∼ 1.9 and from ∼ 1.6 to ∼ 2.0, re-
                                                                        3.4   Implications for BC radiative forcing
spectively, with the increase in the normalized EEItotal (from
∼ 3 to ∼ 18) and the decrease in the O3 concentrations (from
∼ 20 to ∼ 2 ppb). Therefore, in terms of the increase in the            The increase in BC light absorption capability with increas-
BC light absorption capability with increasing air pollution            ing air pollution levels suggests that greater solar absorp-
levels, this period (i.e., conditions of PM1 < 120 µg m−3 and           tion (i.e., direct radiative forcing, DRF) by atmospheric BC-
rBC < 6 µg m−3 ) represented a regional-transport-controlled            containing particles occurs under more polluted conditions.
period. The increase in calculated Eab of BC-containing par-            The DRF of atmospheric BC-containing particles depends
ticles (∼ 1.6–1.9) during this regional-transport-controlled            not only on the BC mass concentrations but also on the BC
period accounted for ∼ 75 % of the increase in calculated Eab           forcing efficiency, which strongly depends on the light ab-
(∼ 1.6–2.0) with increasing air pollution during the whole              sorption capability of BC-containing particles. In this study,
campaign period. Therefore, the aging process during the                the forcing efficiency of BC-containing particles was esti-
regional transport dominated the increase in the theoreti-              mated based on a simple radiation transfer model (Eq. 9).
cal light absorption capability of BC-containing particles in           Figure 7 shows that with increasing pollution levels (i.e.,
Beijing during the campaign period. Another period is de-               PM1 increasing from ∼ 10 to ∼ 230 µg m−3 ) during the cam-
fined by PM1 concentrations of more than ∼ 120 µg m−3 and               paign period, the mass-averaged values of calculated MAC
rBC mass concentrations of more than ∼ 6 µg m−3 , during                at 550 nm for BC-containing particles increased from ∼ 11
which both the EEItotal and O3 concentrations showed slight             to ∼ 14 m2 g−1 , which resulted in the SFE of BC-containing
changes with increasing air pollution levels. In this period,           particles increasing from ∼ 0.7 to ∼ 0.9 m2 g−1 nm−1 . This
                                                                        revealed that the enhanced light absorption capability of

Atmos. Chem. Phys., 18, 9879–9896, 2018                                                   www.atmos-chem-phys.net/18/9879/2018/
Y. Zhang et al.: Amplification of light absorption of black carbon 9891
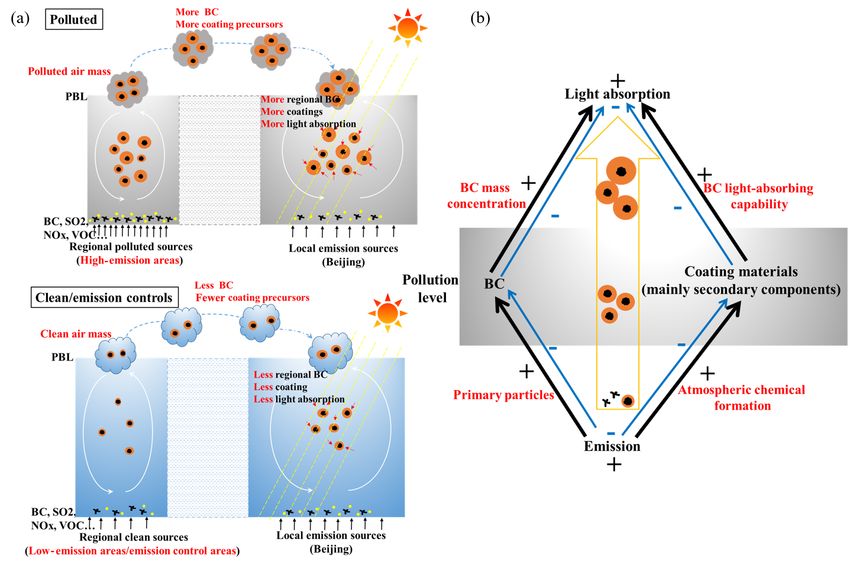
Figure 8. Conceptual scheme of the amplification effect on BC light absorption associated with air pollution.
BC-containing particles under a more polluted environment The enhanced climate effects of BC aerosols in Beijing
would increase their radiative forcing. could be taken to be representative of polluted regions in
Considering the increase in both the light absorption China. Previous measurements of BC aerosols in China (An-
capability (∼ 18 %) and mass concentrations (from ∼ 0.7 dreae et al., 2008; Huang et al., 2013; Wang et al., 2014b;
to ∼ 11 µg m−3 ) of BC when PM1 increased from ∼ 10 Zhang et al., 2014; Zheng et al., 2015; Gong et al., 2016;
to ∼ 230 µg m−3 , the DRF of BC-containing particles in- Zhao et al., 2017) showed that the BC mass concentrations
creased from ∼ 0.3 to ∼ 6.4 W m−2 (i.e., DRFwith shown in in different regions (e.g., Beijing, Xi’an, Nanjing, Shanghai
Fig. 7c, d). This revealed the importance of BC in terms of and Guangzhou) reached values of ∼ 10–50 µg m−3 during
solar absorption under more polluted conditions. However, polluted periods (Table S2), similar to our measurements.
when the theoretical DRF of BC-containing particles was Therefore, our BC aerosol observations in Beijing were not
derived without considering the light absorption enhance- a special case. In China, high concentrations of BC aerosols
ment caused by coating materials (i.e., DRFwithout shown in under polluted conditions always occur on a regional scale
Fig. 7c, d), it varied in the range of 0.2–3.3 W m−2 , which due to intense BC emissions (Zhang et al., 2009; M. Li et al.,
only depended on the mass concentrations of BC under dif- 2017) and significant regional transport (Zhao et al., 2013;
ferent pollution levels. The DRFwith was significantly higher Wang et al., 2014a; Zheng et al., 2015). Our findings in Bei-
than DRFwithout , identifying the amplification of DRF caused jing can provide some implication in the difference of BC
by coating materials on the BC surface. A more significant radiative forcing in other regions among different air pollu-
difference between DRFwith and DRFwithout was found un- tion levels.
der a more polluted environment, which was due to the in-
crease in BC light absorption capability with increasing pol-
lution levels. This indicated that the coating materials played 4 Discussion: breaking the amplification effect by
a more important role in the DRF of BC under a more pol- emission control
luted environment.
Our results reveal that under a more polluted environment,
the BC-containing particles are characterized by more BC
www.atmos-chem-phys.net/18/9879/2018/ Atmos. Chem. Phys., 18, 9879–9896, 20189892 Y. Zhang et al.: Amplification of light absorption of black carbon
mass concentrations and more coating materials on the BC ciated with increasing air pollution can be explained by the
surface and therefore a higher light absorption capability. As increase in coating materials on the BC surface under more
shown in Fig. 8, this amplification effect on BC light absorp- polluted conditions. Moreover, the increase in the Dp / Dc
tion associated with air pollution is caused by increasing BC ratio and calculated Eab with increasing air pollution levels
concentration and at the same time enhanced light absorp- was size dependent; namely, more increase was exhibited for
tion capability of BC-containing particles by more coating smaller rBC cores. This indicated that the aging degree and
production in the more polluted air. Variation in both the light absorption capability of smaller rBC was more sensi-
mass concentration and light absorption capability of BC as- tive to air pollution levels. Using a semiquantitative anal-
sociated with air pollution strongly depends on the air pollu- ysis method based on the diffusion-controlled growth law
tant emission (e.g., BC, SO2 , NOx and volatile organic com- (Seinfeld and Pandis, 2006), we also calculated the theoret-
pounds). Under a polluted environment, polluted air mass ical increase in the Dp / Dc ratio and calculated Eab with
from high-emission areas not only brings more BC but also increasing pollution levels for BC-containing particles with
more coating materials on the BC surface due to more pre- size-resolved rBC cores. The agreement between the mea-
cursors of secondary components. sured and theoretical increase in the Dp / Dc ratio and Eab
Air pollution control measures may, however, break this indicated the increase in coating materials on the BC surface
amplification effect by reducing BC concentration and at the with increasing PM1 concentrations following the diffusion-
same time lowering the light absorption capability of BC- controlled growth law.
containing particles by slowing down the coating processes The relationships between the changing rate of calculated
with cleaner air (Fig. 8). Take air pollution controls during Eab (kE ab ) with air pollution development and that of the
the 2014 Asia-Pacific Economic Cooperation (APEC) meet- PM1 and rBC concentrations (kPM1 and krBC , respectively)
ing in Beijing, China, as an example; we found that as a re- were estimated: kE ab ≈ 0.051 kPM1 and kE ab ≈ 0.027 krBC .
sult of emission controls on local Beijing and areas adjacent During the campaign period, kE ab values were in the range of
to Beijing (i.e., Hebei, Tianjin, Shanxi, Henan, Shandong −4 to 4 % h−1 , with a peak of frequency distribution around
and Inner Mongolia), light absorption of BC-containing par- zero, indicating that the BC-containing particles were shrink-
ticles decreased significantly during APEC compared t be- ing as often as they were growing. The frequency distribution
fore APEC (Zhang et al., 2018). This is not only contributed of the kE ab / kPM1 ratio showed a peak value around 0.05, re-
by a reduction of BC mass concentration but also by lower vealing that the change of calculated Eab was not sensitive
light absorption capability of BC-containing particles with to variations in PM1 concentrations. Although the changing
less coating materials on the BC surface in cleaner atmo- rate of the BC light absorption capability was significantly
sphere conditions, indicating that synergetic emission reduc- lower than that of the BC mass concentration, the effect of
tion of multi-pollutants could achieve co-benefits for both air enhanced BC light absorption capability on the light absorp-
quality and climate. tion of ambient BC-containing particles under polluted con-
ditions is not negligible. In our case, if we had not consid-
5 Conclusions ered the increase in the theoretical light absorption capabil-
ity of BC with increasing air pollution during the campaign
The light absorption of BC-containing particles depends not period, the theoretical light absorption of BC-containing par-
only on the BC mass concentration but also on their light ticles under polluted conditions would have been underesti-
absorption capability (characterized by the calculated MAC mated by ∼ 18 %.
and Eab in this study). In this work, we investigated the dif- The increase in BC light absorption capability with in-
ference of theoretical light absorption capability of BC under creasing pollution levels in Beijing was controlled by ag-
different air pollution conditions. During an intensive field ing during regional transport. The EEI analysis showed that
measurement campaign in Beijing, China, we found that with ∼ 63 % of the BC observed at our site was transported from
increasing pollution levels, the increase in BC mass concen- regional sources (i.e., areas outside of Beijing) during the
tration was always accompanied by an increase in the theo- polluted period, whereas the regional contributions were sig-
retical light absorption capability of BC, resulting in an am- nificantly lower (∼ 21 %) during the clean period. More BC
plification effect on the light absorption of the ambient BC- in more polluted air from regional transport could lead to
containing particles. During the campaign period, the hourly a higher local BC concentration in Beijing. Not only more
values of mass-weighted averages of the Dp / Dc ratio and BC but also more coatings are carried into Beijing by more
calculated Eab for BC-containing particles was in the range polluted regional air mass (Fig. 8a), which can be explained
of 1.5–2.3 and 1.5–2.0, respectively. When PM1 concentra- by more coating precursors (e.g. SO2 , NOx and volatile or-
tion increased from ∼ 10 to ∼ 230 µg m−3 accompanied with ganic compounds) in more polluted air. Moreover, we sep-
the rBC mass concentration in the range of ∼ 0.7–11 µg m−3 , arated the change of the Dp / Dc ratio and theoretical light
the mass-weighted averages of the Dp / Dc ratio and calcu- absorption capability of BC associated with air pollution into
lated Eab values increased by ∼ 33 % and ∼ 18 %, respec- regional-transport-controlled period (i.e., PM1 < 120 µg m−3
tively. The increase in BC light absorption capability asso- and BC < 6 µg m−3 ) and local-chemistry-controlled periods
Atmos. Chem. Phys., 18, 9879–9896, 2018 www.atmos-chem-phys.net/18/9879/2018/You can also read