One-Year Real-Time Measurement of Black Carbon in the Rural Area of Qingdao, Northeastern China: Seasonal Variations, Meteorological Effects, and ...

Page created by Phillip Banks
 
CONTINUE READING
One-Year Real-Time Measurement of Black Carbon in the Rural Area of Qingdao, Northeastern China: Seasonal Variations, Meteorological Effects, and ...
atmosphere

Article
One-Year Real-Time Measurement of Black Carbon in the Rural
Area of Qingdao, Northeastern China: Seasonal Variations,
Meteorological Effects, and the COVID-19 Case Analysis
Shijie Cui, Jiukun Xian, Fuzhen Shen, Lin Zhang, Baoling Deng, Yunjiang Zhang * and Xinlei Ge

                                          Jiangsu Key Laboratory of Atmospheric Environment Monitoring and Pollution Control, Collaborative
                                          Innovation Center of Atmospheric Environment and Equipment Technology, School of Environmental Sciences
                                          and Engineering, Nanjing University of Information Science and Technology, Nanjing 210044, China;
                                          csj930429@163.com (S.C.); jiukun_xian@163.com (J.X.); 20161119082@nuist.edu.cn (F.S.);
                                          zhanglin199455@163.com (L.Z.); baoling_deng@163.com (B.D.); caxinra@163.com (X.G.)
                                          * Correspondence: yjzhang@nuist.edu.cn; Tel.: +86-025-58731090

                                          Abstract: In this paper, we report the results obtained from one year of real-time measurement (i.e., from
                                          December 2019 to November 2020) of atmospheric black carbon (BC) under a rural environment in
                                          Qingdao of Northeastern China. The annual average concentration of BC was 1.92 ± 1.89 µg m−3 .
                                          The highest average concentration of BC was observed in winter (3.65 ± 2.66 µg m−3 ), followed by
                                          fall (1.73 ± 1.33 µg m−3 ), spring (1.53 ± 1.33 µg m−3 ), and summer (0.83 ± 0.56 µg m−3 ). A clear
                                weekend effect was observed in winter, which was characterized by higher BC concentration
                                   (4.60 ± 2.86 µg m−3 ) during the weekend rather than that (3.22 ± 2.45 µg m−3 ) during weekdays.
Citation: Cui, S.; Xian, J.; Shen, F.;    The influence of meteorological parameters, including surface horizontal wind speed, boundary layer
Zhang, L.; Deng, B.; Zhang, Y.; Ge, X.    height (BLH), and precipitation, on BC, was investigated. In particular, such BLH influence presented
One-Year Real-Time Measurement of         evidently seasonal dependence, while there was no significant seasonality for horizontal wind speed.
Black Carbon in the Rural Area of         These may reflect different roles of atmospheric vertical dilution on affecting BC in different seasons.
Qingdao, Northeastern China:              The 4BC/4CO ratio decreased with the increase of precipitation, indicative of the influence of
Seasonal Variations, Meteorological       below-cloud wet removal of BC, especially during summertime where rainfall events more frequently
Effects, and the COVID-19 Case
                                          occurred than any of other seasons. The bivariate-polar-plot analysis showed that the high BC
Analysis. Atmosphere 2021, 12, 394.
                                          concentrations were mainly associated with low wind speed in all seasons, highlighting an important
https://doi.org/10.3390/atmos12030394
                                          BC source originated from local emissions. By using concentration-weighted trajectory analysis, it
Academic Editors: Panu Karjalainen
                                          was found that regional transports, especially from northeastern in winter, could not be negligible
and Likun Xue                             for contributing to BC pollution in rural Qingdao. In the coronavirus disease 2019 (COVID−19) case
                                          analysis, we observed an obvious increase in the BC/NO2 ratio during the COVID-19 lockdown,
Received: 26 February 2021                supporting the significant non-traffic source sector (such as residential coal combustion) for BC in
Accepted: 16 March 2021                   rural Qingdao.
Published: 18 March 2021
                                          Keywords: black carbon; seasonal variations; meteorological effects; COVID-19; rural site; Qingdao
Publisher’s Note: MDPI stays neutral
with regard to jurisdictional claims in
published maps and institutional affil-
iations.                                  1. Introduction
                                               Black carbon (BC), generated from incomplete combustion processes of biomass or
                                          fossil fuels, is an important component of atmospheric fine particulate matter (PM2.5 , aero-
                                          dynamic equivalent diameter less than 2.5 µm) [1–3]. BC not only directly absorbs solar
Copyright: © 2021 by the authors.         radiation, generating direct radiative forcing, but it can also sever as cloud condensation
Licensee MDPI, Basel, Switzerland.        nuclei (CCN) affecting cloud processes [4] and deposit on snow and ice surfaces, reducing
This article is an open access article    their surface albedo [5], leading to indirect radiative forcing. Therefore, BC has a significant
distributed under the terms and
                                          climate effect on both regional and global scales [6], which may be the second most impor-
conditions of the Creative Commons
                                          tant climate warmer only after carbon dioxide (CO2 ) [2]. Moreover, BC is an important
Attribution (CC BY) license (https://
                                          environmental pollutant that influences the development of pollutants and thus changes
creativecommons.org/licenses/by/
                                          weather conditions [7,8]. It has been proved that BC can play a key role in aerosol-planetary
4.0/).

Atmosphere 2021, 12, 394. https://doi.org/10.3390/atmos12030394                                        https://www.mdpi.com/journal/atmosphere
One-Year Real-Time Measurement of Black Carbon in the Rural Area of Qingdao, Northeastern China: Seasonal Variations, Meteorological Effects, and ...
Atmosphere 2021, 12, 394                                                                                           2 of 19

                           boundary layer (PBL) interactions and thereby affect air quality in high BC emission re-
                           gions, like eastern China [9,10]. BC can also absorb some volatile toxic substances (such as
                           polycyclic aromatic hydrocarbons PAHs) [11,12] and provide them with oxidation reaction
                           sites to form more toxic PAHs oxidation derivatives [13,14]. On the other hand, the particle
                           size distribution of BC generally ranges from 0.01 to 1.0 µm, which are more likely to be
                           deposited in the human body and cause health effects to the public [15–17]. However, there
                           is still unknown uncertainty obtained from climate and environment models to evaluate
                           those BC impacts so far. It is essential to conduct long-term measurement of BC and thereby
                           investigate its temporal variation characterization to improve our understanding of BC
                           cycles in the atmosphere and to constrain modeling studies.
                                 As indicated by previous studies, the concentration levels and variations of ambi-
                           ent BC could be affected by two major factors, i.e., source emissions and mereological
                           conditions. The sources of BC could present significant regional dependence. For in-
                           stance, vehicle and industrial emissions are the major sources of BC in urban and suburban
                           areas [18–20], while the major source of BC in rural areas could be linked to biomass and bio-
                           fuel combustion [21,22]. BC pollution in China also affects the downwind regions [23–25].
                           Meteorological conditions also play an important role in BC variations, for instance, plane-
                           tary boundary layer and winds. Those meteorological can significantly affect the vertical
                           dispersion and horizontal transport capacity of BC [26–28]. Regional transport can also
                           enhance BC concentrations in urban and remote areas [29,30]. Typically BC is also subject to
                           a reduction in concentration due to removal by wet deposition (rainfall and snowfall) [31].
                           The above results indicate that the variation of BC concentrations in different regions and
                           the relative contribution of emission sources are influenced by geographical location, mete-
                           orological conditions, and source sector distributions. Thus, it is critical to understand the
                           sources and influence of meteorological factors on BC, to better understand the sources and
                           sinks of BC in the real atmosphere in different regions. To do so, the long-term and highly
                           time-resolved measurements are basically required to provide a sufficiently observational
                           dataset being used for the study in these aspects above.
                                 As reported by emission inventory studies, BC emissions increased from 0.87 Tg in
                           1980 to 1.88 Tg in 2009 over China [32]. Although the relative contribution of residential
                           sectors to the total BC emissions (82.03% in 1980) has been declining, this BC source sector
                           is still the major contributor to BC in China (e.g., 42.33% in 2009) [32]. According to
                           the new BC emissions inventory reported by Peking University, it was pointed out that
                           residential coal combustion was the largest source sector of BC, followed by residential
                           biofuel combustion, coke production, and diesel vehicles [33]. Winter heating in northern
                           China generated large amounts of BC from coal combustion and biomass combustion,
                           especially in rural areas in the north [29,34–36]. Interestingly, various short-term emission
                           reduction measures can effectively reduce BC concentrations and improve air quality, such
                           as the 2008 Beijing Olympics [37] and the 2014 Asia-Pacific Economic Cooperation (APEC)
                           meeting [38]. Previous studies have shown that the reduction in vehicle emissions directly
                           resulted in a noticeable BC decrease in urban areas [39,40]. For example, a 44% decrease in
                           BC changes from 2.30 to 1.29 µg m−3 within the city of Hangzhou following the coronavirus
                           disease 2019 (COVID-19) lockdown stage [40]. This observation period covers the period
                           affected by the epidemic, which not only provides an opportunity to identify the source
                           and composition of BC but also provides a unique scenario to evaluate anthropogenic
                           emission reduction on ambient BC.
                                 Qingdao is located on the Shandong Peninsula, part of the Bohai Sea Rim urban
                           agglomeration, and is also one of the top ten container ports in the world. In recent
                           years, particulate matter has been regarded as one of the main pollution problems in
                           Qingdao, especially in winter [41–43]. High levels of SO2 and NO2 were also observed in
                           Qingdao [44]. This is related to the fact that coal is the main energy source in Qingdao,
                           consuming 12.83 million tons per year, as well as possessing 2.8 million vehicles. Reduced
                           visibility and air quality are also important effects of BC [45]. The proportion of moderately
                           or severely polluted days (visibility ≥ 5 km; aerosol optical depth (AOD) > 0.5) ranged
One-Year Real-Time Measurement of Black Carbon in the Rural Area of Qingdao, Northeastern China: Seasonal Variations, Meteorological Effects, and ...
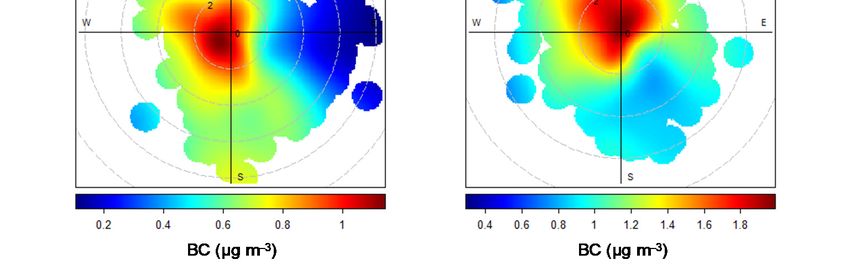
Atmosphere 2021, 12, 394                                                                                          3 of 19

                           from 10.77% to 32.79% from 2000 to 2010 [46]. Solid fuel (e.g., biomass fuel combustion) is
                           an important source of BC for winter heating in the north of China [36,47,48]. Although
                           clean heating has only been implemented in the rural areas of Qingdao, most areas have
                           not yet completely adopted clean heating. In the present study, long-term observation
                           of BC in the Qingdao area to identify its pollution sources and potential pollution areas
                           will help formulate effective policies to control the quality of control while providing an
                           effective basis for evaluating the effectiveness of clean heating policies and measures in
                           rural areas. The objectives of this study are to (1) quantify the temporal characteristics
                           and mass concentrations of BC; (2) investigate the influence of potential sources and
                           meteorological conditions on BC; (3) assess feedbacks of BC variations on the COVID-19
                           lockdown measures.

                           2. Experiments
                           2.1. Sampling Sites and Instrumentation
                                 The observation site is located in the northeastern coastal region of China, and the
                           sampling equipment is deployed on the roof of Qingdao Blue Valley Venture Center
                           (36.35◦ N, 120.68◦ E) (about 40 m in height, as shown in Figure S1). This observation site is
                           surrounded by a large number of villages with farmland scattered around. Two busy and
                           stable traffic-loaded highways are distributed to the west (900 m) and north (1200 m) of
                           the sampling site. There are a few light industries located in the northwestern part of the
                           site. One kilometer to the south of the site is AoShan Bay, where the Yellow Sea borders
                           the mainland. Three kilometers west of the site is a scenic area, such as the Heshan scenic
                           area. The sampling site represents a typical rural environment with multiple anthropogenic
                           sources (such as residential, traffic, and industrial sources) in eastern China.
                                 The sampling period was from 30 November 2019 to 30 November 2020. The mass
                           concentration of BC in the size range of PM2.5 was measured using a multi-angle absorption
                           photometer (MAAP) (model 5012, Thermo Scientific, USA) with a time resolution of
                           5 min [49]. Briefly, the basic principle of the instrument is to calculate the real-time
                           BC aerosol concentration obtained by measuring the extinction of aerosols attached to
                           the quartz filter. The sampling system was equipped with a PM2.5 cyclone cutter to
                           remove coarse particles. Aerosols in ambient air enter the instrument system with a
                           flow rate of 16.7 L min−1 and are deposited on the quartz fiber filter strip. A laser beam
                           at 670 nm wavelength continuously irradiates the quartz filter strip of the deposited
                           particles, and then the transmitted and refracted light signals are detected by optical
                           detectors [50,51]. Compared to conventional BC instruments (e.g., aethalometer) that can
                           only detect transmitted light, MAAP can detect both scattered and transmitted light from
                           multiple angles [49] for monitoring BC aerosol concentration with less uncertainty. As
                           quantification of the MAAP BC mass concentration is converted from light absorption
                           coefficient measured by filter-based optical methods, we, therefore, note that the BC
                           concentration in the present study was defined as equivalent BC mass concentration. This
                           is consistent with the same consideration by previous studies using similar filter-based
                           optical methods [52]. The instrument was maintained during the sampling period in
                           strict accordance with the instrument operating instructions. Flow rate, temperature, and
                           atmospheric pressure were calibrated monthly, cleaning of the cutting head was performed
                           every two months, timely processing of data for backup, and timely replacement of the
                           filter tape before it was running out. The flow rate was calibrated via the flow rate
                           calibration submenu on the instrument panel in conjunction with the standard flow meter.
                           The difference between the measured flow rate of the standard flow meter and the value
                           measured by MAAP was within 10%. The difference between the measured value of the
                           temperature sensor (air pressure sensor) for MAAP and the standard instrument value
                           was within ± 2 ◦ C (± 10 mm Hg). We are missing data from 11 February to 19 March 2020
                           and 3 June to 19 June 2020 due to instrument failure, COVID-19 pandemic effects, and
                           equipment maintenance during the sampling period.
Atmosphere 2021, 12, 394                                                                                             4 of 19

                                Hourly concentration data of other air pollutants, including carbon monoxide (CO),
                           nitrogen dioxide (NO2 ), sulfur dioxide (SO2 ), and PM2.5 , were accessed from the air quality
                           monitoring site. Meteorological data, such as temperature (T), relative humidity (RH), wind
                           speed (WS), wind direction (WD), visibility, and precipitation, were downloaded from
                           the nearby National Meteorological Information Center (http://www.nmic.cn/, accessed
                           on 18 March 2021). Boundary layer height data with 3 h resolution were obtained from
                           NOAA’s reanalysis data processing (ftp://arlftp.arlhq.noaa.gov, accessed on 18 March
                           2021). Pronounced seasonal variations were observed for most meteorological parameters
                           and general air pollutants.

                           2.2. Air Mass Back-Trajectory Analysis
                                To explore the potential geographic origins of BC at the receptor site, the hybrid
                           single-particle Lagrangian integrated trajectory HYSPLIT model (version 4.9) was applied.
                           Air mass trajectory data were obtained from the global data assimilation system (GDAS)
                           with a horizontal resolution of 1◦ × 1◦ (ftp://arlftp.arlhq.noaa.gov/pub/archives/gdas1/,
                           accessed on 18 March 2021). The 48 h backward trajectories at hourly intervals were plotted
                           at an altitude of 50 m throughout the observation period. The concentration-weighted
                           trajectory (CWT) analysis method is based on the identification of potential sources of
                           BC and the weighted average of trajectories of relevant concentrations to identify the
                           contribution of potential source regions to BC [53,54]. CWT was calculated with ZeFir,
                           a programming plug-in based on Igor Pro (Wavemetrics, USA). The potential source
                           regions around the receptor are divided into ijth grid arrays. CWT is a function of the BC
                           concentration and time the trajectory corresponds to in the ijth grid, defined as follows:

                                                                                  M
                                                                         1
                                                              Cij =
                                                                      ∑M
                                                                                  ∑ Cl τijl
                                                                       l=1 τijl   l=1

                           where Cij is the average weight concentration in ijth grid, l indicates the trajectory, M is the
                           total number of trajectories, Cl is the concentration corresponding to trajectory l, and τijl is
                           the elapsed time of trajectory l in ijth grid.

                           3. Results and Discussion
                           3.1. Concentration Variations of BC
                           3.1.1. Overview of BC Concentrations
                                Figure 1 shows the time series of meteorological parameters and air pollutants (includ-
                           ing BC). Meteorological elements include WS, BLH, RH, and precipitation, of which annual
                           average (±1σ) values were 2.4 (±1.5) m s−1 , 451 (±325) m, 70 ± 23% and 2.2 ± 4.6 mm, re-
                           spectively. During the entire observation period, the average concentration (concentration
                           range) of gaseous pollutants CO, SO2 and NO2 were 0.5 ± 0.3 mg m−3 (0.1–3.1 mg m−3 ),
                           5.8 ± 3.3 µg m−3 (1.0–50.0 µg m−3 ), and 15.7 ± 10.5 µg m−3 (2.0–94.0 µg m−3 ), respectively
                           (Figure 1c,d). The mean concentration of PM2.5 was 30.4 (±27.6) µg m−3 , where the mini-
                           mum and maximum values are 278 µg m−3 and 3 µg m−3 , respectively. During the entire
                           observation period, the hourly mass concentration (mean ± 1σ) of BC varies from 0.02 to
                           12.08 µg m−3 , with an annual average of 1.92 ± 1.89 µg m−3 . The frequency diagram of
                           the 5-min BC concentration distribution followed a typical lognormal distribution pattern
                           (Figure S2a). The concentration (0.55 µg m−3 ) with the highest frequency can be regarded
                           as the most representative under the atmospheric condition in the region [55]. These
                           results indicated that the level of BC concentration in rural areas of Qingdao was at the
                           middle level.
                                As shown in Figure 2, we summarized the results of long-term BC measurements
                           from some previous studies at other locations in East Asia. Compared with other ru-
                           ral areas, the average BC concentrations in rural Qingdao were much lower than those
                           in Beijing of China [34] and Delhi of India [27] and slightly higher than those in Maha-
                           baleshwar of India [18] and Byeongcheon of Korea [56]. BC concentrations in both urban
Atmosphere 2021, 12, 394                                                                                                                   5 of 19

                                  areas [18,19,26,36,57–62] and suburban areas [47,55] were higher than those in rural Qing-
                                  dao areas. The BC concentrations in the remote background areas [24,63,64] were much
                                  lower than those in the rural areas of Qingdao. Those comparisons may indicate that
                                  ambient BC presents distinct regional characteristics, which would be due to different BC
                                  emission intensity and some influence by different meteorological conditions.

                                   Figure 1. Time series of (a) wind direction (WD) colored by wind speed (WS), boundary layer height
                                   (BLH), (b) relative humidity (RH) and precipitation; mass concentrations of (c) SO2 , NO2 , (d) CO,
Atmosphere 2021, 12, x FOR PEER REVIEW                                                                                          6 of 20
                                   PM2.5 , and (e) atmospheric black carbon (BC) during the whole observation in Qingdao. Three trans-
                                   parent colors represent the three periods regarding the COVID-19 epidemic for further discussion.

                                                  60
                                                              Suburban      Urban           Rural         Remote
                                                  50

                                                  40                                               Korea              n
                                                                                                                    pa
                                   Latitude (º)

                                                                         China                                     a
                                                                                                                 J
                                                  30

                                                            India                                                         8
                                                  20
                                                                                                             BC (µg m )

                                                                                                                          6
                                                                                                            –3

                                                                                                                          4
                                                  10                                                                      2
                                                                                                                          0
                                                   0
                                                       70    80     90    100      110       120      130                 140   150
                                                                             Longitude (º)
                                 Figure                                                         −3)−obtained
                                  Figure2.2.AAsummary
                                                summaryofofannual
                                                               annualmean
                                                                      meanvalues
                                                                            valuesofofBC
                                                                                       BC(μg
                                                                                           (µgmm              from
                                                                                                    3 ) obtained     thethe
                                                                                                                  from   present
                                                                                                                            present study  andand
                                                                                                                                       study
                                 previous   long-term measurements      in East Asia. The  colors  of the solid circles represent
                                  previous long-term measurements in East Asia. The colors of the solid circles represent different  different
                                 types
                                  typesofofsampling
                                            samplingsites,
                                                     sites, including
                                                             including urban, suburban, rural,
                                                                       urban, suburban,   rural, and
                                                                                                 andremove,
                                                                                                        remove,and
                                                                                                                andthethesize
                                                                                                                          sizeofofthe
                                                                                                                                   thedata
                                                                                                                                        datapoints
                                 points refers to the mass concentration of BC. More descriptions of those observations are given in
                                  refers to the mass concentration of BC. More descriptions of those observations are given in Table S1.
                                 Table S1.
                                  3.1.2. Seasonal Variations
                                 3.1.2. Seasonal  Variations
                                        Figure 3 shows   clear seasonal variations of BC in rural Qingdao. The highest aver-
                                  age Figure  3 showsof
                                       concentration   clear
                                                          BC seasonal  variations
                                                             was observed         of BC (3.65
                                                                              in winter in rural Qingdao.
                                                                                              ± 2.66      −3 ) and
                                                                                                     µg mThe   highest average
                                                                                                                   followed by
                                 concentration of BC was observed in winter (3.65 ± 2.66 μg m ) and followed by fall (1.72
                                                                                                  −3

                                 ± 1.33 μg m−3), spring (1.53 ± 1.33 μg m−3), and summer (0.83 ± 0.56 μg m−3). Such a seasonal
                                 variation pattern is similar to the seasonal pattern observed in other sampling sites in dif-
                                 ferent regions, such as Hefei [58], Nanjing [55], and Indian Delhi [27]. Although the ob-
Atmosphere 2021, 12, 394                                                                                                                                    6 of 19

                                  fall (1.72 ± 1.33 µg m−3 ), spring (1.53 ± 1.33 µg m−3 ), and summer (0.83 ± 0.56 µg m−3 ).
                                  Such a seasonal variation pattern is similar to the seasonal pattern observed in other sam-
                                  pling sites in different regions, such as Hefei [58], Nanjing [55], and Indian Delhi [27].
                                  Although the observation sites in rural Qingdao and urban Shanghai are both coastal
                                  cities (both belong to the monsoon region), the seasonal pattern of BC in Shanghai [19]
                                  (winter > summer > spring > fall) is different from that in rural Qingdao. BC concentra-
                                  tions observed in rural Beijing and urban Spain both showed a seasonal variation of
                                  fall > winter > spring > summer, which was not the same as in rural Qingdao, most likely
                                  due to increased biomass burning during the harvest season [65]. As reported by previous
                                  studies, the seasonal variation of atmospheric BC could be driven by both emissions [32,33]
                                  and meteorological conditions [26,31]. These results indicate that the contribution of the
                                  sources of BC in rural Qingdao was uniquely seasonal, while the magnitude of the influ-
                                  ence of meteorological factors (WS, WD, BLH, and precipitation) on BC varied between
                                  seasons. The ratios of the mean BC concentrations in winter to the mean concentrations in
                                  other seasons (spring, summer, and fall) were 2.4, 4.4, and 2.1, respectively. This extreme
                                  seasonal difference is consistent with that observed in rural sites in Spain [66]. The BC
                                  concentrations corresponding to the maximum frequencies in different seasons were winter
                                  (1.29 µg m−3 ), spring (0.61 µg m−3 ), summer (0.43 µg m−3 ), and fall (0.76 µg m−3 ), as
                                  shown in Figure S2b. The peak and trough of the monthly variation of BC concentrations
                                  occurred in January (3.88 µg m−3 ) and August (0.76 µg m−3 ), respectively (In Figure 3b).
                                  The pattern of monthly BC concentration has not exhibited a clear U-shaped distribution.
                                  The lowest temperatures in January led to an increase in residential coal and biomass burn-
                                  ing (the highest concentration of SO2 and CO) and an increase in vehicle traffic emissions
Atmosphere 2021, 12, x FOR PEER REVIEW                                                                                                         7 of 20
                                  near the Spring Festival (the higher level of NO2 ), resulting in the highest concentrations in
                                  January. The concentrations of gaseous pollutants (CO, SO2, and NO2 ) and meteorological
                                  factors (WS and BLH) were not the lowest in August, but the concentrations of BC and
                                  the
                                  PM2.5lowest
                                          wereinboth
                                                  August     (in Figure
                                                       the lowest          1). This
                                                                      in August    (inmay  be the
                                                                                        Figure       reason
                                                                                                1). This   may forbethe
                                                                                                                      thehighest
                                                                                                                           reasontotal   precipita-
                                                                                                                                    for the  highest
                                  tion
                                  totaland   the highestand
                                         precipitation     frequency
                                                               the highestof precipitation
                                                                               frequency ofinprecipitation
                                                                                                 August (in Figure
                                                                                                                 in August1b) and   the significant
                                                                                                                               (in Figure   1b) and
                                  the significant
                                  effect             effect of on
                                          of wet deposition      wetBC deposition
                                                                          scavenging, on which
                                                                                          BC scavenging,
                                                                                                   is consistentwhichwithisthe
                                                                                                                             consistent
                                                                                                                                 findingswith     the
                                                                                                                                            in rural
                                  findings[34].
                                  Beijing    in rural
                                                  CO,Beijing    [34]. CO,
                                                        a gaseous            a gaseous
                                                                        pollutant    frompollutant
                                                                                            incompletefrom combustion,
                                                                                                            incomplete combustion,
                                                                                                                              showed the    showed
                                                                                                                                               same
                                  the samevariation
                                  monthly      monthlyasvariation
                                                            BC, and PM  as BC,    and
                                                                            2.5 and BCPM   2.5 and
                                                                                         show         BC show
                                                                                                the same    peakthe  andsame
                                                                                                                          troughpeak   andmonthly
                                                                                                                                   in the    trough
                                  in the monthly
                                  pattern,           pattern, which
                                             which indicated      that BC indicated    that BC and combustion-generated
                                                                             and combustion-generated                                 atmospheric
                                                                                                                 atmospheric pollutants        have
                                  pollutants    have common       sources   from   Qingdao     and  its  surrounding
                                  common sources from Qingdao and its surrounding areas. These results indicate that the  areas.  These   results  in-
                                  dicate   that the increase   in  local  and   regional  anthropogenic      primary
                                  increase in local and regional anthropogenic primary emissions and adverse meteorolog-  emissions   and   adverse
                                  meteorological
                                  ical               conditions
                                       conditions lead    to serious lead  to serious
                                                                         pollution       pollution
                                                                                     of BC   in winterof BC   in winter
                                                                                                          [19,36,62],       [19,36,62],
                                                                                                                        combined         combined
                                                                                                                                      with  the sea-
                                  with the
                                  sonal      seasonal distribution
                                         distribution                    pattern meteorological
                                                        pattern meteorological          parameters and  parameters     and gas pollution.
                                                                                                             gas pollution.

                                      (a) 10                                            (b) 10

                                                     8                                                8
                                        BC (µg m )

                                                                                         BC (µg m )
                                       –3

                                                                                        –3

                                                     6                                                6

                                                     4                                                4

                                                     2                                                2

                                                     0                                                0
                                                         Winter Spring Summer    Fall                     Dec Jan Feb Mar Apr May Jun Jul Aug Sep Oct Nov

                                     Figure 3. Box plots for the BC mass concentration in different seasons (a) and month (b). In each
                                     Figure
                                     symbol, 3. the
                                                 Boxwhiskers
                                                    plots for the
                                                              aboveBC and
                                                                       massbelow
                                                                             concentration
                                                                                  box markinthe
                                                                                              different
                                                                                                 90% andseasons (a) and month
                                                                                                           10% percentiles,     (b). In eachthe
                                                                                                                             respectively;
                                     symbol,
                                     upper andthelower
                                                   whiskers
                                                        edgeabove
                                                              of the and below
                                                                     boxes      box mark
                                                                            represent      the and
                                                                                      the 75%  90%25%
                                                                                                    andpercentiles,
                                                                                                         10% percentiles, respectively;
                                                                                                                    respectively; and thethelines
                                     upper  and   lower edge  of the  boxes represent  the 75%  and 25%  percentiles,
                                     and circles inside the boxes denote median and mean values, respectively.        respectively; and  the
                                     lines and circles inside the boxes denote median and mean values, respectively.
                                          Figure S3 shows the correlation between PM2.5 and BC was strong (r = 0.71), BC
                                          Figure S3 in
                                     was scattered   shows  theMoreover,
                                                       winter.  correlationthe
                                                                            between  PMand
                                                                               seasonal 2.5 and BC was
                                                                                             monthly    strong (r
                                                                                                     variation    = 0.71),
                                                                                                                trends  of BC
                                                                                                                           BC was
                                                                                                                              and
                                     scattered in winter. Moreover,  the seasonal  and monthly  variation trends  of BC and
                                     PM2.5 are consistent. These results indicated that BC and PM2.5 have common sources,    PM 2.5

                                     are consistent. These results indicated that BC and PM2.5 have common sources, but the
                                     contribution of the sources may be slightly different in four seasons. Therefore, to further
                                     investigate the distribution pattern of BC under different PM2.5 concentrations in the four
                                     seasons, the PM2.5 concentrations were divided into five bins (0–35 μg m−3, 35–75 μg m−3,
                                                             −3                 −3                        −3
Atmosphere 2021, 12, 394                                                                                                                            7 of 19

                                  but the contribution of the sources may be slightly different in four seasons. Therefore,
                                  to further investigate the distribution pattern of BC under different PM2.5 concentrations
                                  in the four seasons, the PM2.5 concentrations were divided into five bins (0–35 µg m−3 ,
                                  35–75 µg m−3 , 75–115 µg m−3 , 115,150 µg m−3 , >150 µg m−3 ). Figure 4 shows the box
                                  plot of BC concentration and mass ratio of BC/PM2.5 in five bins. As the concentration
                                  of PM2.5 increased (the data bins were based on the limits of different air pollution levels
                                  in China), the average BC concentration gradually increased from 2.07 to 8.3 µg m−3 in
                                  winter, from 1.14 to 3.3 µg m−3 in spring, from 0.77 to 1.53 µg m−3 in summer, and from
                                  1.45 to 3.58 µg m−3 in fall. However, the mean ratio of BC/PM2.5 gradually decreased from
                                  10.2% to 4.7% in winter, from 6.0% to 4.1% in spring, from 7.7% to 3.3% in summer, and
                                  from 11.6% to 4.0% in fall. It is well known that PM2.5 was a complex mixture of primary
                                  and secondary species, and BC aerosol was a typical primary pollutant. The decreasing
                                  proportion of BC in PM2.5 may be indicated that chemically generated secondary species
                                  play a more important role in the heavier pollution of PM2.5 . This conclusion was consistent
 Atmosphere 2021, 12, x FOR PEER REVIEW
                                  with the results found in the Nanjing area, but further verification is needed through8the of 20

                                  physical and chemical properties of PM2.5 .

                          (a) 12                                                     (b) 5                                      12
                                                         Winter                                            Spring
                                                                                 20
                                    10                                                                                          10
                                                                                         4
                                                                                 16
                                      8                                                                                         8

                                                                                                                                     BC/PM2.5 (%)
                 BC (µg m )
                –3

                                                                                         3
                                                                                 12
                                      6                                                                                         6
                                                                                         2
                                      4                                          8                                              4

                                                                                 4       1
                                      2                                                                                         2

                                      0                                          0       0                                      0

                                   (c) 3                                         16(d)                                          24
                                                        Summer                                              Fall
                                                                                         6                                      20
                                                                                 12
                                      2                                                                                         16
                                                                                                                                     BC/PM2.5 (%)
                      BC (µg m )
                   –3

                                                                                         4
                                                                                 8                                              12

                                      1                                                                                         8
                                                                                         2
                                                                                 4
                                                                                                                                4

                                      0                                          0       0                                      0
                                           0–35   35–75 75–115 115–150 >150                  0–35   35–75 75–115 115–150 >150
                                                                 –3                                                –3
                                                      PM2.5 (µg m )                                     PM2.5 (µg m )

        Figure 4. Mass concentrations and mass percentages of BC in PM2.5 (atmospheric fine particulate matter with aerodynamic
      Figure 4. Mass concentrations and mass percentages of BC in PM2.5 (atmospheric fine particulate matter with aerodynamic
        equivalent diameter less than 2.5 μm) as a function of PM2.5 in winter (a), spring (b), summer (c), and fall (d). (Meanings
      equivalent diameter less than 2.5 µm) as a function of PM2.5 in winter (a), spring (b), summer (c), and fall (d). (Meanings of
        of the boxes are consistent with those described in Figure 2).
      the boxes are consistent with those described in Figure 2).
                                                   3.1.3. Diurnal Variation
                                                  3.1.3. Diurnal Variation
                                                         As shown in Figure S4a, the diurnal variation of BC was similar for all four seasons
                                                        As for
                                                   except   shown   in Figure
                                                               summer,   whichS4a,   the diurnal
                                                                                 showed           variation
                                                                                          a clear double    of with
                                                                                                          peak  BC was   similar
                                                                                                                     peaks        for all and
                                                                                                                            at 7:00–8:00  four18:00–
                                                                                                                                               sea-
                                                  sons  except
                                                   19:00,       for summer,
                                                           respectively. The which    showed
                                                                              increasing       a clear double peak
                                                                                           BC concentrations   in thewith  peaksand
                                                                                                                       morning    at 7:00–8:00
                                                                                                                                      evening and
                                                                                                                                               were
                                                  18:00–19:00,  respectively. The  increasing   BC  concentrations  in the morning    and
                                                   mainly attributed to the increase of traffic emissions and solid fuel combustion (peakedeveningin
                                                  were
                                                   NO2,mainly
                                                          CO, and attributed to the
                                                                    SO2 during   the corresponding
                                                                                      increase of traffic emissions
                                                                                                     periods,        andinsolid
                                                                                                              as shown           fuel
                                                                                                                            Figure     combustion
                                                                                                                                    S4b,d), and me-
                                                  (peaked in NO2 , CO, and SO2 during the corresponding periods, as shown in Figure S4b,d),
                                                   teorological factors (BLH and WS were the lowest values, as shown in Figure S5). After
                                                  and meteorological factors (BLH and WS were the lowest values, as shown in Figure S5).
                                                   sunrise, with enhanced convective activity, BLH and WS rose rapidly (e.g., Figure S5), and
                                                  After sunrise, with enhanced convective activity, BLH and WS rose rapidly (e.g., Figure S5),
                                                   better diffusion conditions caused BC concentrations to decrease gradually, reaching a
                                                  and better diffusion conditions caused BC concentrations to decrease gradually, reaching a
                                                   minimum at 14:00–15:00. There was no obvious peak in summer, and BC only had a small
                                                  minimum at 14:00–15:00. There was no obvious peak in summer, and BC only had a small
                                                   high value at 6:00, consistent with that in an urban-rural fringe area of Beijing [34], and
                                                   the diurnal pattern of BC was much stable in summer compared to the rest of the season.
                                                   This was not similar to the daily variation in summer in some areas [19,36,57,58]. Moreo-
                                                   ver, the summer BC did not show the same morning and evening peaks as NO2 and was
                                                   not quite the same as the daily variation of CO and SO2. However, the daily variation
Atmosphere 2021, 12, 394                                                                                                                                               8 of 19

                                   high value at 6:00, consistent with that in an urban-rural fringe area of Beijing [34], and the
                                   diurnal pattern of BC was much stable in summer compared to the rest of the season. This
                                  was not similar to the daily variation in summer in some areas [19,36,57,58]. Moreover,
                                   the summer BC did not show the same morning and evening peaks as NO2 and was not
                                   quite the same as the daily variation of CO and SO2 . However, the daily variation patterns
                                   of WS and BLH were similar throughout the four seasons (Figure S5b,c). The reason
                                   for this unique daily variation in summer may be due to the higher frequency and total
                                   amount of precipitation in summer, which had a significant wet deposition removal effect.
                                   Compared to other seasons, the daily variation of BC in winter was most similar to that of
                                   gaseous pollutants (Figure S4b,d), while horizontal and vertical dispersion conditions were
                                   moderate. However, the difference between daily maximum and minimum concentrations
                                  was greatest in winter (2.75 µg m−3 ), followed by fall (1.41 µg m−3 ), spring (1.20 µg m9−of3 ),20
 Atmosphere 2021, 12, x FOR PEER REVIEW
                                   and summer (0.41 µg m−3 ). The diurnal variation of BC in rural areas of Qingdao had
                                   certain seasonal differences, which may be due to the differences in emission intensity and
                                   meteorological conditions of the sources associated with BC in each season.
                                    3.1.4. Weekend Effect
                                             3.1.4. Figure
                                                     Weekend    5a Effect
                                                                     describes the differences in BC concentrations between weekdays and
                                              weekends       in   the
                                                    Figure 5a describes four seasons.        The BC
                                                                               the differences        in BCconcentrations
                                                                                                                concentrations    onbetween
                                                                                                                                       weekends        were significantly
                                                                                                                                                  weekdays       and week-
                                              higher
                                             ends   in than
                                                        the fourthatseasons.
                                                                      on weekdays  The BC  in concentrations
                                                                                               winter, while the      onweekend
                                                                                                                           weekends      and
                                                                                                                                           wereweekday      BC concentra-
                                                                                                                                                   significantly      higher
                                              tions  were     essentially    comparable          for  the    rest  of  the  seasons.
                                             than that on weekdays in winter, while the weekend and weekday BC concentrations were        Similarly,    the  weekday        and
                                              weekend      BC/CO       and   BC/NO       2 showed similar patterns in different seasons (Figure 5b,c).
                                             essentially comparable for the rest of the seasons. Similarly, the weekday and weekend
                                              The diurnal
                                             BC/CO       and variation
                                                                BC/NO2 of         BC on similar
                                                                              showed        weekends         and weekdays
                                                                                                        patterns      in different  in winter
                                                                                                                                         seasons  was   similar,
                                                                                                                                                    (Figure        whileThe
                                                                                                                                                                5b,c).       the
                                              BC   concentration       on  weekends         was   overall     higher    than   that
                                             diurnal variation of BC on weekends and weekdays in winter was similar, while the BC      on  weekdays       (Figure    S6).  This
                                              was contrary on
                                             concentration        to the   result shown
                                                                      weekends                  for urban
                                                                                       was overall       higher areas
                                                                                                                    than [55,66,67],     which was(Figure
                                                                                                                            that on weekdays             that the    BCThis
                                                                                                                                                                  S6).     con-
                                              centrations
                                             was   contrarywere to thehigher
                                                                         resulton     weekdays
                                                                                  shown      for urbanthanareas
                                                                                                              that on    weekends,
                                                                                                                    [55,66,67],      whichimplying
                                                                                                                                              was that  unique
                                                                                                                                                           the BC anthropo-
                                                                                                                                                                     concen-
                                              genic emission
                                             trations   were higher  regulation
                                                                          on weekdays of BC than
                                                                                               in winter.
                                                                                                      that onThere        were implying
                                                                                                                  weekends,        two possible  uniquereasons    to explain
                                                                                                                                                           anthropogenic
                                             emission regulation of BC in winter. There were two possible reasons to explain suchin-
                                              such   a  phenomenon.          First,   anthropogenic           emissions      (e.g.,   coal  and    biomass     burning)        a
                                              creased duringFirst,
                                             phenomenon.             wintertime       heating emissions
                                                                          anthropogenic           weekends (e.g., in rural   areas
                                                                                                                          coal  andnearby
                                                                                                                                        biomass  theburning)
                                                                                                                                                      sampling      site. This
                                                                                                                                                                 increased
                                              could be
                                             during        supported
                                                       wintertime          by the
                                                                        heating        evidentlyinhigher
                                                                                   weekends                      concentrations
                                                                                                       rural areas      nearby the of       a biomass
                                                                                                                                        sampling      site.burning
                                                                                                                                                            This could  tracer,
                                                                                                                                                                             be
                                              i.e., C2H4Oby
                                             supported       2, on
                                                                 theweekend
                                                                      evidentlywinterhigherthan      that on weekdays
                                                                                               concentrations        of a biomass(Figure     S7). Intracer,
                                                                                                                                         burning       addition,
                                                                                                                                                             i.e., Cthe
                                                                                                                                                                      2 HPM
                                                                                                                                                                          4 O22.5
                                                                                                                                                                                ,
                                              source
                                             on  weekendapportionment
                                                               winter than analysis           in Qingdao
                                                                                that on weekdays                 showed
                                                                                                            (Figure    S7). Inthat    coal and
                                                                                                                                addition,      thebiomass
                                                                                                                                                    PM2.5 sourcecombustion
                                                                                                                                                                       appor-
                                              could contribute
                                             tionment     analysis 41.53%
                                                                       in Qingdao to the   total PM
                                                                                         showed     that2.5 during
                                                                                                             coal and  the  wintertime
                                                                                                                          biomass             [43], supporting
                                                                                                                                       combustion                    a signif-
                                                                                                                                                        could contribute
                                              icant contribution
                                             41.53%    to the total PM   from
                                                                            2.5  these
                                                                                 during   solid
                                                                                            the   fuels    combustion
                                                                                                  wintertime       [43],      sources
                                                                                                                           supporting     toa ambient
                                                                                                                                               significant BC  in  Qingdao.
                                                                                                                                                             contribution
                                             from   these
                                              Second,       solid
                                                          the  areafuels
                                                                      nearcombustion
                                                                             the sampling     sources
                                                                                                  site istoaambient
                                                                                                               new type    BCofintourist
                                                                                                                                     Qingdao.
                                                                                                                                            areaSecond,
                                                                                                                                                   (Heshan   the  area near
                                                                                                                                                                Scenic    Area
                                             the  sampling
                                              to the   west) withsite ishot
                                                                          a new
                                                                             springstypeandof tourist      area (Heshan
                                                                                                 farmhouses.         The short Scenic     Area totrip
                                                                                                                                     weekend         theleads
                                                                                                                                                           west)towith
                                                                                                                                                                     bothhot  in-
                                             springs
                                              crease and      farmhouses.
                                                        in traffic     emissions The (20.52%
                                                                                        short weekend
                                                                                                   contributiontrip leadsfromto both
                                                                                                                                  trafficincrease    in traffic
                                                                                                                                            in Qingdao        PM emissions
                                                                                                                                                                   2.5 winter
                                             (20.52%     contribution
                                              source analysis        [43]) from
                                                                            and atraffic
                                                                                      certaininextent
                                                                                                   Qingdao         PM2.5
                                                                                                             in solid       winter
                                                                                                                         fuel           source analysis
                                                                                                                               consumption.                    [43]) and
                                                                                                                                                    Those results        could a
                                             certain
                                              suggestextent       in solid fuel
                                                         the importance          of consumption.
                                                                                     such weekend Those     effect onresults    could
                                                                                                                          ambient      BCsuggest      the importance
                                                                                                                                            concentrations       due to dis- of
                                             such
                                              tinctweekend
                                                     residential   effect
                                                                      coalonand/or
                                                                               ambient      BC concentrations
                                                                                         biomass       burning emissions due to distinct
                                                                                                                                     between   residential
                                                                                                                                                  weekends    coal
                                                                                                                                                                 and and/or
                                                                                                                                                                        week-
                                             biomass
                                              days.      burning      emissions      between      weekends         and    weekdays.

             (a)                                              (b) 0.012                                         (c) 0.40
                       10
                                                Weekday             0.010
                           8                    Weekend                                                               0.30
                                                                    0.008
              BC (µg m )
             –3

                                                                                                                  BC/NO2
                                                                BC/CO

                           6
                                                                    0.006                                             0.20

                           4                                        0.004
                                                                                                                      0.10
                           2                                        0.002

                           0                                        0.000                                             0.00
                               Winter Spring Summer   Fall                  Winter Spring Summer        Fall                 Winter Spring Summer       Fall

      Figure 5. Comparison of (a) BC concentration, (b) BC/CO ratio, and (c) BC/NO2 during the weekday and weekend in
       Figure 5.
      different   Comparison
                seasons,       of (a) BC concentration, (b) BC/CO ratio, and (c) BC/NO2 during the weekday and weekend in
                         respectively.
       different seasons, respectively.

                                              3.2. Influence of Meteorological Parameters on BC
                                              3.2.1. Influence of Wind Speed and Boundary Layer Height
                                                      Figure 6 shows the relationships between BC and WS and BLH in the four seasons,
Atmosphere 2021, 12, 394                                                                                                                            9 of 19

                                                 3.2. Influence of Meteorological Parameters on BC
                                                 3.2.1. Influence of Wind Speed and Boundary Layer Height
                                        Figure 6 shows the relationships between BC and WS and BLH in the four seasons,
                                  respectively. The average BC concentration gradually decreased with the increase of
                                  WS from 4.56 to 1.67 µg m−3 in winter, from 1.90 to 0.54 µg m−3 in spring, from 1.0 to
                                  0.41 µg m−3 in summer, and from 1.84 to 0.67µg m−3 in fall, respectively. Similarly, the
                                  BC concentration gradually decreased with the increase of BLH from 5.54 to 1.55 µg m−3
                                  in winter, from 1.86 to 0.79 µg m−3 in spring, from 0.99 to 0.60 µg m−3 in summer, and
                                  from 2.46 to 0.67 µg m−3 in fall, respectively. These results could support the important
                                  influence of these two meteorological factors, i.e., WS and BLH, on BC concentrations
                                  in the atmosphere. To further explore the relationship between the relative change rates
Atmosphere 2021, 12, x FOR PEER REVIEW                                                                                               10 of 20
                                  of BC with WS and BLH, the BC was normalized by dividing the value of each WS or
                                  BLH-dependent bin by the average BC concentration observed in the first bin. As shown
                                  in Figure 6, the relative change rate of BC presented decreasing trends as the increase of
                                   relative
                                  WS   in allchange   rateThese
                                               seasons.    of BC trends
                                                                  presented
                                                                         weredecreasing    trends as with
                                                                                highly consistent     the increase  of WS
                                                                                                            each other   in in all seasons.
                                                                                                                             each  season,
                                   These trends
                                  suggesting        were highly
                                                 insignificant    consistentofwith
                                                               seasonality      sucheach  other in each
                                                                                      the horizontal   WSseason,   suggesting
                                                                                                           influence.   Figure 6d insignifi-
                                                                                                                                    shows
                                   cantrelative
                                  the    seasonality   of such
                                                  change        the
                                                          rate of BChorizontal   WS influence.
                                                                      against BLH,               Figure 6d
                                                                                      which, however,     wasshows   the relative
                                                                                                               characterized    by change
                                                                                                                                    strong
                                   rate of BC
                                  seasonal      against BLH,
                                              differences      which,
                                                           for their    however, wastrends
                                                                     corresponding      characterized   by strong
                                                                                               in different         seasonal
                                                                                                             seasons.  Indeed,differences
                                                                                                                                 the most
                                   for their
                                  rapid       corresponding
                                          decrease             trendschange
                                                     in the relative   in different seasons.
                                                                               rate of  BC was Indeed,  the in
                                                                                                 observed    most  rapidamong
                                                                                                                winter    decreasethein  the
                                                                                                                                      four
                                   relative suggesting
                                  seasons,   change ratea of   BC effective
                                                            more   was observed    in vertical
                                                                            effect of  winter dilution
                                                                                               among the andfour  seasons,
                                                                                                              diffusion      suggesting
                                                                                                                         on BC   in wintera
                                  rather   than in each
                                   more effective    effectof
                                                            ofany  other
                                                               vertical   seasons.
                                                                        dilution  andThe  resultson
                                                                                       diffusion   above
                                                                                                      BC inimply   that
                                                                                                              winter     the than
                                                                                                                     rather   seasonality
                                                                                                                                    in each
                                  of
                                   of atmospheric     diffusion
                                      any other seasons.    The and   dilution
                                                                 results aboveeffect
                                                                                 implyon  surface
                                                                                        that        BC mightof
                                                                                             the seasonality    beatmospheric
                                                                                                                   derived by the     BLH
                                                                                                                                  diffusion
                                  variation   in rural
                                   and dilution         Qingdao.
                                                   effect on surface BC might be derived by the BLH variation in rural Qingdao.

                            (a) 10                                                      (b) 10

                                       8                                                              8
                            )

                                                                                           )
                      –3

                                                                                       –3

                                       6                                                              6
                            BC (µg/m

                                                                                           BC (µg/m

                                       4                                                              4

                                       2                                                              2

                                       0                                                              0

                (c) 1.0                                                           (d) 1.0

                                  0.8                                                              0.8
            Normalized BC

                                                                                   Normalized BC

                                  0.6                                                              0.6

                                  0.4                                                              0.4

                                  0.2                                                              0.2
                                           0–2   2–4    4–6       6–8     8–10                            0–300 300–600600–900 900–1200 1200–1500
                                                           –1
                                                   WS (m s )                                                           BLH (m)

         Figure 6.
         Figure 6. Mass
                   Mass concentration
                        concentration and
                                      and normalized
                                          normalized BC
                                                     BC values
                                                        valuesas
                                                               asaafunction
                                                                    functionof
                                                                            of(a,c)
                                                                               (a,c)WS
                                                                                    WSrange
                                                                                       rangeand
                                                                                             and(b,d)
                                                                                                 (b,d)BLH,
                                                                                                      BLH,respectively.
                                                                                                           respectively.

                                                  3.2.2. Influence
                                                 3.2.2.  Influence of
                                                                    of Precipitation
                                                                        Precipitation
                                                        BCand
                                                        BC  andCOCOareareboth
                                                                          bothmainly
                                                                               mainlygenerated
                                                                                        generatedfrom
                                                                                                    fromthe
                                                                                                          theincomplete
                                                                                                               incomplete    combustion
                                                                                                                           combustion    ofof  liquid
                                                                                                                                            liquid    fos-
                                                                                                                                                    fossil
                                                  sil fuels  or solid  biomass  and   have  source   homology      in intense  anthropogenic
                                                 fuels or solid biomass and have source homology in intense anthropogenic regions. Because        regions.
                                                  Because
                                                 the         the atmospheric
                                                       atmospheric              lifetime
                                                                      lifetime of         of BCone
                                                                                   BC (about     (about
                                                                                                    week)oneis week)
                                                                                                                shorteristhan
                                                                                                                           shorter
                                                                                                                                thatthan
                                                                                                                                     of COthat(1 of CO (1
                                                                                                                                                 month),
                                                  month),    wet removal    can remove    BC,  but not CO.    Therefore,   the
                                                 wet removal can remove BC, but not CO. Therefore, the 4BC/4CO ratio, minimize △BC/△CO       ratio,  mini-
                                                  mize influence
                                                 influence          atmospheric
                                                              atmospheric           dilution,
                                                                             dilution,        has often
                                                                                        has been   been often
                                                                                                         used used     to investigate
                                                                                                                 to investigate         the influence
                                                                                                                                  the influence         of
                                                                                                                                                   of wet
                                                  wet scavenging on surface BC [24,68,69]. The delta symbol (△) represents the difference
                                                  between observed and background concentrations. The background concentration of BC
                                                  was deemed to be zero, and the background concentration of CO was determined as
                                                  1.25th percentile of the CO concentrations for each month, which is consistent with the
Atmosphere 2021, 12, 394                                                                                                                   10 of 19

                                   scavenging on surface BC [24,68,69]. The delta symbol (4) represents the difference
                                   between observed and background concentrations. The background concentration of
                                   BC was deemed to be zero, and the background concentration of CO was determined
                                   as 1.25th percentile of the CO concentrations for each month, which is consistent with
                                   the definition adopted in previous studies [25,70,71]. The background concentrations
                                   of CO for each month were 0.3 (December), 0.3 (January), 0.2 (February), 0.1 (March),
                                   0.2 (April), 0.3 (May), 0.2 (June), 0.1 (July), 0.1 (August), 0.2 (September), 0.2 (October), and
                                   0.3 (November) mg m−3 , respectively.
                                         The overall mean of the observed 4BC/4CO ratio in the presence of precipitation
                                   (0.0041 ± 0.0036) was lower than that in the absence of precipitation (0.0071 ± 0.0057).
                                   As it could be assumed that CO was not affected by precipitation, this result could overall
Atmosphere 2021, 12, x FOR PEER REVIEW                                                                                                      11 of 20
                                   indicate that BC was lost through the below-cloud wet deposition. Such a result is consistent
                                   with some previous findings [24]. From the red fitting line in Figure 7, it can be seen that
                                   4BC/4CO decreases gradually with increasing precipitation. The 4BC/4CO ratio
                                  ratio  decreases
                                   decreases   rapidlyrapidly
                                                           whenwhen      precipitation
                                                                  precipitation            is inrange
                                                                                    is in the     the range
                                                                                                       of 0–5ofmm,
                                                                                                                 0–5 with
                                                                                                                       mm, awith    a decrease
                                                                                                                               decrease   of 43.5%of
                                  43.5%   compared      to  the average     value   of the   first interval  (the first  black
                                   compared to the average value of the first interval (the first black circle represents the   circle represents
                                  the  value
                                   value      0.0023
                                           0.0023       in Figure
                                                    in Figure    7). 7).
                                                                      TheThe   average4△BC/△CO
                                                                             average      BC/4CO ratio   ratio was
                                                                                                                was close
                                                                                                                      close to
                                                                                                                             to 0.0011
                                                                                                                                0.0011 when
                                                                                                                                        when the the
                                  precipitation    is larger  than   10  mm,    reflecting   a flat trend  for the relationship
                                   precipitation is larger than 10 mm, reflecting a flat trend for the relationship of 4BC/4CO      of △BC/△CO
                                  ratio
                                   ratio against
                                          against precipitation.
                                                    precipitation. Compared
                                                                       Comparedtotothe    theaverage
                                                                                                averagevalue
                                                                                                          valueof of the
                                                                                                                      the starting
                                                                                                                           starting interval,
                                                                                                                                     interval, the
                                                                                                                                                 the
                                  △BC/△CO
                                   4BC/4COratio    ratiodecreased
                                                           decreasedbyby52%. 52%.TheTheresults
                                                                                          resultshighlight
                                                                                                    highlightthetheimportance
                                                                                                                     importanceofofthe thebelow-
                                                                                                                                            below-
                                  cloud
                                   cloudwetwetremoval
                                                removaleffecteffectononsurface
                                                                         surfaceBC.      The△BC/△CO
                                                                                    BC.The      4BC/4CO     ratio hadhad
                                                                                                               ratio    thethehighest  number
                                                                                                                                 highest  number  of
                                  data   points   in   summer     (52.4%),     followed     by   spring   (19.6%),   winter
                                   of data points in summer (52.4%), followed by spring (19.6%), winter (16.0%), and fall      (16.0%),  and    fall
                                  (11.8%),
                                   (11.8%), respectively.      Combinedwith
                                             respectively. Combined           withthe
                                                                                    theseasonal
                                                                                         seasonaldistribution
                                                                                                      distributionpattern
                                                                                                                     pattern of of
                                                                                                                                BCBC   concentra-
                                                                                                                                    concentration
                                  tion  (in Section
                                   (in Section  3.1.2),3.1.2), it was
                                                          it was  found  found    that deposition
                                                                            that wet   wet deposition       in summer
                                                                                                      in summer     had ahad     a significant
                                                                                                                             significant  removalre-
                                  moval    effect
                                   effect on  theonBCthe    BC concentration
                                                        concentration      in ruralinQingdao.
                                                                                      rural Qingdao.

                                                 0.008
                                                                               The rest of the season
                                                                               Summer
                                      CO ratio

                                                 0.006

                                                                       f(x)=0.001+0.002*exp(–0.520x)
                                                 0.004
                                      BC /

                                                 0.002

                                                 0.000
                                                         0    4           8         12          16         20
                                                                      Precipitation (mm)
                                    Figure      The△BC/△CO
                                     Figure7.7.The   4BC/4CO   ratio as aasfunction
                                                                  ratio             of precipitation.
                                                                            a function                The The
                                                                                        of precipitation. solidsolid
                                                                                                                blackblack
                                                                                                                      circles present
                                                                                                                            circles    the the
                                                                                                                                    present
                                    average values (mean ± standard deviation) of the △BC/△CO ratio in different precipitation bins
                                     average values (mean ± standard deviation) of the 4BC/4CO ratio in different precipitation bins
                                    for the entire period. The curve fitting was performed with these averaged data points. The size-
                                     for the entire period. The curve fitting was performed with these averaged data points. The size-scale
                                    scale data points refer to surface wind speed.
                                     data points refer to surface wind speed.
                                    3.3.
                                     3.3.Source
                                          SourceAnalysis
                                                  AnalysisofofBCBC
                                          Bivariate
                                           Bivariate polar plots obtained
                                                       polar  plots   obtained from
                                                                                  from wind
                                                                                        wind analysis
                                                                                               analysis present
                                                                                                          present the
                                                                                                                   the combined
                                                                                                                        combined effect
                                                                                                                                      effect of
                                                                                                                                             of
                                    wind
                                     windspeed
                                            speedand anddirection
                                                           directionononairairpollutants at at
                                                                                pollutants  a receptor
                                                                                               a receptorsite, which
                                                                                                            site,     could
                                                                                                                  which       provide
                                                                                                                          could   providean ef-
                                                                                                                                             an
                                    fective  way
                                     effective  wayto to
                                                       assess the
                                                         assess    possible
                                                                 the possiblegeographic
                                                                                geographicorigins
                                                                                            originsofofthese
                                                                                                        thesepollutants
                                                                                                               pollutants[72].
                                                                                                                           [72].As
                                                                                                                                 Asshown
                                                                                                                                     shownin in
                                    Figure   8, the    high  BC   concentrations     are observed    associated    with  low
                                     Figure 8, the high BC concentrations are observed associated with low wind speeds (mostly wind    speeds
                                    (mostly
                                     less thanless
                                                 2 than
                                                    m s−21 )mins all
                                                                −1) in all seasons, yet with different wind direction sectors in differ-
                                                                     seasons, yet with different wind direction sectors in different
                                    ent  seasons.   For   example,
                                     seasons. For example, there      there
                                                                        was was    no evident
                                                                               no evident windwind      direction
                                                                                                  direction        dependence
                                                                                                             dependence            in winter,
                                                                                                                            in winter,   while
                                    while   the BC
                                     the high   high    BC concentrations
                                                    concentrations             were linked
                                                                        were linked          to winds
                                                                                      to winds          from
                                                                                                 from the      the south
                                                                                                            south          in spring,
                                                                                                                   in spring,           south-
                                                                                                                                southwest    in
                                    west in summer, and north in fall, respectively. Those results suggest that local-scale emis-
                                    sions could be a major contributor to ambient BC concentrations under the relatively sta-
                                    ble atmospheric conditions (e.g., WS < 2 m s−1) observed at the sampling site. At high wind
                                    speed conditions (>6 m s−1), relatively high BC concentration was observed in the south in
Atmosphere 2021, 12, 394                                                                                                            11 of 19

                                      summer, and north in fall, respectively. Those results suggest that local-scale emissions
                                      could be a major contributor to ambient BC concentrations under the relatively stable
                                      atmospheric conditions (e.g., WS < 2 m s−1 ) observed at the sampling site. At high wind
                                      speed conditions (>6 m s−1 ), relatively high BC concentration was observed in the south
                                      in spring and summer. The mean wind speed in fall was much lower than the rest of the
                                      season, and higher BC concentrations were observed in the north when the wind speed was
                                      >4 m s−1 . High north-northwest wind speeds (>6 m s−1 ) in winter were accompanied by
                                      higher mean mass loading of BC (>2 µg m−3 ) than the rest of the season. The above results
Atmosphere 2021, 12, x FOR PEER REVIEWsuggest that regional transport is an important source of BC throughout the observation12 of 20
                                      period. It was worth mentioning that in the south of all four seasons, higher mass loading of
                                      BC was observed at wind speeds > 4 m s−1 , especially in spring and summer (WS > 6 m s−1 ).
                                      However, one kilometer south of the observation site is close to the ocean, which means
                                  which
                                      thatmeans   that ship emissions
                                           ship emissions    were alsowere  also an important
                                                                        an important  source ofsource  of BC.
                                                                                                 BC. This     This
                                                                                                           result is result is con-
                                                                                                                      consistent   with
                                  sistent with  the fact that ship emissions were  also an important   contributor    to the
                                      the fact that ship emissions were also an important contributor to the BC of Qingdao   BC of in
                                  Qingdao   in previous
                                      previous            studies [73,74].
                                                studies [73,74].

                                Figure  8. Bivariate
                                    Figure           polarpolar
                                             8. Bivariate  plots plots
                                                                 for hourly    BC mass
                                                                        for hourly   BC concentration in the four
                                                                                         mass concentration        seasons:
                                                                                                              in the        (a) winter,
                                                                                                                     four seasons:  (a) (b)
                                                                                                                                        winter,
                                spring, (c) summer,
                                    (b) spring,       and (d)and
                                                (c) summer,   fall,(d)
                                                                    respectively.
                                                                       fall, respectively.

                                          Figure
                                      Figure       9 shows
                                              9 shows          the seasonal
                                                          the seasonal         distribution
                                                                        distribution    patternspatterns
                                                                                                   of theof  the BC
                                                                                                           CWT    CWT    BC concentrations
                                                                                                                     concentrations     ob-
                                served at this receptor site of rural Qingdao. These results were obtainedobtained
                                    observed    at this   receptor  site  of rural   Qingdao.     These   results were    from the from
                                                                                                                                    CWT the
                                    CWT to
                                analysis   analysis
                                             identifyto possible
                                                         identify possible
                                                                   geographicgeographic
                                                                                 origins. origins.
                                                                                            It shouldIt be
                                                                                                        should
                                                                                                           notedbethat
                                                                                                                   noted
                                                                                                                       thethat  the observed
                                                                                                                            observed    BC
                                dataBC   data were
                                      points  points    were filtered
                                                     filtered          out to minimize
                                                               out to minimize               the possible
                                                                                   the possible    influenceinfluence
                                                                                                              of some of   some trajectories
                                                                                                                        trajectories link-
                                                                                          −1 ). As shown in Figure 9a,b, the high CWT
                                ing linking  to lowspeed
                                     to low wind      wind (e.g.,
                                                              speedWS(e.g.,
                                                                         < 2WS
                                                                             m s
Atmosphere 2021, 12, 394                                                                                                                                                  12 of 19

                                   solid fuel (e.g., coal) combustion [32,33]. Interestingly, high CWT-BC concentration from
                                   the region of western Bohai Sea could be partly explained by considerable contribution
                                   by the ship emissions sector [73]. This is consistent with wind analysis for BC during the
                                   two seasons of winter and fall, which showed relatively high concentrations at high wind
                                   speed originated from northwestern sectors (Figure 8). Overall, these results may highlight
                                   some potential contributions of regional transport for those BC-rich emission regions to
                                   Qingdao. As shown in Figure 9b, the high CWT-BC concentrations in spring were mainly
Atmosphere 2021, 12, x FOR PEER REVIEW
                                   associated with two distinct regions, i.e., south-southwest (over northwestern Jiangsu    13 of 20
                                                                                                                                 and
                                   central-eastern Anhui Provinces) and south (over the Shanghai region). In summer (see
                                   Figure 9c), the high potential source region was observed linked to northeastern Jiangsu.
                                   These
                                  Yangtze results
                                            Rivercould
                                                   Deltaimply
                                                          regionthat the make
                                                                  could  long-range transportcontribution
                                                                               an important    from the Yangtze
                                                                                                           to BCRiver  Delta
                                                                                                                 in rural    region
                                                                                                                          Qingdao
                                   could  make   an  important
                                  in spring and summer.          contribution to BC  in rural Qingdao  in spring and  summer.

               (a) 60                                                 6                        (b) 60
                           Winter                                                                         Spring                           2.0
                                                                      5
                     50                                                                              50
                                                                       CWT
                                                                       CWT BC

                                                                                                                                                      CWT BC
                                                                                                                                                      CWT
                                                                                                                                           1.5
                                                                      4
                                                                           BC(ug

                                                                                                                                                           BC(ug
                     40                                                                              40
                                                                      3                                                                    1.0
                                                                              (μgmm

                                                                                                                                                              (μgmm
                                                                      2
                                                                                  -3‒3)

                                                                                                                                                                  -3 ‒3
                     30                                                                              30
                                                                                    )

                                                                                                                                                                    ) )
                                                                                                                                           0.5
                                                                      1

                     20                                                                              20
                            112     116      120     124    128                                            112     116   120   124   128
                     60                                                                              60
               (c)                                                    1.0                      (d)
                           Summer                                                                         Fall                             4

                     50                                               0.8                            50

                                                                                                                                            CWT
                                                                                                                                            CWT BC
                                                                                  CWT
                                                                                  CWTBC

                                                                                                                                           3
                                                                      0.6

                                                                                                                                                BC(ug
                                                                                      BC(ug

                     40                                                                              40
                                                                                                                                           2

                                                                                                                                                   (μgmm
                                                                                          (μg

                                                                      0.4
                                                                                            mm)‒3)

                                                                                                                                                       -3‒3)
                                                                                           -3

                     30                                                                              30                                    1             )
                                                                      0.2

                     20                                               0.0                            20
                            112     116      120     124    128                                            112     116   120   124   128

      Figure 9. Maps of the concentration weighted trajectories of BC in the four season: (a) winter, (b) spring, (c) summer, and
     Figure 9. Maps of the concentration weighted trajectories of BC in the four season: (a) winter, (b) spring, (c) summer, and
      (d) fall, respectively. The color bar on the right represents the CWT BC mass concentration in µg·m−3 .
     (d) fall, respectively. The color bar on the right represents the CWT BC mass concentration in μg·m−3.

                                       3.4. A Case Study of BC during the COVID-19 Pandemic
                                      3.4. A Case Study of BC during the COVID-19 Pandemic
                                             According to the timeline of the COVID-19 lockdown and prevention regulations for
                                            According to the timeline of the COVID-19 lockdown and prevention regulations for
                                       epidemic control issued by the Chinese government, three stages were divided in this study
                                      epidemic control issued by the Chinese government, three stages were divided in this
                                       to investigate the response of ambient BC to such a unique emission reduction scenario.
                                      study to investigate the response of ambient BC to such a unique emission reduction sce-
                                       A detailed description of the division rules for the three stages is shown in Table 1.
                                      nario. A detailed description of the division rules for the three stages is shown in Table 1.
                                             Figure 10a shows the average concentrations of BC (PM2.5 ) in pre-COVID, COVID-
                                       lockdown, and COVID-recovery stages, which were 4.21 (58.5) µg m−3 and 2.88 (54.5) µg m−3 ,
                                      Table 1. Division of stages   during the epidemic and relevant regulations.
                                       and 1.81 (28.9) µg m−3 , respectively. BC was reduced by 31.6% from the pre-COVID phase
                                       toStages      Dates
                                          the COVID-lockdown          phase. This is comparableRelevanttoRegulations
                                                                                                            the decrease rate (38%) due to the
                                       COVID lockdown observed     A novel   coronavirus
                                                                         in rural Hangzhou,was reported
                                                                                                while there on 31
                                                                                                                is December
                                                                                                                   a greater gap2019.byThe  first level to
                                                                                                                                         comparing
                                          Pre-    2019-12-31–
                                       some   urban  areas, e.g., emergency
                                                                   Hangzhou    response
                                                                                city of   for epidemic
                                                                                         China   (44%)    prevention
                                                                                                          [40], Suzhou  and  control
                                                                                                                           city of     by Shangdong
                                                                                                                                   China     (53%) [75],
                                        COVID      2020-1-23
                                       Somerville city of the United States of America     province (22–46%)
                                                                                                      on 23 January[76],2020.
                                                                                                                           and Delhi city of India
                                       (59–78%) [39]. This could   Strictsuggest
                                                                          epidemic  prevention
                                                                                  that   BC wasand      control measures
                                                                                                    effectively    reducedwere  by by   the Qingdao
                                                                                                                                   relevant      control
                                        COVID-     2020-1-24–    government,     and most   public  places,  villages,
                                       measures in rural Qingdao, yet with a lower decrease rate compared to urban       communities,     and govern-
                                                                                                                                                regions.
                                      lockdown
                                       Compared 2020-2-10
                                                    to BC, thement massagencies   closed onof
                                                                           concentration      24 PM
                                                                                                 Januarypresented
                                                                                                            2020. Qingdao,    part of
                                                                                                                          a much        the regulation
                                                                                                                                    lower     variation
                                                                                                      2.5
                                                                            enterprises, began   to resume    work
                                       that decreased by only 6.8% from the pre-COVID stage to the COVID-lockdown    on  10 February     2020.     stage,
                                                                The various enterprises, certain public places, and major government
                                          COVID-     2020-3-20–agencies were fully resumed work, and agricultural production will be
                                          recovery   2020-4-10carried out on 20 March 2020. Issued a policy that allows outsiders to en-
                                                                     ter and exit at any time with a health code on 10 April 2020.
                                      Notes: The above relevant regulations can be obtained from the Qingdao government website
Atmosphere 2021, 12, 394                                                                                                              13 of 19

                                   which is consistent with recent studies in urban environments [77–79]. This may suggest
                                   that rapid emission reduction in the transportation sector may not be efficient for control
                                   the ambient PM2.5 burden in rural areas. As shown in Figure 10b, changes in gaseous
                                   pollutants, including CO, SO2 , and NO2 , were also observed between pre-COVID and
                                   COVID-lockdown periods. NO2 presented the largest reduction rate (46.6%) among these
                                   gases, which could be explained by a rapid reduction in traffic emissions. However, the
                                   reduction rate (8.6%) of CO was approximately 5 times lower than NO2 , suggesting a
                                   significant contribution of the nontraffic source to ambient CO in rural Qingdao. The
                                   reduction rate of SO2 , mainly generated from coal combustion from industrial and power
                                   sectors in China [80], was 22.7%, reflecting a considerable influence of the COVID-lockdown
                                   on these sectors. Interestingly, BC was correlated well (R = 0.65−0.70) with these gaseous
                                   pollutants (CO, NO2 , and SO2 ), supporting the possible contribution of the sources for
                                   these gaseous pollutants on BC in rural Qingdao. As shown in Figure 10c, an enhanced
                                   BC/NO2 ratio is clearly observed during the COVID-lockdown period. However, the
                                   BC/CO and BC/PM2.5 ratios present opposite patterns compared to the BC/NO2 ratio.
                                   These results could indicate that reduction in traffic emission could not be an effective
                                   measure to reduce ambient BC in rural Qingdao. Furthermore, nontraffic sources, like
                                   residential solid-fuel burning, could be a significant source sector for BC at the area of the
                                   sampling site. In fact, our findings are consistent with some previous studies based on the
                                   BC emission inventories, highlighting that the most important source sector of BC was
                                   associated with the residential sector in China [32,80].

                                Table 1. Division of stages during the epidemic and relevant regulations.

        Stages                    Dates                                             Relevant Regulations
                                                     A novel coronavirus was reported on 31 December 2019. The first level emergency
      Pre-COVID            2019-12-31–2020-1-23         response for epidemic prevention and control by Shangdong province on
                                                                                    23 January 2020.
                                                          Strict epidemic prevention and control measures were by the Qingdao
                                                       government, and most public places, villages, communities, and government
  COVID-lockdown           2020-1-24–2020-2-10
                                                      agencies closed on 24 January 2020. Qingdao, part of the regulation enterprises,
                                                                       began to resume work on 10 February 2020.
                                                      The various enterprises, certain public places, and major government agencies
                                                      were fully resumed work, and agricultural production will be carried out on 20
   COVID-recovery          2020-3-20–2020-4-10
                                                      March 2020. Issued a policy that allows outsiders to enter and exit at any time
                                                                           with a health code on 10 April 2020.
      Notes: The above relevant regulations can be obtained from the Qingdao government website (http://www.qingdao.gov.cn/, accessed on
      18 March 2021).

                                        Figure 11 shows the very different pole diagrams of BC in the three stages. During
                                   the pre-COVID stage, the high BC concentrations were distributed over the northwest and
                                   northern sectors. In addition, high concentrations (>5 µg m−3 ) of BC were also observed at
                                   low wind speeds (
You can also read