Active-Sensing Epidermal Stretchable Bioelectronic Patch for Noninvasive, Conformal, and Wireless Tendon Monitoring
←
→
Page content transcription
If your browser does not render page correctly, please read the page content below
AAAS
Research
Volume 2021, Article ID 9783432, 12 pages
https://doi.org/10.34133/2021/9783432

Research Article
Active-Sensing Epidermal Stretchable Bioelectronic Patch for
Noninvasive, Conformal, and Wireless Tendon Monitoring

 Sheng Shu ,1,2 Jie An,1,2 Pengfei Chen,1,2 Di Liu,1,2 Ziming Wang,1,2 Chengyu Li,3
 Shuangzhe Zhang ,1,2 Yuan Liu,1,2 Jianzhe Luo ,1,2 Lulu Zu,1,2 Wei Tang ,1,2,3,4
 and Zhong Lin Wang 1,5,6
 1
 CAS Center for Excellence in Nanoscience, Beijing Key Laboratory of Micro-Nano Energy and Sensor, Beijing Institute of
 Nanoenergy and Nanosystems, Chinese Academy of Sciences, Beijing 100083, China
 2
 School of Nanoscience and Technology, University of Chinese Academy of Sciences, Beijing 100049, China
 3
 Center on Nanoenergy Research, School of Physical Science & Technology, Guangxi University, Nanning 530004, China
 4
 Institute of Applied Nanotechnology, Jiaxing, Zhejiang 314031, China
 5
 CUSPEA Institute of Technology, Wenzhou, Zhejiang 325024, China
 6
 School of Materials Science and Engineering, Georgia Institute of Technology, Atlanta, GA 30332-0245, USA

 Correspondence should be addressed to Wei Tang; tangwei@binn.cas.cn and Zhong Lin Wang; zhong.wang@mse.gatech.edu

 Received 5 March 2021; Accepted 22 May 2021; Published 21 June 2021

 Copyright © 2021 Sheng Shu et al. Exclusive Licensee Science and Technology Review Publishing House. Distributed under a
 Creative Commons Attribution License (CC BY 4.0).

 Sensors capable of monitoring dynamic mechanics of tendons throughout a body in real time could bring systematic information
 about a human body’s physical condition, which is beneficial for avoiding muscle injury, checking hereditary muscle atrophy, and
 so on. However, the development of such sensors has been hindered by the requirement of superior portability, high resolution,
 and superb conformability. Here, we present a wearable and stretchable bioelectronic patch for detecting tendon activities. It is
 made up of a piezoelectric material, systematically optimized from architectures and mechanics, and exhibits a high resolution
 of 5:8 × 10⁻⁵ N with a linearity parameter of R2 = 0:999. Additionally, a tendon real-time monitoring and healthcare system is
 established by integrating the patch with a micro controller unit (MCU), which is able to process collected data and deliver
 feedback for exercise evaluation. Specifically, through the patch on the ankle, we measured the maximum force on the Achilles
 tendon during jumping which is about 16312 N, which is much higher than that during normal walking (3208 N) and running
 (5909 N). This work not only provides a strategy for facile monitoring of the variation of the tendon throughout the body but
 also throws light on the profound comprehension of human activities.

1. Introduction sensors with high sensitivity and fast response time hin-
 dered its further development [3].
Musculoskeletal diseases are one of the main causes of dis- Noninvasive bioelectronic devices could be a promising
ability worldwide. In America, around 14 million people approach to solve the above problems. The inertial system
per year suffer from tendon, ligament, and joint injuries provides a low-cost, small-volume strategy for the tendon’s
[1, 2]. Current clinical practice for tendon monitoring, epidermal testing, but the inevitable drift distortion affects
such as magnetic resonance imaging (MRI) or ultrasound, its continuous monitoring [8]. The integrated sensor suit
could provide a snapshot of tendon density and inflamma- overcomes this properly, however, owing to the multijoint
tion but requires laboratory and high-cost equipment, linkages; it can only give a synergetic motion result rather
reducing the possibility of real-time personal care [3, 4]. than that from a specific moving part [9–14]. Nowadays,
Implantable sensors could be used to assess real-time the vibration property of the tendon has been detected and
monitoring, allowing personalization of a rehabilitation used as an evaluation parameter, which improves the
protocol [5–7]. But the inconvenience of surgery, the strict accuracy of epidermal monitoring, but rigid vibration gener-
requirements of biocompatible materials, and the need for ators and accelerometers greatly reduce the wearability and
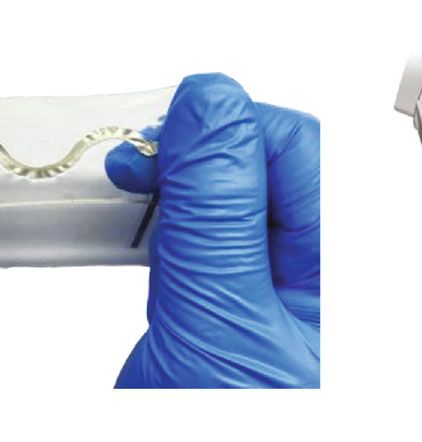
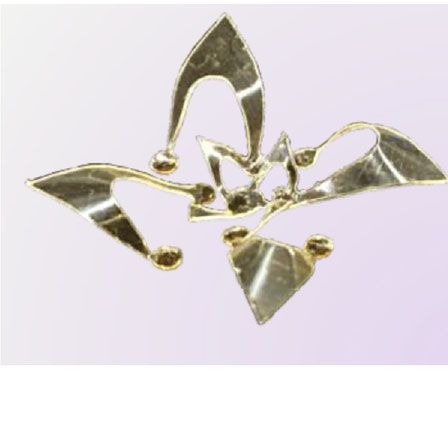
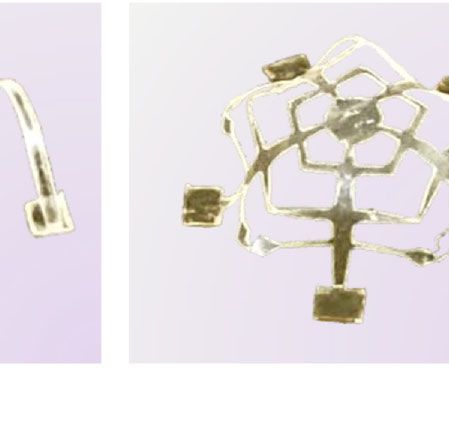
2 Research

comfort [15–17]. Epidemical wearable sensors offer a more of polyimide (PI, with a thickness of 110 μm) and printed
promising approach due to their light weight, low cost, copper, are employed to connect with the sensing unit,
flexibility, and stretchability [18, 19]. We can obtain per- ensuring the whole device’s flexibility and electrical contact.
sonal physical information by monitoring the heartbeat An optical image of the fabricated patch with a total length
[20, 21], pulse [22, 23], sweat [24, 25], and even respira- of 8 mm is shown with a tweezer, and its open-circuit voltage
tion [21, 26, 27] with the help of these sensors. But under 20% stretching is presented in Supplementary Fig. 1.
extracting physiological information from tendon activities Many researches proposed advanced folding technology
is still rarely reported. for constructing 3D mesostructures for polymer devices
 Based on mechanically induced polarization, piezo- [32, 36, 39, 40]. Figure 1(b) shows a variety of our sensing
electric devices have the characteristics of high sensitivity units with three-dimensional (3D) structures, including ori-
[13, 28] and self-powered ability [29, 30]. Besides, their gami (left), bending (middle left), winding (middle right),
inherent mechanical linear response makes them ideal and kirigami (right). These structures demonstrate the diver-
sources for continuous dynamic tendon monitoring [31]. It sification of our fabrication approach. It begins with the use
can be found in the literature that thin-film devices are of a laser-cutting process to define a two-dimensional (2D)
widely used in flexible electronics/optoelectronics, biomedi- precursor made up of PVDF. Then, the as-fabricated precur-
cal devices, energy storage, and conversion systems [32, 33]. sor is transferred onto a prestrained elastomer covered with a
Through structural design, such as origami [34], kirigami thin layer of designed adhesive barrier (polyethylene tere-
[35], bending [36], and winding [37], a thin piezoelectric film phthalate (PET) film with 50 μm in thickness), so that the
can be transformed to various two-dimensional (2D) or release of the prestrained substrate will transform the plane
three-dimensional (3D) structures [38], which can give the device into a well-defined resultant 3D architecture (Supple-
devices new features such as stretchability and also enable mentary Fig. 2). Additional details are presented in Methods
them to deliver an accurate output in the required applica- and in Supplementary Note 1. Such strategies establish
tion conditions. approaches to fabricate 3D sensing units with various geom-
 Here, we report an epidermal stretchable bioelectronic etries, which are determined by the 2D precursor and the
patch with a multiform-structured piezoelectric film. The arrangement and magnitude of the prestrained elastomer
patch can deform and stretch with the muscle and thus mon- substrate, as well as the profile of the adhesive barrier layer.
itor tendon activities in real time. By integrating it with a To avoid the adhesion during large stretch, the fractal struc-
micro controller unit (MCU), a tendon healthcare system is ture [40] is introduced and shown in Supplementary Fig. 3.
developed, which is able to collect and analyze motion data, With extremely fine curves and complex structures, it pro-
display out on a smart phone, and finally serve as a reminder vides a relatively low adhesion between the PVDF films and
for personal daily exercising. Moreover, the whole flexible the elastomer by virtue of the rough interface. After forming
and stretchable packaging makes the entire system extraordi- a 3D device, it can, therefore, smoothly switch between 2D
narily compliant. The rational use of commercial sports tape and 3D geometries as stretching and releasing of the elasto-
protects the device from the trouble of sweat and looseness as mer. Additionally, 2D-structured units could also exhibit
well. By attaching the patch on various muscles, we can pre- excellent stretchability and meanwhile remain an ultralow
cisely obtain tendon stretching motions around our body. thickness. As shown in Figure 1(c), various stretchable 2D
And the Achilles’s tendon (AT) is then systematically inves- sensing units are designed and manufactured, including zig-
tigated. Our research has created a new epidermal monitor- zag (left), rhomb (middle left), serpentine (middle right), and
ing system that could provide injury precaution and net (right). Detailed fabrication information for 2D shapes is
targeted treatments for tendons and generate personalized described in Methods and Supplementary Note 1.
advice for individual recovery and professional sports train- Afterwards, all above structures are modeled (Supple-
ing in the future. mentary Fig. 4-5), and finite element analysis (FEA) is
 conducted (Supplementary Note 2) to examine the devices’
2. Results output performance. The forces applied here are tensile
 stresses acting on the cross sections at both ends of these
2.1. Multiform Epidermal Musculotendinous Sensing Unit. structures. Figures 1(d)–1(f) illustrate FEA results of three
The musculotendinous sensing unit consists of functional representative structures. It reveals that these structures have
piezoelectric films, metal conductors, and dielectric mate- excellent linearity, suitable for force sensing. More simula-
rials. Facile and mass fabrication processes such as laser tions about 2D and 3D structures can be found in Supple-
cutting and printing are utilized. Figure 1(a) illustrates the mentary Fig. 6-7. The results indicate that the 3D structures
soft, stretchable musculotendinous bioelectronic patch have advantages in terms of tensile performance and voltage
applied all around the body. The exploded view shows the output (Supplementary Note 3), which is due to their rela-
patch’s stratified structure, consisting of a layer of piezoelec- tively large precursors and sufficient prestrain. Nevertheless,
tric polymer (polyvinylidene difluoride, PVDF, with a 2D structures have the superiority in thickness and attach-
thickness of 28 μm) and two layers of metal on the top able comfort as wearable devices attached on tendons.
(Cr/Ag, 10 nm/135 nm in thickness) and bottom (silver paste,
6 μm in thickness) surfaces, as well as two layers of superelas- 2.2. Design and Characteristics of the Epidermal Patch. Here,
tic adhesive tapes (polyacrylate two-sided rubber, 1 mm), three typical structures, with a total length of 50 mm, are
serving as the peripheral package. Electrical wires, made up designed and experimentally compared, including wave
Research 3

 Top electrode
 Cu
 PI

 Adhesive tape
 Top conductive layer

 Piezoelectric layer
 Bottom conductive
 layer
 Bottom electrode

 (a)

 Flower Wave Spring Flake

 (b)

 Zigzag Rhomb Serpentine Net

 (c)
 10 0.10
 8 Slope = 1.822 V/mN 120 Slope = 24.975 V/mN Slope = 0.017 V/mN
 0.08
 6 90 0.06
 VOC (V)

 VOC (V)

 VOC (V)

 4 60 0 0.04
 10
 0 –20
 2 0
 –10 30 –40 0.02
 –10
 –20
 0 0 0.00
 0 1 2 3 4 5 0 1 2 3 4 5 0 1 2 3 4 5
 F (mN) F (mN) F (mN)

 3D structure (wave) 3D fractal (three orders) 2D shape (serpentine)
 (d) (e) (f)

Figure 1: Multiform bioelectronic patch and 3D mesoscale piezoelectric frameworks. (a) Applications (left) and an exploded view of the
patch (right). (b) Optical images of representative 3D mesoscale networks made up of PVDF, including origami (left), bending (middle
left), winding (middle right), and kirigami (right). (c) Optical images of representative 2D structures by laser cutting, including zigzag
(left), rhomb (middle left), serpentine (middle right), and net (right). Scale bars, 2 mm. (d–f) FEA results of typical structures: 3D
structure (wave) (d), fractal structure (second order) (e), and 2D structure (serpentine) (f).
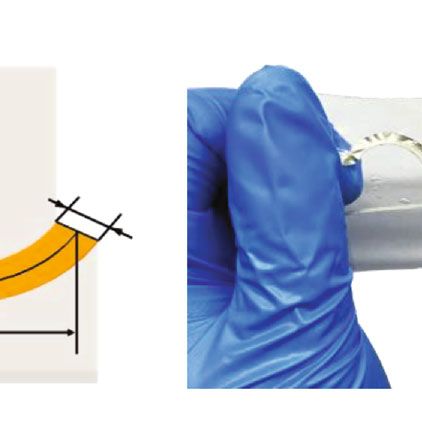
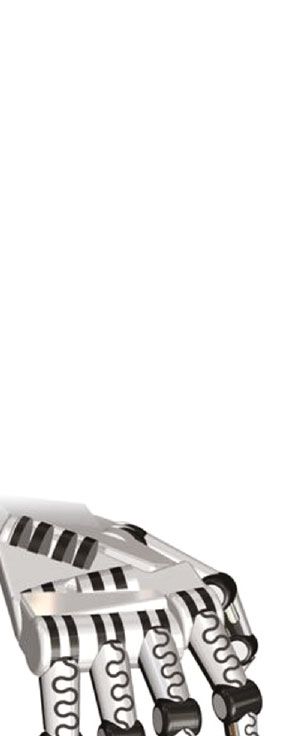
4 Research

 8 1.2 20

 6 0.9 16
 VOC (V)

 VOC (V)
 VOC (V)
 12
 4 0.6
 8
 2 0.3
 R2 = 0.997 R2 = 0.996 4 R2 = 0.999
 0 Slope = 1.547 0.0 Slope = 0.205 Slope = 5.302
 0
 0 1 2 3 4 5 0 1 2 3 4 5 6 0 1 2 3 4
 F (N) F (N) F (N)
 (a) (b) (c)

 t 0
 w
 L R0

 l
 Substrate

 (d) (e) (f)

 60 20
 50 80
 40 45 15
 60
VOC (V)

 VOC (V)

 VOC (V)

 VOC (V)
 30
 40 30 10
 20
 10 20 15 5
 0 0
 0 0
 0 1 2 3 4 0 1 2 3 4 0 1 2 3 4 0 1 2 3 4
 F (N) F (N) F (N) F (N)
 R0 = 3 mm R0 = 6 mm 0 = 120° 0 = 150° 1 arc 1 unit
 R0 = 4 mm R0 = 7 mm 0 = 180° 0 = 210° 2 arcs 2 units
 R0 = 5 mm 0 = 240° 0 = 270° 3 arcs 3 units

 (g) (h) (i) (j)

 200
 16 8 100
 0
 12 6 –100
 VOC (V)

 VOC (V)

 –200
 8 4
 (n)
 4 2
 3
 2
 0 1
 0
 0 15 30 45 60 0 0.05 0.1 0.2 0.5 1 5 0
 –1
 Time (s) Velocity (m/s)
 0.5 N 1N
 1.5 N 2N
 2.5 N 3N
 (k) (l) (m) (o)

Figure 2: Design and optimization of the soft epidermal bioelectronic patch as well as its characteristics. (a–c) Experimental results of open-
circuit voltage and linearity of different structures, including wave (a), spring (b), and serpentine (c). (d) Design diagram for the serpentine
structure. (e) An optical imaging of the patch being stretched. (f) A potential application of the structure in a robotic hand. (g, h) Devices’
output with various structure parameters: the radius (g) and the arc angle (h). (i, j) Devices’ output with various unit connections, in series
(i) and in parallel (j). (k) Diagram of open-circuit voltage under different forces. (l) The effect of different speeds on open-circuit voltage
under a force of 1 N. (m) An optical image of the patch under bending. (n, o) FEA diagrams of surface potential when the patch is
stretched and bent, respectively.

Research 5

(Figure 2(a)), spring (Figure 2(b)), and serpentine tion on per unit length in the longitudinal will decrease under
(Figure 2(c)), and corresponding optical photographs are the same tension, which is the main reason for the output’s
shown in the insets. They all have excellent linearity, but initial decrease. As the angle continues to increase, some spi-
the open-circuit voltage of the 2D structure (serpentine) is nodal appears. We speculate that the stretch-induced stress
significantly higher than that of the 3D (wave and spring) might be loaded on these spinodal, which increases the over-
under the same force, which is contrary to previous simula- all device’s output to some degree. This could also be verified
tions. This is because the above simulation model only con- by Supplementary Fig. 16. Besides, we also checked the influ-
tains a PVDF film, excluding the influence of the silicone ence of the PVDF thickness (28, 52, and 110 microns) (Sup-
substrate, while in practical experiments, the film will be plementary Fig. 18), and no obvious influence is obtained.
restricted by the substrate. It is verified by a stretch FEA with Subsequently, we studied the device performance with
a silicone substrate, shown in the Supplementary Fig. 8. various connections. As shown in Figures 2(i) and 2(j) and
Moreover, it also suggests that the silicone will introduce a Supplementary Fig. 19-22 (with θ0 = 240° , R0 = 6 mm, w =
lot of small deformations in the process of being stretched, 3 mm, t = 28 μm, and unit number of 1.5), arcs are con-
so the stress distribution on the 2D units is more uniform. nected in serials and parallel with a fixed overall length of
Therefore, 3D devices possess a thicker rubbery packaging, 50 mm. It is found that the larger the arcs’ number is, the
increasing the thickness of the whole sensor and reducing lower the output is, under the same tension. The explanation
the attachability. Meanwhile, it shows a relatively lower out- is similar to that of angle-induced influence, which is as the
put. Thus, the 2D serpentine structure is selected in our fol- number increases, the deformation on per unit length will
lowing experiments. decrease under the same tension, which is why the output
 Figure 2(d) shows a fundamental shape of our 2D sensing decreases. But it is notable to mention that more arcs mean
unit with overall consideration of stretchability, flexibility, better tensile property, and reasonable tensile property is
and compliance. It consists of two identical arc segments, required to balance the output performance and the feasibil-
defined by using arc angle (θ0), radius (R0), width (w), and ity to apply on the human body. Figure 2(j) plots the results
thickness (t). The total length of the patch is set at 50 mm. measured when the units are connected in parallel, which
An optical image of the patch being stretched is presented shows that as the number increases, the output decreases.
in Figure 2(e), and the designed maximum strain can reach It is attributing to that, under the same tension, more units
more than 50%. Figure 2(f) shows a potential application of in parallel will lead to lower deformation and thus lower out-
the structure in a robot hand. This fully flexible and stretch- put. Subsequently, the maximum strain of different radii and
able sensor will also have great prospects in the robotic field. angles is measured (Supplementary Fig. 23), indicating that
 Figures 2(g)–2(j) and Supplementary Fig. 9-16 present the maximum strain increases with the radius and angle.
devices’ output performance as a function of the increasing Therefore, sensors with a radius of 6 mm, arc angle of 180°,
stretching force, with various devices’ geometric parameters. width of 3 mm, and 3 half units in serial, which could ensure
Experiments are conducted by stretching the sensing units a maximum strain over 30%, is selected as the standard
serially between a linear motor and an ergometer (Supple- device for the following experiments.
mentary Fig. 17). Structures with different widths are firstly Figure 2(k) shows the open-circuit voltage of the device
examined (Supplementary Fig. 9-10, with R0 = 6 mm, θ0 = based on the above parameters, under diverse forces. It shows
240° , t = 28 μm, and unit number of 1.5). It can be seen that a good repeatability. Tiny mismatches might be due to the
the output changes as the width varies. In this regard, the forces delivered by the linear motor being uneven. Afterwards,
PVDF can be made narrow to ensure that the sensing com- we evaluate the influence of different speeds with a tension of
ponent is cost-effective without lowering the output perfor- 1 N (Figure 2(l)). Waveforms are exhibited in Supplementary
mance. The radius (R0 ) is another key device parameter. Fig. 24. The results show no significant difference, which is
When it increases, the proportion of the arc part will increase similar to FEA results under various frequencies (Supplemen-
accordingly, as shown in Supplementary Fig. 9, making the tary Fig. 25). An excellent stretch-rebound ability is exhibited
patch more stretchable. Figure 2(g) and Supplementary Fig. in Supplementary Fig. 26. After applying a constant strain of
11-12 (with θ0 = 240° , w = 3 mm, t = 28 μm, and unit number 20% for more than 20,000 cycles, the open-circuit voltage
of 1.5) plot the measuring results. It shows that as the radius value increases by 10% (Supplementary Fig. 27). Moreover,
increases, the open-circuit voltage decreases under the same when being applied to the human body, the patch will inevita-
tension, and the decreasing trend will gradually lessen. It bly be bent (Figure 2(m)), suggesting that the output might be
could be attributed to that as the radius increases, the average affected by bending. Supplementary Fig. 28 shows the output
deformation on per unit length in the longitudinal decreases, under a bending about 25% (more than 20°). It can be seen
and thus, the output voltage decreases accordingly. And this that, compared with the output under stretching, this output
is verified by the FEA results in Supplementary Fig. 13. More- (about 0.3 V) is almost negligible. Figures 2(n) and 2(o) and
over, the angle of the arc (θ0 ) is found to increase the size of Supplementary Movie S1 are the FEA diagram of surface
the PVDF and thus enhance the tensile properties. Results potential distribution when the device is stretched and bent,
displayed in Figure 2(h) and Supplementary Fig. 14-15 (with respectively, verifying the above analysis.
R0 = 6 mm, w = 3 mm, t = 28 μm, and unit number of 1.5)
show that the open-circuit voltage decreases from 120° to 2.3. Wearable Physical Property Sensing. The response time
240° as the angle increases and rises slightly after 240°. It of the sensing unit, critical for real-time monitoring, is mea-
could be explained that as the angle increases, the deforma- sured and shown in Figure 3(a) and its inset. The stretch-
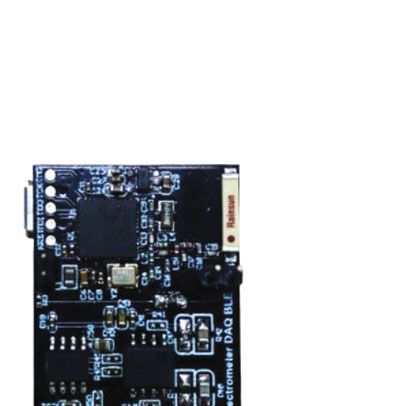
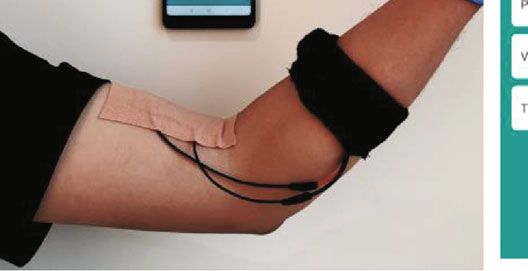
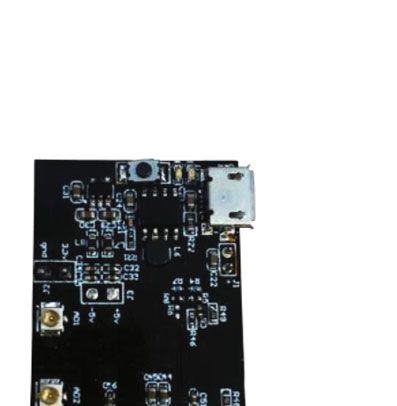
6 Research

 2 20
 20 3

 VOC (V)
 70
 2 1
 15
 15 2

 Force (N)
 2 mV

 VOC (mV)
 VOC (V)

 VOC (V)

 VOC (V)
 0
 1
 0 5 10 15 20 10 10
 Time (ms) 60
 0 1
 5 5 Slope = 8.605
 –1 R2 = 0.995
 0 0 0
 0 50 100 150 200 250 50
 0 2 4 6 8 10 0.0 0.5 1.0 1.5 2.0 2.5 0 4 8 12
 Time (ms) Time (s) F (N) Time (ms)

 Precious commercial stress sensor EX data Step line
 The patch Linear fit for EX data Noise signal

 (a) (b) (c) (d)

 50
 6
 VOC (V)

 VOC (V)
 25 3

 0 0
 0 2 4 6 8 10 0 2 4 6 8 10
 Time (s) Time (s)
 (e) (f)

 100 6

 VOC (V)
 VOC (V)

 50 3

 0 0
 0 5 10 15 20 0 2 4 6 8
 Time (s) Time (s)
 (g) (h)

 50
 VOC (V)

 25 120

 0
 VOC (V)

 0 10 20 30 80
 50
 VOC (V)

 25 40

 0
 0 10 20 30 40 0
 Time (s)
 (i) (j)

 Data processing
 & transmission 0.9
 APP
 Power 0.6
 F (N)

 management

 Data acquisition 0.3

 0.0

 0 4 6 8 10 12 14
 Time (s)

 (k) (l)

 Real-time
 Sensor MCU
 display
 Self-generated signal Signal acquisition Data processor Bluetooth to APP

 (m) (n)

Figure 3: Wearable system validation of the patch on the tendon. (a) The response time of the patch, and the patch is serially connected with a
commercial force sensor. (b) The synchronized diagram of the open-circuit voltage obtained by the patch and the corresponding stretching
force measured by the commercial sensor. (c) Linear relationship between measured voltage and force in biceps. (d) A sensor-resolved voltage
ladder diagram. (e–h) Open-circuit voltage of the patch sticking to the sternocleidomastoid (e), triceps brachii (f), erector spine (g), and
gastrocnemius (h). (i) Swing and pause diagrams during the measurement of the sternocleidomastoid muscle. (j) Statistics diagram
of signals obtained from various tendons all over the body. (k) An optical image of the MCU devised for portable purpose. (l) The
signals of the patch at different frequencies on biceps brachii acquired from the MCU. (m) The operating procedures of the system.
(n) Demonstration of applying the patch for recoding the arm’s bending; the inset is a screenshot from the APP on the mobile phone.
Research 7

release cycle indicates a response time lower than 18 ms, our sensing system can generate an intuitive feedback by grad-
which guarantees a timely feedback. A comparison between ing and counting the force of each movement in the APP, pro-
our patch and a commercial force sensor (resolution about viding useful advice for the profession sports actions or
1 mN) is performed and shown in Figure 3(b) and Supple- accurate medical rehabilitation.
mentary Fig. 29. The patch and the commercial sensor are
connected in serial and attached to the upper arm. Excellent 2.4. Noninvasive Achilles Tendon (AT) Monitoring System.
correspondence of the open-circuit voltage and the stretch- Ankle injury is one of the most common sports injuries,
ing force is observed. The linear fitting is shown in and it accounts for 40% of athletic injuries [42]. Achilles ten-
Figure 3(c), with R2 = 0:995 and slope = 8:605. In addition, don (AT) management is required to reduce such injuries.
we plot the loading curve with the time in Figure 3(d), which Based on the previous analysis, we use this epidermal bioelec-
shows that the voltage increased gradually as the applied tronic patch to monitor the AT activity in real time. The
force increases, with an increase of about 2 mV. Furthermore, patch is attached directly on the epidermis between the fibula
since the equipment noise is only 0.5 mV in our experiments, and the calcaneus and deforms as the tendon stretches and
the theoretical measurement resolution of the patch can be releases (Figure 4(a)). A MCU is connected and embedded
calculated out, which is 5:8 × 10⁻⁵ N. in a fabric strap, for data collecting, processing, and transmit-
 Figures 3(e)–3(h) and Supplementary Fig. 30 illustrate ting to a smartphone via Bluetooth.
various motion signals obtained from our patch via attaching Figure 4(b) plots out the measured signals of a basketball
to the sternocleidomastoid, triceps brachii, erector spine, gas- player during dribbling, running, and jump shooting. It is
trocnemius, deltoid, anterior knee ligament, quadriceps interesting to find that the player shows a movement fre-
femoris, and hamstring, respectively. Related actions are quency of about 0.69 and 1.59 Hz when dribbling and run-
illustrated beside each diagram, and the patch location is ning, respectively. And the voltage outputs are 35.4 and
marked via a yellow circle. It can be seen that, due to the thin- 65.2 V, respectively. Through the calculation in Supplemen-
ness, flexibility, and stretchability, the patch can be placed all tary Note 4, we can approximately get the forces applied on
over the human body and monitor the tendon’s activity in the AT, which are 3208 N and 5909 N. Notably, in a medical
real time. The signal’s peak value reflects the motion ampli- experiment that used physical methods to measure the force
tude, which can serve as an indicator to prevent damage on the AT, the peak forces during walking and running are
caused by excessive amplitude, and the signal’s frequency 3.9 and 7.7 times the body weight, respectively [43] (about
and shape reflect the motion velocity and whether the action 2869 N and 5660 N in our test), showing a good match.
is distorted, etc. It can be seen from Figure 3(e), the frequency Moreover, during jump shooting, the tendon’s loading time
of the head swing is about 0.6 Hz, and the maximum ampli- is about 0.495 s, with a recovering time of 0.31 s when land-
tude is about 41.3 V (4.8 N). When there are external swings ing. And it delivers the highest output of about 180 V, indi-
or stagnation actions (Figure 3(i)), the waveform varies cating that the greatest force on the AT is about 16312 N.
accordingly (Supplementary Movie S2). We also plot a statis- This result might give a reasonable explanation for the fact
tical diagram to give an overlook of the force amplitude of that during basketball games, ankle injuries mostly occur at
human daily motions, as shown in Figure 3(j). The erector the moment of landing (45% of all AT injuries) [44]. In
spinae muscles show an apparent high value, meaning a large Figure 4(c), we analyze a set of typical badminton actions,
force during the according motion, which might explain why including cross step and jump smash. An enlarged inset with
low back pain is the leading cause of global disability [1, 41]. decomposed actions is also presented. We can see that, dur-
 Figure 3(k) exhibits a MCU with data acquisition, process- ing the cross step, the player alters his supporting leg, result-
ing, and Bluetooth transmission modules. It is 3 cm × 4 cm in ing in two peaks, about 7089 and 10868 N. Subsequently, if
size, has a four-ply board craft, and utilizes the capacitive there comes a deep high service, a deep shot will result in a
measuring principle to match the high impedance of the pie- small voltage peak, while a clear ball will lead to a much larger
zoelectric polymer. The incorporation of above-mentioned peak. In addition, when smashing, a series of jumping peaks
devices constitutes an active force measurement system which will appear (Supplementary Movie S4). Accordingly, jump
could actively sense and record deformation states of tendons smash will deliver the highest load on the Achilles tendon,
and display it on the cellphone in real time. The signal of the which is about 15587 N in our test. As a comparison, in
patch obtained by our integrated circuit, during deformation Figure 4(d), we illustrate the voltage signals for a table tennis
with the biceps brachii, is plotted in Figure 3(l), showing a player’s AT. It can be found that, during swinging, and even
similar waveform with that measured by our experimental killing, the force loaded on the AT is about 2519 N, which is
equipment of Keithley 6517, and it is displayed in Supplemen- similar to the forces of fast walking (about 2719 N). It might
tary Movie S3. Figure 3(m) intuitively shows the operating be why the main injury reason for table tennis fans is not
procedures of the system. As vividly depicted in Figure 3(n), focused on the Achilles tendon [45]. We perform the real-
while a subject bends the arm, the deformation of the tendon time monitoring on the continuous sports playing and show
is simultaneously recorded by the patch, transmitted by the them in Supplementary Movie S5.
MCU, and visualized in the mobile application (APP). The Furthermore, we utilize the patch to make a statistic on
inserted image is an enlarged view of the APP, in which the the loading forces of AT during personal normal exercises,
top part exhibits real-time motions of the tendon, and six sta- including walking, running, and jumping. Subjects with var-
tistic parameters are listed below, including force peak, motion ious weights are selected, and the results are exhibited in
velocity, and repetitions. As shown in Supplementary Fig. 31, Figure 4(e) and Supplementary Movie S6. The strain on the
8 Research

 200
 150

 VOC (V)
 100
 50
 0
 –50
 –100
 0 5 10 15 20 25 30
 Time (s)
 (b)

 150 200
 100

 VOC (V)
 100

 VOC (V)
 50
 0
 0
 –50
 –100
 0 5 10 15 20 25 16 20 24
 Time (s) Time (s)
 (c)
 100 100
 50
 50

 VOC (V)

 VOC (V)
 0
 –50 0
 –100
 –150 –50
 (a) 0 5 10 15 20 15 18 21
 Time (s) Time (s)
 (d)
 30
 VOC (V)

 15
 120 0
 0 2 4 6 8
 Time (s)
 120
 VOC (V)

 90
 (f) VOC (V)
 60 80
 60
 VOC (V)

 30
 0
 30 0 1 2 3 4 5
 40
 Time (s)
 0 (g)
 Tester 1

 Tester 2

 Tester 3

 Tester 4

 Tester 5

 Tester 1

 Tester 2

 Tester 3

 Tester 4

 Tester 5
 100
 VOC (V)

 50
 0
 0 5 10 15 20
 Time (s)
 Walk (h) Preparation Landing

 Run
 Jumping Standing
 Jump
 (e) (i)

 100
 VOC (V)

 0
 200
 –100
 VOC (V)

 0 2 4 6 8
 Time (s)
 100
 (j)
 50
 0
 VOC (V)

 Tester 1

 0
 Dorsiflexion
 Tester 2

 –50
 Tester 3

 Non-flexion

 –100
 Tester 4

 0 2 4 6 8
 Plantarflexion
 Tester 5

 Time (s)
 Tester 6

 (k)
 50
 VOC (V)

 0
 –50
 –100
 0 2 4 6 8
 Time (s)
 (l) (m)

 Heel Foot dorsiflexion
 strike

 1.8
 Battery
 1.2
 F (N)

 MCU
 0.6
 Muscle tape
 0.0
 Midfoot Foot no flexion
 Sensor strike

 0 25 50 75 100
 Gait cycle (%)
 Normal gait
 Paretic gait
 (n) (o) (p)

Figure 4: Noninvasive Achilles tendon monitoring. (a) Schematic diagram of wearing the system at the Achilles tendon. (b) The open-circuit
voltage during basketball playing, including dribbling, running, and jump shooting. (c) The open-circuit voltage during badminton playing,
including cross step and jump smash. (d) The open-circuit voltage of the lateral movement and swing in table tennis. (e) The statistic diagram
of Achilles’ tendon activity for people walking, running, and jumping. (f–h) The waveform of walking (f), running (g), and jumping (h).
(i) The statistic diagram of open-circuit voltage under four different stages during jumping for different people, including preparation, jumping,
landing, and standing. (j–l) Optical photographs of jumping with various postures and the waveforms: plantarflexion (j), nonflexion (k), and
dorsiflexion (l). (m) A statistical analysis of the specific jumping actions: plantarflexion (yellow), nonflexion (green), and dorsiflexion (blue).
(n) An optical image of the patch’s fixation. (o) Using the bioelectronic system for gait analysis. (p) APP displays on a cellphone.
Research 9

AT increases in the order of walking, running, and jumping. As a serpentine patch with a precision of 5:8 × 10⁻⁵ N and
we can see in Figures 4(f)–4(h), the forces are approximately R2 = 0:999 is selected. Additionally, the patch is applied
2704 N, 5438 N, and 10875 N, respectively. Subsequently, we on various tendons all throughout the body, and it shows
study the jumping action in details. Figure 4(i) illustrates the excellent biological compatibility and universal applicability.
statistic output values of different people during jumping, which Especially in measurements with the Achilles tendon, our
is further divided into four stages: preparation, jumping, land- patch delivers reliable analysis results, corresponds with clin-
ing, and standing. As we can see, both preparation and standing ical researches, and can detect action distortion in sports. In
actions deliver lower loads, while both jumping and landing addition, we developed a tendon monitoring system, which
actions deliver lager force. It is worth noting that, tester 4 shows is capable of real-time monitoring of the tendon’s motions,
much lower force than the others do, which is actually due to proceeding collected data, and further offering feedback of
the wounds on his foot. In addition, we make a further analysis motion evaluation. With this sensing system, we accomplish
of the specific jumping actions, including plantarflexion, non- precise gait analysis and acquire classified statistics of daily
flexion, and dorsiflexion. Optical photographs and testing exercise. We anticipate that this bioelectronic patch shows
results are presented in Figures 4(j)–4(l). Clinically, an abnor- profound implications for the treatment and precautions of
mal vertical ground reaction force will cause an explosive supi- tendon diseases and opens a new door for targeted treat-
nation or inversion moment at the subtalar joint in a short time ments that are widely advocated. In the future, the combina-
[46], which could be confirmed by the waveform. The peak tion with machine learning and big data analysis can deliver
value of the plantarflex jump is relatively round and smooth visual evidence for in-depth analysis and understanding of
(Figure 4(j)), while the nonflex jump has a sharp peak (about the movement in our daily life.
1982 N, circled in blue) when landing (Figure 4(k)) due to a
shorter landing buffer distance (0.13 s), and the dorsiflex jump 4. Methods
generates an extra peak (about 3688 N, Figure 4(l), circled in
green). Further statistical analysis of different people jumping 4.1. Fabrication of 2D Piezoelectric Mesostructures. The fabri-
in Figure 4(m) can also prove the above phenomenon, in which cation of the stretchy 2D PVDF mesostructures began by
the two bars with the same color represent stages of jumping preparing a PVDF film (28 μm in thickness, MEAS) with
and landing. As we can see, during plantarflex jumping, the silk-screen printing (6 μm in thickness) on one side. Then,
force generated by jumping will be close to that by landing. If two sides of polyimide tape (PI, 25 μm in thickness, Goldfin-
jumping abnormally (nonflexion or dorsiflexion), the difference ger) coated with silicone gel (75 μm in thickness, Hon Shih
can be found obviously. Database of forces generated by AT Chiao) were tiled onto a Plexiglas substrate (2 mm in thick-
activities could provide important therapeutic support for AT ness, Creromem) of suitable size. Bubbles were removed.
recovery and posture correction. These results corroborate the After that, the side of the PVDF film with silver paste was
potential of the epidermal patch as a high-performance monitor spread on the polyimide tape for graphic processing, and
to realize real-time monitoring of AT. the laser-cutting machine (PLS6. 75) was adjusted to the
 Figure 4(n) shows an optical image of the fixation of our appropriate focal length (0.5 mm), power (20%), and cutting
epidermal sensing patch, where the muscle tape and elastic speed (70%). The prepared mask, which is slightly smaller
strip serve as the auxiliary (Supplementary Note 5). As than the determined pattern, is placed on the PVDF film,
shown in Figure 4(o), Supplementary Fig. 31, and Movie and Cr/Ag (10 nm/135 nm in thickness) is deposited on the
S7, we utilize the real-time sensing system to compare a nor- side covered with the mask by magnetron sputtering (Den-
mal person’s gait with that of the paretic patient (mimicking ton, Discovery 635). The mask plate is formed by laser cut-
by bandage wrapping, which restricts the movement of the ting with a single fluorinated polyethylene terephthalate
foot and thus leads to stiffness in the ankle, as shown in Sup- (PET) film (50 μm in thickness). Under the environment of
plementary Fig. 32) in one walking cycle. The yellow line rep- alcohol infiltration, the graphical PVDF was stripped by
resents the output signal of normal gait, and the blue stands mechanical dissection, which completed the preparation of
for the paretic one. It is found that due to the restriction on the 2D precursor. Adhesive VHB tape (polyacrylate two-
the ankle, the paretic gait lacks fine movements, and thus, sided rubber, 1 mm) is used to encapsulate and provide resil-
the signal exhibits only one peak, whereas that of the normal ience. 2D bioelectronic patches can be obtained by stacking
gait generates two peaks, corresponding to the contacting the VHB tape, bottom electrode, 2D precursor, top electrode,
point between the foot and the floor, shifting forward. Details and VHB tape in sequence. These are done on release paper
such as the peak force and the stepping velocity can be seen with an oily surface.
vividly in APP (Figure 4(p)). The wireless monitoring tech-
nology and accurate analysis capability enable the patch to 4.2. Fabrication of 3D Piezoelectric Mesostructures. Fabrica-
be applied in the medical field promisingly. tion and transfer of 2D precursors followed the procedures
 for the 2D piezoelectric mesostructures described above.
3. Conclusion After obtaining the 2D precursor, prepare the rebound
 medium VHB tape, cover the tape with an adhesive barrier
We present a stretchable bioelectronic patch that can nonin- layer (PET, 50 μm in thickness), cut the adhesive barrier layer
vasively monitor our bodies’ tendons in real time. Multiform on the tape into the desired shape through laser molding
structures of piezoelectric polymers are designed, manufac- technology, and remove the excess part. This process requires
tured, and compared. On the basis of structural optimization, a new definition of the focal length, cutting power, and
10 Research

cutting rate of the laser-cutting machine. A custom mechan- Authors’ Contributions
ical device is used to achieve an equally spaced stretching of
the tape. The 2D precursors are then transferred to the Sheng Shu, Jie An, and Pengfei Chen contributed equally to
stretched tape and connected by contact with a sticky surface. this work.
Finally, release the prestrain and transform the 2D precur-
sors into 3D mesostructures. Acknowledgments
 The research was supported by the National Key R&D
4.3. Fabrication of the Flexible Electrode. The electrodes of the Project from the Minister of Science and Technology
flexible bioelectric patch are prepared by using inkjet printing (2016YFA0202704); Youth Innovation Promotion Associ-
technology. Sputtering a copper film (50 nm) on a polyimide ation CAS, Beijing Municipal Science & Technology
(PI) substrate (100 μm in thickness), using an inkjet printer Commission (Z171100000317001, Z171100002017017, and
(Resist-Marking Printer Model SRP-3021) to print the Y3993113DF); and National Natural Science Foundation of
desired electrode structure on the copper film, dissolving China (Grant Nos. 51605033, 51432005, 5151101243, and
the copper without ink cover in ferric chloride solution, 51561145021).
and then using another ink to wash off the printed ink, the
resulting PI film is coated with graphical copper as the flexi-
ble electrode. Supplementary Materials
 Supplementary 1. Supplementary note 1: detailed fabrication
4.4. Electrical Output Measurement. The voltage signal of the procedures for a representative 3D piezoelectric microsys-
multiform epidermal musculotendinous bioelectronic patch tem. Supplementary note 2: introduction to finite element
was acquired by a voltage preamplifier (Keithley 6517 System analysis (FEA). Supplementary note 3: fundamental studies
Electrometer). The signal is generated by the patch in series of the open-circuit voltage. Supplementary note 4: calcula-
between the linear motor (Linmot, E1100) and the commer- tion of Achilles tendon (AT) force. Supplementary note 5:
cial stress sensor (Adbal, SH-5/10); signals from commercial the auxiliary in in vitro physical property sensing. Table S1:
sensors are directly read out after being processed internally. comparison with existing wearable strain sensors. Figure S1:
The whole measurement process of the system is fixed on the illustration of serpentine structure and its voltage output.
optical platform. The high-precision commercial sensor (a) Optical imaging of our sensing unit on index figure. (b)
(Oruda, AT8301) used in series with the patch at biceps bra- Open-circuit voltage under 20% stretching of the unit in
chii determines the force by its own analog signal output S1a. Figure S2: fabrication scheme for 3D piezoelectric
using the built-in program. The MCU is the core of the whole mesostructure. Figure S3: 3D fractal designs. (a–c) Optical
wireless technology. It collects the charge quantity through imaging of various fractal manufactures, including first- (a)
the front circuit and converts it into voltage. After the and second-order (b) fractal curves and a (c) Hilbert geome-
digital-to-analog converter, the analog voltage amount is try. Scale bar, 2 mm. Figure S4: 3D precursor of the structures
converted into a digital signal, which is then analyzed and shown in Figure 1. (a) Flower; (b) wave; (c) spring; (d) flake;
processed by the low power Bluetooth module (TEXAS, (e–g) 3D precursor of the fractal structures, first order (e),
CC2640R2F). These processes include calibration of voltage, second orders (f), and Hilbert geometry (g). Figure S5: FEA
zero return of initial value, and analysis of the amount of predictions of 3D structures. (a–c) FEA prediction of the
motion. Finally, the Bluetooth module transmits the data to buckled shape for the structures in Figure 1(b), including
the APP for real-time display. Considering the influence of flower (a), wave (b), spring (c), and flake (d). (g–i) FEA pre-
age, height, body fat rate, etc., the correction coefficient k is diction of the buckled shape for the fractal structures, first
introduced in the APP, which is a constant determined by order (e), second orders (f), and Hilbert geometry (g). Figure
the experiment to reduce the error. S6: FEA results. (a–c) FEA of the 3D structures in Figure 1(b),
 including flower (a), spring (b), and flake (c). (d, e) FEA of
 the fractal structures with first order (d) and Hilbert geome-
Data Availability try (e). (f) Comparison of three types of fractal structure.
 Figure S7: FEA of the 2D structures in Figure 1(c). (a) Zigzag;
All data needed to evaluate the conclusions in the paper are
 (b) rhomb; (c) net. Figure S8: FEA of the serpentine structure
present in the paper and/or the Supplementary Information.
 with silicone rubber substrate. (a) Strain distribution; (b) sur-
Additional data related to this paper may be requested from
 face charge distribution; (c) FEA results; (d) experiment
the authors upon reasonable request.
 results. Figure S9: illustration of different width structural
 design. Figure S10: linear output graph with different width
Conflicts of Interest structure. Figure S11: illustration of different radius struc-
 tural design in Figure 2(g). Figure S12: linear output graph
All authors have declared that (i) no support, financial or with different radius in Figure 2(g). Figure S13: FEA results
otherwise, has been received from any organization that of different angles in Figure 2(g). (a–e) Surface potential
may have an interest in the submitted work and (ii) there is distribution of various radii, including 3 mm (a), 4 mm (b),
no other commercial or associative interest that represents 5 mm (c), 6 mm (d), and 7 mm (e). (f) Comparison of surface
a conflict of interest in connection with the work submitted. potential changes with load at different radii. Figure S14:
Research 11

illustration of different angle structural design in Figure 2(h). References
Figure S15: linear output graph with different angles in
Figure 2(h). Figure S16: FEA results of different angles in [1] E. Sebbag, R. Felten, F. Sagez, J. Sibilia, H. Devilliers, and
Figure 2(h). (a–e) Surface potential distribution of various L. Arnaud, “The world-wide burden of musculoskeletal dis-
angles, including 150° (a), 180° (b), 210° (c), 240° (d), and eases: a systematic analysis of the World Health Organization
 Burden of Diseases Database,” Annals of the Rheumatic Dis-
270° (e). (f) Comparison of surface potential changes with
 eases, vol. 78, no. 6, pp. 844–848, 2019.
load at different angles. Figure S17: quantitative mechanized
measurement method of the patch. Figure S18: variation of [2] G. Yang, B. B. Rothrauff, and R. S. Tuan, “Tendon and liga-
 ment regeneration and repair: clinical relevance and develop-
open-circuit voltage with load under different thickness. (a–
 mental paradigm,” Birth Defects Research Part C, Embryo
c) Linear output graph with different thickness structure, Today, vol. 99, no. 3, pp. 203–222, 2013.
including 28 μm (a), 52 μm (b), and 110 μm (c). (d) Compar-
 [3] C. M. Boutry, Y. Kaizawa, B. C. Schroeder et al., “A stretchable
ison of open-circuit voltage changes with load at different and biodegradable strain and pressure sensor for orthopaedic
thickness. Figure S19: illustration of different numbers of application,” Nature Electronics, vol. 1, no. 5, pp. 314–321,
the arc structural design in Figure 2(i). Figure S20: linear out- 2018.
put graph with different numbers of the arc structure in [4] S. Bogaerts, H. Desmet, P. Slagmolen, and K. Peers, “Strain
Figure 2(i). Figure S21: illustration of different numbers of mapping in the Achilles tendon - a systematic review,” Journal
the units’ structural design in Figure 2(j). Figure S22: linear of Biomechanics, vol. 49, no. 9, pp. 1411–1419, 2016.
output graph with different numbers of the unit in [5] B. C. Fleming and B. D. Beynnon, “In vivo measurement of
Figure 2(j). Figure S23: relationship of radius and angle vs. ligament/tendon strains and forces: a review,” Annals of Bio-
strain to illustrate the stretchability of the structures in medical Engineering, vol. 32, no. 3, pp. 318–328, 2004.
Figure 2. Figure S24: comparison of open-circuit voltages at [6] P. V. Komi, “Relevance of in vivo force measurements to
various speeds. Figure S25: simulation diagram of frequency human biomechanics,” Journal of Biomechanics, vol. 23,
response characteristics under 1 N force. (a) Schematic dia- pp. 23–34, 1990.
gram of force action. (b) Low frequency output under 1 N [7] S. F. Pichorim and P. J. Abatti, “Biotelemetric passive sensor
force. (c) Voltage vs. frequency graph. Figure S26: compari- injected within tendon for strain and elasticity measurement,”
son chart of stretch and resilience performance. (a) Sche- IEEE Transactions on Biomedical Engineering, vol. 53, no. 5,
matic of stretching. (b) Comparison of potential difference pp. 921–925, 2006.
between stretch and rebound under various forces. Figure [8] S. Patel, H. Park, P. Bonato, L. Chan, and M. Rodgers, “A
S27: cyclic measurement of the device under 20% of the ten- review of wearable sensors and systems with application in
sile. Figure S28: comparison of open-circuit voltage between rehabilitation,” Journal of Neuroengineering and Rehabilita-
stretch and bending. (a) Schematic of bending. (b) Output tion, vol. 9, pp. 1–17, 2012.
comparison under 20% tension and compression; the red [9] Y. Ding, M. Kim, S. Kuindersma, and C. J. Walsh, “Human-in-
enlarged image shows the open-circuit voltage of the patch the-loop optimization of hip assistance with a soft exosuit dur-
at 20% compression. Figure S29: diagram of the patch and ing walking,” Science Robotics, vol. 3, no. 15, article eaar5438,
commercial sensors in series. (a) Illustration of the connec- 2018.
tion between the patch and commercial sensors. (b) The [10] K. Dong, X. Peng, and Z. L. Wang, “Fiber/fabric-based piezo-
patch and commercial sensors are fixed on the biceps for tan- electric and triboelectric nanogenerators for flexible/stretch-
dem measurement. Figure S30: open-circuit voltage of the able and wearable electronics and artificial intelligence,”
patch sticking to the deltoid (a), quadriceps femoris (b), ante- Advanced Materials, vol. 32, article e1902549, 2020.
rior knee ligament (c), and hamstrings (d). Figure S31: APP [11] T. Luczak, R. F. Burch V, B. K. Smith et al., “Closing the wear-
interface that can provide feedback information. Figure S32: able gap—part V: development of a pressure-sensitive sock
 utilizing soft sensors,” Sensors, vol. 20, p. 208, 2020.
simulation of paretic gait. (a) Diagram of gait simulation
method. (b, c) APP screenshot of paretic gait monitoring. [12] Y. Mengüç, Y.-L. Park, E. Martinez-Villalpando et al.,
 “Soft wearable motion sensing suit for lower limb biome-
Supplementary 2. Movie S1: FEA of surface stress and poten- chanics measurements,” in 2013 IEEE International Confer-
tial distribution. ence on Robotics and Automation, pp. 5309–5316, Karlsruhe,
 Germany, 2013.
Supplementary 3. Movie S2: sternocleidomastoid muscle test
 [13] Z. Wang, J. An, J. Nie et al., “A self-powered angle sensor at
by second swing head.
 nanoradian-resolution for robotic arms and personalized
Supplementary 4. Movie S3: bending the arm under different medicare,” Advanced Materials, vol. 32, article 2001466, 2020.
frequency. [14] Z. Zhou, K. Chen, X. Li et al., “Sign-to-speech translation using
 machine-learning-assisted stretchable sensor arrays,” Nature
Supplementary 5. Movie S4: different striking back signals for
 Electronics, vol. 3, no. 9, pp. 571–578, 2020.
deep high service.
 [15] N. Bolus, H. K. Jeong, B. M. Blaho, M. Safaei, A. J. Young, and
Supplementary 6. Movie S5: continuous motion measure- O. T. Inan, “Fit to burst: toward noninvasive estimation of
ment of various sports. Achilles tendon load using burst vibrations,” IEEE Transactions
 on Biomedical Engineering, vol. 68, no. 2, pp. 470–481, 2021.
Supplementary 7. Movie S6: Achilles’ tendon tests of daily
activities. [16] J. A. Martin, S. C. E. Brandon, E. M. Keuler et al., “Gauging
 force by tapping tendons,” Nature Communications, vol. 9,
Supplementary 8. Movie S7: gait analysis. no. 1, p. 1592, 2018.
12 Research

[17] S. E. Harper, R. A. Roembke, J. D. Zunker, D. G. Thelen, and [35] S. Babaee, S. Pajovic, A. Rafsanjani, Y. Shi, K. Bertoldi, and
 P. G. Adamczyk, “Wearable tendon kinetics,” Sensors, G. Traverso, “Bioinspired kirigami metasurfaces as assistive
 vol. 20, no. 17, article 4805, 2020. shoe grips,” Nature Biomedical Engineering, vol. 4, no. 8,
[18] S. Khan, S. Ali, and A. Bermak, “Recent developments in print- pp. 778–786, 2020.
 ing flexible and wearable sensing electronics for healthcare [36] Y. Sun, W. M. Choi, H. Jiang, Y. Y. Huang, and J. A. Rogers,
 applications,” Sensors, vol. 19, article 1230, 2019. “Controlled buckling of semiconductor nanoribbons for
[19] J. Kim, A. S. Campbell, B. E.-F. de Ávila, and J. Wang, “Wear- stretchable electronics,” Nature Nanotechnology, vol. 1, no. 3,
 able biosensors for healthcare monitoring,” Nature Biotechnol- pp. 201–207, 2006.
 ogy, vol. 37, no. 4, pp. 389–406, 2019. [37] Y. Liu, X. Wang, Y. Xu et al., “Harnessing the interface
[20] K. Sim, F. Ershad, Y. Zhang et al., “An epicardial bioelectronic mechanics of hard films and soft substrates for 3D assembly
 patch made from soft rubbery materials and capable of spatio- by controlled buckling,” Proceedings of the National Academy
 temporal mapping of electrophysiological activity,” Nature of Sciences of the United States of America, vol. 116, no. 31,
 Electronics, vol. 3, no. 12, pp. 775–784, 2020. pp. 15368–15377, 2019.
[21] H. U. Chung, A. Y. Rwei, A. Hourlier-Fargette et al., “Skin- [38] T. R. Ray, J. Choi, A. J. Bandodkar et al., “Bio-integrated wear-
 interfaced biosensors for advanced wireless physiological able systems: a comprehensive review,” Chemical Reviews,
 monitoring in neonatal and pediatric intensive-care units,” vol. 119, no. 8, pp. 5461–5533, 2019.
 Nature Medicine, vol. 26, no. 3, pp. 418–429, 2020. [39] H. Zhao, K. Li, M. Han et al., “Buckling and twisting of
[22] C. M. Boutry, L. Beker, Y. Kaizawa et al., “Biodegradable and advanced materials into morphable 3D mesostructures,” Pro-
 flexible arterial-pulse sensor for the wireless monitoring of ceedings of the National Academy of Sciences of the United
 blood flow,” Nature Biomedical Engineering, vol. 3, no. 1, States of America, vol. 116, no. 27, pp. 13239–13248, 2019.
 pp. 47–57, 2019. [40] J. A. Fan, W. H. Yeo, Y. Su et al., “Fractal design concepts for
[23] C. Wang, X. Li, H. Hu et al., “Monitoring of the central blood stretchable electronics,” Nature Communications, vol. 5,
 pressure waveform via a conformal ultrasonic device,” Nature no. 1, p. 3266, 2014.
 Biomedical Engineering, vol. 2, no. 9, pp. 687–695, 2018. [41] J. Hartvigsen, M. J. Hancock, A. Kongsted et al., “What low
[24] Y. Yang, Y. Song, X. Bo et al., “A laser-engraved wearable sen- back pain is and why we need to pay attention,” The Lancet,
 sor for sensitive detection of uric acid and tyrosine in sweat,” vol. 391, no. 10137, pp. 2356–2367, 2018.
 Nature Biotechnology, vol. 38, no. 2, pp. 217–224, 2020.
 [42] C. V. Andreoli, B. C. Chiaramonti, E. Biruel, A. . C. Pochini,
[25] Y. Yu, J. Nassar, C. Xu et al., “Biofuel-powered soft electronic B. Ejnisman, and M. Cohen, “Epidemiology of sports injuries
 skin with multiplexed and wireless sensing for human- in basketball: integrative systematic review,” BMJ Open Sport
 machine interfaces,” Science Robotics, vol. 5, no. 41, article & Exercise Medicine, vol. 4, no. 1, article e000468, 2018.
 eaaz7946, 2020.
 [43] V. L. Giddings, G. S. Beaupre, R. T. Whalen, and D. R. Carter,
[26] M. Mercuri, I. R. Lorato, Y. H. Liu, F. Wieringa, C. V. Hoof, “Calcaneal loading during walking and running,” Medicine &
 and T. Torfs, “Vital-sign monitoring and spatial tracking of Science in Sports & Exercise, vol. 32, no. 3, pp. 627–634, 2000.
 multiple people using a contactless radar-based sensor,”
 Nature Electronics, vol. 2, no. 6, pp. 252–262, 2019. [44] G. D. McKay, P. Goldie, W. R. Payne, and B. Oakes, “Ankle
 injuries in basketball: injury rate and risk factors,” British Jour-
[27] S. Han, J. Kim, S. M. Won et al., “Battery-free, wireless sensors nal of Sports Medicine, vol. 35, no. 2, pp. 103–108, 2001.
 for full-body pressure and temperature mapping,” Science
 Translational Medicine, vol. 10, article eaan4950, 2018. [45] L. Ebadi and M. Günay, “Analysing of the types of injuries
 observed in table tennis players according to the some vari-
[28] Y. H. Jung, S. K. Hong, H. S. Wang et al., “Flexible piezoelectric
 ables,” IOSR Journal of Sports and Physical Education (IOSR-
 acoustic sensors and machine learning for speech processing,”
 JSPE), vol. 5, no. 4, pp. 21–26, 2018.
 Advanced Materials, vol. 32, article 1904020, 2019.
 [46] D. T. P. Fong, Y.-Y. Chan, K.-M. Mok, P. S. H. Yung, and
[29] W. Zhong Lin, “Piezoelectric nanogenerators based on zinc
 K.-M. Chan, “Understanding acute ankle ligamentous sprain
 oxide nanowire arrays,” Science, vol. 312, no. 5771, pp. 242–
 injury in sports,” BMC Sports Science, Medicine and Rehabi-
 246, 2006.
 litationSports Medicine, Arthroscopy, Rehabilitation, Therapy
[30] Z. L. Wang, “On Maxwell's displacement current for energy & Technology: SMARTT, vol. 1, 2009.
 and sensors: the origin of nanogenerators,” Materials Today,
 vol. 20, no. 2, pp. 74–82, 2017.
[31] C. R. Bowen, H. A. Kim, P. M. Weaver, and S. Dunn, “Piezo-
 electric and ferroelectric materials and structures for energy
 harvesting applications,” Energy & Environmental Science,
 vol. 7, no. 1, pp. 25–44, 2014.
[32] M. Han, H. Wang, Y. Yang et al., “Three-dimensional piezo-
 electric polymer microsystems for vibrational energy harvest-
 ing, robotic interfaces and biomedical implants,” Nature
 Electronics, vol. 2, no. 1, pp. 26–35, 2019.
[33] E. Song, J. Li, S. M. Won, W. Bai, and J. A. Rogers, “Materials
 for flexible bioelectronic systems as chronic neural interfaces,”
 Nature Materials, vol. 19, no. 6, pp. 590–603, 2020.
[34] S.-M. Baek, S. Yim, S.-H. Chae, D.-Y. Lee, and K.-J. Cho,
 “Ladybird beetle–inspired compliant origami,” Science Robot-
 ics, vol. 5, no. 41, article eaaz6262, 2020.
You can also read