Long Island-Kokomohua Marine Reserve, Queen Charlotte Sound: update of biological monitoring, 1992 2014 - Kokomohua Marine Reserve monitoring report
←
→
Page content transcription
If your browser does not render page correctly, please read the page content below
Davidson Environmental Limited

        Long Island-Kokomohua
        Marine Reserve, Queen
        Charlotte Sound: update
        of biological monitoring,
        1992 – 2014

         Research, survey and monitoring report number 771

A report prepared for:

Department of Conservation
Private Bag 5
Nelson

October, 2014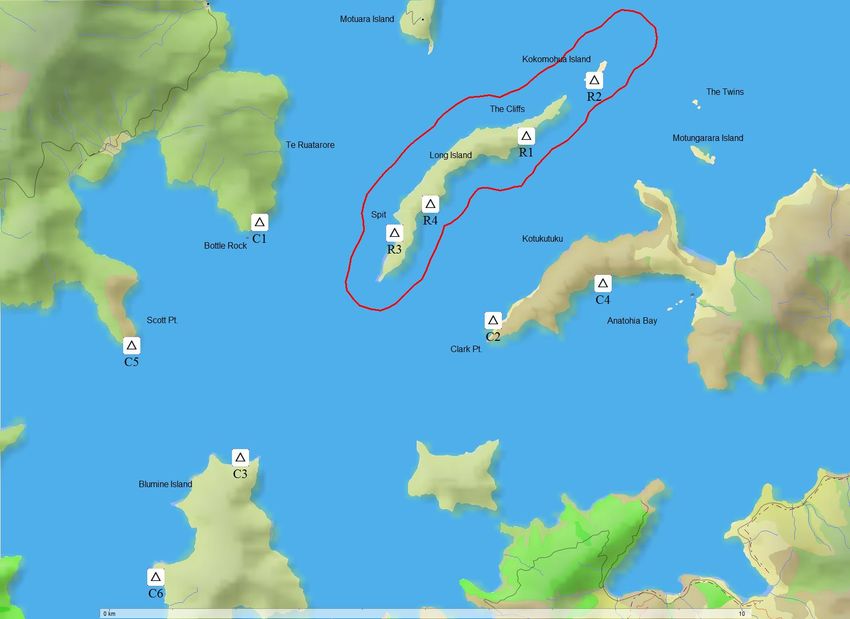
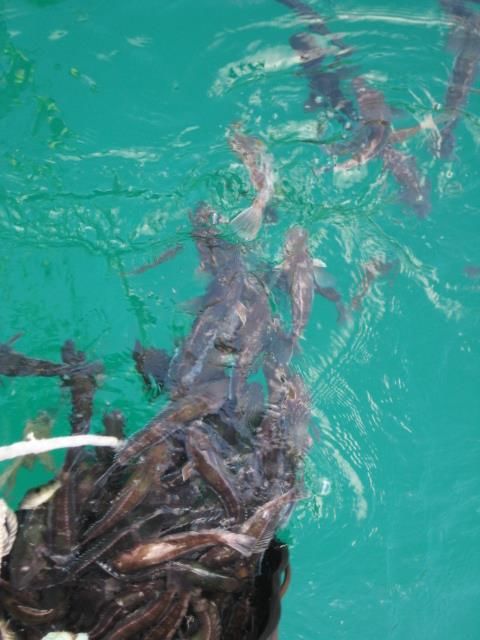
Blue cod release after CMR session
Report authors:
Robert J. Davidson1, Laura A. Richards1, Willie Abel2, Mike Aviss2
1 Davidson Environmental Ltd.
2 Department of Conservation, Picton
Divers 1992-2014:
Rob Davidson, Willie Abel, Laura Richards, Mike Aviss, Russell Cole, Derek Brown, Alix LaFer-
riere, Gwendoline Bodin, Angali Pande, Simon Bayly, Laura Allum, Wayne Beggs.
Catch, measure and release:
Bill Cash, Wayne Wytenburg, Roy Grose, Shane Freemantle, Mike Aviss, Gary Twose, Bart
Merthens, Trevor Shanks, Peter Sutton, Johnny Joseph, Aubrey Tai, Liam Falconer, Ruby Collier,
Frank Rosie.
Bibliographic reference:
Davidson, R.J.; Richards, L.A.; Abel, W.; Avis M. 2014. Long Island-Kokomohua Marine
Reserve, Queen Charlotte Sound: update of bio-logical monitoring, 1992 – 2014.
Prepared by Davidson Environmental Limited for Department of Conservation, Nelson.
Survey and Monitoring Report No. 796.
Copyright:
The contents of this report are copyright and may not be reproduced in any form without the
permission of the client.
Prepared by:
Davidson Environmental Limited
P. O. Box 958, Nelson, 7040
New Zealand
Phone 03 5452600, Mobile 027 4453 352, e-mail: davidson@xtra.co.nz
Contents
SUMMARY ........................................................................................................................... 3

1.0      INTRODUCTION ...................................................................................................... 4

2.0      STUDY AREA ........................................................................................................... 6

3.0      SAMPLING SUMMARY SINCE 2009 REPORT ..................................................... 8

4.0      METHODS ............................................................................................................... 17

   4.1       Catch, measure and release ................................................................................... 17

   4.2       Underwater visual fish surveys ............................................................................. 18

   4.3       Spiny lobster density, sex and size ........................................................................ 19

   4.4       Black-foot paua density and size .......................................................................... 20

   4.5       Kina density and size ............................................................................................ 21

   4.6       Cats eye density .................................................................................................... 21

   4.7       Statistical analysis ................................................................................................. 21

5.0      RESULTS ................................................................................................................. 23

   5.1       Fish catch, measure and release (CMR) ............................................................... 23

       5.1.1       Size structure of blue cod (CMR) .................................................................. 24

       5.1.2       Blue cod size composition (CMR) ................................................................ 25

       5.2.3       Blue cod size-frequency (CMR) .................................................................... 26

       5.1.3       Blue cod catch per unit effort (CMR) ............................................................ 27

   5.2       Underwater visual counts (UVC) ......................................................................... 41

       5.2.1       Presence-absence and relative abundance (UVC) ......................................... 41

       5.2.2       Fish density from rubble substrata (UVC) .................................................... 41

       5.2.3       Fish density from macroalgae (UVC) ........................................................... 44

       5.2.4       Fish size from macroalgae (UVC) ................................................................. 44

   5.3       Lobster density, size, and sex ................................................................................ 49

   5.4       Paua density and size ............................................................................................ 54

Davidson Environmental Ltd.                                                                                            Page 1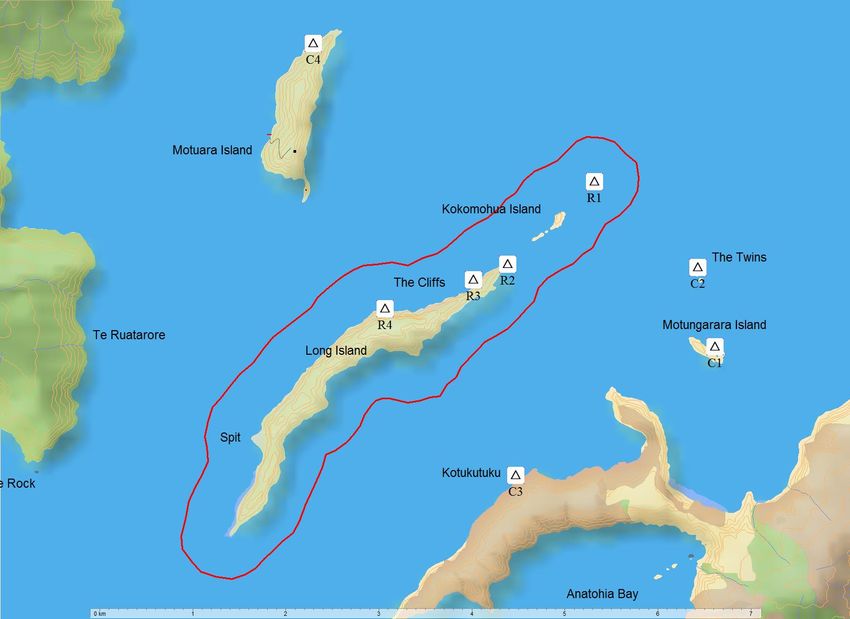
5.6      Cats-eye snail density ........................................................................................... 59

6.0      DISCUSSION ........................................................................................................... 63

   6.1      Blue cod ................................................................................................................ 63

   6.2      Other fish .............................................................................................................. 66

   6.3      Spiny lobsters ........................................................................................................ 66

   6.4      Black-foot paua ..................................................................................................... 68

   6.5      Kina ....................................................................................................................... 69

   6.6      Cats-eye snail ........................................................................................................ 70

   6.7      Behavioural changes ............................................................................................. 70

7.0      FUTURE BIOLOGICAL MONITORING ............................................................... 71

ACKNOWLEDGEMENTS ................................................................................................ 75

Davidson Environmental Ltd.                                                                                                Page 2
Specialists in research, survey and monitoring

SUMMARY

1.       This report presents data collected from Long Island-Kokomohua Marine Reserve and
         adjacent control sites over a period of 22 years (1992 to 2014).
2.       Data updated since the previous report includes: (i) reef fish size and density; (ii) lob-
         ster size sex and density; (iii) black foot paua size and density; (iv) kina size and den-
         sity; and (v) cats-eye density.
3.       In 2014, legal sized blue cod were 3 times more abundant in the reserve than at con-
         trol sites. Unexpectedly, the mean size of blue cod within the reserve had decreased
         since the previous survey. The reason was primarily due to an increase in the number
         of small blue cod in the catch. At control sites, the mean size of blue cod changed
         over the duration of the study and was often linked to changes in fisheries legislation.
         The drop in the bag limit for cod appears to have had a positive impact on the mean
         size of blue cod at control sites.
4.       For other edible reef fish species, an increase in the size of blue moki was the only
         documented change attributable to reservation.
5.       The density of lobsters inside the reserve increased dramatically from 1.39 individuals
         per 100 m2 in 1992 to 13.5 individuals per 100 m2 in 2014. In 2014, lobsters were
         11.5 times more abundant in the reserve than at control sites. Large reproductive
         males and females dominated the reserve lobster population. This suggests that rela-
         tive to a similar area of unprotected coastline, where large males and females were
         relatively uncommon, egg production within the reserve will be significantly greater.
6.       Black foot paua were larger and more abundant in the reserve compared to control
         sites. Paua mean size did however, decline over the study. This combined with obser-
         vations of paua scars on rocks suggests that some poaching occurs.
7.       The abundance of small kina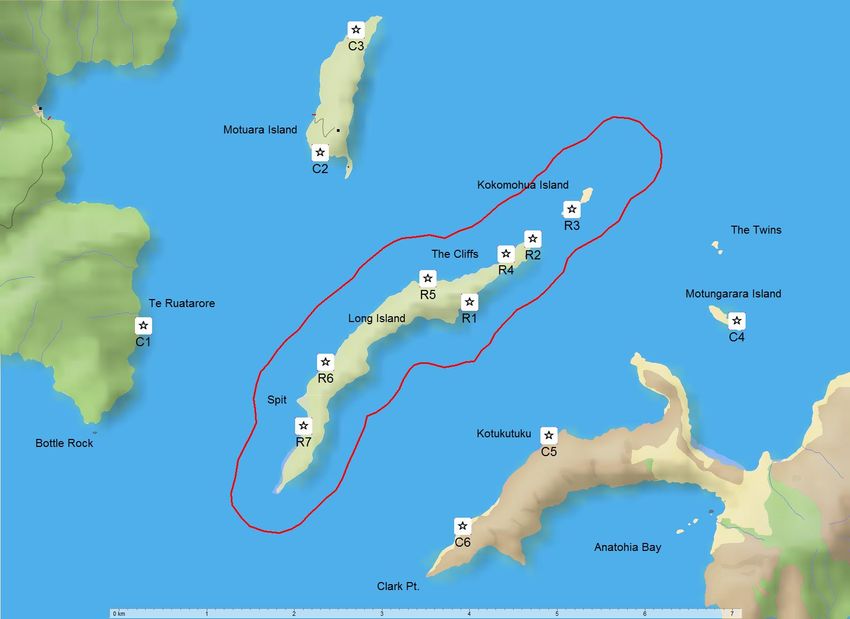
Specialists in research, survey and monitoring
1.0 INTRODUCTION
This report presents data collected during a monitoring programme based at Long Island-
Kokomohua Marine Reserve, Queen Charlotte Sound, Marlborough Sounds. The marine
reserve was formally established on 30 April 1993. To date, data has been collected over a
period of 22 years from the reserve and adjacent control sites (Davidson 1995, 1997, 2004;
Davidson et al. 2009; present study).
Since 1992, a variety of biological data has been collected. Data collected since the last report
(Davidson et al., 2009) has been highlighted in the following list.
Shore profiles.
Reef fish densities and edible species size.
Blue cod catch, measure and release.
Rock lobster density, size and sex.
Black foot paua size and density.
Black foot paua density and size.
Kina density and size.
Cats-eye density.
Baited underwater video.
The sample frequency for each aspect of the study has been variable. Reef fish, blue cod
catch, measure and release and lobster data for example, have been collected more regularly
than other data (Table 1).
Davidson Environmental Ltd. Page 4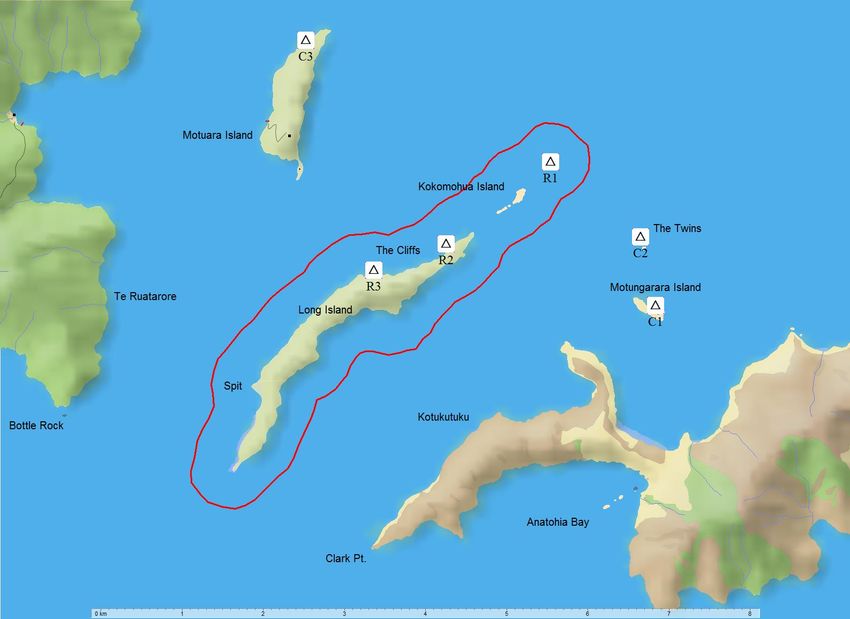
Table 1. Summary of sampling events for Long Island-Kokomohua Marine Reserve and controls.

Sample                          03 92 03 93 09 93 03 94 08 94 03 95 09 95 04 96 04 97 09 97 03 98 04 99 09 99 2000 2001 2002 2003 2004 2005 2006 2007 2008 2009 2010 2011 2012 2013 2014
Catch, measure & release
Underwater visual (rubble)
Underwater visual (algae)
Reef fish sizes
Baited underwater video (BUV)
Lobster density
Lobster size and sex
Paua density
Paua size
Kina density
Kina size
Cats eye density
Cats eye size
Shore profiles & video
Report produced
Specialists in research, survey and monitoring

2.0      STUDY AREA
Long Island and the adjacent Kokomohua Island are located in outer Queen Charlotte
Sound, Marlborough Sounds (Figure 1). Long Island is approximately 4 km in length and
between 300 m and 500 m wide. Kokomohua Island is subtidally connected to Long Island
by a reef at the north-east tip of Long Island and contributes a further one km to the total
length of both islands. Long Island is 1.9 km from the nearest point on the mainland, 1.5
km from Arapawa Island, 3.5 km from Blumine Island, and 1.4 km from Motuara Island,
all of which were used to situate control sites in the present study.

Long Island-Kokomohua Marine Reserve is a fully protected reserve extending a quarter
nautical mile (463 metres) offshore around Long and Kokomohua Islands and an unnamed
charted rock, north-east of Kokomohua Island (41 05.867 S, 174 18.750 E on Chart NZ
6153). The marine reserve is approximately 6.5 km in length and 619 ha in area (Figure 1).
The marine reserve was formally established on 30 April 1993. For the four years prior to
the formation of the marine reserve, local dive clubs had established a self-imposed
voluntary ban on the taking of marine life from the area and had encouraged others to do
the same.

Study sites were often selected on the basis of habitat. On south, east and west-facing
shores of the outer Queen Charlotte Sound, a sublittoral fringe of macroalgae extending to
approximately 1 m depth was recorded by Davidson (1995). On north-facing aspects of
Long and Kokomohua Islands, the macroalgae habitat extended down to between 7 – 10 m
depth. Macrocystis pyrifera habitat was located on the reef extending north-east of Long
Island, in the gap between Long and Kokomohua Islands and around much of Motuara,
The Twins and Motungarara Islands (excluding the southern shores). Shallow sand bottoms
(< 14 m depth) were located between Long, Kokomohua, and Motuara Islands. Rubble
habitat was distributed around most of the outer Sound and was often colonised by a
relatively narrow sublittoral fringe of macroalgae. Bedrock habitat was restricted to
headlands and northerly aspects where the macroalgae habitat extended beyond the
sublittoral fringe.

Long Island is located in a transition zone between habitats common within sheltered parts

Davidson Environmental Ltd.                                                      Page 6
Specialists in research, survey and monitoring

of Queen Charlotte Sound and habitats common in the outer Sound. The outer Sound
habitats include macroalgae stands of M. pyrifera, Ecklonia radiata, Landsburgia
quercifolia, Zonaria angustata and Marginariella urvilleana, present along the northern
parts of Long Island. Southern Long Island was dominated by typical inner Queen
Charlotte Sound rubble banks supporting a narrow sublittoral fringe of macroalgae.
McKnight and Grange (1991) also recorded a transition zone in the Long Island area from
soft sediment biological community characteristic of the inner Marlborough Sounds to
those more representative of the outer Sounds.

Figure 1. Location of Long Island-Kokomohua Marine Reserve in outer Queen
Charlotte Sound.

Davidson Environmental Ltd.                                                  Page 7
Specialists in research, survey and monitoring

3.0      SAMPLING SUMMARY SINCE 2009 REPORT
Data collected in relation to the Long Island-Kokomohua Marine Reserve have previously
been presented in four monitoring reports (Davidson 1995, 1997, 2004; Davidson et al.
2009). The current report, which incorporates data collected since Davidson et al. (2009)
(Table 1), compares changes in the density, size and/or sex of monitored species between
marine reserve sites and adjacent control sites over the entire sampling period from 1992 to
2014 (Figures 2 to 7, Tables 2 to 7).

Table 2. Blue cod catch, measure and release sites sampled since 2004. Note: site R4
was not sampled prior to 2004.

 Site no.    Area             Sample site                      Habitat    Coordinates
                                                                            o             o
 R1          Reserve          Long Island (east)               Rubble     41 06.678'S, 174 17.793'E,
                                                                            o                o
 R2          Reserve          Kokomohua (east)                 Rubble     41 06.239'S, 174 18.397'E
                                                                            o
 R3          Reserve          Long Island (south-west)         Rubble     41 07.546'S, 174o 16.182'E
                                                                                         o
 R4          Reserve          Long Island (south-east)         Rubble     41 07.299'S, 174 16.597'E
                                                                            o             o
 C1          Control          Bottle Rock                      Rubble     41 07.506'S, 174 14.628'
                                                                            o             o
 C2          Control          Clark Point                      Rubble     41 08.388'S, 174 17.281'E
                                                                            o             o
 C3          Control          Blumine Island (north)           Rubble     41 09.489'S, 174 14.523'E
                                                                            o             o
 C4          Control          Anatohia Bay                     Rubble     41 08.005'S, 174 18.384'E
                                                                            o             o
 C5          Control          Scott Point                      Rubble     41 08.567'S, 174 13.163'E
                                                                            o             o
 C6          Control          Blumine Island (south-west)      Rubble     41 10.580'S, 174 13.603'E

Table 3. Underwater visual fish sites sampled from rubble substrata since 1992.

 Site no.   Area          Sample site                       Habitat       Coordinates
                                                                            o             o
 R1         Reserve       Long Island (south-east)          Rubble        41 07.299'S, 174 16.586'E
                                                                            o             o
 R2         Reserve       Long Island (east)                Rubble        41 06.678'S, 174 17.793'E
                                                                            o             o
 R3         Reserve       Long Island (north-east)          Rubble        41 06.447'S, 174 18.056'E
                                                                            o             o
 R4         Reserve       Kokomohua (east)                  Rubble        41 06.239'S, 174 18.397'E
                                                                            o             o
 R5         Reserve       Long Island (south-west)          Rubble        41 07.546'S, 174 16.182'E
                                                                            o            o
 C1         Control       Bottle Rock                       Rubble        41 07.506'S, 174 14.628'E
                                                                            o             o
 C2         Control       Motuara Island                    Rubble        41 05.869'S, 174 16.354'E
                                                                            o             o
 C3         Control       Kotukutuku                        Rock/Rubble   41 07.574'S, 174 18.198'E
                                                                            o             o
 C4         Control       Clark Point                       Rubble        41 08.388'S, 174 17.281'E

Davidson Environmental Ltd.                                                                  Page 8
Specialists in research, survey and monitoring
Table 4. Underwater visual fish sites sampled from algae habitat since 2002. Note:
only site C3 was sampled prior to 2002.
Site Area Sample site Habitat Depth (m) Coordinates
no.
o o
R1 Reserve Charted Rock Algae 4-15 m 41 05.896'S, 174 18.809'E
o o
R2 Reserve Long Island (north) Algae 4-8 m 41 06.419'S, 174 17.855'E
o o
R3 Reserve Long Island (north-west) Algae 4-8 m 41 06.614'S, 174 17.198'E
o o
C1 Control Motungarara Island Algae 4-8 m 41 06.828'S, 174 19.740'E
o o
C2 Control The Twins Algae 4-10 m 41 06.358'S, 174 19.577'E
o o
C3 Control Motuara (west) Algae 3-5 m 41 05.539'S, 174 16.296'E
Table 5. Spiny lobster sites sampled since 2001. Note: sites sampled prior to 2001
have been detailed in Davidson (2004).
Site Area Sample site Habitat Depth (m) Coordinates
o o
R1 Reserve Charted Rock Bedrock 4-15 m 41 05.896'S, 174 18.809'E
o o
R2 Reserve Long Island (north-east) Rubble/bedrock 2-5 m 41 06.352'S, 174 18.109'E
o o
R3 Reserve Long Island (north-west) Bedrock 4-10 m 41 06.419'S, 174 17.855'E
o o
R4 Reserve Long Island (north-west) Bedrock 4-10 m 41 06.614'S, 174 17.198'E
o o
C1 Control Motungarara Island Bedrock 3-12 m 41 06.678'S, 174 17.793'E
o o
C2 Control The Twins Bedrock 3-12 m 41 06.358'S, 174 19.577'E
o o
C3 Control Kotukutuku Rock 2-6 m 41 07.509'S, 174 18.332'E
o o
C4 Control Motuara (west) Bedrock/rubble 2-7 m 41 05.539'S, 174 16.296'E
Table 6. Black-foot paua sites sampled since 1999. Note: sites sampled prior to 1999
have been detailed in Davidson (2004).
Site Depth
Area Sample site Habitat Coordinates
no. (m)
R1 Reserve Eduardo Rock Bedrock, cobble 0-2 m 41 06.77379,174 17.57974
North-east Long
R2 Reserve Bedrock 0-2 m 41 06.37738,174 18.08845
Is.
R3 Reserve Kokomohua Is. Bedrock, cobble 0-2 m 41 06.19322,174 18.40408
R4 Reserve Long Is. (NW) Bedrock 0-2 m 41 06.47505,174 17.87018
R5 Reserve Long Is. cliffs Bedrock 0-2 m 41 06.63415,174 17.23677
R6 Reserve Long Is. west Boulder, cobble 0-2 m 41 07.15759,174 16.41064
R7 Reserve Long Is. south Spit Bedrock, cobble 0-2 m 41 07.55120,174 16.23871
C1 Control Te Ruatarore Bedrock 0-2 m 41 06.94826,174 14.92066
C2 Control Motuara Is. south Bedrock, cobble 0-2 m 41 05.86498,174 16.34414
C3 Control Motuara Is. west Bedrock, cobble 0-2 m 41 05.55268,174 16.32606
C4 Control Motungarara Is. Bedrock, cobble 0-2 m 41 06.86422,174 19.76224
C5 Control Kotukutuku Bedrock 0-2 m 41 07.59032,174 18.24171
C6 Control Clark Point Boulder, cobble 0-2 m 41 08.15534,174 17.54890
Davidson Environmental Ltd. Page 9Specialists in research, survey and monitoring
Table 7. Kina and cats-eye sites sampled since 1999. Note: sites sampled prior to 1999
have been detailed in Davidson (2004).
Site Depth
Area Sample site Habitat Coordinates
no. (m)
R1 Reserve Long Is (SE) Cobble 3-8 m 41 07.298, 174 16.589
R2 Reserve Eduardo Rock Cobble 3-8 m 41 06.783, 174 17.586
R3 Reserve Kokomohua Is. Cobble 3-8 m 41 06.220, 174 18.382
R4 Reserve Charted Rock Rock 3-8 m 41 05.896, 174 18.809
R5 Reserve Long Is. (west) Cobble-bedrock 3-4 m 41 07.160, 174 16.379
R6 Reserve Long Is. (south Spit) Cobble 3-8 m 41 07.567, 174 16.212
C1 Control Bottle Rock Cobble 3-8 m 41 07.491, 174 14.609
C2 Control Motuara Is. (south) Cobble 3-8 m 41 05.888, 174 16.275
C3 Control Motuara Is. (west) Cobble 3-8 m 41 05.539, 174 16.296
C4 Control Kotukutuku Cobble-bedrock 3-8 m 41 08.221, 174 17.469
C5 Control Clark Point Cobble 3-8 m 41 07.492, 174 18.299
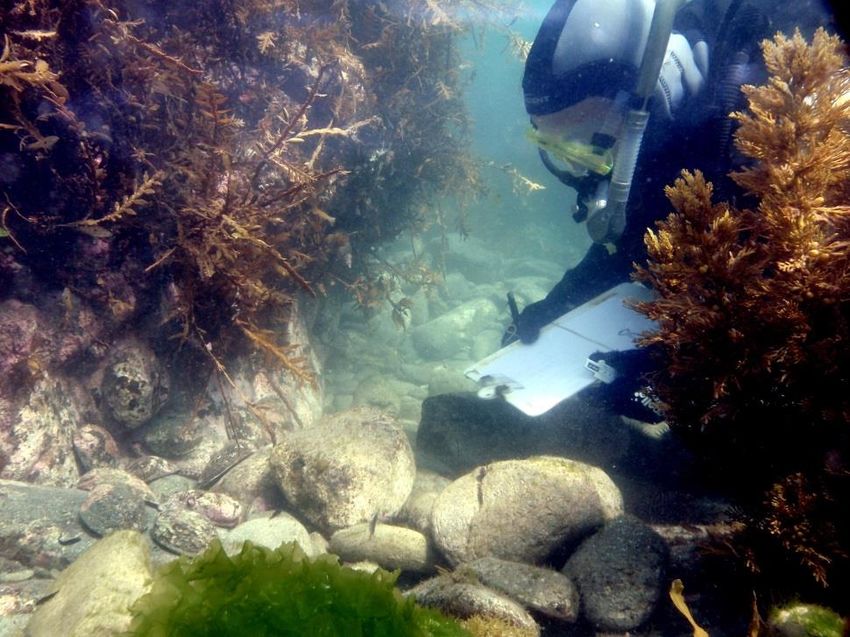
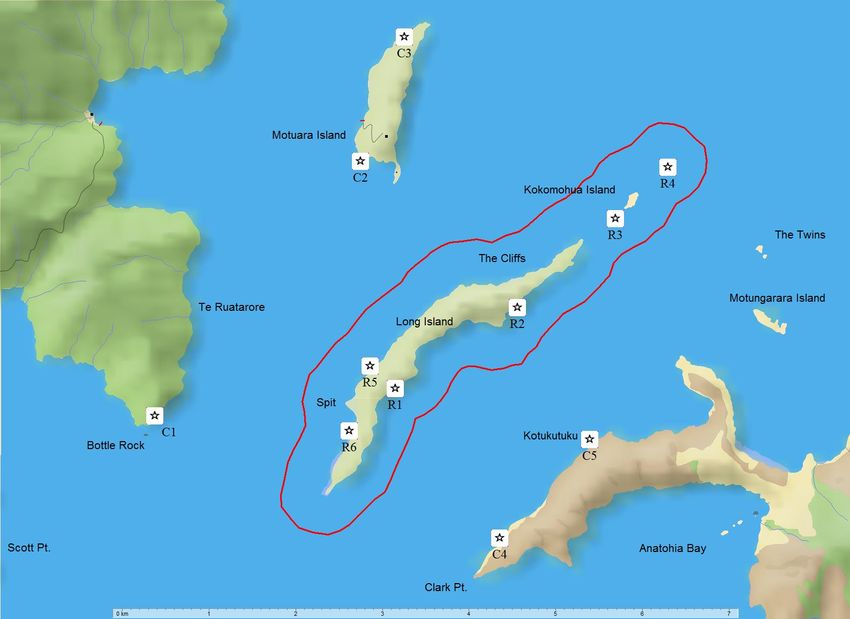
Davidson Environmental Ltd. Page 10Figure 2. Location of fish catch, measure and release sites (CMR) sampled since 2004. Note: the location of sites prior to 2004 can be found in Davidson (2004).
Figure 3. Location of underwater rubble sites (UVC) used for visual estimates of fish density and size sampled since 1992.
Figure 4. Location of algal habitat sites used for visual estimates of fish density and size (UVC) sampled since 2002. Note: the location
of sites prior to 2004 can be found in Davidson (2004).
Figure 5. Location of spiny lobster sites sampled since 2001. Note: the location of sites prior to 2004 can be found in Davidson (2004).
Figure 6. Location of black-foot paua sites sampled since 1999. Note: the location of sites prior to 2004 can be found in Davidson (2004).
Figure 7. Location of kina and cats-eye sites sampled since 1999. Note: the location of sites prior to 2004 can be found in Davidson (2004).
Specialists in research, survey and monitoring

4.0      METHODS

4.1      Catch, measure and release (CMR)
The size and catch rates of fish, predominantly blue cod (Parapercis colias), were
investigated at six control and three (1993-2003) or four (2004-2014) reserve sites (Figure
2, Table 2). Between 1992 and 2006, a maximum of 60 blue cod were sampled annually
from each site, but this was increased to a maximum of 80 individuals from 2007 onwards.
From 1992 to 1999, sampling was conducted on an annual or biannual basis. From 2000
onwards, sampling was carried out annually each autumn.

Control sites were established in areas subject to a range of recreational fishing pressures.
Two sites regarded as regularly visited by recreational fishers were selected close to the
marine reserve (Bottle Rock and Clark Point), one site was chosen that represented an area
seldom fished (Anatohia Bay), and a further three sites were selected representing fishing
pressure between these two extremes. On each sampling day, one reserve and one control
sites were sampled apart from one day each year when two control sites were sampled. Site
selection each day was random and usually based on logistical constraints such as weather.
By randomising sites any effects from environmental variables such as of time of day or
tide were minimised.

All fishing surveys were located over rubble habitat (i.e. cobbles and small boulder
substrata), close to 12 m depth. At each site, the survey vessel was positioned
perpendicular to the shore using bow and stern anchors, thereby ensuring minimal boat
movement. A supermarket 3 kg bag of ground-bait (berley) was secured inside a weighted
plastic mesh container and lowered to the sea floor below the boat. Fishers used boat rods,
set-up with two barbless ‘surf-master’ flasher rig hooks (size 2/0) and a lead sinker. Small
hooks were used in an effort to catch the largest size range possible. Hooks were baited
using small pieces of squid. In order to minimise fish mortality, fishers were instructed to
maintain direct contact between the rod and sinker (i.e. tight lines) to minimize swallowing
of hooks.

At each site catch per unit effort data were recorded (CPUE = catch/effort (total number of

Davidson Environmental Ltd.                                                       Page 17
Specialists in research, survey and monitoring

minutes fished by all fishers). CPUE was calculated for total catch and also blue cod.
Captured fish were transferred to a holding tank continuously supplied with fresh seawater.
At the end of the fishing period, all fish were measured and transferred to a second holding
tank secured to the boat and supplied with fresh circulating seawater. All fish were handled
using clean cotton gloves to minimise damage and risk of infection. No fish were released
while sampling continued, eliminating the chance of their recapture. This also allowed the
sampling coordinator to assess any fish mortality during the period prior to fish release. All
fish were released together to minimise mortality from predators, principally shags and
barracouta (Thyrsites atun).

Due to low catch rates at some sites, a maximum fishing period was set at two hours.
Fishing ceased at two hours or when the target number of blue cod individuals were
captured (i.e. up to 60 blue cod 1992-2006 and up to 80 blue cod from 2007 onwards).

Davidson (2004) used two methods to confirm that the catch was representative of the
reserve and control site blue cod populations. The author reported that in March 1994, and
again in April 2000, divers descended to the sea floor under the catching boat at one
reserve and one control site and visually assessed the sizes of fish in the populations
around the ground bait and compared these to those sizes in the catch. In September 1995,
the sizes of blue cod were recorded in the order they were captured at two control sites (i.e.
Bottle Rock and Clark Point) and all three reserve sites.

4.2      Underwater visual fish surveys (UVC)
In all years since 2009, the density of blue cod (Parapercis colias) and other reef fish was
monitored using established underwater visual transect methods (Bell, 1983; McCormick
and Choat, 1987; Choat et al., 1988; Buxton and Smale, 1989; Cole et al., 1990; Cole,
1994; Willis et al., 2000; Davidson 2001; Davidson and Richards 2013; Davidson et al.
2013).

Fish data were collected from (1) rubble (cobble and boulder substrata) with no
macroalgae (Table 3, Figure 3), and (2) bedrock, rubble substrata with a high percentage
cover of macroalgae dominated by Carpophyllum spp., Ecklonia radiata, Macrocystis

Davidson Environmental Ltd.                                                        Page 18
Specialists in research, survey and monitoring

pyrifera and a variety of other brown, red and green algae (Table 4, Figure 4). For the
rubble habitat, four reserve and four control sites were sampled annually from 1992 to
2014 in most years (Table 1). For macroalgae, three control and three reserve sites were
sampled annually from 2002 to 2014 (Table 3). Prior to April 2002, algae habitats were
sampled from three reserve and one control site (C3) annually (table 1); however, this data
has not been presented in the present report due to the low number of sites.

All transects were established parallel to shore in boulder and reef habitat at depths from 3
- 15 m (Table 3 and 4, Figures 3 and 4). Since 2000, the size of blue cod, blue moki
(Latridopsis ciliaris), red moki (Cheilodactylus spectabilis), tarakihi (Nemadactylus
macropterus), butterfish (Odax pullus) and snapper (Pagrus auratus) were visually
estimated by trained and ground-truthed divers to the nearest centimeter of fish body
length. Snapper were rarely observed by divers primarily due to their diver negative
behaviour, meaning their real abundance is likely underestimated. Divers ignored triplefins
(Tripterygiidae) and cave- and crevice-dwelling species. For most of the study, the same
three divers have collected reserve and control fish data.

At each site, a lead weight at the start of the transect line was dropped onto the substrate
within the designated depth range. The line was automatically reeled off a spool as the
diver holding the spool swam away from the lead weight. At a distance of 5 m from the
weight (indicated by a marker on the line), the diver started counting fish present within an
estimated 2 m wide x 2 m high x 30 m long “tunnel”. Transects were swum at a constant
slow speed, but fast enough to ensure that swimming fish did not overtake the divers.
Twelve replicate transects were sampled at each site. Underwater visibility was at least 4.5
m horizontal distance for the collections of fish transect data.

4.3      Spiny lobster density, sex and size
Spiny lobster density and sex was sampled in March 1992, March 1995, April 1997 and
April 1999. Since 2001, annual samples were collected from four reserve and four control
sites (Tables 1 and 5, Figure 5).

Prior to April 2001, three to eight 60 m2 quadrats were sampled per site. From April 2001

Davidson Environmental Ltd.                                                       Page 19
Specialists in research, survey and monitoring

onwards, a total of six 100 m2 quadrats (25 m long x 5 m wide) were sampled. Lobster
quadrats were haphazardly placed and oriented within depth stratum that corresponded to
the presence of lobster habitat at each site. Two divers independently searched all crevices,
caves and cracks within each quadrat using an LED dive torch. The size and sex of lobsters
encountered was recorded. For most of the study, the same two divers collected lobster
data.

The methodology for estimating lobster size also changed during the monitoring
programme. Prior to 1999, total body length was visually estimated and individuals were
grouped into four size classes: juvenile (< 150 mm), small (150 – 250 mm), medium (250
– 350 mm), and large (> 350 mm). From 1999 onwards, carapace length (CL) was
estimated to the nearest 5 mm. Lobsters were separated into four groups based on carapace
length and/or sex: (i) reproductive male (≥140 mm CL (ii) non-reproductive male (85-139
mm), (iii) mature female (≥85 CL), (iv) juvenile ≤ 80 mm CL. A ruler attached to an
extendable lanyard was used to measure lobsters.

Occasionally, the size and sex of some lobsters could not be measured because they were
deeply concealed beneath boulders or within caves. As a result, the number of lobsters
presented in density and size data does not correspond.

4.4      Black-foot paua density and size
The density and size (maximum length) of black foot paua (Haiotis iris) was sampled at
eight reserve and three control sites in 1992 (0-2 m depth below mean low water). Since
1992, the number of sites was altered to seven reserve and six control sites (Figure 6, Table
6). Paua were sampled in 1992, 1999, 2004, 2007, 2009, 2010, 2012, and 2013, however,
only paua size was sampled in 2004 and 2012. In 2012, one control site was sampled (Site
5), while five of the seven reserve sites (sites 2, 3, 7, 8, and 9) were sampled.

Paua sites were located in areas supporting either "mixed algae" habitat or a macroalgal (C.
maschalocarpum) sublittoral strip growing on bedrock located from 0 to 2 m depth. Divers
methodically searched each site in an attempt to find and measure a minimum of 50 paua.
This was not always possible as paua were uncommon in some years and at some sites.

Davidson Environmental Ltd.                                                         Page 20
Specialists in research, survey and monitoring

Numbers therefore ranged from 15 to 115 paua. Paua were measured with callipers to the
nearest millimetre in situ.

At each site, paua density was sampled from between 30 and 60 (1 m2) haphazardly placed
quadrats deployed 0-2 m below low tide (Table 6). Quadrats were haphazardly placed on
bedrock and boulder substrata and all visible black-foot paua were counted. No paua were
counted from under rolled boulders.

4.5      Kina density and size
Kina / sea urchin (E. chloroticus) density and size data were collected in 1992, 1999, 2008,
2010 and 2014 (Table 1). Eleven reserve and five control sites were sampled in 1992, but
sites were reduced to six reserve and five control sites in April 1999 onwards (Table 7,
Figure 7). Analysis of sizes excluded data collected form additional sites in 1992. At each
site, numbers of kina were counted from 34 to 66 1 m2 quadrats haphazardly placed within
a predetermined depth range (generally 3-8 m) from rock or rubble substrata not covered
by foliose macroalgae (Table 7). The test diameters of all surface-dwelling kina within
quadrats were measured in situ to the nearest 1 mm using callipers. When insufficient kina
were measured from quadrats, additional kina were measured from adjacent areas within the
predetermined depth range by thoroughly and methodically searching substrata.

4.6      Cats eye density
Cats eye snail (T. smaragdus) density was sampled from 5-6 reserve and five control sites in
1992, 1999, 2008, 2010 and 2014 (Table 7, Figure 7). The number of sites sampled was
reduced after 1992. Cats eyes were counted in 21 to 60 1 m2 quadrats haphazardly placed
with a predetermined depth range (generally 3-8 m) on rock or rubble habitat free of foliose
macroalgae (Table 7).

4.7      Statistical analysis
All size and density raw data were entered into a Mircrosoft Excel 2010 spreadsheet.
Mean, standard deviation, standard error and sample sizes were calculated using inbuilt

Davidson Environmental Ltd.                                                      Page 21
Specialists in research, survey and monitoring

function commands. On occasion raw data from individual sites were pooled into reserve
and control groups where means, standard deviation and standard errors were calculated in
Excel 2010. Statistical analyses of raw data were conducted using Sigmaplot 12.5 unpaired
t-Test where data were first tested using the Shapiro-Wilk Normality Test. An equal
variance test was also conducted on raw data to check variability about the means. The P
value determining the probability of being incorrect in concluding that the data is not
normally distributed was set at 0.05. All raw data in the present study failed this test and a
Mann-Whitney Rank Sum Test was then applied. The Mann-Whitney Rank Sum Test tests
for a difference between two groups that is greater than what can be attributed to random
sampling variation. The null hypothesis was that the two samples were not drawn from
populations with different medians. The Rank Sum Test is a nonparametric procedure,
which does not require assuming normality or equal variance. It ranks all the observations
from smallest to largest without regard to which group each observation comes from. The
ranks for each group are summed and the rank sums compared. If there is no difference
between the two groups, the mean ranks should be approximately the same. If they differ
by a large amount, we assumed that the low ranks tend to be in one group and the high
ranks are in the other, and conclude that the samples were drawn from different
populations (for example, that there is a statistically significant difference).

In all significance tests Alpha was set at 0.05 where α is the acceptable probability of
incorrectly concluding that there is a difference.

Davidson Environmental Ltd.                                                        Page 22
Specialists in research, survey and monitoring

5.0       RESULTS
This report updates monitoring data collected from Long Island-Kokomohua Marine
Reserve and nearby control sites from 2010 to 2014.

5.1       Fish catch, measure and release (CMR)
Since 2009, blue cod dominated the catch at both reserve (98.3%) and control (83.5%)
sites followed by spotty (Notolabrus celidotus), kahawhai (Arripis trutta), carpet shark
(Cephaloscyllium isabellum), tarakihi (Nemadactylus macropterus) and barracouta
(Thrysites atun) (Tables 8 and 9)

Table 8. Fish recorded from pooled reserve sites sampled since 2009 (CMR).

Species name                Common name      2010   2011   2012   2013   2014   Total
Parapercis colias           Blue cod         328    326    324    333    381    1692
Nemadactylus macropterus    Tarakihi                 9                    1      10
Notolabrus celidotus        Spotty            1      5      5      1      5      17
Thyrsites atun              Barracouta                                            0
Cephaloscyllium isabellum   Carpet shark             1                            1
Parika scaber               Leatherjacket                                         0
Arripis trutta              Kahawhai                                              0
Helicolenus papillosus      Sea perch                              1              1
Pseudolabrus miles          Scarlet wrasse                                        0
Notolabrus fucicola         Banded wrasse                                         0
Squalus acanthias           Spiky dogfish                                         0
Total catch (n)                              329    341    329    335    387    1721
Total no. species                             2      4      2      3      3       5

Table 9. Fish recorded from pooled control sites sampled since 2009 (CMR).

Species name                Common name      2010   2011   2012   2013   2014   Total
Parapercis colias           Blue cod         486    438    423    412    393    2152
Nemadactylus macropterus    Tarakihi          7      1      7      11    13      39
Notolabrus celidotus        Spotty           78      19     62     59    50     268
Thyrsites atun              Barracouta                      3                    3
Cephaloscyllium isabellum   Carpet shark      3             3      23     9      38
Parika scaber               Leatherjacket     4      2      7      6             19
Arripis trutta              Kahawhai         17      1      8      14     2      42
Helicolenus papillosus      Sea perch                                     1      1
Pseudolabrus miles          Scarlet wrasse                  1      1             2
Notolabrus fucicola         Banded wrasse                   1      1             2
Squalus acanthias           Spiky dogfish     2             2      6      2      12
Total catch (n)                              597    461    517    533    470    2578
Total no. species                             7      5      10     9      7      11

Davidson Environmental Ltd.                                                     Page 23
Specialists in research, survey and monitoring

A variety of other species were occasionally captured (e.g. leatherjacket (Parika scaber),
banded wrasse (Notolabrus fucicola), scarlet wrasse (Pseudolabrus miles)). A total of five
species of fish were captured between 2010 and 2014 at reserve sites compared to 11
species from control sites (Tables 8 and 9).

5.1.1 Size structure of blue cod (CMR)

Total length (TL) of blue cod varied between reserve and control treatments throughout the
study (Figure 8). Apart from 2012, the median blue cod length at reserve sites always
exceeded control values, however in some years the differences were small (1994, 2010,
2014).

Mean TL for blue cod in the reserve always remained above means recorded at controls,
however, in August 1994, April 2012 and May 2014 the difference was small and not
significantly different (Figure 9, Table 10).

Soon after the reserve was established, reserve blue cod length increased, peaking in
September 1999 (mean = 318.5 mm) (Figure 9). From 2000 onwards, mean blue cod
length typically fluctuated between 284 mm and 308 mm (Figure 9), although in 2014 it
dramatically declined to 270.6 mm. The previous low was recorded in September 1995
(mean = 276 mm) (Figure 9).

Mean TL for blue cod at pooled control sites was more variable than in pooled reserve sites
(Figure 9). In control sites, it initially increased from September 1993 to August 1994, but
declined dramatically by September 1995. Mean TL of blue cod at control sites gradually
increased in the following four sample events to March 1998, but again declined to a low
of 223.3 mm in April 2000. For the next two samples, mean TL for the control treatment
increased, peaking in April 2003, only to decline in March 2004. From March 2004, mean
blue cod TL at control sites consistently increased for 8 years consecutive years, peaking in
April 2012 at 280.9 mm TL (Figure 9). This event was one of the three occasions the
difference between reserve and control means (7.3 mm) was not significantly different
(Table 10). Since 2012, control means declined by 18.8 mm to 262.0 mm length.

Davidson Environmental Ltd.                                                       Page 24
Specialists in research, survey and monitoring

Table 10. Mann-Whitney U test statistics comparing pooled blue cod length between
reserve and control sites for each CMR sampling year. Note: for the magnitude of
statistical differences see Fig.9.

              Date            U value   P value   N (small, large)   Sig.
              Sep-93          11827
Specialists in research, survey and monitoring
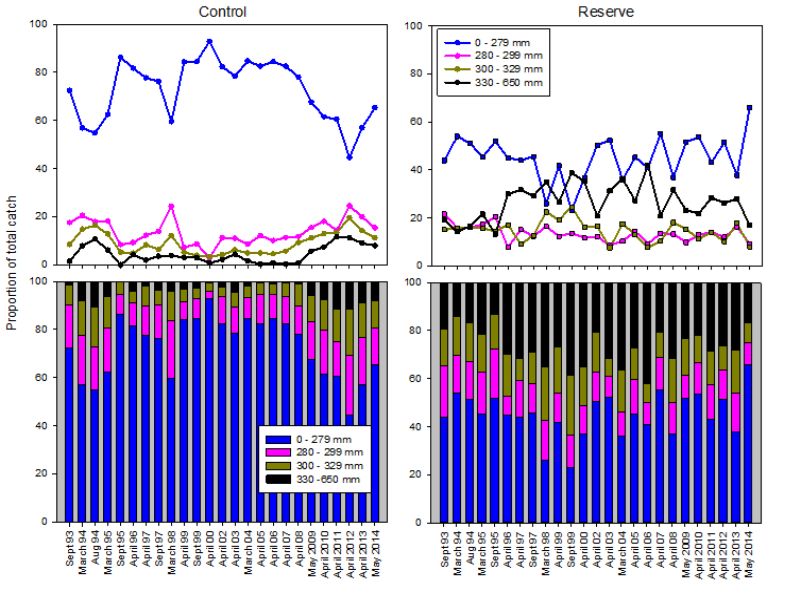
May 2014 (i.e. fishery closure and subsequent slot rule), the percentage of large >330 mm
blue cod from control sites remained relatively high compared to previous years. The
proportion of the two medium size classes were comparable between reserve and control
sites, however, they did fluctuate between years.
Table 11. Proportion of blue cod in three size classes from pooled reserve and control
sites (CMR).
Date 330 mm
Control Reserve Control Reserve Control Reserve Control Reserve
Sep-93 72.5 43.9 17.6 21.6 8.5 15.1 1.5 19.3
Mar-94 56.9 54 20.5 15.9 14.8 15.9 7.9 14.2
Aug-94 54.8 51.2 18 16 16.4 16 10.8 16.6
Mar-95 62.5 45.4 18.3 17.3 12.9 15.7 6.2 21.6
Sep-95 86.3 51.9 8.4 20.4 5.3 14.4 0 13.3
Apr-96 81.7 45 9.3 7.8 4.8 17.2 4.2 30
Apr-97 77.7 44 12.3 15.1 8.3 9.1 2 31.7
Sep-97 76.2 45.6 13.9 12.4 6.4 12.8 3.6 29.2
Mar-98 59.5 26 24.4 16.5 12.2 22.5 3.9 35
Apr-99 84.3 41.8 7.4 12.4 5.2 19.2 3 26.6
Sep-99 84.4 23 8.7 13.7 4 24.6 3 38.8
Apr-00 92.9 36.9 3 11.7 3.4 16.2 0.7 35.2
Apr-02 82.4 50.3 11.2 12.3 4.2 16.6 2.2 20.9
Apr-03 78.4 52.4 11 8.6 6.2 7.6 4.4 31.4
Mar-04 84.7 35.9 8.7 10.4 4.9 17.5 1.6 36.3
Apr-05 82.5 45.3 12.2 14.4 4.9 13.1 0.44 27.2
Apr-06 84.4 40.9 10.1 9.3 4.6 7.7 0.9 42.1
Apr-07 82.5 55.2 11.4 13.6 5.7 10.3 0.4 20.9
Apr-08 78 36.9 11.8 13.3 9.3 18.1 0.9 31.7
May-09 67.6 51.7 15.5 9.8 11.2 15.3 5.7 23.2
Apr-10 61.52 53.7 18.1 13.1 12.96 11.28 7.41 21.95
Apr-11 60.5 43.25 14.4 14.1 13.5 14.1 11.6 28.5
Apr-12 44.6 51.5 24.5 12 19.6 10.2 11.3 26.2
Apr-13 57 37.8 19.9 16.3 14.2 17.8 9 28.1
May-14 65.3 65.9 15.4 9.2 11.3 8 8 16.9
5.2.3 Blue cod size-frequency (CMR)
Blue cod size-frequency distributions differed between pooled reserve (4 sites) and pooled
control sites (6 sites) (Figures 11-17), and individual sites (Figures 18 and 19). In most
years the control population was characterised by most individuals below the legal size,
with a considerably smaller number of individuals greater than the minimum legal size.
Blue cod within the reserve were generally dominated by sub-legal fish, although relative
Davidson Environmental Ltd. Page 26Specialists in research, survey and monitoring to the control sites, greater numbers of legal blue cod occurred within the reserve. The size structure of control blue cod at individual control sites in 2004 was comprised primarily of sub-legal sized individuals (< 300 mm TL), with no individuals over 380 mm TL being recorded (Figure 18). This contrasts with reserve sites where much of the population was over the minimum legal size limit and many individuals were > 380 mm TL. In 2004, sites in each treatment (i.e. reserve, control) showed comparable size- frequency distributions. In 2014, control sites exhibited variable population structures (Figure 19). Sites 1 (Bottle Rock), 2 (Blumine north) and 3 (Clark Point) had few individuals over the legal size limit (>300 TL). At Bottle Rock, only three blue cod greater than 300 mm TL were recorded. In contrast, Sites 4 (Anatohia), 5 (Scott Point) and 6 (Blumine south) supported a greater numbers of large cod > 300 TL. Conversely, in 2014 the size frequency distributions of blue cod within the reserve were consistent across sites. In 2014, the numbers of legal cod (>300 TL) were lower than most previous years at three of the four sites (Figure 19). 5.1.3 Blue cod catch per unit effort (CMR) Pooled catch per unit effort (CPUE) values were significantly higher in the reserve compared to the control sites (T = -10.02, P
Blue cod median length (mm)
100
200
300
400
500
CON993
RES993
CON394
RES394
CON894
RES894
CON395
RES395
CON995
RES995
CON496
RES496
CON497
RES497
CON997
RES997
CON398
RES398
CON499
RES499
CON999
RES999
CON400
RES400
CON402
RES402
CON403
RES403
CON304
RES404
CON405
RES405
percentiles and the horizontal line the median. Error bars are 10th and 90th percentiles..
CON406
RES406
CON407
Pooled reserve
RES407
CON408
RES408
CON509
RES509
CON410
RES410
CON411
RES411
CON412
RES412
Pooled control
CON413
RES413
CON514
RES514
Figure 8. Box plot of CMR blue cod length from pooled reserve (blue) and control sites (pink). Enclosed boxes represent 25th and 75thSize limit (cm)
35
30
Closure
25 12
Bag limit
6
Closure
340 0
320
Mean blue cod length (cm)
300
280
260
240
CONTROL
RESERVE
220
0
Sept 1993
Aug 1994
Sept 1995
April 1996
April 1997
Sept 1997
April 1999
Sept 1999
April 2000
April 2002
April 2003
April 2005
April 2006
April 2007
April 2008
March 1994
March 1995
March 1998
March 2004
May 2009
April 2010
April 2011
April 2012
April 2013
May 2014
Figure 9. Mean blue cod length from CMR pooled reserve (blue squares) and control sites
(pink circles). Error bars represent 95% confidence intervals. Changes to blue cod bag limits
and minimum sizes are indicated for the Marlborough Sounds.Figure 10. Proportion of blue cod (CMR) from pooled reserve and control site separated into four size categories. Line (top) and bar (bottom) graphs display the same pooled data for control (left) and reserve (right) samples.
CONTROL                                                 RESERVE

                      n=131, mean=257.2, SE=3.19                              n=229, mean=288.9, SE=2.82
                 45
                                                           SEPT 1993     45

                 40       Sites (2)                                      40       Sites (3)
                 35                                                      35        Sites (3)
                 30                                                      30

                 25                                                      25

                 20                                                      20

                 15                                                      15

                 10                                                      10

                  5                                                       5

                  0                                                       0

                      0      100   200   300   400   500                      0      100   200   300   400   500

                      n=380, mean=271.7, SE=2.03           MARCH 1994         n=226, mean=279.9, SE=2.8
                 45                                                      45

                 40       Sites (6)                                      40       Sites (3)
                 35                                                      35

                 30                                                      30

                 25                                                      25

                 20                                                      20

                 15                                                      15

                 10                                                      10

                  5                                                       5       Sites (3)
     Frequency

                  0                                                       0

                      0      100   200   300   400   500                      0      100   200   300   400   500

                          n=372, mean=275.0, SE=2.1        AUGUST 1994        n=193, mean=280.1, SE=3.27
                 45                                                      45

                 40       Sites (6)                                      40       Sites
                                                                                  Sites (3)
                                                                                        (3)
                 35                                                      35

                 30                                                      30

                 25                                                      25

                 20                                                      20

                 15                                                      15

                 10                                                      10

                  5                                                       5

                  0                                                       0

                      0      100   200   300   400   500                      0      100   200   300   400   500

                      n=371, mean=265.8, SE=2.27                              n=185, mean=288.2, SE=3.51
                 45
                                                           MARCH 1995    45

                 40       Sites (6)                                      40       Sites (3)
                 35                                                      35

                 30                                                      30

                 25                                                      25

                 20                                                      20

                 15                                                      15

                 10                                                      10

                  5                                                       5

                  0                                                       0

                      0      100   200   300   400   500                      0      100   200   300   400   500

                      Total length (mm)                                       Total length (mm)

Figure 11. Length-frequency distributions of blue cod from CMR pooled reserve and control
sites from September 1993 to March 1995.
CONTROLS RESERVE
SEPTEMBER 1995
n=131, mean=238.2, SE=3.08 n=181, mean=276.5, SE=3.33
45 45
Sites (6) Sites (3)
40 40 Sites (3)
35 35
30 30
25 25
20 20
15 15
10 10
5 5
0 0
0 100 200 300 400 500 0 100 200 300 400 500
APRIL 1996
n=289, mean=245.5, SE=2.63 n=181, mean=292.5, SE=4.2
45 45
40 Sites (5) 40 Sites (3)
35 35
30 30
25 25
20 20
15 15
10 10 Sites (3)
5 5
Frequency
0 0
0 100 200 300 400 500 0 100 200 300 400 500
APRIL 1997
n=302, mean=252.2, SE=1.96 n=186, mean=297.9, SE=4.15
45 45
40 Sites (6) 40 Sites (3)
35 35
30 30
25 25
20 20
15 15
10 10
5 5
0 0
0 100 200 300 400 500 0 100 200 300 400 500
SEPT 1997
n=281, mean=257.1, SE=2.16 n=250, mean=296.5, SE=3.57
45 45
40 Sites (6) 40 Sites (3)
35 35
30 30
25 25
20 20
15 15
10 10
5 5
0 0
0 100 200 300 400 500 0 100 200 300 400 500
Total length (mm) Total length (mm)
Figure 12. Length-frequency distributions of CMR blue cod from pooled reserve and control
sites from September 1995 to September 1997.CONTROLS RESERVE
n=205, mean=261.3, SE=3.14 MARCH 1998 n=200, mean=313.4, SE=3.54
40 40
Sites (6) Sites (3)
35 35 Sites (3)
30 30
25 25
20 20
15 15
10 10
5 5
0 0
0 100 200 300 400 500 0 100 200 300 400 500
40
n=230, mean=231.2, SE=2.84 APRIL 1999 40
n=177, mean=294.5, SE=4.61
35
Sites (5) 35 Sites (3)
30 30
25 25
20 20
15 15
10 10 Sites (3)
5 5
0 0
Frequency
0 100 200 300 400 500 0 100 200 300 400 500
n=275, mean=232.1, SE=2.65 SEPT 1999 n=183, mean=318.5, SE=4.14
40 40
35 Sites (6) 35 Sites (3)
30 30
25 25
20 20
15 15
10 10
5 5
0 0
0 100 200 300 400 500 0 100 200 300 400 500
n=268, mean=223.3, SE=2.3 APRIL 2000 n=179, mean=304.0, SE=4.8
40 40
35 Sites (6) 35 Sites (3)
30 30
25 25
20 20
15 15
10 10
5 5
0 0
0 100 200 300 400 500 0 100 200 300 400 500
Total length (mm) Total length (mm)
Figure 13. Length-frequency distributions of CMR blue cod from pooled reserve and control
sites from March 1998 to April 2000.CONTROLS RESERVE
n=313, mean=243.3, SE=2.08 APRIL 2002 n=187, mean=287.5, SE=4.21
55 55
50
Sites (6) 50 Sites (3)
45 45
40 40
35 35
30 30
25 25
20 20
15 15
10 10
5 5
0 0
0 100 200 300 400 500 0 100 200 300 400 500
n=227, mean=247.0, SE=2.9
APRIL 2003 n=185, mean=289.0, SE=4.8
55 55
50
Sites (6) 50 Sites (3)
45 45
40 40
35 35
30 30
25 25
20 20
15 15
10 10
5 5
Frequency
0 0
0 100 200 300 400 500 0 100 200 300 400 500
55
n=367, mean=233.4.0, SE=2.1 MARCH 2004 n=251, mean=307.6, SE=3.4
55
50 Sites (6) 50 Sites (4)
45 45
40 40
35 35
30 30
25 25
20 20
15 15
10 10
5 5
0 0
0 100 200 300 400 500 0 100 200 300 400 500
n=451, mean=237.9, SE=1.8 n=320, mean=291.7, SE=3.2
55
APRIL 2005
55
50 50
45 Sites (6) 45 Sites (4)
40 40
35 35
30 30
25 25
20 20
15 15
10 10
5 5
0 0
0 100 200 300 400 500 0 100 200 300 400 500
Total length (mm) Total length (mm)
Figure 14. Length-frequency distributions of CMR blue cod from pooled reserve and control
sites from April 2002 to April 2005.CONTROLS RESERVE
n=456, mean=242.5, SE=1.6 APRIL 2006 n=247, mean=308.3, SE=3.99
65 65
60 60
55
Sites (6) 55
Sites (4)
50 50
45 45
40 40
35 35
30 30
25 25
20 20
15 15
10 10
5 5
0 0
0 100 200 300 400 500 0 100 200 300 400 500
n=492, mean=246.0, SE=1.5
APRIL 2007 n=339, mean=284.6, SE=2.9
65 65
60
55 Sites (6) 60 Sites (4)
55
50 50
45 45
40 40
35 35
30 30
25 25
20 20
15 15
Frequency
10 10
5 5
0 0
0 100 200 300 400 500 0 100 200 300 400 500
65
n=355, mean=250.2, SE=1.8 MARCH 2008 n=331, mean=303.8, SE=2.9
65
60 Sites (6) 60 Sites (4)
55 55
50 50
45 45
40 40
35 35
30 30
25 25
20 20
15 15
10 10
5 5
0 0
0 100 200 300 400 500 0 100 200 300 400 500
n=401, mean=259.0, SE=2.1 MAY 2009 n=327, mean=286.5, SE=2.9
65 65
60
60 Sites (5) 55
Sites (4)
55
50 50
45 45
40 40
35 35
30 30
25 25
20 20
15 15
10 10
5 5
0 0
0 100 200 300 400 500 0 100 200 300 400 500
Total length (mm) Total length (mm)
Figure 15. Length-frequency distributions of CMR blue cod from pooled reserve and control
sites from April 2006 to May 2009.CONTROLS RESERVE
n=467, mean=269.8, SE=1.78 APRIL 2010 n=309, mean=288.8, SE=2.88
65 65
60 60
55
Sites (6) 55
Sites (4)
50 50
45 45
40 40
35 35
30 30
25 25
20 20
15 15
10 10
5 5
0 0
0 100 200 300 400 500 0 100 200 300 400 500
n=438, mean=270.95, SE=2.27
APRIL 2011 n=326, mean=298.2, SE=3.04
65 65
60
55 Sites (6) 60 Sites (4)
55
50 50
45 45
40 40
35 35
30 30
25 25
20 20
15 15
Frequency
10 10
5 5
0 0
0 100 200 300 400 500 0 100 200 300 400 500
65
n=424, mean=280.9, SE=2.19 April 2012 n=324, mean=288.25, SE=3.33
65
60 Sites (6) 60 Sites (4)
55 55
50 50
45 45
40 40
35 35
30 30
25 25
20 20
15 15
10 10
5 5
0 0
0 100 200 300 400 500 0 100 200 300 400 500
n=402, mean=272.9, SE=2.22 April 2013 n=320, mean=299.4, SE=2.93
65 65
60
60 Sites (6) 55
Sites (4)
55
50 50
45 45
40 40
35 35
30 30
25 25
20 20
15 15
10 10
5 5
0 0
0 100 200 300 400 500 0 100 200 300 400 500
Total length (mm) Total length (mm)
Figure 16. Length-frequency distributions of CMR blue cod from pooled reserve and control
sites from April 2010 to April 2013.CONTROLS RESERVE
n=389, mean=262.1, SE=2.68 May 2014 n=349, mean=270.6, SE=2.95
65 65
60 60
55
Sites (6) 55
Sites (4)
Frequency
50 50
45 45
40 40
35 35
30 30
25 25
20 20
15 15
10 10
5 5
0 0
0 100 200 300 400 500 0 100 200 300 400 500
Total fish length (mm)
Figure 17. Length-frequency distributions of CMR blue cod from pooled reserve and control
sites in May 2014.14
12 C1 Bottle Rock R1 Eduardo Rock
10 Mean = 217.3 mm Mean = 299.4 mm
8
6
4
2
0
14
12 C2 Clark Point R2 Kokomohua
10
Mean = 228.8 mm Mean = 303.4 mm
8
6
4
2
0
14
12 C3 Blumine north R3 South spit
10
Mean = 236.3 mm Mean = 317.1 mm
8
6
4
2
Frequency
0
14
12 C4 Anatohia R4 Long south east
10 Mean = 258.5 mm Mean = 326 mm
8
6
4
2
0
14 0 100 200 300 400 500
12 C5 Scott Point Length (mm)
10 Mean = 233.6 mm
8
6
4
2
0
14
12 C6 Blumine south
10 Mean = 224.6 mm
8
6
4
2
0
0 100 200 300 400 500
Length (mm)
Figure 18. Length-frequency distributions of CMR blue cod from individual reserve and
control sites in April 2004.18
16 C1 Bottle Rock R1 Eduardo Rock
14 Mean = 217.3 mm Mean = 299.4 mm
12
10
8
6
4
2
0
14
12 C2 Clark Point R2 Kokomohua
10
Mean = 228.8 mm Mean = 303.4 mm
8
6
4
2
0
18
16 C3 Blumine north R3 South spit
14 Mean = 236.3 mm Mean = 317.1 mm
12
10
8
6
4
2
Frequency
0
14
12 C4 Anatohia R4 Long south east
10 Mean = 258.5 mm Mean = 326 mm
8
6
4
2
0
14 0 100 200 300 400 500
12 C5 Scott Point Length (mm)
10 Mean = 233.6 mm
8
6
4
2
0
14
12 C6 Blumine south
10 Mean = 224.6 mm
8
6
4
2
0
0 100 200 300 400 500
Length (mm)
Figure 19. Length-frequency distributions of CMR blue cod from individual reserve and
control sites in April 2014.Mean catch per unit effort (blue cod per rod, per minute)
0.0
0.2
0.4
0.6
0.8
1.0
1.2
1.4
1.6
1.8
2.0
2.2
intervals.
Sept 1993
March 1994
August 1994
March 1995
Sept 1995
April 1996
April 1997
Sept 1997
March 1998
April1999
Sept 1999
April 2000
April 2002
April 2003
March 2004
April 2005
April 2006
April 2007
April 2008
May 2009
April 2010
April 2011
April 2012
April 2013
May 2014
Figure 20. Mean catch per unit effort (CPUE) for blue cod pooled from reserve and control sites (CMR). Error bars are 95% confidenceSpecialists in research, survey and monitoring 5.2 Underwater visual counts (UVC) Divers counted reef fish annually from rubble habitat in control and reserve sites from 1992 to 2014, and in macroalgae habitat from 2002 to 2014. 5.2.1 Presence-absence and relative abundance (UVC) Divers observed 15 species of reef fish from rubble substrata at reserve and control sites during the study (Table 12). Blue cod and spotty were recorded from all rubble sites on all occasions and were usually observed in high numbers relative to other species. The presence of tarakihi varied between years, but when present, they were frequently observed, usually in small groups or as large schools. Other species like leatherjacket (Parika scaber) were recorded regularly, although in relatively low numbers; however, small groups of juveniles associated with occasional macroalgae plants or were sometimes seen on rubble by divers. Kingfish (Seriola grandis) were rarely observed, and when they were, it was as individuals or small groups (300 cm TL). Small blue cod were almost always more abundant in the reserve, but this difference was not significant until April 2000 onwards (excluding March 2011). From 1995 onwards, significantly more large blue cod were recorded from reserve sites compared to control sites. Davidson Environmental Ltd. Page 41
Specialists in research, survey and monitoring

The density of large blue cod at the control sites remained relatively low over the duration of
the study, with small increases in March 1993, and the last six years of the study (Figure 21).
Small blue cod at control sites ranged from 1-3 individuals per 60 m2 compared to 1.8-8
individuals per 60 m2 at reserve sites.

Table 12. Relative abundance of fish (excluding triplefins) assessed by divers during
underwater counts (1992-2014) from rubble and macroalgae reserve and control sites.

           Species name                           Common name Rubble Macroalgae
           Caesioperca lepidoptera                Butterfly perch 1A    2C
           Upeneichthys lineatus                  Goatfish             1A         1A
           Scorpis lineolatus                     Sweep                1A         1B
           Aplodactylus arctidens                 Marblefish           2A         2B
           Nemadactylus macropterus               Tarakihi             2C         3C
           Cheilodactylus spectab ilis            Red moki             1A         3A
           Cheilodactylus nigripes                Magpie moki                     1A
           Latridopsis ciliaris                   Blue moki            1A         3B
           Latridopsis aerosa                     Copper moki                     1A
           Notolab rus celidotus                  Spotty               3C         3C
           Notolab rus fucicola                   Banded wrasse        1A         2A
           Pseudolab rus miles                    Scarlet wrasse       3A         2A
           Pseudolab rus cinctus                  Girdled wrasse                  1A
           Parapercis colias                      Blue cod             3C         3C
           Parika scab er                         Leatherjacket        2A         3B
           Odax pullus                            Butterfish                      2A
           Latris lineata                         Trumpeter            1A         1A
           Scorpis violaceus                      Blue maomao                     1A
           Seriola lalandi                        Kingfish             1B         1B
           Hippocampus ab dominalis               Seahorse             1A         1A
           Total number of species                                     15         20

Note: Relative abundance score: blank = absent; 1 = rare (seen every 10+ dives), 2 = occasional (seen every
3-4 dives), 3 = common (seen most dives).

When observed usually seen as: A = 1-2 individuals, B = 3-10 individuals, C = 11+ individuals or as a
school).

Davidson Environmental Ltd.                                                                       Page 42
Specialists in research, survey and monitoring
Table 13. Mann-Whitney U statistic test for all blue cod density data collected from
rubble sites compared between pooled reserve and pooled controls (UVC). Note: for the
magnitude of statistical differences see Figure 21.
Year df T P Significance
Mar-92 18,24 408 0.589 Not Significant
Mar-93 40, 50 1614 0.09 Not Significant
Mar-94 34, 59 1394 0.1 Not Significant
Mar-95 36, 63 1459 0.012 Significant
Apr-96 32, 48 1093 0.044 Significant
Apr-97 47, 66 2086Specialists in research, survey and monitoring recorded at one reserve site; however, only occasional tarakihi individuals were observed in most years. A small reserve increase was also recorded in March 2013. This small increase was due to two small groups of tarakihi (4-6 individuals) recorded at one reserve site. Other reef fishes occasionally recorded from rubble banks were leatherjacket (P. scaber), blue moki (Latridopsis ciliaris), butterfly perch (Caesioperca lepidoptera), and scarlet wrasse (Pseudolabrus miles) (Table 12). 5.2.3 Fish density from macroalgae (UVC) Apart from blue cod, the density of most reef fish from macroalgae habitats differed little between reserve and control sites (Figure 23). In most years, blue cod were more abundant at the reserve sites compared to control sites (P
10
                                                   Blue cod 300 mm
                                               4
2

                                               3

                                               2

                                               1

                                               0

                                              12   All blue cod

                                              10

                                               8

                                               6

                                               4

                                               2

                                               0
                                                    February 2012
                                                      March 1992
                                                      March 1993
                                                      March 1994
                                                      March 1995

                                                      March 1998

                                                      March 2004
                                                      March 2005

                                                      March 2008
                                                      March 2009
                                                      March 2010
                                                      March 2011

                                                      March 2013
                                                      March 2014
                                                        April 1996
                                                        April 1997

                                                        April 1999
                                                        April 2000
                                                        April 2001
                                                        April 2002
                                                        April 2003

                                                        April 2006
                                                        April 2007

Figure 21. Mean blue cod density from pooled reserve rubble sites (n = 5; blue squares)
and control sites (n = 4; pink circles) (UVC). Note: Y-axis scales differ between each size
class.

Davidson Environmental Ltd.                                                        Page 45
40 Spotty
30
20
10
0
1.00
Banded wrasse
2
Fish density per 60m
0.75
0.50
0.25
0.00
2.0
Tarakihi
1.5
1.0
0.5
0.0
February 2012
April 1996
April 1997
April 1999
April 2000
April 2001
April 2002
April 2003
April 2006
April 2007
March 1992
March 1993
March 1994
March 1995
March 1998
March 2004
March 2005
March 2008
March 2009
March 2010
March 2011
March 2013
March 2014
Figure 22. Mean density of selected fish species from underwater visual counts (UVC)
pooled from rubble sites in the reserve (n = 5; blue squares) and control sites (n = 4;
pink circles). Error bars = +/- 1 s.e. Note: scale of the Y-axis differs between panels.
Davidson Environmental Ltd. Page 465
Blue cod
4
3
2
1
0
5
Blue moki
4
3
Density per 60 m (+/- 1se)
2
1
2
0
7
6 Tarakihi
5
4
3
2
1
0
0.6
Butterfish
0.5
0.4
0.3
0.2
0.1
0.0
March 2004
March 2005
March 2008
March 2010
March 2011
March 2013
March 2014
April 2002
April 2003
April 2006
April 2007
May 2009
February 2012
Figure 23. Mean density of selected fish species from macroalgae sites in the reserve (n =
3; blue squares) and at control sites (n = 3; pink circles) (UVC). Error bars = +/- 1 s.e.
Note: scale of the Y-axis differs between panels.
Davidson Environmental Ltd. Page 4750
Blue moki
40
Mean length (cm)
30
20
10
0
35
Tarakihi
30
25
Mean length (cm)
20
15
10
5
0
May 2009
March 2004
March 2005
March 2008
March 2010
March 2011
March 2013
March 2014
April 2002
April 2003
April 2006
April 2007
February 2012
Figure 24. Mean length of blue moki and tarakihi estimated by divers from macroalgae
and rubble reserve (blue squares) and control sites (pink circles). Error bars = +/- 1 s.e.
Note: scale of the Y-axis differs between panels.
Davidson Environmental Ltd. Page 48Specialists in research, survey and monitoring
5.3 Lobster density, size, and sex
The density of lobsters within the reserve remained low for the first nine years after
reservation (Figure 25, Table 14). From April 2002 onwards, their density dramatically
increased within the reserve and remained at high levels for the remainder of the study. At
controls, initially low lobster densities increased after 2002, peaking in April 2006 (Figure 25,
Table 14). From March 2008 onwards lobster density at controls fell back to lower levels, but
remained above levels recorded in the first 10 years of the study. In 2014, mean lobster
density in the reserve was 11.5 times higher than at control sites.
Table 14. Mean lobster density (per 100 m2) from pooled reserve and control sites. Note:
not all sites were sampled each year; additional control sites were sampled from 2002
onwards. Note: for the magnitude of statistical differences see Figure 25.
Year Reserve (mean) s.e. Control (mean and 1SE) s.e.
March 1992 1.39 0.20 0.75 0.12
March 1995 3.11 1.60 1.00 0.26
April 1997 1.00 0.09 0.33 0.07
April 1999 3.67 1.45 0.56 0.33
April 2001 2.78 0.66 0.54 0.22
April 2002 10.17 2.38 0.72 0.43
April 2003 7.50 2.15 2.03 0.60
March 2004 10.50 2.04 2.67 0.88
April 2005 12.13 2.12 5.75 2.01
April 2006 14.29 2.22 6.71 1.80
April 2007 13.00 2.39 2.29 0.73
March 2008 13.63 1.51 2.17 0.50
March 2009 10.75 1.24 3.25 0.65
April 2010 13.46 1.38 1.63 0.37
March 2011 12.00 1.68 1.46 0.33
February 2012 14.08 2.59 3.96 1.08
March 2013 13.17 2.89 1.08 0.39
March 2014 13.50 2.41 1.17 0.52
Davidson Environmental Ltd. Page 49You can also read