WP/18/20 Reserve Currency Blocs: A Changing International Monetary System? - IMF
←
→
Page content transcription
If your browser does not render page correctly, please read the page content below

WP/18/20

      Reserve Currency Blocs: A Changing International
                                   Monetary System?

                                             Camilo E. Tovar and Tania Mohd Nor

IMF Working Papers describe research in progress by the author(s) and are published
to elicit comments and to encourage debate. The views expressed in IMF Working Papers
are those of the author(s) and do not necessarily represent the views of the IMF, its
Executive Board, or IMF management.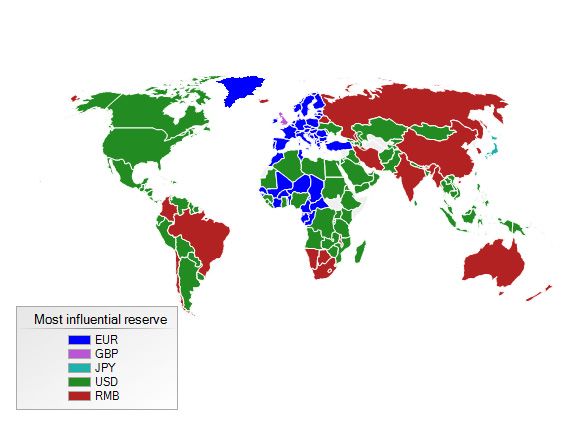
© 2018 International Monetary Fund WP/18/20
IMF Working Paper
Strategy Policy and Review Department
Reserve Currency Blocs: A Changing International Monetary System?
Prepared by Camilo E. Tovar and Tania Mohd Nor†
Authorized for distribution by Kristina Kostial
January, 2018
IMF Working Papers describe research in progress by the author(s) and are published to
elicit comments and to encourage debate. The views expressed in IMF Working Papers are
those of the author(s) and do not necessarily represent the views of the IMF, its Executive Board,
or IMF management.
Abstract
What is the extent of currency diversification in the international monetary system? How has
it evolved over time? In this paper, we quantify the degree of currency diversification using
regression methods of currency co-movements to determine the extent to which national
currencies across the world belong to a reserve currency bloc. We then use these estimates to
calculate the economic size of each currency bloc. A key contribution of our paper is that we
quantify the size of the Chinese renminbi bloc. Our analysis suggests that the international
monetary system has transitioned from a bi-polar systemconsisting of the U.S. dollar and
the euroto a tri-polar onethat includes the renminbi. The dollar bloc is estimated to
continue to dominate, having the largest share in global GDP (40 percent), followed by the
renminbi (30 percent) and the euro blocs (20 percent). The geographical area of influence for
the RMB bloc appears to be most evident among the BRICS’ currencies. The British pound
and the Japanese yen blocs appear to play minor roles.
JEL Classification Numbers: F15, F31, F33, F36, F41, O24
Keywords: Currency Bloc, Internatinal Monetary System
Author’s E-Mail Address: ctovar@imf.org and tmohdnor@imf.org, correspondingly.
†
We thank Alfred Kammer and Kristina Kostial for their feedback and support in preparing this paper. We also
acknowledge Donal McGettigan, Robert Gregory, Wojciech Maliszewski, Ceyda Oner, Neil Meads, and
Andrew Swiston for their useful conversations and feedback.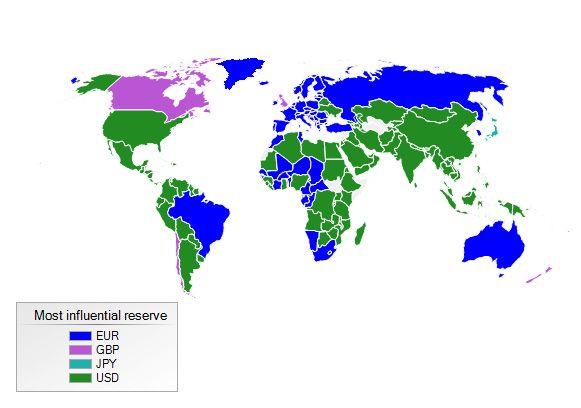
3
Contents Page
Abstract ......................................................................................................................................2
I. Introduction ............................................................................................................................4
II. Methodology and Data ..........................................................................................................6
A. Allocating currencies to a currency bloc...................................................................7
B. Calculating the size of a currency bloc ...................................................................10
C. Data and estimation .................................................................................................10
III. Econometric Results ..........................................................................................................11
A. Reserve currencies’ influence of across the world..................................................11
A view without the RMBFrankel and Wei’s (1994) approach ....................12
A view with the RMB Kawai and Pontines’ (2016) approach ....................13
B. Dynamics of currency blocs over time ....................................................................15
C. Economic size of currency blocs .............................................................................17
Currency bloc’s economic size measured by the absolute influence of reserve
currencies .........................................................................................................17
Currency bloc’s economic size measured by the relative influence of reserve
currencies .........................................................................................................18
D. Robustness analysis.................................................................................................20
Alternative numeraire currency .......................................................................21
Controlling for additional reserve currencies ..................................................21
Controlling for a wider set of reference currencies for the RMB ....................23
Additional Controls ..........................................................................................23
IV. What Determines the Relative Importance of Reserve Currencies? .................................24
A. The U.S. dollar bloc ................................................................................................25
B. The euro bloc ...........................................................................................................29
C. The renminbi bloc ...................................................................................................32
V. Conclusions .........................................................................................................................35
Annex .......................................................................................................................................36
References ...............................................................................................................................40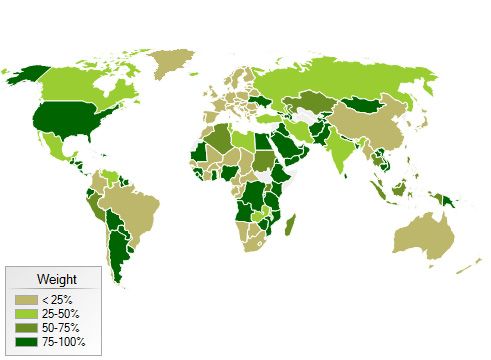
4
I. INTRODUCTION
The international monetary system after World War II has been dominated by few currencies,
with the U.S. dollar playing a leading role (IMF, 2016a and 2011; Zhou, 2009). Some see in
the lack of diversification of global reserve currencies a source of weakness and
vulnerabilities for the international monetary system, as it can lead to liquidity shortages,
“exorbitant privileges,” excessive uphill capital flows, or incentivize weak fiscal discipline in
reserve issuing countries, among others.2 Others argue that the dominance of a few currencies
has served the international monetary system well. For instance, it is often said that the
dominant currencies have provided reliable and high-quality safe-haven assets in times of
financial stress. Independent of these opposing views, the global economy has become
increasingly multipolar. Significant structural shifts have underpinned this transformation—
including the rapid expansion and increasing interconnectedness of the global economy and
financial markets. Against this backdrop, a key issue is whether the transformation of the
global economy has resulted in a more diversified system of reserve currencies.
Empirically assessing the degree of currency diversification in the international monetary
system is a complex and multidimensional problem. For sure no single indicator captures the
complexities associated with such assessment. Most academic and policy studies make such
assessments based on the global economic or financial use and trading of reserve currencies.
For example, the importance of a global currency can be assessed through the currency
denomination of trade or financial assets (IMF,2015a,b).3 In this paper we take an alternative
approach, and gauge the degree of currency diversification by examining how reserve
currencies influence currency fluctuations across the world and how this influence has
changed over time. Or to put it differently, the paper examines the extent to which national
currencies are anchored to reserve currencies.4 Using this approach, we delve into the
economic influence of five major currencies across the world as determined by the currency
composition of the IMF’s Special Drawing Rights (SDR) basket the British pound (GBP),
2
A discussion of liquidity shortages of U.S. dollars at the height of the crisis is presented in McGuire and Von
Peter, (2009). For an analysis of the implications of uphill capital flows on the international monetary system
see Csonto and Tovar (2017). For an overview on how the reliance on a single currency may distort fiscal
discipline see Farhi et al. (2011) and Landau (2013). For a discussion on the role of the dollar on the
international monetary system see Eichengreen (2011), Farhi et al. (2011), and Prasad (2014). A discussion on
alternatives to the lack of currency diversification in the system see IMF (2016b), and Tovar (2017).
3
This is consistent with the notion that an international currency should fulfill several roles, including being a
unit of account, a means of exchange, and a store of value. To varying degrees accomplishing such roles might
also require the issuing country to allow the currency to be bought or sold (either in the spot or forward market);
allow domestic and foreign firms to invoice their exports and imports in that currency; allow firms, financial
institutions and individuals to hold the currency or financial assets denominated in that currency; and to issue
marketable instruments denominated in such currency (See Kenen, 2012 and Blinder, 1996).
4
In this regard, the paper is also linked to a strand of literature that examines the evolution of exchange rate
arrangements (e.g. Ilzetzki et al. 2017).
(continued…)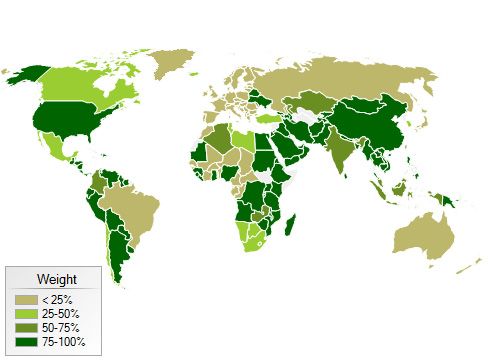
5 the Chinese renminbi (RMB), the euro (EUR), the Japanese yen (JPY), and the U.S. dollar (USD).5 The methodology employed in the analysis relies on Frankel and Wei’s (1994) workhorse regression method for estimating the influence of major reserve currencies as captured by the co-movements of currencies across the world. Estimates using data over the period 1969- 2015 allow us to determine the absolute and relative global share of output that is under the influence of each underlying reserve currency bloc (BIS, 2015; McCauley and Chan, 2014; Kawai, Masahiro and Shigeru Akiyama, 1998).6 However, employing Frankel and Wei’s (1994) methodology for the analysis at hand has drawbacks. Specifically, since the RMB was pegged to the dollar or followed a basket of currencies at different points in time, the methodology generates a collinearity problem that constrains the ability to examine the relevance of the renminbi’s currency bloc. Because of this, leading scholars in the field have concluded that “[n]o other international currencies compete at present with the dollar and the euro. The much-debated international role of the renminbi is a live future possibility but, at this stage, is difficult to quantitatively separate its role given its history of strong linkage to the U.S. dollar” (Ilzetzki et al., 2017, page 5). In this paper we address this problem. To do so, we extend the analysis and use a modified approach proposed by Kawai and Pontines (2016). This methodology has only been applied to assess the existence of a RMB currency bloc in Asia countries, but not to gauge the existence of a RMB currency bloc at the global level. This approach allows us to obtain an alternative measure of the global influence of each major reserve currency, including the RMB. Hence, a key major contribution of our paper is to quantitatively gauge the size of the RMB bloc. The two alternative frameworks complement each other. Frankel and Wei’s (1994) methodology is useful to gain a historical perspective, while Kawai and Potines’ (2016) approach allows us to quantify the RMB bloc. Our results using Frankel and Wei’s (1994) methodologywhich does not consider the RMBconfirm that the dollar is the most influential reserve currency in the world. Specifically, we find that on average over the period 2011-2015 the dollar bloc accounts for about 60 percent of global GDP. The euro bloc follows in order of importance, accounting for just over 26 percent of global GDP, while the 5 The notion of influence of a reserve currency and hence its role as a global nominal anchor has evolved over time. In the past, this influence could mainly be related to the extent to which national currencies were pegged to a reserve currency. With the advent of greater exchange rate flexibility and the structural shift in the global economy (e.g., the developments of financial markets, greater trade and financial integration), currency fluctuations are more likely to reflect changes in information that determines their value relative to a reserve currency (e.g., economic fundamentals, expectations, or news). Hence, in this paper we state that a currency belongs to a reserve currency bloc when its currency has been pegged to a reserve currency, or if changes in its valuation are mainly associated to the information set contained in the valuation change of a reserve currency. 6 As discussed in Section II.B, we allocate national currencies to currency using two alternative methods. One method assigns a national currency to a currency bloc based on the reserve currency that has the largest absolute influence. The alternative method aggregates the relative influence of each reserve currency on each national currency across the world.
6
pound sterling and the Japanese yen are found to play a secondary role accounting for just 7
and 5 percent of global GDP, respectively. The results using Kawai and Pontines’ (2016)
modified approachwhich takes into account the RMB confirm the dominance of the U.S.
dollar bloc, but with a much smaller weight (about 40 percent of global GDP). This approach
also shows that the renminbi bloc follows in order of economic importance, influencing
about 30 percent of global GDP, surpassing the euro bloc, which influences about 20 percent
of global GDP. The British pound and Japanese yen blocs are again found to have a small
global influence, about 3 and 5 percent of global GDP, respectively.
Our results suggest that the international monetary system’s transition from a bi-polar
system—in which two currency blocs dominate, i.e., the dollar and euro—, to a tri-polar
onewhich includes the renminbi blocis well underway. Despite this shift, the U.S. dollar
continues to play a dominant role. Our results also indicate that the economic size of the
RMB bloc is at this stage geographically constrained, as its influence mainly arises from the
RMBs influence on the BRICS’s currencies. At the same time, we find no evidence to
suggest that the RMB is the dominant currency in Asia, by influencing exchange rates in the
region or through Asian supply chains (Fratszcher and Mehl, 2013). Failing to find evidence
that supports this hypothesis does not mean that the RMB does not have any influence across
Asia’s currencies.7
The paper also briefly explores how the size of currency blocsas measured by its share in
global GDP at purchasing power parity (PPP)correlates with fundamental variables.
Focusing on the USD, the EUR, and the RMB blocs, we show that the size of currency blocs
is highly persistent. This is consistent with the notion that network externalities play a critical
role in determining the use of reserve currencies. We also show that economic size of the
reserve-issuing country appears to play a central role in supporting a currency bloc.
Moreover, the analysis suggests that increased debt levels are correlated with a decline in the
importance of the USD and the EUR currency blocs. Finally, current account surpluses
appear to undermine the size of currency blocs.
The remaining of the paper is structured as follows. Section II presents the methodology and
data employed, while Section III reports the results. Section IV briefly examines potential
drivers of these results and, finally, Section V concludes.
II. METHODOLOGY AND DATA
This paper uses regressions methods to determine the extent to which national currencies co-
move with major reserve currencies as determined by the IMF’s SDR currency basket. These
results are then used to calculate the economic relative importance of each currency by
calculating the share of global GDP under the influence of each major reserve currency.
Calculations thus follow two steps. The first step places each currency in a reserve currency
7
Some authors have argued that the world is headed to a multi-polar system in which the U.S. dollar dominates
in the Americas, the euro in Europe, and the renminbi in Asia (Eichengreen, 2011).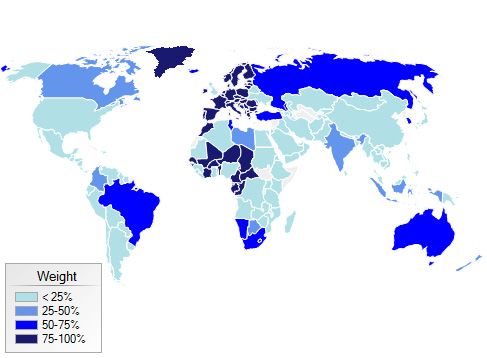
7
bloc or zone: dollar, euro, pound, renminbi, or yen. To complete this step, we use two
alternative allocation methods: an absolutein which a national currency is assigned entirely
to a bloc based on the dominant reserve currencyand a relative onethat only allocates the
portion of the national currency that is influenced by each reserve currency. The second step
calculates the share of global GDP-PPP that falls under the influence of each major reserve
currency, that is, we calculate the economic size of the currency bloc.
A. Allocating currencies to a currency bloc
The methodology builds on the literature on currency blocs or zones (Frankel and Wei, 2008
and 1994; BIS, 2015; McCauley and Chan, 2014, and Kawai and Pontines, 2016). This
literature uses Frankel and Wei’s (1994) approach as a starting point to estimate the influence
of major international currencies in the implicit currency basket of individual economies.
Specifically, it estimates an equation of the following form:
∆ ∆ ∆ ∆
∆ ∆ (1)
where denotes an individual currency, so that ∆ captures the logarithmic change of
the currency in terms of the numeraire currency, , in period ; is the regression
coefficients that captures the degree of co-movement across currencies, and is the error
term. As is standard in the literature, the change of the log-transformation is employed to
ensure stationarity of the coefficients.
An issue arising with this methodology is how to define the value of each currency. That is,
which numeraire should be employed. In principle, this will depend on whether the value of
the currency is determined by a basket of currencies or not, and of the nature of shocks
affecting the economy. One might want to choose a numeraire that minimizes the correlation
between the error term and the numeraire currency. In practice, Frankel and Wei (1994) use
the Swiss Franc, but other studies have selected the SDR (Frankel and Wei, 2008; Fratzscher
and Mehl, 2013). In the absence of a clear dominant candidate, we follow instead the BIS
(2015) which selects the U.S. dollar as the numeraire on the basis that by doing so the
methodology assigns a currency to the dollar bloc if its movements against the dollar have
nothing in common against the euro, the yen, or the renminbi. As shown later in Section III.
D results are robust to this choice. Thus, we estimate the following equation:
∆ ∆ ∆ ∆
∆ (2)
In this framework, the degree of influence of each reserve currency on each individual
national currency is captured by the coefficient attached to each reserve currency (i.e. for
k= EUR, GBP, JPY, and RMB). The exception is the U.S. dollar, as its degree of influence is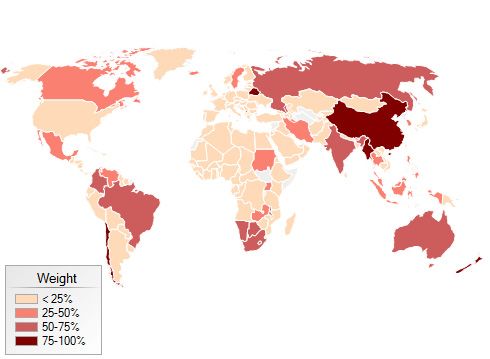
8

obtained as    ≡1                          . Also, a currency will be said to belong to a
currency bloc if the weight of that reserve currency exceeds the weight assigned to other
reserve currencies.
Estimating equation (2) with the RMB generates collinearity problems since the RMB
remained fixed to the U.S. dollar for much of the sample period or its value was determined
by a basket of currencies.8 This collinearity problem is well-known in the literature and has
led researchers to attempt several fixes. Some studies have aimed at choosing sample periods
in which the RMB displayed some degree of flexibility (Chen and Peng, 2009), others have
aimed at removing the USD component from the RMB fluctuations (Fratzscher and Mehl,
2013). However, as shown by Kawai and Pontines (2016), it is unclear that these approaches
help surmount the problem and conclude that the framework is not useful in providing stable,
robust patterns of currency weights for the USD or the RMB.
In our paper, we start using Frankel and Wei’s (1994) methodology. However, this
methodology excludes the possibility of a RMB bloc. That is, we omit from the estimation
the last term in the right-hand side of equation (2), i.e.,         ∆              . Doing so can be
justified from an econometric perspective to overcome the collinearity problem, but it comes
at a cost of overestimating the degree of influence of the U.S. dollar. From an economic
perspective it could be argued that the RMB internationalization is so recent that it does not
bias the estimates. The RMB’s internationalization at best started in 2005, and only began to
pick up in 2009 as reflected by the onshore and offshore use and trading of the RMB. Indeed,
it was at this latter date that the Chinese authorities started adopting explicit measures to
support the internationalization of the RMB through the gradual opening of the capital
account, lower regulatory barriers, easier market access for official institutions and long term
private investors, the introduction of channels for repatriating RMB funds onshore, the
implementation of domestic reforms, and the establishment of cross-border payments
infrastructure and offshore liquidity (Nabar and Tovar, 2017).
Nonetheless, excluding the RMB from the analysis fails to recognize its increasing
importance and can lead to misleading conclusions. The IMF’s Executive Board recognized
the increasing use and trading of the RMB when it included the currency in the SDR basket
(IMF, 2015a,b). Hence, to bring the RMB into the analysis and to surmount the collinearity
problem, we also implement Kawai and Pontines’ (2016) modified methodology.
Specifically, their framework relies on a two-step regression procedure. The first step
removes the components of the movements in the RMB from the movements of other reserve
currencies, including the U.S. dollar, and obtains the residuals from the following first step
regression:

8
  The Chinese exchange regime has changed over time. The renminbi has been pegged to the dollar at certain
points in time, but also to a basket of currencies at other times.
9

              ∆                              ∆                     ∆                      ∆

                                     ∆                                                                         (3)

Equation (3) can be interpreted as determining the weights accorded by the Chinese
authorities to the major reserve currencies in their own exchange rate basket.9 In equation (3)
all currencies are measured against the New Zealand dollar (NZD). This numeraire is
selected because it is a freely floating currency, without capital controls and exchange
controls.10 The estimated residuals of Equation (3), , are then used in the following second
step regression:

                 ∆                          ∆                     ∆                      ∆

                                      ∆                                                                        (4)

where

              ∆                              ∆                      ∆                     ∆

                                       ∆                .                                                   (4.a)

Next, subtracting the residuals, , on both sides of equation (4) and imposing the condition
that the weights of the currencies on the right-hand of equation (4) add to one, i.e.,
                 1, yields the modified version of Frankel and Wei’s regression for any
currency, :

             ∆                                     ∆                               ∆

                                             ∆                               ∆                                 (5)

The estimation of equation (5) yields the implied RMB coefficient as         1
        . Just as with Frankel and Wei’s methodology, the degree of influence of each reserve
currency on each individual currency is captured by the coefficient attached to each reserve
currency (i.e. for k = 1, …, 5 i.e., USD, EUR, JPY, GBP, and RMB). A currency will then
be allocated to a currency bloc based on the degree of influence of that reserve currency. To
this end, we use both an absolute and a relative concept.

9
 Since 2005 China’s exchange rate was announced to be based on the fluctuations of currencies in a basket.
Section III.D shows that results are robust even when considering a wider reference basket of currencies for the
RMB.
10
     As shown in Section III.D results are robust to the choice of an alternative numeraire (e.g. the Swiss Franc).

                                                                                                    (continued…)
10
B. Calculating the size of a currency bloc
The previous sub-section described the methodology to calculate the degree of influence of
each reserve currency and explained how to allocate currencies to a reserve currency bloc.
The next step is to use these results to measure the economic size of each bloc and determine
how they have evolved over time.11 Doing so provides insights into the evolution of the
international monetary system by quantitatively gauging the changing influence of reserve
currencies over time.
In reporting the size of currency blocs, we define two distinct measures: an absolute and a
relative one. The absolute measure allocates a national currency to a reserve currency bloc
based on the reserve currency with the largest influence in that country. The relative measure
aggregates the relative influence of each reserve currency on each national currency across
the world.
The economic size of each currency bloc is determined, firstly, by multiplying the estimated
influence of each reserve currency on each national currencyeither in absolute or relative
termsby the country’s annual share in global GDP in purchasing power parity (GDP-PPP)
terms. This is then added across all countries to obtain the economic size of each reserve
currency bloc or influence zone. Hence, in this paper the economic size of a currency bloc is
measured as a share of global GDP. Nothing prevents us from measuring the relative size in
terms of other variables, such as global trade, or other measures of global finance, including
international transactions. However, since our objective is to measure the global influence,
GDP-PPP is likely to be the most comprehensive measure and most readily available across
all countries.
C. Data and estimation
We use end-of-period monthly exchange rates as reported by IMF’s International Financial
Statistics, and annual gross domestic product at purchasing-power parity (GDP-PPP) data
obtained from the IMF’s World Economic Outlook database. We also use two samples. The
first is a global sample of 189 countries. Since some countries do not have data for the whole
period, we also use a balanced sample of 130 countries for which we have complete data
over the whole period of 1969 to 2015. The balanced sample is more appropriate to examine
trends, while the full sample is better at providing an up-to-date snapshot of currency blocs.
Parameter estimates of equations (2) and (5) are obtained using ordinary least square
regressions with 48-month rolling windows. In assigning countries to a currency bloc we
assume that reserve-issuing countries belong to their own reserve currency blocnonetheless
we also report what happens when we drop this assumption.12
11
This approach resembles that of Kawai and Akiyama (1998).
12
Coefficients are restricted to be one or zero for the few instances in which the estimated coefficients exceeded
one or turned negative, respectively.11
The introduction of the euro poses some challenges. To deal with it, we use as reserve
currencies the Deutsche mark (DM) and the French franc (FF) prior to the introduction of the
euro in 1999. Hence when estimating equations (2) and (5), we replace the euro term with
two equivalent terms that include the DM and the FF. To obtain estimates of the euro, we
take advantage of the fact that the DM and FF coexisted and were fixed to the euro since
January 1, 1999.
III. ECONOMETRIC RESULTS
This section presents the econometric results of our analysis. We start reporting the influence
of reserve currencies in each country and, building on this, we then report the size of each
currency bloc.
A. Reserve currencies’ influence of across the world
Results report the degree of co-movement of national currencies with each major reserve
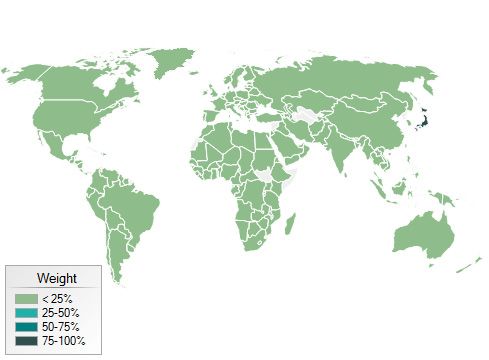
Figure 1: Relative Influence of Reserve CurrenciesA view without the RMB
(Average 2011-2015, Frankel and Wei’s 1994 Methodology)
Dollar Euro
British Pound Yen
Source: IFS and WEO. Fund staff calculations.
Note: For definitions see text.12 currency. For presentational purposes, we place the influence of each reserve currency into buckets (quartiles) depending on whether the reserve currency explains (i) less than 25 percent; (ii) between 25 and 50 percent; (iii) between 50 and 75 percent, or (iv) between 75 and 100 percent of the individual country’s currency fluctuation. We use color coding to identify each quartile in Figures 1 through 3. Darker shadings suggest that a reserve currency has greater influence, while the lighter color shadings suggest that it has less. Since the estimated degree of influence of each reserve currency can vary overtime and to smooth out the effects of outliers, we report the average of the monthly coefficients obtained using rolling regressions with a 48-month window over the period January 2011-December 2015.13 A view without the RMBFrankel and Wei’s (1994) approach We start the analysis without considering the RMB. Specifically, Figure 1 displays the full sample estimates of the influence of each reserve currency across the world using equation (2)that is, employing Frankel and Wei’s methodology. Estimates show that the dollar and the euro are the dominant reserve currencies in the international monetary system (Figure 1, 2, and Table 1). The dollar’s dominance extends to 112 countries across all continents, while the euro’s influence extends to 68 countries. Our analysis also makes evident the marginal role of the British pound, whose influence extends to just 5 currencies, including those of Canada, Chile, and New Zealand (Figure 1). Finally, the yen is found to have no significant influence beyond its own borders. Figure 2: Reserve Currency Blocs Figure 2 summarizes the results by (Absolute measure) assigning individual countries to a currency bloc based on the currency with the greatest degree of influence (i.e., the absolute measure). Our results using the full sample indicate that about 60 percent of the countries conform the dollar bloc, 37 percent the euro bloc, 3 percent the British pound bloc and 1 percent the yen (Table 1, third column). Results are robust for the balanced sample. The share of countries under the dollar and Source: IFS and WEO. Fund staff calculations. euro blocs is similar to that obtained by Note: For definitions see text. Ilzetzki et al. (2017). However, the geographic distribution differs somewhat. 13 The potential shifts of the influence of a currency overtime is a well-known problem in the literature, see discussion in Kawai and Pontines (2016).
13
Table 1: Reserve Currency BlocsNumber of Countries
(Average 2011-15, full sample)
Full Sample 1/ Balanced Sample 2/
Currency
Equation 2 Equation 5 Equation 2 Equation 5
bloc
Countries Share (%) Countries Share (%) Countries Share (%) Countries Share (%)
Dollar 112 60.2 99 53.2 77 59.2 70 53.8
Euro 68 36.6 56 30.1 47 36.2 38 29.2
Pound 5 2.7 1 0.5 5 3.8 1 0.8
Yen 1 0.5 1 0.5 1 0.8 1 0.8
Renminbi … … 29 15.6 … … 20 15.4
Sources: IFS and WEO. Fund staff calculations.
Note: Equation 2 corresponds to Frankel and Wei’s (1994) approach, while Equation 5 corresponds to Kawai and Pontines’
(2016) modified approach.
1/
Number of countries varies, with a maximum of 186 countries.
2/
130 countries throughout the sample.
A view with the RMB Kawai and Pontines’ (2016) approach
We now bring into the analysis the role of the RMB. Results using equation (5) confirm the
dominance of the dollar bloc, which extends to about 53 percent of the currencies of the
world—broadly in line with the results obtained using Frankel and Wei’s approach (Table 1,
fifth column). The euro bloc follows in importance, but its influence declines to 30 percent of
the countries in the sample. The RMB’s bloc is next, comprising 16 percent of the currencies.
The model also estimates relatively marginal roles of the British pound and the Japanese yen.
Our estimates thus indicate the absence of an Asian RMB bloc. Rather, the dollar continues
to play a large role in Asia. It is worth noticing that the RMB appears to influence the
currencies of the BRICS countries,14 thus conforming a RMB bloc that covers these
economies (Figure 3, bottom-right panel). In general, the growing influence of the RMB also
appears in its estimated growing influence in driving the dynamics of currencies in some
other large economies of Latin America (Chile and Colombia), the Middle East (e.g., Iran),
and Australia (Figure 3, bottom-left panel). Our analysis also indicates that including the
RMB in the analysis reduces the euro’s influence, which mostly influences Europe and some
countries in Africa. This contrasts with the results using equation 2 (i.e., Frankel and Wei’s
approach), which showed Russia and Brazil as part of the euro bloc.
Results must be interpreted with caution, as the methodology may overestimate the influence
of the RMB. In particular, the methodology assumes that all coefficients in the right-hand
14
The BRICS countries comprise Brazil, Russia, India, China and South Africa. Together these economies
account for about a quarter of world GDP and a population of three billion. Since 2009 these countries have
been engaged and seeking a greater role in the world economy and its financial institutions (see Prasad, 2017),14
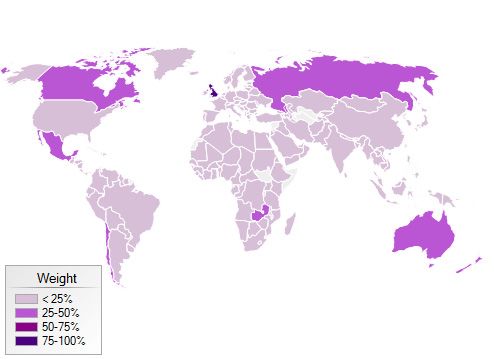
Figure 3: Reserve Currencies Influence and Currency BlocsA View with the RMB
(Average 2011-2015, Kawai and Pontines’ 2016 Methodology)
Dollar Euro
British Pound Yen
Chinese Renminbi Reserve Currency Bloc
Source: IFS and WEO. Fund staff calculations.
Note: For definitions see text.
side of equation (5) add to one, formally, 1. However, if this is not
the case, the estimate for the RMB will be biased. Intuitively, currency movements might not15
all be explained by the reserve currencies considered in our analysis, hence the methodology
attributes any unexplained movement to the RMB. In this sense, our results for the RMB are
best interpreted as an upper range estimate. To address potential concerns about the
robustness of these estimates, in Section III.D we conduct sensitivity analyses to assess the
robustness of our results and, if any, determine how wide is the bound range estimate of the
RMB bloc.
B. Dynamics of currency blocs over time
So far, we have provided a snapshot of the current state of currency blocs. However, a key
issue is how have currency blocs evolved over time? We address this by examining the
dynamics of the number of countries in each currency bloc over time (Figure 4).
To ensure comparability over time we use a balanced sample, which is composed of 130
countries for which data is complete for the full period. Frankel and Wei’s methodology
(Equation 2) is best placed to provide us with a historical perspective, but this is done at the
expense of omitting the RMB from the analysis. For presentational purposes, we focus on the
relative measure. Also, prior to 1999 the DM and the FF currency blocs are merged into a
single series and reported as “euro.”
Figure 4: Currency Blocs Over Time 1/
(Number of national currencies under the relative influence of each reserve currency)
A view without the RMBFrankel and Wei’s A view with the RMB Kawai and Pontines’
(1994) methodology (2016) methodology
120 120
1973: End of 1997: Asian Crisis 2007: Global USD EUR GBP JPY RMB
dollar gold financial crisis
100 convertibility 100
80 USD 80
2002: Introduction
EUR
of the euro
60 GBP 1992: ERM Crisis 60
JPY
40 40
20 20
0 0
1973 1978 1983 1988 1993 1998 2003 2008 2013 2003 2005 2007 2009 2011 2013 2015
Source: Fund staff calculations.
Note: For definitions see text.
1/
Balanced sample of 130 countries.
Our estimates indicate a dominant dollar bloc (Figure 4, left-hand panel). The dynamics of
the dollar bloc describe well the impact of major episodes that have affected the international
monetary system over time (green line in Figure 4, left-hand panel). For instance, our
estimates indicate a decline of the dollar’s influence in the early 1970s following the end of
the dollar-gold convertibility. We also find that this episode had transitory effects, as the
dollar rebounded, regaining its lost influence by the late 1970s. Its dominant position
remained stable during much of the eightiesalbeit with a slight declining trend, but the16 1992 crisis of the European exchange rate mechanism (ERM) appears to have given the dollar a new boost at the expense of the “euro” bloc.15 The dollar’s influence before the 21st century appears to have been quite high and stable. However, after peaking in 2002, the number of national currencies under the dollar bloc seem to have started to lose ground with the introduction of the euro. Then, following a brief rebound, the dollar again appeared to lose ground following the 2007-2008 global financial crisis. As discussed by Eichengreen (2011), at the time, some considered that the dollar was in jeopardy, that foreigners could lose faith in the dollar and move away from it as a unit in which to invoice and settle trade, denominate commodities, and conduct international financial transactions. Ultimately, this would imply that the dollar was at risk of losing its “exorbitant privilege” to the euro, the renminbi, or the book keeping claims issued by the International Monetary Fund known as the Special Drawing Rights. However, Eichengreen (2011) himself considers this view misleading. Our estimates support this latter view and indicate that the dollar’s influence has rebounded somewhat in recent years, recovering some of its lost ground, and remaining at historical average levels. Kawai and Pontines’ (2016) methodology (Equation 5) allow us to bring the RMB into the analysis, thus offering an alternative picture, albeit for a narrower historical window of time (2003-2015). The shorter sample captures the RMB’s possible advent as a reserve currency (Figure 4, right-hand panel). The analysis also indicates the dominant influence of the dollar bloc and is consistent with our previous results. And it appears to confirm the decline of the dollar bloc’s influence following the 2007-2008 crisiscoinciding with the global financial crisis, the RMB bloc’s entry to the international scene, and since 2010 with China’s active policies to support the internationalization of its currency (Nabar and Tovar, 2017). However, these results need to be qualified, largely because the estimates also suggest that the influence of the RMB has not continued to progressed further since 2014. Our results are therefore indicative of an international monetary system that has already shifted from a bi-polar bloc (comprised of the U.S. dollar and European or “euro” blocs) to a tri-polar currency bloc, that also includes the Chinese RMB. This characterization is in line with some findings in the literature (e.g., Fratzscher and Mehl, 2013). At the same time, our results indicate that the RMB’s increasing international role has lost steam more recently (for causes, see Lam, et al, 2017). In spite of these shifts, the dollar bloc appears to continue to have the greatest influence across the globe. 15 The European Exchange Rate (ERM) mechanism was a system introduced by the European Economic Community in March 1979 to reduce the exchange rate fluctuations and achieve monetary stability in Europe. This was intended to facilitate the introduction of the euro in 1999. The British pound initially did not join the ERM, but did so in October 1990. However, in September 1992 the pound was forced to leave the ERM after it come under pressures from financial speculators, in what is now called the “Black Wednesday” of September 16, 1992. Other countries breach the bands established by the ERM and had to return to the system with broader bands or adjusted central parities.
17
C. Economic size of currency blocs
Having allocated each country’s currency to a reserve currency bloc, it is now possible to
calculate their economic size. We do this by calculating the global GDP-PPP share under the
influence of each currency bloc. For completeness, we first report the economic importance
of currency blocs obtained by using the absolute influence of reserve currencies (Figure 5)
and then report the economic importance of currency blocs obtained by using the relative
influence of each reserve currency (Figure 6)see Section II.B.
It is important to keep in mind that the methodology employed affects the influence of each
reserve currency bloc. This is because China’s allocation to a currency bloc under each
methodology is different. Since Frankel and Wei’s methodology excludes the RMB, it
automatically assigns China to the dollar bloc. By contrast, Kawai and Pontines’ (2016)
methodology which includes the RMB, allocates China to the RMB bloc. We focus most of
the discussion on the results obtained with this last methodology, but also report complete
results in Tables 2 and 3 and Figures 5 through 7.
Currency bloc’s economic size measured by the absolute influence of reserve currencies
Our analysis indicates that the dollar bloc’s size is the largest in the international monetary
system, independently of the methodology employed (Table 2). Kawai and Potines’
methodology estimates that the economic size of the U.S. dollar bloc reached an average
share of about 40 percent of global GDP between 2011 and 2015. The RMB and the euro
blocs are estimated at an average share of 33 and 20 percent of GDP, respectively. The
results indicate that the dollar bloc’s share in global
Figure 5: Economic Share of each Currency Bloc
(Measured by the absolute influence of reserve currencies, in percent of global GDP-PPP)
Balanced Sample Balanced Sample
(excluding reserve issuing economies)
70 70
USD EUR RMB GBP JPY USD EUR RMB GBP JPY
60 60
50 50
40 40
30 30
20 20
10 10
0 0
2003 2006 2009 2012 2015 2003 2006 2009 2012 2015
Source: IFS and WEO. Fund staff calculations.
Note: For definitions see text.
GDP is lower than the global share of international reserves or of dollar-denominated official
foreign reserve assets. By contrast, the size of the RMB’s bloc across the globe appears to
exceed its own size as measured by the holdings of official foreign reserve assets
denominated in RMB (Table 2).18
Table 2: Economic Size of Currency Blocs
(Measured by the absolute influence of reserve currencies, average 2011-2015, in percent)
Dollar Euro Pound Yen Renminbi
Currency Bloc
Frankel and Wei’s approach
Full sample 1/ 62.4 26.3 6.6 4.7 …
Balanced sample 2/ 64.2 23.2 7.4 5.2 …
Kawai and Pontines’ approach
Full sample 1/ 40.7 19.5 2.5 4.8 32.5
Balanced sample 2/ 39.9 19.6 2.8 5.2 32.5
Memo:
Reserves shares 3/ 63.3 20.3 4.5 4.5 …
Official foreign reserve assets 4/ 54.8 18.1 3.5 3.0 1.0
SDR weights 5/ 41.9 37.4 11.3 9.4 …
SDR weights 6/ 41.73 30.93 8.09 8.33 10.92
Sources: IMF’s International Financial Statistics, COFER, and Survey on the Holdings of Currencies in Official Foreign Currency
Assets. Fund staff calculations.
1/
189 Countries.
2/
130 countries.
3/
As of 2014. At the time the RMB was not considered by the IMF a freely usable currency, and hence was not counted as
part of a country’s international reserves.
4/
As of 2016 Q3.
5/
Pre-October 2016 currency composition.
6/ Post-October 2016 currency composition.
It is possible to think that our estimates of the reserve currency bloc’s size is driven by the
size of the economy issuing the reserve currency. Hence, Figure 5 compares the economic
size of each reserve currency bloc including and excluding the economy issuing the reserve
currency (left-hand and right-hand panels, respectively). While there is a clear level effect,
the results indicate that the ranking of the economic importance of each currency bloc is not
driven by the presence or absence of the economy issuing the reserve currency. Moreover,
they appear to confirm that the rising global influence of the RMB bloc is not exclusively
associated with the increasing size of the Chinese economy itself, but reflects an expanding
influence of the RMB beyond its own borders.
Currency bloc’s economic size measured by the relative influence of reserve currencies
We now present a snapshot of the average economic importance of each currency bloc over
the period 2011-2015as measured by the relative influence of reserve currencies. For this
purpose, we use both the full and balanced sample. We then examine the evolution of the
currency bloc’s size over time using the balanced sample.
Our estimates using the Kawai and Pontines’ methodology indicate that the dollar bloc’s
economic size reached an average share of 39 percent of global GDP over the 2011-2015
period. The RMB currency bloc is estimated to follow with an average share size of 31.6
percent of global GDP, and then the euro bloc with an average share size of 20.3 percent of
global GDP (Table 3). The yen and the pound blocs are estimated to account for an average
relative size of less than 6 percent of global GDP, respectively. Likely, the estimated
importance of the RMB bloc reflects the large size of its constituents, including China itself.19
Measured in PPP terms, we find that in recent years the RMB currency bloc has rivaled in
size the U.S. dollar currency bloc (Figure 6).
Figure 6: Size of Currency Blocs Over Time 1/
(Measured by the relative influence of reserve currencies, in percent of global GDP-PPP)
A view without the RMBFrankel and Wei’s A view with the RMBKawai and Pontines’
(1994) Methodology (2016) Methodology
80 80
USD
70 70 EUR
RMB
60 60
GBP
50 USD JPY
50
EUR
40 40
GBP
30 JPY 30
20 20
10 10
0 0
1973 1977 1981 1985 1989 1993 1997 2001 2005 2009 2013 2003 2005 2007 2009 2011 2013 2015
Source: Fund staff calculations.
Note: For definitions see text. Dotted lines correspond to linear trends.
1/
Balanced sample of 130 countries.
The evolution of the size of currency blocs over time corroborates the cycles described in
Section 3.B (Figure 6). Nonetheless, our results suggest that the dollar bloc’s relative
economic influence displays a slight gradual upward trend when using Frankel and Wei’s
methodology. This appears to be mostly driven by the larger economic share of the dollar’s
constituents. However, we do not find a similar trend with Kawai and Pontines’ approach.
On the contrary, this approach suggests that the share size of the dollar bloc declined
following the global financial crisis, and has stabilized since 2012. The results also appear to
confirm the increasing economic importance of the RMB bloc (Figure 6, right-hand panel)
and that since 2013 the steady increasing influence of the RMB has lost some steam.
As done earlier, we examine the relative size of a reserve currency bloc including and
excluding the reserve-issuing economies. Results indicate that the underlying dynamics have
a level effect, but the ranking is not driven by the economic weight of the reserve-issuing
economies themselves (Figure 7). However, a comparison of Figures 6 and 7 indicate that the
relative decline of the share size of the U.S. dollar bloc after the global financial crisis could
have been sharper and its rebound more modest when excluding the reserve-issuing
economies.20
Table 3: Economic Size of Currency Blocs
(Measured by the relative influence of reserve currencies, average 2011-2015, in percent)
Dollar Euro Pound Yen Renminbi
Currency Bloc
Frankel and Wei’s approach
Full sample 1/ 59.0 27.7 8.3 5.0 …
Balanced sample 2/ 60.1 26.7 7.8 5.4 …
Kawai and Pontines’ approach
Full sample 1/ 39.0 20.3 4.0 5.2 31.6
Balanced sample 2/ 37.9 19.8 4.3 5.6 32.4
Memo:
Reserves shares 3/ 63.3 20.3 4.5 4.5 …
Official Foreign Reserve Assets 4/ 54.8 18.1 3.5 3.0 1.0
SDR weights 5/ 41.9 37.4 11.3 9.4 …
SDR weights 6/ 41.73 30.93 8.09 8.33 10.92
Sources: IMF’s International Financial Statistics, COFER, and Survey on the Holdings of Currencies in Official Foreign Currency
Assets. Fund staff calculations.
1/
189 Countries.
2/
130 countries.
3/
As of 2014. At the time the RMB was not considered by the IMF a freely usable currency, and hence was not counted as
part of a country’s international reserves.
4/
As of 2016 Q3.
5/
Pre-October 2016 currency composition.
6
/ Post-October 2016 currency composition.
Figure 7: Relative Size of Currency Blocs Over Time excluding Reserve Issuing Countries1/
(Measured by the relative influence of reserve currencies, in percent of global GDP-PPP)
A view without the RMBFrankel and Wei’s A view with the RMBKawai and Pontines’
(1994) Methodology (2016) Methodology
45 45
USD USD
40 40 EUR
EUR
35 GBP 35 RMB
GBP
JPY
30 30 JPY
25 25
20 20
15 15
10 10
5 5
0 0
1973 1977 1981 1985 1989 1993 1997 2001 2005 2009 2013 2003 2005 2007 2009 2011 2013 2015
Source: Fund staff calculations.
Note: For definitions see text.
1/
Balanced sample of 130 countries.
D. Robustness analysis
As discussed earlier, there are potential concerns about the robustness of these estimates, in
particular, surrounding the importance of the RMB bloc. To address them, in this subsection,
we examine the robustness of our results across several dimensions, mainly related to: (i) the
selection of the numeraire currency; (ii) the inclusion of all COFER reserve currencies; (iii)21
inclusion of additional currencies to control for the RMB’s wider currency basket; and (iv)
the role of additional controls. In describing the results, we place special emphasis on the
results obtained using Kawai and Potines’ methodology over a balanced sample of 130
countries.
Alternative numeraire currency
In the absence of clear theoretical guidance for the selection of the numeraire currency, it is
natural to ask whether results are robust to the selection of the numeraire currency. Our
benchmark analysis employs the NZD as the numeraire currency on the basis that the
currency arrangement has a well-established freely floating record without capital controls
(see Section II.A). However, the literature has used other numeraires. Moreover, some could
claim that fluctuations of the NZD may reflect movements in the AUD, and therefore reflect
the behavior of a commodity currency, thus biasing our results.
To address such concerns, we re-run the
Figure 8: Currency Bloc’s Size using the CHF
analysis using the Swiss Franc (CHF) as a
as Numeraire Currency
numeraire. The CHF is perceived as a safe
(In percent of global GDP-PPP)
asset and considered by market 60
USD EUR RMB GBP JPY
participants a proxy for investing in gold.
50
Average results over the period 2011-2015
for both measures of the absolute and 40
relative influence are broadly similar to
30
the benchmark specification. Albeit in
these new estimates, we observe some 20
weakening of the USD bloc in favor of the 10
RMB bloc (Tables 4 and 5). A closer look
at the point estimates shows that the 0
2003 2005 2007 2009 2011 2013 2015
relative size of the USD and the RMB Source: Fund staff calculations.
blocs appears to switch. That is, the RMB Note: For definitions see text.
bloc is estimated to surpass the USD bloc
in 2014 (Figure 8).
Controlling for additional reserve currencies
Our benchmark results using Equation (5) may overestimate the size of the RMB’s currency
bloc. To address potential concerns about the accuracy of this estimate, we modify our
benchmark empirical analysis to incorporate in our estimates all major reserve currencies
reported in the IMF’s data on the currency composition of official foreign exchange reserves
(COFER). That is, we include in the estimation of Equation (5) three additional reserve
currencies: the Australian dollar (AUD), the Canadian dollar (CAN), and the Swiss Franc
(CHF).22
Table 4: Economic Size Influence of Currency BlocsRobustness Analysis 1/
(Measured by the absolute influence of reserve currencies, average 2011-2015, in percent of
global GDP-PPP)
Robustness Analysis 2/
Baseline
excluding Wider set of
Baseline Additional
reserve issuing Alternative Additional reserve reference
controls
countries numeraire currencies 3/ currencies for
the RMB
Dollar 39.9 22.0 38.1 37.1 39.6 40.3
Euro 19.6 6.9 19.2 16.6 19.9 17.3
Pound 2.8 0.1 4.3 2.7 2.8 4.2
Yen 5.2 0.0 5.2 5.2 5.2 5.2
Renminbi 32.5 14.7 33.1 28.7 32.5 32.9
Sources: International Financial Statistics and World Economic Outlook. Fund staff calculations.
1/ 130 countries.
2/ For a decription of the robustness analysis see text.
3/ Sum does not add to one as other reserve currencies are included in the estimation.
The range estimates are reported in Figure 9, both for the absolute and relative influence of a
currency bloc. As shown, the range estimates put the average economic share size of the
RMB’s currency blocas measured by the absolute influence of the currencysomewhere
between 29 percent (lower bound estimate) and 33 percent (upper bound estimate) of global
GDP over the period 2011-2015 (Table 4).16 The average size of the RMB bloc measured by
the relative influence of the reserve currency is estimated to fall somewhere between 27 and
32 percent of GDP over the same period (Table 5). Quite importantly, Figure 9 indicates that
the dispersion of the range has widened somewhat in recent years, which may reflect the
increasing role of some of these alternative currencies as safe haven assets.
Figure 9: Range Bound Estimate of the RMBs’ Currency Bloc when Including Additional
Reserve Currencies in the Baseline Specification
(In percent of global GDP-PPP)
Absolute influence Relative Influence
40 40 33.8
29.8
30 30
20 20 21.7
19.8
10 Baseline 10
Baseline
with all COFER reserve currencies with all COFER reserve currencies
0 0
2003 2005 2007 2009 2011 2013 2015 2003 2005 2007 2009 2011 2013 2015
Source: IFS and WEO. Fund staff calculations.
Note: For definitions see text.
16
We must note that estimates show minor changes to the size of the dollar or the euro’s currency bloc, with
most of the adjustment taking place in the estimates of the pound sterling and the Japanese yen.23
Table 5: Economic Influence of Currency BlocsRobustness Analysis 1/
(Measured by the relative influence of reserve currencies, average 2011-2015, in percent of
global GDP-PPP)
Robustness Analysis 2/
Baseline
excluding Wider set of
Baseline Additional
reserve issuing Alternative reference Additional
reserve
countries numeraire currencies for controls
currencies 3/
the RMB
Dollar 37.9 20.0 36.0 34.3 37.4 38.2
Euro 19.8 7.1 19.5 16.3 20.1 18.0
Pound 4.3 1.6 6.0 3.0 4.3 4.0
Yen 5.6 0.4 5.4 5.5 5.6 5.8
Renminbi 32.4 14.6 33.1 27.4 32.5 34.0
Sources: International Financial Statistics and World Economic Outlook. Fund staff calculations.
1/ 130 countries.
2/ For a decription of the robustness analysis see text.
3/ Sum does not add to one as other reserve currencies are included in the estimation.
Controlling for a wider set of reference currencies for the RMB
The value of the RMB was pegged to the dollar until 2005. Since then, China has been
transitioning out of this peg. To this end, it is often argued that the currency has been allowed
to float in a narrow margin around a fixed-base rate determined with reference to a basket of
world currencies. This implies that the benchmark estimation of Eq. (3) could have a bias if it
fails to include all relevant reference currencies. To check the sensitivity of our results, we
include in the estimation of Eq. (3) eight additional currencies, including the Australian
dollar (AUD), Hong Kong dollar (HKD), Malaysian Ringgit (MYR), Russian ruble (RUB),
Singaporean dollar (SGD), Thai baht (THB), Canadian dollar (CAD), and Swiss franc
(CHF). Including a wider set of reference currencies for the RMB appears to have little
impact of the size of the RMB’s blocfor both measures of the absolute and relative
influence of the reserve currency (Tables 4 and 5, and Figure 10, left hand panel).
Additional Controls
Finally, we checked whether our results are robust to the inclusion of additional control
variables, such as the change in oil prices, global liquidity (captured by the spread between
the U.S. short term interbank rate and the U.S. Treasury bill rate), or the degree of
uncertainty (as capture by the VIX). Our results indicate that these additional controls in
Eq.(4) do not have a significant impact relative to benchmark specification. Qualitatively, the
baseline results appear to remain the same. If any, the main difference is the timing at which
the RMB bloc is estimated to surpass the EUR bloc. With additional controls this is estimated
to occur in 2008, while in the benchmark specification this only happens in 2011 (Figure 10,
right hand panel).24
Figure 10: Currency Blocs’ SizeSensitivity Analysis
(Measured by the relative influence of reserve currencies, in percent of global GDP-PPP)
Wider set of reference currencies for the RMB Additional Controls
80
80 USD
USD
70 EUR
70 EUR
GBP
60 RMB 60
JPY
GBP
50 RMB
50 JPY
40 40
30 30
20 20
10 10
0 0
2003 2005 2007 2009 2011 2013 2015 2003 2005 2007 2009 2011 2013 2015
Source: IFS and WEO. Fund staff calculations.
Note: For definitions see text.
IV. WHAT DETERMINES THE RELATIVE IMPORTANCE OF RESERVE CURRENCIES?
The importance of reserve currencies and, therefore, the size of a reserve currency bloc, is
likely to be a function of the forces that determine the currency’s global reserve status. That
is, of the forces that make them attractive as a unit of account, medium of exchange (means
of payment), and store of value. Research has shown that both the size and structure of the
economy and financial markets matter, as well as its degree of integration and
interconnection—e.g., as captured by the degree of financial integration and trade openness.
Also, some authorities in the past have promoted the use of their currency while others
deliberately chose not to support currency internationalizationas was the case with the
German Deutsche mark in the 1970s when the authorities introduced capital controls to
discourage its international use (Eichengreen, 2011; Nabar and Tovar, 2017).
The international influence of a currency is also likely to depend on its stability, which in
turn hinges on the creditworthiness of the sovereign as captured by stable, sustainable, and
predictable macroeconomic outcomes. These outcomes tend to manifest themselves in low
and stable inflation, sustainable public and external positions, and strong
institutionsincluding a reliable rule of law.
Finally, it is common to see in the literature that network externalities affect the persistence
of reserve currencies’ global influence. This together with the development of deep and
liquid financial markets on-shore and off-shore—especially for sovereign debt trading—help
induce a virtuous cycle that reinforces the influence of reserve currencies across the world
(Eichengreen, 2011).
In this section, we briefly examine how these different factors correlate with the relative
importance of each currency bloc. The estimates obtained using Kawai and Pontines’
approach result in measures that have a short time span, which constrains their use for
econometric analysis. Results obtaining Frankel and Wei’s approach provide for a longerYou can also read