Rice paddy soils are a quantitatively important carbon store according to a global synthesis
←
→
Page content transcription
If your browser does not render page correctly, please read the page content below
ARTICLE
                  https://doi.org/10.1038/s43247-021-00229-0                OPEN

                  Rice paddy soils are a quantitatively important
                  carbon store according to a global synthesis
                  Yalong Liu1,2,3, Tida Ge 2,4 ✉, Kees Jan van Groenigen 5 ✉, Yuanhe Yang 6, Ping Wang1, Kun Cheng7,
                  Zhenke Zhu2, Jingkuan Wang1, Yong Li2, Georg Guggenberger2,3, Jordi Sardans8,9, Josep Penuelas 8,9,
                  Jinshui Wu2 & Yakov Kuzyakov 10,11

                  Rice paddies account for ~9% or the world’s cropland area and are characterized by envir-
                  onmental conditions promoting soil organic carbon storage, methane emissions and to a
1234567890():,;

                  lesser extent nitrous oxide emissions. Here, we synthesize data from 612 sites across 51
                  countries to estimate global carbon stocks in paddy soils and determine the main factors
                  affecting paddy soil carbon storage. Paddy soils (0–100 cm) contain 18 Pg carbon worldwide.
                  Paddy soil carbon stocks decrease with increasing mean annual temperature and soil pH,
                  whereas mean annual precipitation and clay content had minor impacts. Meta-analysis shows
                  that paddy soil carbon stocks can be increased through several management practices.
                  However, greenhouse gas mitigation through paddy soil carbon storage is generally out-
                  weighed by increases in methane and nitrous oxide emissions. Our results emphasize the key
                  role of paddies in the global carbon cycle, and the importance of paddy management in
                  minimizing anthropogenic greenhouse gas emissions.

                  1 Key Laboratory of Arable Land Conservation (Northeast China), Ministry of Agriculture and National Engineering Laboratory for Efficient Utilization of Soil

                  and Fertilizer Resources; College of Land and Environment, Shenyang Agricultural University, Shenyang, Liaoning, China. 2 Key Laboratory of Agro-ecological
                  Processes in Subtropical Region and Changsha Research Station for Agricultural and Environmental Monitoring, Institute of Subtropical Agriculture, Chinese
                  Academy of Sciences, Changsha, Hunan, China. 3 Institute of Soil Science, Leibniz Universität Hannover, Hannover, Germany. 4 State Key Laboratory for
                  Managing Biotic and Chemical Threats to the Quality and Safety of Agro-products, Key Laboratory of Biotechnology in Plant Protection of Ministry of
                  Agriculture and Zhejiang Province, Institute of Plant Virology, Ningbo University, Ningbo, China. 5 Department of Geography, College of Life and
                  Environmental Sciences, University of Exeter, Exeter, RJ, UK. 6 State Key Laboratory of Vegetation and Environmental Change, Institute of Botany, Chinese
                  Academy of Sciences, Beijing, China. 7 Institute of Resource, Ecosystem and Environment of Agriculture, Nanjing Agricultural University, Nanjing, Jiangsu,
                  China. 8 CSIC, Global Ecology Unit, CREAF-CSIC-UAB, Bellaterra, Barcelona, Catalonia, Spain. 9 CREAF, Cerdanyola del Vallès, Barcelona, Catalonia, Spain.
                  10 Department of Soil Science of Temperate Ecosystems, Department of Agricultural Soil Science, University of Goettingen, Goettingen, Germany. 11 Agro-

                  Technological Institute, RUDN University, Moscow, Russia. ✉email: gtd@isa.ac.cn; kj.vangroenigen@exeter.ac.uk

                  COMMUNICATIONS EARTH & ENVIRONMENT | (2021)2:154 | https://doi.org/10.1038/s43247-021-00229-0 | www.nature.com/commsenv                                   1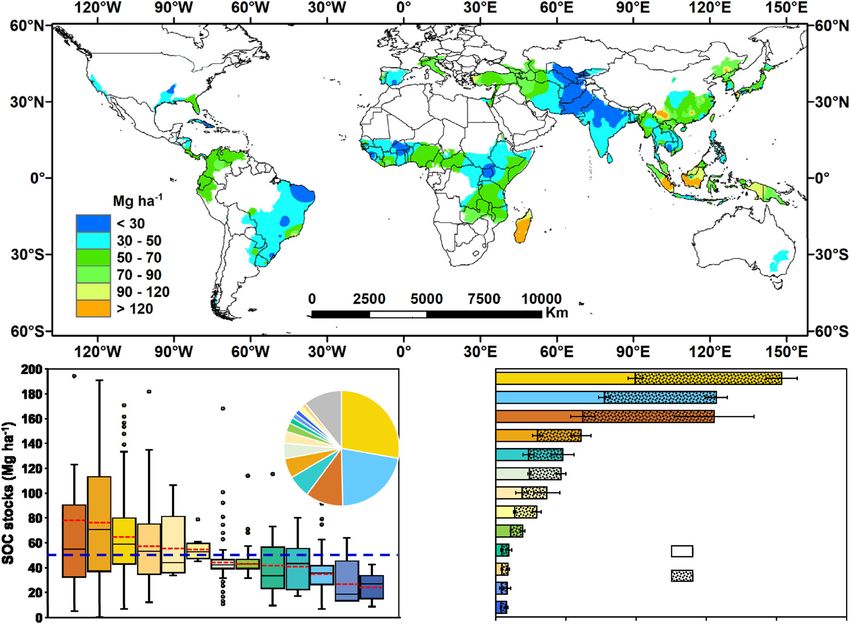
ARTICLE                                             COMMUNICATIONS EARTH & ENVIRONMENT | https://doi.org/10.1038/s43247-021-00229-0

S
       oils contain the largest reservoir of terrestrial organic car-          We found that paddy soils (0–100 cm) contain 18 Pg SOC
       bon (C) and they are a main natural source of atmospheric            worldwide, ~1.2% of the global SOC pool, corresponding to 14%
       carbon dioxide (CO2)1. Soil organic carbon (SOC) is widely           of the total SOC pool in croplands. Paddy SOC stocks decrease
recognized as a key element of soil fertility, and croplands with           with increasing mean annual temperature and soil pH, but mean
high SOC contents have better structure and lower risks of                  annual precipitation and clay content had minor impacts. Meta-
erosion2. Insights into the global distribution of SOC stocks and           analysis further indicates that paddy SOC stocks (0–30 cm)
the effects of environmental variables will thus improve estimates          increase with fertilization (9–32%), straw return (13%), and
of C-climate feedbacks, and may contribute to agricultural poli-            conservation tillage (8–10%). However, climate benefits of SOC
cies designed to improve soil quality3–5. Over the last decade,             storage in paddies are generally negated by increases in CH4 and
SOC stocks have been increasingly estimated at global and                   N2O emissions.
regional scales for numerous ecosystems, including croplands6,
grasslands7, wetlands8,9, and forests10,11. However, even though
                                                                            Results
rice paddies cover ~9% of the global cropland area and provide
                                                                            Our database included information about rice paddies between
staple food for roughly half the world’s population12, a global
                                                                            48°N and 38°S and between 147°E and 90°W. The distribution of
assessment of SOC stocks in rice paddies is still lacking.
                                                                            sites was skewed towards low elevations, with most sites located
   Paddy soils are anthropogenic soils (Anthrosols) for cultivation
                                                                            below 200 m a.s.l. (Fig. 1b). The SOC content in the topsoil of
of rice, which are intentionally flooded and puddled, i.e., tilled
                                                                            most sites (>70%) ranged from 7 to 16 g kg−1, with a mean of
under water saturated conditions. Paddy soils are widely dis-
                                                                            13.8 g kg−1. The bulk density (BD) of the topsoil at most
tributed from temperate to tropical climates on all continents, but
                                                                            sites (>70%) ranged between 1.2 and 1.6 g cm−3, with a mean of
mainly in Asia. Rice paddies can be established on various natural
                                                                            1.3 g cm−3 (Supplementary Fig. 1).
and previously agriculturally used soil types, and on various
                                                                               The estimated global average SOC stock of rice paddies is 108
parent materials, but are highly modified by management prac-
                                                                            Mg ha−1 for the 0–100 cm layer, ~10% higher than the global
tices during rice-paddy cultivation13. Because rice paddies are
                                                                            average for all soils (Table 1). Average SOC stocks in rice paddies
frequently flooded and puddled, their properties differ sub-
                                                                            are lower than for mangroves, forests, and wetlands, but sub-
stantially from those of all other arable upland soil. Anaerobic
                                                                            stantially higher than for grasslands and croplands (Table 1).
conditions induced by flooding slow down organic matter
                                                                            Totaled across the globe, the upper 1 m of paddy soils contains 18
decomposition, and thus beneficial to SOC accumulation14. At
                                                                            Pg (95% CI: 17.2–18.9) organic C. This amounts to ~1.2% of the
the same time, these anaerobic conditions promote CH4 pro-
                                                                            global SOC pool, or ~14.2% of the total SOC pool in croplands
duction by methanogens, making rice paddies a main source of
                                                                            worldwide (Table 2).
anthropogenic CH4 emissions15.
                                                                               Topsoil paddy SOC stocks ranged between 7 and 330 Mg ha−1
   The development of efficient irrigation techniques led to
                                                                            (Fig. 2a). Mean SOC stocks increased with latitude (p < 0.01),
expansion of the global paddy area by >30% since the 1960s16.
                                                                            from 50 Mg ha−1 in the tropics to 62 Mg ha−1 in temperate
During this period, rising levels of mineral fertilizer application
                                                                            regions (Supplementary Fig. 2). Topsoil SOC stocks in rice pad-
and subsequent increased straw return to soil stimulated SOC
                                                                            dies differed more than three fold between main rice-producing
storage in paddy soils around the world17,18. For example, the
                                                                            countries (Fig. 2b): paddies in Indonesia and Vietnam had the
topsoil layer (0–30 cm) of rice paddies in China store ~30%
                                                                            highest SOC stocks (~78 Mg ha−1), whereas paddies in Pakistan,
more SOC (45 Mg ha−1) than corresponding upland soils (35
                                                                            Cambodia, Africa, and Central and South America contained less
Mg ha−1)19. Therefore, changes in the C pool size of paddies
                                                                            than 30 Mg C ha−1. Paddies in China, India, and Indonesia
could strongly affect atmospheric CO2 concentrations. How-
                                                                            together accounted for ~56% of the global paddy SOC pool
ever, the size of global rice-paddy SOC pool is still unclear. On
                                                                            (Fig. 2c).
a global scale, SOC stocks in upland soils increase with pre-
                                                                               Correlation analyses indicated that paddy SOC stocks are
cipitation and clay content and decrease with temperature20,
                                                                            mainly determined by soil pH and mean annual temperature
but the main environmental and management factors affecting
                                                                            (MAT), and to a much smaller extent by mean annual pre-
paddy SOC stocks at different climates have not yet been
                                                                            cipitation (MAP) and clay content (Table 3). SOC stocks
determined. This information could help to optimize agrono-
                                                                            decreased with increases in pH and MAT, and slightly increased
mical management designed to enhance SOC sequestration,
                                                                            with increasing MAP and clay content.
inform agricultural policy measures designed to improve soil
                                                                               Our meta-analysis indicates that N fertilization increased SOC
quality, and predict the potential impacts of climate changes on
                                                                            stocks by 9% on average, whereas combined NPK application
SOC stocks.
                                                                            doubled the increase in SOC stocks compared to sole N fertili-
   Several recent studies have reported paddy SOC stocks in
                                                                            zation application (Fig. 3). Organic fertilizer application alone
regions that were previously underrepresented in rice-paddy
                                                                            and combined with NPK increased SOC stocks by 19% and 32%,
research, such as South America and Africa (e.g., ref. 21). With
                                                                            respectively. Returning straw to the soil increased C stocks by
SOC inventories now being available for most of the world’s rice-
                                                                            13%. Compared to conventional tillage practices, no-till and
growing areas, a data synthesis may reduce the uncertainty
                                                                            reduced tillage increased SOC stocks by 10% and 8%, respectively.
regarding paddy soil C stocks and identify practices and areas
with high potential for soil C storage. We thus conducted a global
synthesis of SOC stocks in the topsoil (0–30 cm) and subsoil                Discussion
(30–100 cm) of rice paddies, including data from 612 sites around           Our data synthesis and meta-analysis reveal the importance of
the world (Fig. 1a; see Methods and Supplementary Data 1). Our              rice paddies for the global C cycle. Per unit area, paddy soils
objectives were (1) to determine climatic factors, soil properties,         contain more SOC than upland agricultural soils14,22. Whereas
and management practices that affect SOC stocks of paddy top-               rice paddies occupy less than 9% of the global cropland area, they
soils on a global scale; (2) to compare paddy SOC storage between           harbor more than 14% of its SOC stocks (Table 2). These large
the main rice-producing countries and their contribution to the             SOC stores can be explained by anaerobic conditions of rice
global paddy SOC pool; and (3) to determine the contribution of             paddies after flooding, slowing down decomposition rates and
SOC storage in paddy soils to the global terrestrial and agri-              thus, increasing soil C accumulation compared to other cropland
cultural SOC pool.                                                          types13,23–25.

2           COMMUNICATIONS EARTH & ENVIRONMENT | (2021)2:154 | https://doi.org/10.1038/s43247-021-00229-0 | www.nature.com/commsenv
COMMUNICATIONS EARTH & ENVIRONMENT | https://doi.org/10.1038/s43247-021-00229-0 ARTICLE
Fig. 1 Overview of spatial ranges of the study. a Distribution of the sites from the peer-reviewed literature reporting paddy SOC stocks (612 sites). Areas
with rice paddies are colored green. b Frequencies in absolute cases of the global distribution of elevation, latitude, and longitude for paddies.
The MAP was less important than MAT in determining C
stocks because of the regular flooding of paddy fields. High
Table 1 Recent estimates of SOC stocks for the world’s main
temperatures and rainfall in the tropics typically stimulate plant
terrestrial ecosystems.
productivity32, but accelerated SOM decomposition negate or
even override the effects of increased C inputs from plant pro-
Ecosystem Global mean SOC stock (Mg References duction on C stocks33. Similarly, the slowing down of SOC
ha–1) decomposition rates with decreasing temperature34 explains the
0–30 cm 0–100 cm increase in C stocks with latitude.
All soils 45 98 4 Since paddy soils can develop from different parent materials,
Cropland 41a 89 3,6 their initial mineralogy, texture, and fertility can vary
Mangrove 130a 283 11 considerably13. However, prolonged rice cultivation masks initial
Forest 87a 189 10 soil characteristics and minimizes the influence of parent material
Grassland 38a 82 7 on pedogenic features (e.g., ref. 35). This likely explains why clay
Wetland 107a 233 8 content explained less of the variation in SOC stock than did
Rice paddy 51 (49–53) 108 (103–113) This study other environmental factors (e.g., pH and MAT, Table 3). Upland
Numbers in parentheses indicate 95% confidence intervals.
soils with high clay contents generally store more C than sandy
aSOC stocks in the 0–30 cm layer are estimated by assuming that this layer contains 46% of the soils36, because clay minerals provide binding surfaces for organic
SOC stock in the 0–100 cm layer1. matter and creates anoxic microsites within aggregates. Soil
aggregation has minor impact on C dynamics by regular
SOC stocks were best predicted by soil pH (Table 3). This puddling35, and strongly variable redox conditions may reduce
supports previous reports that soil acidity strongly affects the formation and stability of organic matter-clay complexes37.
ecosystem C balances (e.g., ref. 26). pH regulates several soil Other recent SOC inventories also suggested that clay contents
properties and processes that play key roles in determining C accounted for a small amount of variation in SOC stocks in rice
stocks. For example, the solubility of organic matter decreases paddies38. Rather, SOC stabilization in paddies is largely regu-
under low pH by formation of organic matter complex with lated by thermodynamic constraints of organic matter decom-
polyvalent metal ions such as iron and aluminum26,27. Conse- position under anaerobic conditions39.
quently, leaching of dissolved organic matter will be reduced. The impact of environmental factors on paddy soil C stocks
Furthermore, low soil pH values slow down litter decomposi- can explain some of the main differences between countries. For
tion by reducing enzyme activity28,29 and by changing the instance, average paddy SOC stocks were 1.8-fold larger for China
composition of microbial communities30,31. (65 Mg ha−1) than India (36 Mg ha−1). The difference between
COMMUNICATIONS EARTH & ENVIRONMENT | (2021)2:154 | https://doi.org/10.1038/s43247-021-00229-0 | www.nature.com/commsenv 3ARTICLE COMMUNICATIONS EARTH & ENVIRONMENT | https://doi.org/10.1038/s43247-021-00229-0
Table 2 Estimates of global land area, global cropland area, global paddy area, and soil organic carbon (SOC) storage.
Global area (ha) Contribution rice paddy (%) SOC storage (Pg C) Contribution rice paddy (%)
0–30 cm 30–100 cm 0–100 cm
All land 1.49 × 10¹⁰ 1.1 710b 746b 1456b 1.2
Cropland 1.87 × 10⁹a 8.9 58.4c 68.6c 127d 14.2
Rice paddies 1.67 × 10⁸a – 8.5 (8.2–8.9)e 9.5 (9.0–10.0)e 18.0 (17.2–18.9)e –
Numbers in parentheses indicate 95% confidence intervals.
aUSGS statistical databases (http://www.usgs.gov/; USGS, 2017).
bFAO maps of pools of organic carbon by inverted classification schemes4.
cSOC stocks in the 0–30 cm layer were estimated assuming that this layer contains 46% of the SOC stock in the 0–100 cm layer1.
dFAO/UNESCO statistical data3,6.
eThis study.
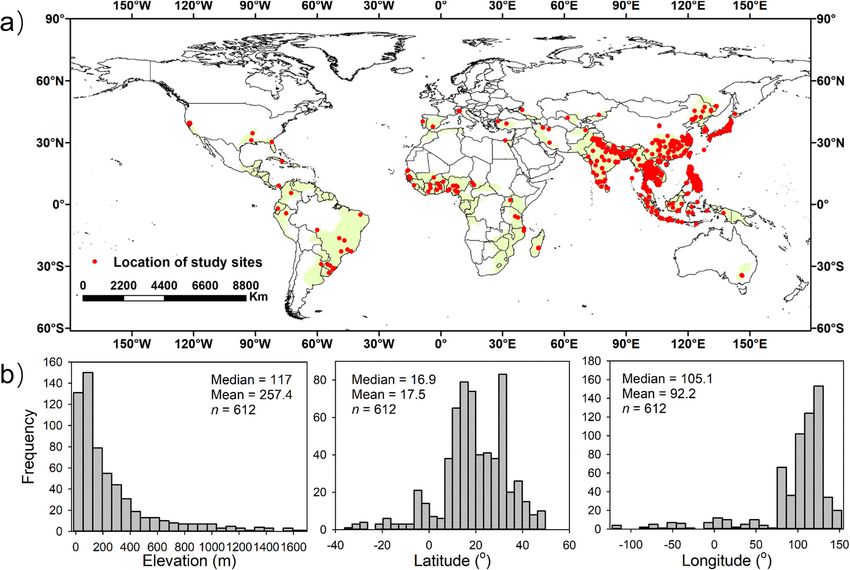
Fig. 2 Map view and soil organic C stocks of the main rice-producing countries. a Spatial distribution of SOC stocks in paddy topsoil (0–30 cm). b
Boxplots of SOC stocks in the topsoil (0–30 cm) of the 13 countries. Upper and lower bars: 95th and 5th percentiles of all observations, respectively; top
and bottom of boxes: third and first quartiles; black horizontal solid lines in boxes: median values; red dashed lines: mean values. Blue dashed lines indicate
global average SOC stock (51 Mg ha−1). The embedded pie chart shows the percentage contribution of each country to global rice production. Countries
are arranged by decreasing mean SOC stocks per ha: INA Indonesia, VIE Vietnam, CHN China, JPN Japan, MYA Myanmar, NGR Nigeria, THA Thailand, PHI
Philippines, BRA Brazil, BNA Bangladesh, IND India, PAK Pakistan, CAM Cambodia. The numbers below the x-axis indicate the number of datapoints for
each country. Three datapoints for Indonesia fell outside the y-axis; these data were included in SOC stock calculations. c Total paddy SOC stocks in the
topsoil (0–30 cm) and the 100 cm profile in the 13 countries. The contributions of paddy SOC stocks (0–100 cm) to the global paddy SOC stock for each
country are shown as percentages. Error bars indicate standard errors (±SE).
countries partly reflects the specifics of climate; Chinese rice- Management practices also strongly affect paddy SOC stocks,
growing regions predominantly have subtropical climates, which probably explains the relatively low amount of variation
whereas Indian rice-growing regions have predominantly hot explained by environmental factors (Table 3) compared to non-
tropical climates40. Compared to other climate zones, the rate of agricultural upland soils (e.g., ref. 19). Our global meta-analysis
paddy SOC decomposition in tropical climates is fast40. corroborates previous national syntheses of paddy SOC dynamics
4 COMMUNICATIONS EARTH & ENVIRONMENT | (2021)2:154 | https://doi.org/10.1038/s43247-021-00229-0 | www.nature.com/commsenvCOMMUNICATIONS EARTH & ENVIRONMENT | https://doi.org/10.1038/s43247-021-00229-0 ARTICLE
Table 3 Correlation coefficients (R) and stepwise regression for C storage under no-till. However, due to data paucity, our
model between SOC stocks, climatic variables (MAT, n = meta-analysis only considered C stocks in the top 30 cm. SOC
gains in upper soil layers under no-till can be partly offset by
612, and MAP, n = 612), and soil properties (pH, n = 519,
losses at lower depths52, thereby reducing the SOC storage
and clay content, n = 440).
potential. Thus, to improve estimates of paddy SOC storage
potential under no-till, whole profile analyses are still needed.
Factor Climate Soil Our meta-analysis also explains some of the differences in SOC
MAT MAP pH Clay content stocks between countries. For instance, rice paddies in eastern
Pearson R –0.17*** 0.15* –0.27*** 0.08* Asia (China, South Korea, and Japan), western Indonesian islands
Partial R –0.27*** 0.12* –0.28*** 0.11* and Madagascar contained more SOC per area unit than paddies
Stepwise regression model SOC = 149 − 10 × pH − 2.2 × MAT + in western Africa, southern Asia, and South and Central America
0.3 × Clay + 0.005 × MAP R = 0.40, (Fig. 2a). These differences can be partly explained by manage-
p < 0.001, n = 403 ment practices: farmers in southern/southeastern Asia and Africa
often cannot afford sufficient mineral fertilizers to improve crop
*p < 0.05.
***p < 0.001. yield and support soil C storage53. Rice straw is also often
removed for fodder and other uses in these regions54, thereby
reducing soil C input rates and C stocks even further (Fig. 3). In
contrast, high fertilizer application rates and high levels of crop
N 23
residue return in China55–57 contribute to high soil C stocks in
NPK 73
Chinese rice paddies.
OF 84
Another factor that might explain low soil C stocks in Africa
NPK+OF 52 might be the age of rice paddies. To feed a growing world
population and to accommodate changing diets, global croplands
No-tillage 69 have expanded by an average of 4 million hectares per year in
Reduced-
tillage
25 recent decades58. Paddy expansion rates during this time differed
strongly between continents, with half of the new global paddy
Straw return 119
area being located in Africa16. African rice paddies contain
0 10 20 30 40 relatively low amounts of initial SOC compared to other
Change in SOC stocks (%) continents8, suggesting a high potential of C sequestration. Our
results also indicate considerable potential for paddy soil C
Fig. 3 Results of a meta-analysis on the effects of management practices
sequestration in southern Asia, the central Indochina Peninsula
on paddy SOC stocks (0–30cm). Error bars indicate 95% confidence
and eastern South America (Fig. 2a). Realizing this potential
intervals. The number of observations included in the meta-analysis is
requires adoption of recommended management practices such
shown next to the corresponding data point. OF organic fertilizer. Dashed
as crop residue incorporation, conservation tillage associated with
vertical line shows the average of all agronomical practices on the SOC
seldom (once per 10–15 years) deep tillage, crop rotations with
increase. The effects of all presented management practices are significant
inclusion of grasses, legumes and deep rooting crops, and inte-
(p < 0.05).
grated nutrient management with pH adjustment through
liming2,59. Promoting these practices will require new environ-
under various management practices41,42. C gains in fertilized mental and economic policies. For instance, aggregating small
soils are explained by N and other nutrients stimulating plant cropland patches can facilitate efficient fertilizer application,
growth and rhizodeposition, thereby increasing soil C input whereas farmer subsidies could provide an incentive for straw
rates43. Fertilizer N addition can also stimulate soil C storage by incorporation and rotations with deep rooting crops56.
slowing down the decomposition of plant litter and SOM (e.g., Even though rice paddies store more SOC than the global
refs. 44,45). Specifically, N additions might reduce so-called average, this does not necessarily mean that the recent expansion
“microbial N mining”, whereby nutrient-poor conditions (e.g., in paddy area equates to a net climate benefit. First, new rice
low N) stimulate recalcitrant SOC decomposition by N-acquiring paddies are often established in ecosystems with relatively high
microbes46–48. Furthermore, organic fertilizers are additional C soil C stocks, such as wetlands60,61. Second, rice paddies require a
input into soil. Finally, organic fertilizers stimulate the succession considerable amount of global irrigation water, accounting for
of microbial communities favorable to SOC accumulation49. 20% of total freshwater withdrawals by crops62. Pumping this
However, in addition to previous findings (e.g., ref. 42), significant water requires energy, which in turn causes ancillary CO2 emis-
differences in SOC stocks were recorded between organic fertili- sions. In gravity-fed irrigation systems or when pumping water
zers (OF) and mineral plus organic fertilizers (NPK + OF). High from shallow aquifers this energy requirement can be minimal,
N and other nutrient levels increase microbial growth on the but it can be high with diesel-based groundwater extraction
available C pools, and so more necromass will be produced, systems or when using electricity not generated by hydropower63.
which is a main component of SOM48. Finally, and most importantly, CH4 emissions from rice paddies
Our estimates of no-till effects on paddy SOC stocks are are substantially higher than for other staple crops62,64, and rice
quantitatively similar to no-till effects observed in upland soils50 paddies also produce considerable amounts of N2O (e.g., ref. 15).
and indicate potential for SOC storage. Conservation tillage Thus, any benefits in terms of soil C sequestration with rice-
increases soil C storage by reducing aeration and the oxidative paddy establishment need to be considered against a backdrop of
decomposition of SOC at periods of paddy soil drainage40 and by increased greenhouse gas (GHG) emissions.
increasing the physical and chemical protection of C from Soil C storage and GHG emissions can be compared directly by
microbial attacks through organo-mineral associations51. Fur- expressing them in CO2 equivalents, using the global warming
thermore, conservation tillage reduces C losses associated with potential (GWP) values over a 100 year time horizon relative to
erosion40. Many paddies, especially in Asia, have been con- CO2, i.e., 34 for CH4 and 298 for N2O65. Global average GHG
tinuously tilled for hundreds to thousands of years. These prac- emissions from rice paddies have previously been estimated as
tices likely depleted soil C stocks27, suggesting further potential 6300 kg CO2-eq ha−1 yr–1 for CH416 and 280 kg CO2-eq ha−1 yr−1
COMMUNICATIONS EARTH & ENVIRONMENT | (2021)2:154 | https://doi.org/10.1038/s43247-021-00229-0 | www.nature.com/commsenv 5ARTICLE COMMUNICATIONS EARTH & ENVIRONMENT | https://doi.org/10.1038/s43247-021-00229-0
for N2O15 (Supplementary Table 1). Average annual soil C storage emissions. These data underline the importance of paddies in the
in rice paddies can be estimated from average rice yields16 and terrestrial C cycle, and should be used to improve global C
previously reported conversion factors66,67, and amounts to inventories and to inform policy advice related to land use.
roughly 314 kg CO2-eq ha−1 yr−1, i.e., an order of magnitude less
than the combined emissions of CH4 and N2O (Supplementary Methods
Table 1). Our estimates are corroborated by field studies showing Data collection. We used Web of Science, Google Scholar, and China National
that even after accounting for soil C storage, rice paddies remain a Knowledge Infrastructure to search for studies published between 1999 and 2019,
applying the search terms “paddy AND soil organic carbon” and “rice AND soil
large net source of GHGs (e.g., refs. 68–70. Supplementary Table 2). organic carbon”. We only considered studies reporting contents for soil organic
Management practices that increase SOC sequestration in rice carbon (SOC) or soil organic matter (SOM) and sampling depth for the quanti-
paddies need to account for increased CH4 emissions as well. tative determination of paddy SOC storage (excluding upland rice). For each study
Even though rice straw incorporation stimulates soil C storage, it we tabulated SOC contents and sampling depth; we also tabulated soil bulk density
(BD) data when these were reported. We selected a total of 239 publications
more than doubles CH4 emissions from rice paddies on
reporting 2234 sets of raw data from rice paddies around the world for analyses
average71. Previous syntheses suggest that the net effect of these (see Supplementary Data 1). To avoid data duplication, we checked the latitude and
two responses is negative, i.e., straw incorporation constitutes a longitude of all the sites included in our dataset, and we eliminated duplicated sites.
net source of GHG emissions72. Whereas reduced till and no-till Finally, our dataset included 612 sampling locations in 50 countries (out of 118
practices generally increase paddy soil C stocks, their effect on rice-producing countries, Fig. 1a) encompassing 95% of the global paddy area and
98% of the global rice production.
CH4 emissions remains uncertain, with recent syntheses sug- We also tabulated the following information for each study: (1) geographical
gesting either increases73 or decreases74 in CH4 emissions with location of sites (latitude, longitude, elevation above sea level, and country), (2)
no-till. Higher surface SOC with no-till may stimulate CH4 climatic conditions (mean annual temperature, MAT; and mean annual
production by increasing the availability of organic substrates75. precipitation, MAP), and (3) properties of the paddy soil (pH and clay content).
Missing data for latitude, longitude, and elevation were estimated using Google
On the other hand, increased soil macroporosity and soil pore Maps (https://maps.google.com/). Missing data for MAT and MAP were obtained
continuity with no-till may accelerate gas diffusion and increase from https://en.climate-data.org/.
CH4 oxidation76. The net effect of these opposing mechanisms is
still unclear, and further research is needed to determine which of Data processing
these mechanisms dominates under which conditions. Fertilizer Estimating missing data for SOC content and BD. Paddy SOC stocks were calcu-
N addition not only stimulates paddy SOC storage; it also sti- lated separately for the topsoil (0–30 cm) and subsoil (30–100 cm) to facilitate a
comparison between our results and global SOC storage data in the Harmonized
mulates N2O emissions from rice paddies77. The effect of fertilizer World Soil Database86. Original data reported as SOM content were converted to
N on CH4 emissions depends on application rates, with positive SOC content using the conventional “van Bemmelen factor” of 1.72487.
effects at low and medium rates, but negative effects at very high Most SOC data in our database were for soil layers to a maximum depth of
rates77. The increase in GHG emissions with fertilizer addition 30 cm or less. To extrapolate these data to lower depths, we used a subset of
42 studies that reported SOC contents for 409 profiles ≥50 cm. We assume that soil
generally outweighs the climate benefit of soil C storage68,69. compaction was similar across all the profiles and could be extrapolated to other
Moreover, the manufacturing and distribution of fertilizer SOC data in the deep soil. The relative ratio of SOC content (RRSOC, see ref. 88) was
requires energy and thus produces ancillary CO2 emissions, first calculated as:
possibly negating climate benefits78. In addition, excessive ferti- RRSOC ¼ SOCbelow =SOCsurface ð1Þ
lizer N application in rice paddies causes a range of other
where SOCsurface is the SOC content (g kg−1) of surface soil and SOCbelow is the
environmental problems79. SOC content below the surface soil for various depths in the profile. Combing the
Although rice agriculture represents a large net source of data for all studies in the subset, the relationship between RRSOC and soil depth
GHGs compared to other staple crops, it also shows large could be described by a logarithmic curve (Supplementary Fig. 3, R2 = 0.63, n =
potential for GHG mitigation through management64. For 1227, see ref. 89). SOC content at depth i (cm) was then estimated as:
instance, mid-season drainage and intermittent irrigation can SOCi ¼ SOCsurface ´ ð--0:32lnðdepthi Þ þ 1:7Þ ð2Þ
prevent the development of strong anaerobic conditions, thereby The depth gradient for BD was less pronounced than for SOC content
reducing CH4 emissions by 53%80. While these practices stimu- (Supplementary Fig. 4a). The relationship between BD and SOC content of the
late N2O emissions, their net effect on GHG emissions is still topsoil in our dataset could be described by a negative power function (Fig. S5;
R2 = 0.49, n = 1370):
negative80. Combining intermittent irrigation with several other
management practices, the System of Rice Intensification may BD ¼ 1:46e--0:01SOC ð3Þ
reduce both GHG emissions and the use of irrigation water (e.g., The availability of subsoil BD data was insufficient to perform a regression
refs. 63,81). Applying rice straw off season rather than in season analysis with SOC content. Because the ratio of subsoil over topsoil bulk density
averaged 1.18 across our dataset (Supplementary Fig. 4b; standard error = 0.01,
may reduce global CH4 emissions by 4.1 Tg year–182. Moreover, n = 376), we estimated missing subsoil BDs by multiplying the topsoil BDs by 1.18.
selecting high-yielding cultivars can simultaneously reduce CH4
emissions and increase crop yields83, and so, the C input into soil. Estimating paddy SOC stocks in the topsoil and subsoil. For each soil layer at each
A full accounting of the mitigation potential of these measures sampling location in our dataset, total SOC stock (SOCT, Mg ha−1) was calculated
calls for long-term experiments under real-world conditions that according to ref. 21
account for changes in soil C stocks, interactions between man- SOCT ¼ SOC ´ BD ´ H ´ ð1--δ =100Þ ´ 10--1
2mm ð4Þ
agement practices, as well as direct and ancillary GHG emissions. where SOC and BD are SOC content (g kg−1) and bulk density (g cm−3),
In addition, models such as DNDC-rice (e.g., ref. 84) may be used respectively, H is soil thickness (cm) and δ2mm is the fraction (%) of fragments >2
to evaluate trade-offs between soil C sequestration and CH4 and mm in the soil. Since the paddy soils were mostly derived from deposits in flat
N2O emissions under a range of management practices85. areas, the >2 mm fraction of the total mass is usually negligible21.
In summary, we present the first global assessment of paddy When SOC content and BD data were available for the entire 0–100 cm profile,
we calculated SOC stock (Mg ha−1) in the 0–30 cm topsoil layer (SOCT30) and the
soil C stocks. Our results identify paddy soils as an important C entire 0–100 cm profile (SOCT100) by adding SOCT of all soil layers within the
pool, containing ~20% more SOC per hectare than croplands on 0–30 cm and 0–100 cm range, respectively.
average. Our analysis underlines the role of both natural factors When SOC content or BD were not available for some of the 0–30 cm or 0–100
and agronomical management in determining paddy SOC stocks; cm profile, we used the following formulas instead:
fertilization, straw incorporation, and no-till practices all SOCT0 ¼ SOCT þ SOC ´ BD ´ 10--1 ´ ∑30
30 a a ð--0:32 lnðdepth Þ þ 1:7Þ ð5Þ
i¼30a i
increased paddy SOC storage, whereas SOC levels decreased with
MAT and soil pH. However, the climate benefit of SOC storage in SOCT0100 ¼ SOCT030 þ SOCa ´ 1:18 ´ BD ´ 10--1 ´ ∑100
i¼100a ð--0:32 lnðdepthi Þ þ 1:7Þ ð6Þ
rice paddies is generally outweighed by increases in GHG where SOCa and SOCTa are the SOC content (g kg−1) and SOC stock in the
6 COMMUNICATIONS EARTH & ENVIRONMENT | (2021)2:154 | https://doi.org/10.1038/s43247-021-00229-0 | www.nature.com/commsenvCOMMUNICATIONS EARTH & ENVIRONMENT | https://doi.org/10.1038/s43247-021-00229-0 ARTICLE
topsoil, respectively, BD is bulk density (g cm−3) in the topsoil. Missing BDs were management were considered significant if the 95% CIs did not overlap with zero.
estimated using the formula in Supplementary Fig. 5. To ease interpretation, results were back-transformed to percent change
((RR − 1) × 100) in SOC stocks. Positive and negative changes indicate increases
Estimating national and global paddy SOC stocks. National paddy SOC stocks and decreases due to the management practices, respectively.
(SOCTN, Pg) for any country in our dataset were estimated as:
SOCTN ¼ SOCTmean ´ HA ´ 10--9 ð7Þ Data availability
The datasets generated during the current study are available at https://doi.org/10.5281/
where SOCTmean (Mg ha−1) is the mean SOC stock across all sampling locations zenodo.5102775
in that country and HA is the rice harvest area (ha) in that country. HA data for all
countries in our analysis were derived from FAO15.
The global SOC stock (SOCTG, Pg) was estimated as: Received: 8 November 2020; Accepted: 16 July 2021;
SOCTG ¼ SOCTNa þ SOCTNn ð8Þ
where SOCTNa is paddy SOC stock (Pg) in country a, and SOCTNn is paddy SOC
stock (Pg) in country n. No SOC data were available for some countries where HA
was small (e.g., Congo, Mali, and Peru). For these countries, we estimated SOCTN
using the SOCN data from neighboring countries with the closest climate based on References
Köppen-Geiger climate classification. These estimates did not substantially affect
1. Batjes, N. H. Total carbon and nitrogen in the soils of the world. Eur. J. Soil
the estimates of the global SOC stocks because of the small areas of these countries
Sci. 65, 10–21 (1996).
(~5% of total HA). Global mean SOC stocks per unit area was calculated based on
2. Lal, R. Soil carbon sequestration impacts on global climate change and food
global SOC stocks (SOCTG) divided by global rice-paddy area.
security. Science 304, 1623–1627 (2004).
3. Buringh, P. in The role of terrestrial vegetation in the global carbon cycle:
Data analysis. The importance of the environmental variables was estimated using Measurement by remote sensing, 91–109 (Wiley, 1984).
Pearson’s and partial correlation coefficients, which are commonly used to measure 4. Hiederer, R. & Köchy, M. Global soil organic carbon estimates and the
the association between variables, implemented in SPSS 20.0 (SPSS, Chicago, USA). harmonized world soil database. EUR 79, 25225 (2011).
In these correlations, the p value defines whether two variables are statistically 5. Smith, P. et al. Global change pressures on soils from land use and
correlated. p values below 0.05 were accepted as significant correlations. Optimized management. Glob. Chang. Biol. 22, 1008–1028 (2016).
model for SOC with environmental variables was determined by stepwise regres- 6. Schlesinger, W. H. The Role of Terrestrial Vegetation in the Global Carbon
sion using forward selection criteria (p of 0.05 for entering and 0.1 for removal). Cycle: Measurement by Remote Sensing (Wiley, 1984).
ArcGIS 10.3 (Esri, Redlands, USA) was used to analyze and visualize the spatial 7. Conant, R. T., Cerri, C. E., Osborne, B. B. & Paustian, K. Grassland
distribution of SOC stocks. management impacts on soil carbon stocks: a new synthesis. Ecol. Appl. 27,
The 95% confidence interval (CI) of SOC stocks (SOCTN) in each country was 662–668 (2017).
calculated by bootstrapping, using 4999 iterations90. The uncertainty (U) of the 8. Köchy, M., Hiederer, R. & Freibauer, A. Global distribution of soil organic
total SOC stock in each country was then calculated as:
carbon–Part 1: masses and frequency distributions of SOC stocks for the
CI tropics, permafrost regions, wetlands, and the world. Soil 1, 351–365 (2015).
U¼ ´ 100% ð9Þ
x 9. Nahlik, A. M. & Fennessy, M. S. Carbon storage in US wetlands. Nat.
where x is the SOC stock in a country, and CI is the 95% confidence interval of x. Commun. 7, 1–9 (2016).
The total uncertainty (Utotal) at the global scale was calculated as: 10. Dixon, R. K. et al. Carbon pools and flux of global forest ecosystems. Science
qffiffiffiffiffiffiffiffiffiffiffiffiffiffiffiffiffiffiffiffiffiffiffiffiffiffiffiffiffiffiffiffiffiffiffiffiffiffiffiffiffiffiffiffiffiffiffiffiffiffiffi 263, 185–190 (1994).
ðUa ´ xa Þ2 þ ðUn ´ xn Þ2 11. Atwood, T. B. et al. Global patterns in mangrove soil carbon stocks and losses.
Utotal ¼ ð10Þ Nat. Clim. Chang. 7, 523–528 (2017).
xa þ xn
12. Maclean, J. L., Dawe, D. C., Hardy, B. & Hettel, G. P. Rice Almanac: Source
where Ua and Un are the uncertainties associated with xa and xn in country a and book for the most important economic activity on earth, 3rd edn. (CABI
country n. Because some countries were represented by only one site, the CI of that Publishing, 2002).
country could not be calculated. In these cases, the coefficient of variation was 13. Kögel-Knabner, I. et al. Biogeochemistry of paddy soils. Geoderma 157, 1–14 (2010).
conservatively set to 50%91. Global SOC stocks were then estimated as described by 14. Wu, J. Carbon accumulation in paddy ecosystems in subtropical China:
Eq. 8, and the 95% confidence CI of this estimate was calculated using Eq. 9. evidence from landscape studies. Eur. J. Soil Sci. 62, 29–34 (2011).
15. Carlson, K. M. et al. Greenhouse gas emissions intensity of global croplands.
Meta-analysis. We assessed the effects of management practices (fertilization, Nat. Clim. Chang. 7, 63–68 (2017).
return of straw, and tillage) on paddy SOC stocks by creating subsets of experi- 16. FAO (Food and Agriculture Organization of the United Nations). FAOSTAT:
ments that included side-by-side comparisons between management practices. FAO Statistical Databases. http://faostat.fao.org/default.aspx (2018).
Studies had to meet specific criteria to be included in the dataset. First, growing 17. Gattinger, A. et al. Enhanced top soil carbon stocks under organic farming.
conditions in the control and treatment plots had to be identical (except for the Proc. Natl Acad. Sci. USA 109, 18226–18231 (2012).
management practice being studied). Second, mean SOC stock and the number of 18. Xie, Z. et al. Soil organic carbon stocks in China and changes from 1980s to
field replicates had to be reported for both control and treatment plots. Studies 2000s. Glob. Chang. Biol. 13, 1989–2007 (2007).
were incorporated into seven datasets, based on seven types of management 19. Qin, Z., Huang, Y. & Zhuang, Q. Soil organic carbon sequestration potential of
practices: (1) addition of mineral nitrogen (N) fertilizer, (2) addition of mineral cropland in China. Glob. Biogeochem. Cycles 27, 711–722 (2013).
nitrogen–phosphorus–potassium (NPK) fertilizer, (3) addition of organic fertilizer 20. Jobbágy, E. G. & Jackson, R. B. The vertical distribution of soil organic carbon
(e.g., green/farmyard manure, compost), (4) addition of mineral NPK and organic and its relation to climate and vegetation. Ecol. Appl. 10, 423–436 (2000).
fertilizer, (5) no tillage, (6) reduced tillage, and (7) the return of straw. 21. Haefele, S. M., Nelson, A. & Hijmans, R. J. Soil quality and constraints in
The effects of these management practices on SOC stocks were quantified as the global rice production. Geoderma 235, 250–259 (2014).
natural log of the response ratio (lnRR), a metric commonly used in meta- 22. Pan, G., Li, L., Wu, L. & Zhang, X. Storage and sequestration potential of topsoil
analyses:92 organic carbon in China’s paddy soils. Glob. Chang. Biol. 10, 79–92 (2004).
lnRR ¼ lnðSOCTt =SOCTc Þ ð11Þ 23. Wei, L. et al. Comparing carbon and nitrogen stocks in paddy and upland
soils: Accumulation, stabilization mechanisms, and environmental drivers.
where SOCTt and SOCTc represent the mean SOC stock in the 0–30 cm layer of Geoderma 398, 115121 (2021).
the treatment and control groups, respectively. SOC stocks for the 0–30 cm layer 24. Wang, P. et al. Long-term rice cultivation stabilizes soil organic carbon and
were calculated as described above. Treatments included (i) the application of promotes soil microbial activity in a salt marsh derived soil chronosequence.
mineral fertilizers (e.g., N or NPK), organic fertilizer (OF), and mineral plus Sci. Rep. 5, 15704 (2015).
organic fertilizers (NPK + OF) versus no application, (ii) straw return versus no 25. Li, Y. et al. Oxygen availability determines key regulators in soil organic
return, and (iii) no or reduced tillage versus conventional tillage. carbon mineralisation in paddy soils. Soil Biol. Biochem. 153, 108106 (2021).
Most studies in our analysis did not report the standard deviations of the 26. Evans, C. D. et al. Acidity controls on dissolved organic carbon mobility in
means. We therefore adopted a replication‐based weighting method:93,94 organic soils. Glob. Chang. Biol. 18, 3317–3331 (2012).
Weight ¼ ðnt ´ nc Þ=ðnt þnc Þ ð12Þ 27. Liu, Y. et al. Impact of prolonged rice cultivation on coupling relationship
among C, Fe, and Fe-reducing bacteria over a 1000-year paddy soil
where nt and nc are the numbers of replicates of the treatment and control, chronosequence. Biol. Fertil. Soils 55, 589–602 (2019).
respectively. 28. Sinsabaugh, R. L. et al. Stoichiometry of soil enzyme activity at global scale.
Mean effect sizes and 95% confidence intervals (CIs) were generated by Ecol. Lett. 11, 1252–1264 (2008).
bootstrapping with 4999 iterations using MetaWin 2.190. Effects of paddy
COMMUNICATIONS EARTH & ENVIRONMENT | (2021)2:154 | https://doi.org/10.1038/s43247-021-00229-0 | www.nature.com/commsenv 7ARTICLE COMMUNICATIONS EARTH & ENVIRONMENT | https://doi.org/10.1038/s43247-021-00229-0
29. Liu, Y. et al. Microbial activity promoted with organic carbon accumulation in 60. Song, K. et al. Wetland degradation: its driving forces and environmental
macroaggregates of paddy soils under long-term rice cultivation. impacts in the Sanjiang Plain, China. Environ. Manage. 54, 255–271
Biogeosciences 13, 6565–6586 (2016). (2014).
30. Liu, Y. et al. Methanogenic abundance and changes in community structure 61. Dong, J. et al. Northward expansion of paddy rice in northeastern Asia during
along a rice soil chronosequence from east China. Eur. J. Soil Sci. 67, 443–455 2000–2014. Geophys. Res. Lett. 43, 3754–3761 (2016).
(2016). 62. Chaturvedi, V. et al. Climate mitigation policy implications for global
31. Malik, A. A. et al. Land use driven change in soil pH affects microbial carbon irrigation water demand. Mitig. Adapt. Strat. Glob. Chang. 20, 389–407
cycling processes. Nat. Commun. 9, 1–10 (2018). (2015).
32. Don, A., Schumacher, J. & Freibauer, A. Impact of tropical land‐use change on 63. Gathorne-Hardy, A. A life cycle assessment (LCA) of greenhouse gas
soil organic carbon stocks-a meta‐analysis. Glob. Chang. Biol. 17, 1658–1670 emissions from SRI and flooded rice production in SE India. Taiwan Water
(2011). Conserv. J. 61, 111–125 (2013).
33. Piao, S. et al. The carbon balance of terrestrial ecosystems in China. Nature 64. Linquist, B., Van Groenigen, K. J., Adviento‐Borbe, M. A., Pittelkow, C. & Van
458, 1009–1013 (2009). Kessel, C. An agronomic assessment of greenhouse gas emissions from major
34. Davidson, E. A. & Janssens, I. A. Temperature sensitivity of soil carbon cereal crops. Glob. Chang. Biol. 18, 194–209 (2012).
decomposition and feedbacks to climate change. Nature 440, 165–173 (2006). 65. IPCC. in Contribution of working group II to the fifth assessment report of the
35. Kirk, G. The Biogeochemistry of Submerged Soils (Wiley, 2004). Intergovernmental Panel on Climate Change. (eds. Field, C. B. et al)
36. Kramer, M. G., Sanderman, J., Chadwick, O. A., Chorover, J. & Vitousek, P. (Cambridge University Press, 2014).
M. Long‐term carbon storage through retention of dissolved aromatic acids by 66. Xie, Z. et al. CO2 mitigation potential in farmland of China by altering current
reactive particles in soil. Glob. Chang. Biol. 18, 2594–2605 (2012). organic matter amendment pattern. Sci. China Earth Sci. 53, 1351–1357
37. Scharpenseel, H. W., Pfeiffer, E. M. & Becker-Heidmann, P. in Advances in (2010).
Soil Science (eds. Carter, MR, Stewart, BA) (Lewis Publishers, 1996). 67. Yan, X. et al. Carbon sequestration efficiency in paddy soil and upland soil
38. Liao, Q. et al. Increase in soil organic carbon stock over the last two decades in under long-term fertilization in southern China. Soil Tillage Res. 130, 42–51
China’s Jiangsu Province. Glob. Chang. Biol. 15, 861–875 (2009). (2013).
39. Keiluweit, M., Wanzek, T., Kleber, M., Nico, P. & Fendorf, S. Anaerobic 68. Shang, Q. et al. Net annual global warming potential and greenhouse gas
microsites have an unaccounted role in soil carbon stabilization. Nat. intensity in Chinese double rice‐cropping systems: a 3‐year field measurement
Commun. 8, 1–10 (2017). in long‐term fertilizer experiments. Glob. Chang. Biol. 17, 2196–2210 (2011).
40. Ghimire, R., Lamichhane, S., Acharya, B. S., Bista, P. & Sainju, U. M. Tillage, 69. Ma, Y. et al. Net global warming potential and greenhouse gas intensity of
crop residue, and nutrient management effects on soil organic carbon in rice- annual rice–wheat rotations with integrated soil–crop system management.
based cropping systems: a review. J. Integr. Agric. 16, 1–15 (2017). Agric. Ecosyst. Environ. 164, 209–219 (2013).
41. Maillard, É. & Angers, D. A. Animal manure application and soil organic 70. Xiong, Z. et al. Differences in net global warming potential and greenhouse gas
carbon stocks: a meta‐analysis. Glob. Chang. Biol. 20, 666–679 (2014). intensity between major rice-based cropping systems in China. Sci. Rep. 5, 1–9
42. Tian, K. et al. Effects of long-term fertilization and residue management on (2015).
soil organic carbon changes in paddy soils of China: a meta-analysis. Agric. 71. Jiang, Y. et al. Acclimation of methane emissions from rice paddy fields to
Ecosyst. Environ. 204, 40–50 (2015). straw addition. Sci. Adv. 5, eaau9038 (2019).
43. Liu, Y. et al. Initial utilization of rhizodeposits with rice growth in paddy soils: 72. Liu, C., Lu, M., Cui, J., Li, B. & Fang, C. Effects of straw carbon input on
rhizosphere and N fertilization effects. Geoderma 338, 30–39 (2019). carbon dynamics in agricultural soils: a meta‐analysis. Glob. Chang. Biol. 20,
44. Chen, J. et al. A keystone microbial enzyme for nitrogen control of soil carbon 1366–1381 (2014).
storage. Sci. Adv. 4, eaaq1689 (2018). 73. Shakoor, A. et al. A global meta-analysis of greenhouse gases emission and
45. Zhu, Z. et al. Rice rhizodeposits affect organic matter decomposition in paddy crop yield under no-tillage as compared to conventional tillage. Sci. Total
soil: the role of N fertilization and rice growth for enzyme activities, CO2 and Environ. 750, 142299 (2021).
CH4 emissions. Soil Biol. Biochem. 116, 369–377 (2018). 74. Zhao, X. et al. Methane and nitrous oxide emissions under no‐till farming in
46. Moorhead, D. L. & Sinsabaugh, R. L. A theoretical model of litter decay and China: a meta‐analysis. Glob. Chang. Biol. 22, 1372–1384 (2016).
microbial interaction. Ecol. Monogr. 76, 151–174 (2006). 75. Kim, S. Y., Gutierrez, J. & Kim, P. J. Unexpected stimulation of CH4 emissions
47. Li, X. et al. Nitrogen fertilization decreases the decomposition of soil organic under continuous no-tillage system in mono-rice paddy soils during
matter and plant residues in planted soils. Soil Biol. Biochem. 112, 47–55 cultivation. Geoderma 267, 34–40 (2016).
(2017). 76. Ball, B. C., Scott, A. & Parker, J. P. Field N2O, CO2 and CH4 fluxes in relation
48. Cui, J. et al. Carbon and nitrogen recycling from microbial necromass to cope to tillage, compaction and soil quality in Scotland. Soil Tillage Res. 53, 29–39
with C:N stoichiometric imbalance by priming. Soil Biol. Biochem. 142, (1999).
107720 (2020). 77. Linquist, B. A., Adviento-Borbe, M. A., Pittelkow, C. M., van Kessel, C. & van
49. Geisseler, D., Linquist, B. A. & Lazicki, P. A. Effect of fertilization on soil Groenigen, K. J. Fertilizer management practices and greenhouse gas
microorganisms in paddy rice systems—a meta-analysis. Soil Biol. Biochem. emissions from rice systems: a quantitative review and analysis. Field Crop.
115, 452–460 (2017). Res. 135, 10–21 (2012).
50. Sun, W. et al. Climate drives global soil carbon sequestration and crop yield 78. Schlesinger, W. H. Carbon sequestration in soils: some cautions amidst
changes under conservation agriculture. Glob. Chang. Biol. 26, 3325–3335 optimism. Agric. Ecosyst. Environ. 82, 121–127 (2000).
(2020). 79. Choudhury, A. T. M. A. & Kennedy, I. R. Nitrogen fertilizer losses from rice
51. Wissing, L. et al. Management-induced organic carbon accumulation in paddy soils and control of environmental pollution problems. Commun. Soil Sci.
soils: the role of organo-mineral associations. Soil Tillage Res. 126, 60–71 Plan. 36, 1625–1639 (2005).
(2013). 80. Jiang, Y. et al. Water management to mitigate the global warming potential of
52. Baker, J. M., Ochsner, T. E., Venterea, R. T. & Griffis, T. J. Tillage and soil rice systems: a global meta-analysis. Field Crop. Res. 234, 47–54 (2019).
carbon sequestration—-what do we really know? Agric. Ecosyst. Environ. 118, 81. Suryavanshi, P., Singh, Y. V., Prasanna, R., Bhatia, A. & Shivay, Y. S. Pattern
1–5 (2007). of methane emission and water productivity under different methods of rice
53. Lal, R. Challenges and opportunities in soil organic matter research. Eur. J. crop establishment. Paddy Water Environ. 11, 321–329 (2013).
Soil Sci. 60, 158–169 (2009). 82. Yan, X., Akiyama, H., Yagi, K. & Akimoto, H. Global estimations of the
54. Lal, R. Soil carbon sequestration in India. Clim. Change 65, 277–296 (2004). inventory and mitigation potential of methane emissions from rice cultivation
55. Liu, Y. et al. Carbon input and allocation by rice into paddy soils: a review. Soil conducted using the 2006 Intergovernmental Panel on Climate Change
Biol. Biochem. 133, 97–107 (2019). Guidelines. Glob. Biogeochem. Cycles https://doi.org/10.1029/2008GB003299
56. Zhao, Y. et al. Economics-and policy-driven organic carbon input (2009).
enhancement dominates soil organic carbon accumulation in Chinese 83. Jiang, Y. et al. Higher yields and lower methane emissions with new rice
croplands. Proc. Natl Acad. Sci. USA 115, 4045–4050 (2018). cultivars. Glob. Chang. Biol. 23, 4728–4738 (2017).
57. Wei, X., Zhu, Z., Wei, L., Wu, J. & Ge, T. Biogeochemical cycles of key 84. Li, C. et al. Modeling greenhouse gas emissions from rice-based production
elements in the paddy-rice rhizosphere: microbial mechanisms and coupling systems: sensitivity and upscaling. Glob. Biogeochem. Cycles https://doi.org/
processes. Rhizosphere 10, 100145 (2019). 10.1029/2003GB002045 (2004).
58. Alexandratos, N. & Bruinsma, J. World agriculture towards 2030/2050: the 85. Yin, S. et al. Carbon sequestration and emissions mitigation in paddy fields
2012 revision. https://doi.org/10.22004/ag.econ.288998. (2012). based on the DNDC model: a review. Artif. Intell. Agric. 4, 140–149 (2020).
59. Rui, W. & Zhang, W. Effect size and duration of recommended management 86. FAO, IIASA, ISRIC, ISSCAS, and JRC: Harmonized World Soil Database
practices on carbon sequestration in paddy field in Yangtze Delta Plain of (version 1.2), Tech. Rep., FAO, Rome, Italy and IIASA, Laxenburg, Austria
China: a meta-analysis. Agric. Ecosyst. Environ. 135, 199–205 (2010). (2012).
8 COMMUNICATIONS EARTH & ENVIRONMENT | (2021)2:154 | https://doi.org/10.1038/s43247-021-00229-0 | www.nature.com/commsenvCOMMUNICATIONS EARTH & ENVIRONMENT | https://doi.org/10.1038/s43247-021-00229-0 ARTICLE
87. Allison, L. in Organic carbon. Methods of Soil Analysis: Part 2 Chemical and manuscript with contributions from all authors; Y.L.L. and K.J.v.G. revised the manu-
Microbiological Properties, (ed. A.g. Norman). (American Society of script with contributions from all authors.
Agronomy, 1965).
88. Fang, C. & Moncrieff, J. B. The variation of soil microbial respiration with
depth in relation to soil carbon composition. Plant Soil 268, 243–253 (2005).
Competing interests
The authors declare no competing interests.
89. Yan, X., Cai, Z., Wang, S. & Smith, P. Direct measurement of soil organic carbon
content change in the croplands of China. Glob. Chang. Biol. 17, 1487–1496 (2011).
90. Rosenberg, M. S., Adams, D. C. & Gurevitch, J. MetaWin 2.0: statistical Additional information
software for meta-analysis (Sinauer, 2000). Supplementary information The online version contains supplementary material
91. Yue, Q. et al. Deriving emission factors and estimating direct nitrous oxide available at https://doi.org/10.1038/s43247-021-00229-0.
emissions for crop cultivation in China. Environ. Sci. Technol. 53,
10246–10257 (2019). Correspondence and requests for materials should be addressed to T.G. or K.J.v.G.
92. Hedges, L. V., Gurevitch, J. & Curtis, P. S. The meta‐analysis of response ratios
in experimental ecology. Ecology 80, 1150–1156 (1999). Peer review information Communications Earth & Environment thanks Andreas
93. Adams, D. C., Gurevitch, J. & Rosenberg, M. S. Resampling tests for meta‐ Gattinger and the other, anonymous, reviewer(s) for their contribution to the peer review
analysis of ecological data. Ecology 78, 1277–1283 (1997). of this work. Primary Handling Editors: Joshua Dean, Joe Aslin and Clare Davis.
94. Van Groenigen, K. J., Osenberg, C. W. & Hungate, B. A. Increased soil
emissions of potent greenhouse gases under increased atmospheric CO2. Reprints and permission information is available at http://www.nature.com/reprints
Nature 475, 214–216 (2011).
Publisher’s note Springer Nature remains neutral with regard to jurisdictional claims in
published maps and institutional affiliations.
Acknowledgements
This study was supported by the National Key Research and Development program
(2017YFD0800104), the National Natural Science Foundation of China (41977088,
Open Access This article is licensed under a Creative Commons
41807089; 41977093; 41761134095); the Natural Science Foundation of Hunan Pro-
Attribution 4.0 International License, which permits use, sharing,
vince (2019JJ10003; 2019JJ30028), the Youth Innovation Team Project of Institute of
adaptation, distribution and reproduction in any medium or format, as long as you give
Subtropical Agriculture, Chinese Academy of Sciences (2017QNCXTD_GTD), and the
appropriate credit to the original author(s) and the source, provide a link to the Creative
International Postdoctoral Exchange Fellowship Program 2018 (20180017). The research
Commons license, and indicate if changes were made. The images or other third party
of J.P. and J.S. was funded by the European Research Council Synergy grant ERC-2013-
SyG-610028 IMBALANCE-P. The grants or other support to Ge T. from the Alexander material in this article are included in the article’s Creative Commons license, unless
von Humboldt Foundation of Germany and K. C. Wong Magna Fund in Ningbo Uni- indicated otherwise in a credit line to the material. If material is not included in the
versity are also acknowledged with gratitude. article’s Creative Commons license and your intended use is not permitted by statutory
regulation or exceeds the permitted use, you will need to obtain permission directly from
the copyright holder. To view a copy of this license, visit http://creativecommons.org/
Author contributions licenses/by/4.0/.
Y.L.L., T.G., K.J.v.G., G.G., and Y.K. conceived and designed this work; Y.L.L. and P.W.
collected and organized data; Y.L.L., T.G., K.J.v.G., Y.Y., K.C., Z.Z., J.K.W., Y.L., G.G. J.S.,
J.P., J.S.W., and Y.K. took part in data discussion; Y.L.L. analyzed data and wrote the © The Author(s) 2021
COMMUNICATIONS EARTH & ENVIRONMENT | (2021)2:154 | https://doi.org/10.1038/s43247-021-00229-0 | www.nature.com/commsenv 9You can also read