Modelling nitrification inhibitor effects on N2O emissions after fall- and spring-applied slurry by reducing nitrifier NH+ 4 oxidation rate
←
→
Page content transcription
If your browser does not render page correctly, please read the page content below
Biogeosciences, 17, 2021–2039, 2020
https://doi.org/10.5194/bg-17-2021-2020
© Author(s) 2020. This work is distributed under
the Creative Commons Attribution 4.0 License.

Modelling nitrification inhibitor effects on N2O emissions after fall-
and spring-applied slurry by reducing nitrifier NH+4 oxidation rate
Robert F. Grant, Sisi Lin, and Guillermo Hernandez-Ramirez
Department of Renewable Resources, University of Alberta, Edmonton, AB, T6G 2E3, Canada

Correspondence: Robert F. Grant (rgrant@ualberta.ca)

Received: 15 July 2019 – Discussion started: 21 August 2019
Revised: 20 February 2020 – Accepted: 1 March 2020 – Published: 16 April 2020

Abstract. Reductions in N2 O emissions from nitrification          1   Introduction
inhibitors (NI) are substantial but remain uncertain because
measurements of N2 O emissions are highly variable and dis-
continuous. Mathematical modelling may offer an opportu-           Nitrification inhibitors (NI) have frequently been found to
nity to estimate these reductions if the processes causing vari-   reduce N2 O emissions from fertilizer and slurry applications
ability in N2 O emissions can be accurately simulated. In this     in agricultural fields. In a meta-analysis of field experiments
study, the effect of NI was simulated with a simple, time-         conducted for 2008, Akiyama et al. (2010) found average re-
dependent algorithm to slow NH+                                    ductions of 38 ± 6 % in N2 O emissions from NI, with some
                                    4 oxidation in the ecosys-
tem model ecosys. Slower nitrification modelled with NI            variation attributed to land use type and emission rates. Sim-
caused increases in soil NH+                                       ilar average reductions of 35 %–40 % were reported in more
                              4 concentrations and reductions
in soil NO−   concentrations  and in N2 O fluxes that were con-    recent meta-analyses by Ruser and Schulz (2015), Gilsanz
            3
sistent with those measured following fall and spring appli-       et al. (2016), and Gao and Bian (2017). However the mag-
cations of slurry over 2 years from 2014 to 2016. The model        nitudes of these reductions are uncertain because they vary
was then used to estimate direct and indirect effects of NI        with the rate and timing of fertilizer or slurry application,
on seasonal and annual emissions. After spring slurry appli-       with land use and ecosystem type (Akiyama et al., 2010),
cations, NI reduced N2 O emissions modelled and measured           and with application method (Zhu et al., 2016). These mag-
during the drier spring of 2015 (35 % and 45 %) less than          nitudes are also uncertain because measurements of the N2 O
during the wetter spring of 2016 (53 % and 72 %). After fall       emissions on which they are based are highly variable tem-
slurry applications, NI reduced modelled N2 O emissions by         porally and spatially and difficult to sustain over the annual
58 % and 56 % during late fall in 2014 and 2015 and by 8 %         time periods needed to estimate NI reductions.
and 33 % during subsequent spring thaw in 2015 and 2016.              The effects of NI on N2 O emissions are attributed to in-
Modelled reductions were consistent with those from meta-          hibition of ammonia monooxygenase, which slows the oxi-
analyses of other NI studies. Simulated NI activity declined       dation of NH+            −
                                                                                  4 to NO2 during nitrification (Subbarao et al.,
over time so that reductions in N2 O emissions modelled with       2006) and hence slows the reduction of NO−       2 to N2 O dur-
NI at an annual timescale were relatively smaller than those       ing nitrifier denitrification. The consequent slowing of NO− 2
during emission events. These reductions were accompanied          oxidation to NO−  3 would also slow the reduction of NO3 to
                                                                                                                              −

by increases in NH3 emissions and reductions in NO−                N2 O during denitrification. The effectiveness of NI has been
                                                       3 losses
with NI that caused changes in indirect N2 O emissions. With       found to decline over time due to mineralization, adsorption
further parameter evaluation, the addition of this algorithm       and volatilization, depending on NI formulation. The rate of
for NI to ecosys may allow emission factors for different NI       this decline varies among NI products and soil types and in-
products to be derived from annual N2 O emissions modelled         creases with soil temperature (Guardia et al., 2018).
under diverse site, soil, land use and weather.                       The great majority of the studies included in meta-analyses
                                                                   of NI effects on N2 O emissions were conducted following
                                                                   fertilizer or slurry application on warm soils in spring or

Published by Copernicus Publications on behalf of the European Geosciences Union.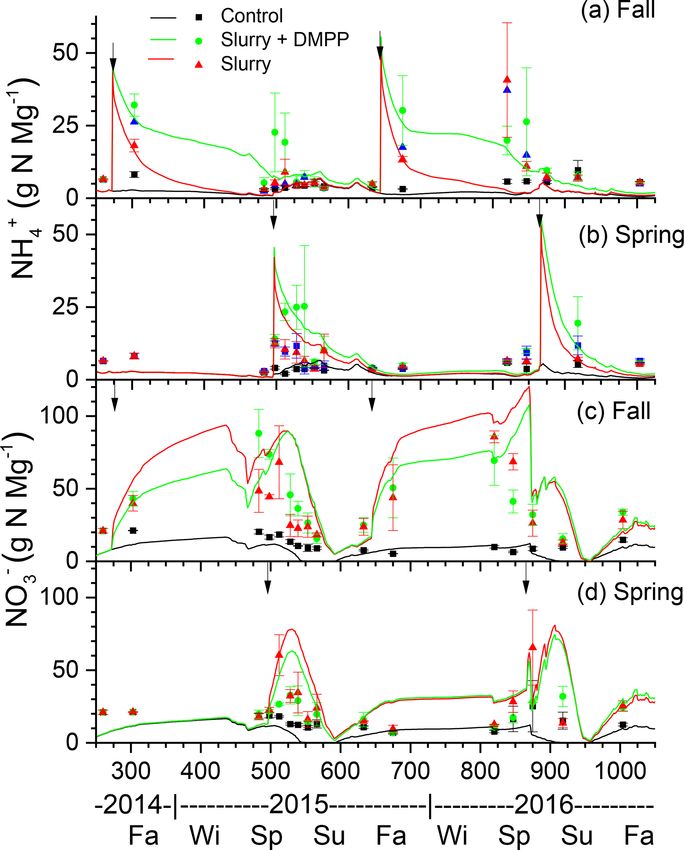
2022                                            R. F. Grant et al.: Modelling nitrification inhibitor effects on N2 O emissions

summer (e.g. Akiyama et al., 2010). The effectiveness of NI
with fall applications of fertilizer or slurry on cold soils has
thus far received very limited attention (Ruser and Schulz,
2015), although in cold climates N2 O emissions during the
spring thaw following fall applications may exceed those
during late spring and summer following spring applications
(Lin et al., 2018). Emissions during spring thaw were at-
tributed by Wagner-Riddle and Thurtell (1998) to soil NO3 –
N concentrations exceeding 20 mg kg−1 generated by fall-
applied slurry that contributed to total N2 O emissions ex-
ceeding 0.2 g N m−2 measured between January and April of
the following year. Large N2 O emissions measured in late
winter were attributed by Dungan et al. (2017) to labile N
not used by soil microorganisms during the previous fall and
winter that was actively metabolized when the soils began to
warm in early March. Interannual differences in spring thaw
emission events after fall slurry applications were related by      Figure 1. Key transformations governing N2 O emissions as repre-
Kariyapperuma et al. (2012) to those in total soil mineral N        sented in ecosys. Expressions in square brackets refer to equations
content in the upper 15 cm of the soil profile during spring        in the Supplement, as described in Sect. 2.
thaw. The effects of NI on N2 O emissions during spring
thaw will therefore depend on the persistence with which NI
reduce nitrification in cold soils during fall and winter and       rect and indirect effects of NI on annual N2 O emissions with
thereby alter mineral N concentrations during the following         fall and spring slurry applications as required for IPCC Tier 3
spring.                                                             methodology and how these effects would change with alter-
   Reductions in N2 O emissions directly caused by slower ni-       native tillage practices and timings of slurry application.
trification with NI may be partially offset by increases in in-
direct N2 O emissions from increasing NH3 emissions caused
                                                                    2     Model development
by greater soil NH+ 4 concentrations (Lam et al., 2017; Qiao
et al., 2015). NI may also decrease indirect N2 O emissions
                                                                    2.1    General overview
by reducing NO−   3 concentrations and hence leaching. Both
direct and indirect effects of NI on N2 O emissions must be         The hypotheses for oxidation–reduction reactions involving
considered when estimating effects of NI on total N2 O emis-        N2 O, and the aqueous and gaseous transport of their sub-
sions.                                                              strates and products, are represented in Fig. 1 and described
   The Intergovernmental Panel on Climate Change (IPCC)             in further detail below. These hypotheses function within a
Tier 3 methodology for estimating N2 O emissions under di-          comprehensive model of soil C, N and P transformations,
verse climates, soils, fertilizers and land uses includes the use   which is coupled to models of soil water, heat and solute
of comprehensive, process-based mathematical models of              transport in surface litter and soil layers. These models func-
terrestrial C, N, and water and energy cycling (IPCC, 2019).        tion within the comprehensive ecosystem model ecosys. Key
Although NI effects on nitrification have been added to some        transformations that drive N2 O emissions are described in
existing process models (Cui et al., 2014; Del Grosso et al.,       Sect. 2.2 to 2.8 below, and modifications of these transfor-
2009; Li et al., 2020), testing of modelled NI effects on N2 O      mations to simulate nitrification inhibition are described in
emissions against measurements remains limited to brief pe-         Sect. 2.9. References to equations and definitions in Sect. 2.2
riods following soil N amendments (e.g. Giltrap et al., 2011).      to 2.8 and given in Supplement S1, S3, S4, S5 and S8 (Ta-
The mathematical model ecosys explicitly represents the             ble 1) are provided for those interested in model methodol-
key processes in nitrification (Grant, 1994), denitrification       ogy but are not needed for a general understanding of model
(Grant, 1991) and associated N2 O emissions (Grant, 1995)           behaviour.
and has been tested against measurements of N2 O emissions
using micrometeorological methods and manual and auto-              2.2    Mineralization and immobilization of ammonium
mated chambers (Grant and Pattey, 1999, 2008; Grant et al.,                by microbial functional types
2006, 2016; Metivier et al., 2009). In this study, we propose
that applying a time-dependent reduction of NH+      4 oxidation    Heterotrophic microbial functional types (MFTs) m (ob-
rates during nitrification will enable ecosys to simulate the       ligately aerobic bacteria, obligately aerobic fungi, facul-
time course of reductions in N2 O emissions with NI mea-            tatively anaerobic denitrifiers, anaerobic fermenters, ace-
sured after fall and spring applications of dairy slurry in a       totrophic methanogens, and obligately aerobic and anaerobic
field experiment. The model is then used to estimate the di-        non-symbiotic diazotrophs) are associated with each organic

Biogeosciences, 17, 2021–2039, 2020                                                       www.biogeosciences.net/17/2021/2020/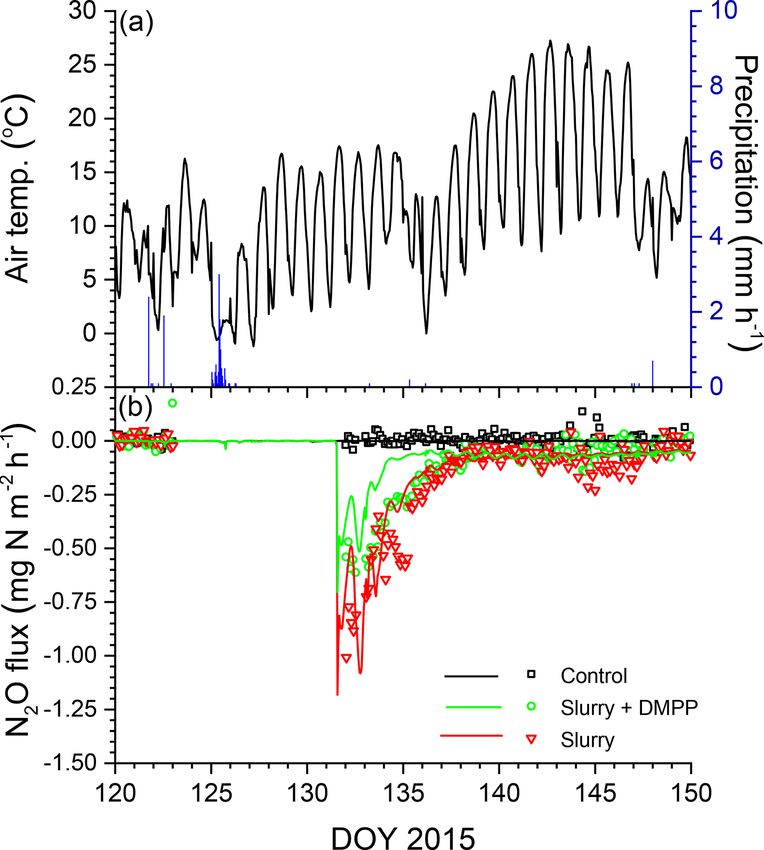
R. F. Grant et al.: Modelling nitrification inhibitor effects on N2 O emissions                                                    2023

Table 1. List of sections in the Supplement.

                  Supplement      Title                                                                        Equations
                  S1              Microbial C, N and P transformations                                         [A1]–[A39]
                  S2              Soil–plant water relations                                                   [B1]–[B14]
                  S3              Gross primary productivity, autotrophic respiration, growth and litterfall   [C1]–[C53]
                  S4              Soil water, heat, gas and solute fluxes                                      [D1]–[D21]
                  S5              Solute transformations                                                       [E1]–[E57]
                  S6              Symbiotic N2 fixation                                                        [F1]–[F26]
                  S7              CH4 production and consumption                                               [G1]–[G27]
                  S8              Inorganic N transformations                                                  [H1]–[H21]

substrate i (i is manure, coarse woody plant residue, fine non-            2. O2 reduction to H2 O under non-limiting O2 (O2 de-
woody plant residue, particulate organic matter or humus).                    mand) by aerobic heterotrophs is calculated from step 1
Autotrophic MFTs n (aerobic NH+                    −
                                       4 and NO2 oxidizers,                   using a set respiratory quotient [H3].
aerobic methanotrophs, and hydrogenotrophic methanogens)
are associated with inorganic substrates. These MFTs grow                  3. O2 reduction to H2 O under ambient O2 is calculated
[A25] with energy generated from oxidation of dissolved or-                   from radial O2 diffusion through water films with thick-
ganic C (DOC) by heterotrophs [H2, H10], of acetate by ace-                   nesses determined by soil water potential [H4a] cou-
totrophic methanogens, of mineral N (NH+               −
                                            4 and NO2 ) [H11,                 pled with active uptake at heterotroph surfaces driven
H15] by nitrifiers, of CH4 by methanotrophs [G7] or of H2                     by step 2 [H4b]. Diffusion and uptake are sustained by
by hydrogenotrophic methanogens [G12], coupled with re-                       O2 transfer through soil aqueous and gaseous phases
duction of e− acceptors O2 [H4, G22], acetate [G8], NOx                       controlled by soil water- and air-filled porosity gov-
[H7–H9] and CO2 [G13]. These MFTs decay according to                          erned by freezing, thawing and transfer of soil water
first-order rate constants [A23], with internal recycling of                  [D14–D20]. O2 diffusion and active uptake are calcu-
resources (C, N, P) from structural to nonstructural compo-                   lated for each heterotrophic population associated with
nents j (j is labile, recalcitrant, nonstructural) varying with               each organic substrate, allowing [H4] to calculate lower
nonstructural C : N : P ratios [A24], the decay products of                   O2 concentrations at microbial surfaces (O2m ) associ-
which form humus C, N and P [A35, A36]. Each MFT seeks                        ated with more biologically active substrates (e.g. ma-
to maintain a set nonstructural C : N : P ratio by mineraliz-                 nure, litter). Localized zones of low O2 concentration
ing NH+              −
        4 and H2 PO4 [H1a] from, or by immobilizing NH4 ,
                                                             +
                                                                              (hotspots) are thereby simulated when O2 uptake by any
     −             −
NO3 and H2 PO4 [H1b, H1c] into, its nonstructural N and                       aerobic MFT is constrained by O2 diffusion to that func-
P components. These transformations control the exchange                      tional type. O2 uptake by each heterotrophic MFT is
of N and P between organic and inorganic states, and of O2                    affected by competition for O2 uptake with other het-
between aqueous and gaseous states, and hence affect the                      erotrophs, nitrifiers, roots and mycorrhizae, calculated
availability of substrates and e− acceptors for nitrification                 from its biological O2 demand relative to those of other
and denitrification.                                                          aerobic functional types.

2.3   Oxidation of DOC and reduction of oxygen by                          4. DOC oxidation to CO2 under ambient O2 is calculated
      heterotrophs                                                            from steps 2 and 3 [H5]. The energy yield of DOC
                                                                              oxidation with O2 reduction drives the uptake of ad-
N2 O is generated when demand for e− acceptors from ox-                       ditional DOC for construction of microbial biomass
idation by aerobic heterotrophs and autotrophs (Sect. 2.2)                    Mi,h according to construction energy costs of each het-
exceeds supply from O2 , requiring explicit modelling of                      erotrophic functional type [A21]. Energy costs of deni-
O2 transport and uptake and consequent O2 constraints to                      trifiers are slightly larger than those of obligately aero-
oxidation–reduction reactions (Fig. 1). Constraints on het-                   bic heterotrophs, placing denitrifiers at a small compet-
erotrophic oxidation of DOC imposed by O2 uptake are                          itive disadvantage for growth and hence DOC oxidation
solved in four steps:                                                         under non-limiting O2 .

  1. DOC oxidation by heterotrophs under non-limiting O2                 2.4    Oxidation of DOC and reduction of nitrate, nitrite
     is calculated from specific oxidation rates multiplied by                  and nitrous oxide by denitrifiers
     active biomasses and an Arrhenius function of Ts [A6]
     used for all microbial transformations, constrained by              N2 O may be both the product and substrate of NOx reduc-
     DOC concentration [H2].                                             tion coupled with DOC oxidation by denitrifiers. Constraints

www.biogeosciences.net/17/2021/2020/                                                               Biogeosciences, 17, 2021–2039, 2020
2024                                          R. F. Grant et al.: Modelling nitrification inhibitor effects on N2 O emissions

imposed by NO−   3 availability on denitrifier DOC oxidation       4. NH+                     −
                                                                          4 oxidation to NO2 under ambient O2 is calculated
are solved in five steps:                                             from steps 2 and 3 [H14]. The energy yield of NH+  4 oxi-
                                                                      dation drives the fixation of CO2 for construction of mi-
 1. NO−                    −
        3 reduction to NO2 by heterotrophic denitrifiers un-
                         −                                            crobial biomass Mi,n according to nitrifier construction
    der non-limiting NO3 is calculated from demand for e−
                                                                      energy costs.
    acceptors by denitrifiers for DOC oxidation to CO2 but
    not met from O2 reduction to H2 O because of diffusion       2.6   Oxidation of nitrite and reduction of oxygen by
    limitations to the O2 supply (Sect. 2.3, step 3). This un-         nitrifiers
    met demand is transferred to NO− 3 [H6].
                                                                 Constraints on nitrifier oxidation of NO−         −
                                                                                                          2 to NO3 imposed
 2. NO−                     −                     −
        3 reduction to NO2 under ambient NO3 is calcu-           by O2 uptake [H15–H18] are solved in the same way as those
    lated from step 1, accounting for relative concentrations
                                                                 of NH+          −
                                                                        4 to NO2 [H11–H14]. The energy yield of NO2 ox-
                                                                                                                        −
    and affinities of NO−          −
                         3 and NO2 [H7].                         idation drives the fixation of CO2 for construction of micro-
 3. NO−                                           −
        2 reduction to N2 O under ambient NO2 is calcu-          bial biomass Mi,o according to nitrifier construction energy
    lated from demand for e− acceptors not met by NO−   3 re-    costs.
    duction in step 2, accounting for relative concentrations
    and affinities of NO−2 and N2 O. This unmet demand is
                                                                 2.7   Oxidation of ammonium and reduction of nitrite
    transferred to NO− 2 [H8].                                         by nitrifiers

 4. N2 O reduction to N2 under ambient N2 O is calculated        In both nitrifier and denitrifier processes, N2 O is generated
    from demand for e− acceptors not met by NO−    2 reduc-      from reduction of NO−    2 , the availability of which is con-
    tion in step 3 and hence transferred to N2 O [H9].           trolled by NO− 2  oxidation  (Sect. 2.6). Under low O2 concen-
                                                                 trations NO−2  oxidation  is suppressed [H18], favouring NO− 2
 5. Additional energy yield from DOC oxidation to CO2
                                                                 reduction. Constraints on nitrifier oxidation of NH+4 imposed
    enabled by NOx reduction in steps 2, 3 and 4 is added
                                                                 by NO− 2 availability are solved in three steps:
    to that enabled by O2 reduction from [H5], which
    drives additional DOC uptake for construction of Mi,n .        1. NO−                                            −
                                                                          2 reduction to N2 O under non-limiting NO2 is cal-
                                                                                     −                            +
    This additional uptake offsets the disadvantage incurred          culated from e acceptors demanded by NH4 oxidation
    by the larger construction energy costs of denitrifiers           to NO−2 but not met by O2 for reduction to H2 O because
    (Sect. 2.3, step 4).                                              of diffusion limitations to O2 supply and hence trans-
                                                                      ferred to NO−2 [H19].
2.5    Oxidation of ammonium and reduction of oxygen
       by nitrifiers                                               2. NO−                                      −
                                                                          2 reduction to N2 O under ambient NO2 and CO2 is
                                                                      calculated from step 1 [H20], competing for NO−
                                                                                                                    2 with
N2 O may also be generated by reduction of NO−      2 coupled
                                                                      denitrifiers [H8] and nitrifiers [H18].
with oxidation of NH+ 4 by autotrophic nitrifiers. Constraints     3. Energy yield from additional NH+  4 oxidation to NO2
                                                                                                                          −
on nitrifier oxidation of NH+4 imposed by O2 uptake are                               −
                                                                      enabled by NO2 reduction in step 2 [H21] is added to
solved in four steps:
                                                                      that enabled by O2 reduction from step 4 in Sect. 2.5
 1. Oxidation of NH+   4 (in dynamic equilibrium with NH3             [H14], which drives the fixation of additional CO2 for
    [E24]) under non-limiting O2 is calculated from a spe-            construction of Mi,n .
    cific oxidation rate multiplied by active biomass and an
    Arrhenius function of Ts and constrained by NH+    4 and
                                                                 2.8   Uptake of ammonium and reduction of oxygen by
    CO2 concentrations [H11].                                          roots and mycorrhizae

 2. O2 reduction to H2 O under non-limiting O2 (O2 de-           NH+4 oxidation and O2 reduction by nitrifiers compete for
    mand) is calculated from step 1 using set respiratory        substrates with NH+
                                                                                   4 uptake and O2 reduction by other MFTs
    quotients [H12].                                             and by roots and mycorrhizae.
 3. O2 reduction to H2 O under ambient O2 is calculated            1. NH+ 4 uptake by roots and mycorrhizae under non-
    from radial O2 diffusion through water films of thick-            limiting O2 is calculated from mass flow and radial dif-
    ness determined by soil water potential [H13a] coupled            fusion between adjacent roots and mycorrhizae [C23a]
    with active uptake at nitrifier surfaces driven by step 2         coupled with active uptake at root and mycorrhizal sur-
    [H13b]. O2 uptake by nitrifiers is affected by competi-           faces [C23b]. Active uptake is subject to product inhi-
    tion for O2 uptake with heterotrophic DOC oxidizers,              bition by root nonstructural N : C ratios [C23g], where
    roots and mycorrhizae, calculated from its biological             nonstructural N is the active uptake product, and non-
    O2 demand relative to those of other aerobic functional           structural C is the CO2 fixation product transferred to
    types.                                                            roots and mycorrhizae from the canopy.

Biogeosciences, 17, 2021–2039, 2020                                                  www.biogeosciences.net/17/2021/2020/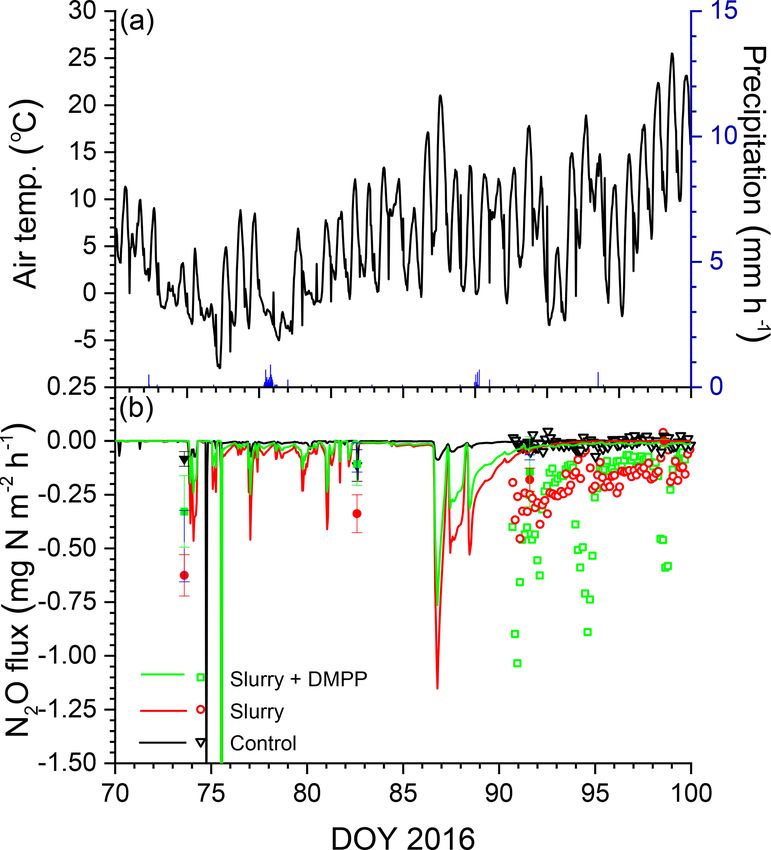
R. F. Grant et al.: Modelling nitrification inhibitor effects on N2 O emissions                                                   2025

  2. O2 reduction to H2 O under non-limiting O2 is calcu-            aqueous NH+   4 concentration (g N m
                                                                                                          −3 in dynamic equilib-

     lated from O2 demands for NH+  4 uptake in step 1 and           rium with [NH3 ]), and KiNH4 is an inhibition constant set
     for oxidation of root and mycorrhizal nonstructural C           at 7000 g N m−3 to reduce inhibition at very large [NH+ 4 ] as
     for root maintenance and growth using a set respiratory         suggested in Janke et al. (2019). These rates were used to
     quotient [C14e].                                                calculate nitrification rates [H11]:

  3. O2 reduction to H2 O under ambient O2 is calculated                         0
                                                                                                   +  +
                                                                     XNH4 tl = XNH4 tl Mnl fTsl NH4 l / NH4 l + KNH4
     from mass flow and radial diffusion between adjacent
     roots and mycorrhizae [C14d] coupled with active up-

     take at root and mycorrhizal surfaces driven by step 2                        [CO2 s]l / [CO2 s]l + KCO2           ,           (3)
     [C14c]. O2 uptake by roots and mycorrhizae is also af-
     fected by competition with O2 uptake by heterotrophic
     DOC oxidizers, and autotrophic nitrifiers, calculated           where XNH4 t is the nitrification rate (g N m−2 h−1 ), Mn is the
     from their biological O2 demands relative to those of           nitrifier biomass (g C m−2 ), and KNH4 and KCO2 are half-
     other populations.                                              saturation constants for aqueous NH+       4 and CO2 (g N and
                                                                     C m−3 ). The NI in Eq. (1) slows XNH 0      in Eq. (2) and thereby
                                                                                                             4t
  4. Oxidation of root and mycorrhizal nonstructural C to            XNH4 t in Eq. (3) and hence slows NO−   2  production   from nitri-
     CO2 under ambient O2 is calculated from steps 2 and 3           fication (step 4, Sect. 2.5) and thereby N2 O production from
     [C14b].                                                         nitrification (step 2, Sect. 2.7) and denitrification (step 3,
                                                                     Sect. 2.4). By slowing XNH4 t in Eq. (3), NI also reduce nitri-
  5. NH+4 uptake by roots and mycorrhizae under ambient              fication energy yield and hence Mn growth, biomass [A25]
     O2 is calculated from steps 1, 2, 3 and 4 [C23b].               and O2 uptake [H13], thereby further reducing N2 O produc-
                                                                     tion.
2.9   Nitrification inhibition

For this study, NI were assumed to reduce specific rates of          3     Field experiment
NH+4 oxidation by nitrifiers in step 1 in Sect. 2.5, thereby
simulating inhibition of ammonia monooxygenase (Sub-                 3.1    Site description and experimental design
barao et al., 2006). This reduction was represented by a time-
dependent scalar I :                                                 An experiment was established on a Black Chernozem (Ta-
                                                                     ble 2) under barley (Hordeum vulgare L.) silage from 2014 to
Itl = It−1l − It−1l · RI · fTsl ,                             (1)    2016 on a level site at the South Campus Farm in Edmonton,
                                                                     AB, Canada (53◦ 290 3000 N, 113◦ 310 5300 W). The experimen-
where t is the current time step (h), t − 1 is the previous          tal design was an incomplete split plot (main plot: fall vs.
time step (h), I is the inhibition (initialized to 1.0 at t = 0      spring application of dairy slurry; split plot: control vs. NI
at the time of application), RI is the rate constant for decline     treatments) on plots 2.4 m in width and 6.1 m in length with
of I representing NI degradation (set to 2.0 × 10⁻⁴ h−1 for          three replicates. The NI products ENTEC (EuroChem Agro,
more persistent NI such as 3,4-dimethylpyrazole phosphate            Mannheim, Germany) and the eNtrench nitrogen stabilizer
– DMPP – and to 1.0 × 10⁻³ h−1 for less persistent NI such           (Dow Chemical Company, Dow AgroSciences, Calgary, AB,
as nitrapyrin; Ruser and Schulz, 2015), fTs is an Arrhenius          Canada) were mixed with the slurry immediately before ap-
function of soil temperature (Ts ) used to simulate Ts effects       plication to provide 0.4 kg ha−1 of the active ingredient with
on microbial activity ([A6] in step 1, Sect. 2.3), and l is the      slurry injection of 56.17 m3 ha−1 at 12.7 to 15.2 cm (average
soil layer in which NI are present. The values of RI and fTs         14 cm) depth and 28 cm spacing. Measured concentrations
for DMPP were selected to give time and temperature de-              of NH+ 4 and of organic N and C in each slurry application
pendencies of DMPP activity following application inferred           were used to calculate rates of NH+4 , organic N and organic C
from incubation studies by Guardia et al. (2018). Model re-          amendments (Table 3). Soil NH+    4 concentrations were mea-
sults for NI presented below are those using the smaller RI          sured from 0 to 10 cm every 2–3 weeks between spring thaw
for DMPP unless stated as those using the larger RI for ni-          and autumn freezing in 2014, 2015 and 2016. Further details
trapyrin.                                                            of this field experiment are given in Lin et al. (2018).
    Specific rates of NH+ 4 oxidation (step 1, Sect. 2.5) with NI       Weather data (radiation, air temperature – Ta , humidity,
was calculated as                                                    wind speed and precipitation) were recorded hourly from
                                                                     2012 to 2016 at the South Campus Farm. During the first ex-
  0           00
                    · 1.0 − Itl / 1.0 + NH+

XNH   4 tl
           = XNH 4l                        4 l /KiNH4 ,        (2)   perimental year (16 September 2014 to 15 September 2015)
                                                                     Ta remained 1–2 ◦ C higher than historical (1981–2010) av-
where XNH0
           4
                   00
             and XNH  4
                        are specific NH+  4 oxidation rates          erages (Lin et al., 2018; Table 4). Precipitation was slightly
with and without NI (g N g nitrifier C−1 h−1 ), [NH+
                                                   4 ] is the        higher than historical averages during autumn and winter but

www.biogeosciences.net/17/2021/2020/                                                          Biogeosciences, 17, 2021–2039, 2020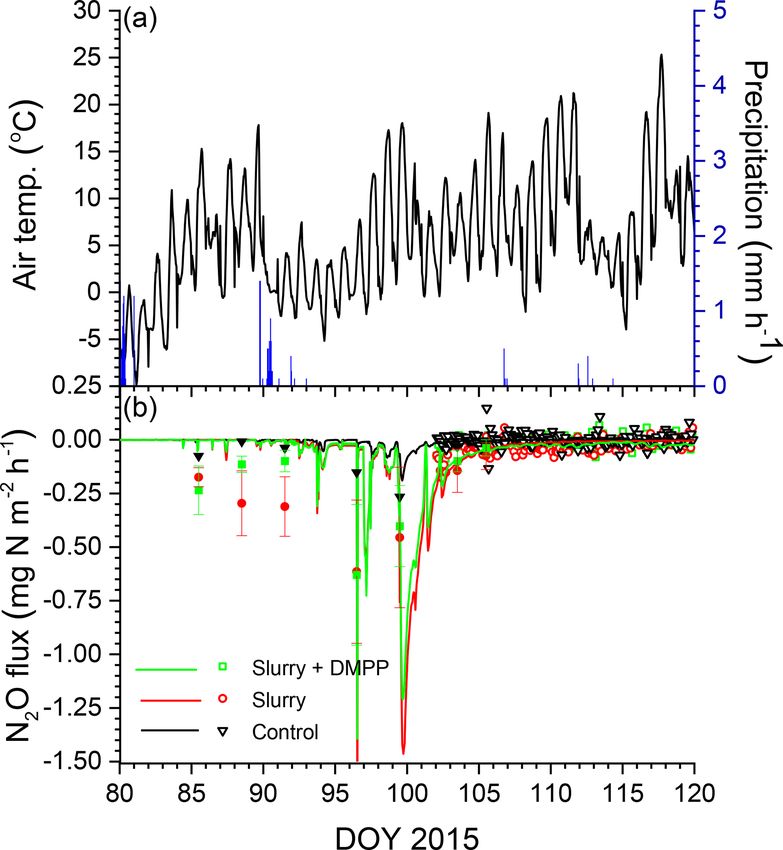
2026                                                     R. F. Grant et al.: Modelling nitrification inhibitor effects on N2 O emissions

Table 2. Key soil properties of the Black Chernozem soil at the South Campus Farm used in ecosys. SOC is soil organic carbon, and SON is
soil organic nitrogen.

                    Depth                        BD     FC      WP      Ksat ∗     Sand     Silt     Clay      pH    SOC     SON
                    m to bottom        Mg m−3            m3 m−3       mm h−1        g kg−1 mineral soil              g kg−1 soil
                    0.01                     1.15      0.34    0.15      18.0        280   450        270      6.3   57.1    5.74
                    0.025                    1.15      0.34    0.15      18.0        280   450        270      6.3   57.1    5.74
                    0.05                     1.15      0.34    0.15      18.0        280   450        270      6.3   57.1    5.74
                    0.10                     1.15      0.34    0.15      18.0        280   450        270      6.3   57.1    5.74
                    0.15                     1.35      0.34    0.15      18.0        280   450        270      6.3   40.7    3.80
                    0.30                     1.40      0.34    0.15       7.5        250   470        280      6.3   40.7    3.80
                    0.60                     1.50      0.35    0.17       2.5        270   420        310      7.1    3.2     0.3
                    0.90                     1.50      0.35    0.17       2.5        270   420        310      7.1    3.2     0.3
                    1.20                     1.50      0.35    0.17       2.5        270   420        310      7.1    3.2     0.3
                    1.50                     1.50      0.35    0.17       2.5        270   420        310      7.1    3.2     0.3
                  ∗ From Saxton et al. (1986).

Table 3. Plant and soil management schedule at the Edmonton South Campus Farm.

                            Year       Date           Management                           Amount
                                                                          Urea        NH+4         Organic N     Organic C
                                                                      g N m−2      g N m−2          g N m−2       g C m−2
                            2014       15 May         Fertilizer           7.2
                                       15 May         Planting
                                       21 Aug         Harvest
                                       30 Sep         Fall slurry                      21.7             16.4         229.4
                            2015       11 May         Planting
                                       12 May         Spring slurry                    19.4             20.5         176.9
                                       28 Jul         Harvest
                                       7 Oct          Fall slurry                      21.3             19.0         198.5
                            2016       14 May         Planting
                                       16 May         Spring slurry                    27.2             18.6         227.5
                                       15 Aug         Harvest

was about one-half those during spring and summer. Dur-                          store ambient N2 O concentrations in the gas analyser, after
ing the second experimental year (16 September 2015 to                           which chambers were closed and N2 O concentrations were
15 September 2016), Ta was higher than that of the first year                    measured at 10 Hz and averages recorded at 1 min intervals.
during winter and early spring and similar during late spring                    Concentrations during the first minute after closure were dis-
and summer. However precipitation during the second year                         carded, and those during the following 14 min were used to
was lower from autumn to early spring and much higher dur-                       calculate fluxes using linear regression with an acceptance
ing late spring and summer.                                                      criterion of R 2 ≥ 0.85. Based on the analytical precision of
                                                                                 the gas analyser, the N2 O flux detection limit was determined
3.2    N2 O flux measurements                                                    to be ±0.03 mg N m−2 h−1 .
                                                                                    N2 O emissions were also measured once or twice per
N2 O fluxes were measured at 3 h intervals from as soon as                       week from spring thaw to autumn freezing during both exper-
field conditions allowed after spring thaw to late summer                        imental years with manually operated chambers as described
during both experimental years with automated chambers                           in Lin et al. (2018). The time required for installation of the
(height of 26 cm, area of 0.216 m2 ) connected by 0.5 cm i.d.                    automated chambers after snowmelt limited their ability to
tubes to a FTIR gas analyser (GASMET model CX4025,                               measure N2 O emissions during spring thaw so that measure-
Temet Instruments, Finland) through which air flow was                           ments from the manually operated chambers were used to
maintained at 5.1 L min−1 . During each 20 min measurement                       evaluate emissions during these periods.
period, the chambers remained open for the first 5 min to re-

Biogeosciences, 17, 2021–2039, 2020                                                                      www.biogeosciences.net/17/2021/2020/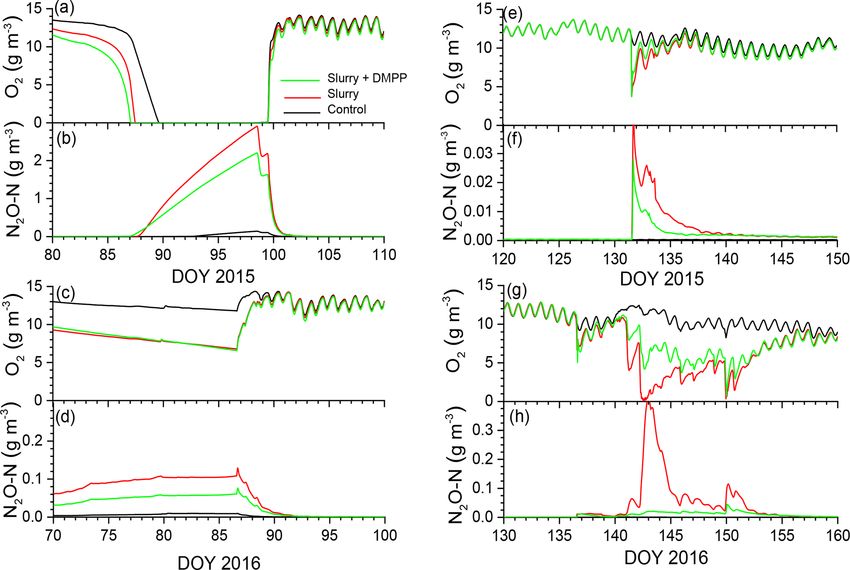
R. F. Grant et al.: Modelling nitrification inhibitor effects on N2 O emissions                                                  2027

Table 4. Average temperatures and total precipitation measured at the Edmonton South Campus Farm during autumn–winter, winter–spring
and spring–summer in 2014–2015 and 2015–2016.

                                  2014          2015          2014–2015            2015        2016           2015–2016
                From            16 Sep     1 Jan    1 May          Average       16 Sep    1 Jan     1 May      Average
                To              31 Dec    30 Apr    15 Sep          or total     31 Dec   30 Apr     15 Sep     or Total
                Temp. (◦ C)         0.4     −1.8       16.0             5.6         0.8      0.1       15.8          6.3
                Precip. (mm)        50        75        195            320          41        38       402          481

4     Model experiment

4.1    Model spin-up

To simulate site conditions prior to the experiment, ecosys
was initialized with the properties of the Black Chernozem,
simulated as a one-dimensional profile (Table 2) with sur-
face water runoff and subsurface water exchange with a wa-
ter table at 1.2 m depth. The model was run from model dates
1 January 1992 to 31 December 2013 under a repeating 5-
year sequence of weather data (radiation, air temperature –
Ta , humidity, wind speed and precipitation) recorded hourly
from 2012 to 2016 at the South Campus Farm. During each
year of the spin-up run, barley was planted, fertilized and
harvested as silage to reproduce land use practices reported
from the field site.

4.2    Model runs

The spin-up run was extended from 1 January 2014 to 31 De-
cember 2016 under weather data recorded from 2014 to 2016
with the land use schedules and practices from the field site
(Table 3). Each modelled slurry application was added to the
soil layer, the depth of which corresponded to that of slurry          Figure 2. Soil NH+             −
                                                                                           4 and NO3 concentrations measured (symbols)
injection in the field experiment (14 cm). Modelled applica-           and modelled (lines) at 0–10 cm depth following applications of
tions were accompanied by addition of water corresponding              dairy slurry without and with DMPP. Arrows indicate dates of ap-
                                                                       plication. (Fa – fall; Wi – winter; Sp – spring; Su – summer.)
to the volume and depth of the application (5.6 mm from
56.17 m3 ha−1 at 14 cm in Sect. 3.1), and by tillage using a
coefficient for surface litter incorporation and soil mixing of
                                                                       and annual N2 O emissions were evaluated. To examine how
0.2 to the depth of application (14 cm), based on field obser-
                                                                       increased tillage during slurry application would affect sub-
vations. A control run was also conducted in which no slurry
                                                                       sequent N2 O emissions with and without NI, coefficients for
applications were modelled. For all silage harvests, cutting
                                                                       surface litter incorporation and soil mixing to the depth of
height and harvest efficiency were set to 0.15 m and 0.9 so
                                                                       slurry application were raised from 0.2 to 0.5 and 0.8 for fall
that 0.9 of all plant material above 0.15 m was removed as
                                                                       and spring applications.
yield. Concentrations of NH+             −
                               4 and NO3 , and N2 O emissions
modelled during key emission events, were compared with
measured values (Sect. 3.1 and 3.2), and modelled emissions            5       Results
were then aggregated into seasonal and annual values.
   There is some flexibility in the timing of fall slurry appli-       5.1      NI and soil NH+       −
                                                                                              4 and NO3 concentrations
cation between crop harvest in late summer and soil freezing
in early November. To examine how timing of fall slurry ap-            5.1.1      Fall slurry applications
plication would affect subsequent N2 O emissions with and
without NI, fall slurry application dates were advanced or de-         In the model, NI slowed NH+ 4 oxidation (Sect. 2.9, Eq. 3)
layed by 2 weeks from those in Table 3, and effects on spring          so that declines in NH+
                                                                                             4 concentrations modelled and mea-

www.biogeosciences.net/17/2021/2020/                                                               Biogeosciences, 17, 2021–2039, 2020
2028 R. F. Grant et al.: Modelling nitrification inhibitor effects on N2 O emissions
sured after fall and spring slurry applications with NI were concentrations without NI (Fig. 2a). Rises in θg following
slower than those without NI (Fig. 2a), particularly during spring drainage allowed volatilization of N2 O from aqueous
winter, when declines in inhibition were slowed by low Ts to gaseous phases, reducing N2 Os and driving N2 O emis-
(Sect. 2.9, Eq. 1) following the onset of soil freezing mod- sions modelled during spring thaw.
elled at the depth of slurry injection (DOY 313 in 2014 and
DOY 318 in 2015 in Fig. 2a). Overwinter declines in NH+ 4
5.2.2 Spring slurry applications
concentrations were slower during the winter of 2015–2016,
with lower Ts modelled under less winter precipitation and Declines in O2s modelled after spring slurry application were
hence shallower snowpack (Table 4). These slower declines small during the drier spring of 2015 (Table 4; Fig. 3e) but
caused larger NH+ were greater with lower θg during the wetter spring of 2016
4 concentrations to be modelled during the
following spring, consistent with measurements (Fig. 2a). (Fig. 3g). During both years, these declines were more rapid
The slower declines in NH+ with slurry than without but less rapid with NI-amended
4 concentrations modelled with
NI caused slower rises in NO− slurry than with unamended slurry. Greater declines in O2s
3 concentrations following fall
slurry applications (Fig. 2c). However slower rises with NI modelled in 2016 vs. 2015 drove greater increases in N2 Os
were not always apparent in the measured NO− (Sect. 2.7), particularly without NI, and hence greater emis-
3 concentra-
tions. sions of N2 O during subsequent declines in N2 Os .
5.3 NI and N2 O fluxes
5.1.2 Spring slurry applications
5.3.1 Fall slurry applications
Declines in NH+ 4 concentrations modelled after slurry appli-
cations with NI in spring 2015 and 2016 were also slower Smaller rises and subsequent declines in N2 Os modelled with
than after those without NI (Fig. 2b), consistent with higher NI than without (Fig. 3b) drove smaller N2 O emission events
NH+ 4 concentrations measured after spring application with modelled during spring thaw in 2015 (Fig. 4a) following
DMPP in both years (Fig. 2b). These slower declines caused slurry application in fall 2014 (Fig. 4b). These events were
slower rises in NO−3 concentrations to be modelled following driven by increases in θg during mid-afternoon thawing of
spring slurry applications with NI (Fig. 2d). near-surface soil but were terminated by loss of θg during
nighttime refreezing. These events preceded the start of the
5.2 NI and soil gas concentrations automated chamber measurements on DOY 102 and so could
not be corroborated by them. However measurements with
5.2.1 Fall slurry applications manual chambers earlier in spring 2015 by Lin et al. (2018)
indicated that N2 O emission events occurred from DOY 85
In the model, soil ice impeded drainage during spring to 100 that were similar in magnitude although not always
snowmelt and soil thaw, raising θw and lowering θg , thereby in timing with those modelled (Fig. 4b). These measured
slowing gas transfers in gaseous phases and gas exchanges emissions were smaller with NI than without, consistent with
between gaseous and aqueous phases (Sect. 2.3, step 3; modelled emissions.
Fig. 1). Freeze–thaw effects on N2 O emissions modelled The smaller rises and subsequent declines in N2 Os mod-
during early spring are further described in Grant and elled with NI than without in the winter of 2016 (Fig. 3d)
Pattey (1999). Slower O2 transfers relative to O2 uptake drove smaller emission events during thawing and refreezing
(Sect. 2.3, 2.5 and 2.6) forced reductions in aqueous O2 con- of near-surface soil in spring 2016 (Fig. 5a) following slurry
centrations (O2s ) to be modelled during early spring in 2015 application in fall 2015 (Fig. 5b). These modelled events
(Fig. 3a, b) and 2016 (Fig. 3c, d) following fall slurry ap- preceded the start of automated chamber measurements on
plications in 2014 and 2015. Declines in aqueous O2 (O2s ) DOY 91, but earlier measurements with manual chambers
were later but more rapid in 2015 than in 2016, following indicated that N2 O emission events occurred from DOY 74
greater winter precipitation and hence greater snowmelt in to 93. The smaller emission events modelled with NI were
2014–2015 (Table 4). Earlier and more persistent declines in consistent with those measured using the manual chambers,
O2s were modelled in 2016 because greater θi modelled with although some larger emissions measured with DMPP using
less thermal insulation under a shallower snowpack reduced the automated chambers from DOY 91 to 102 were not mod-
or eliminated θg during much of the winter. Drainage of melt- elled (Fig. 5b). In both years, emissions modelled and mea-
water after snowmelt eventually lowered θw and raised θg , sured without slurry remained very small, consistent with
allowing O2s to return to atmospheric equivalent concentra- low N2 Os (Fig. 3b, f).
tions.
Declines in O2s in slurry-amended treatments drove in- 5.3.2 Spring slurry applications
creases in aqueous N2 O concentrations (N2 Os ; Fig. 3b, d)
during winter and early spring (Sect. 2.7, step 1). These rises Modelled N2 O emissions closely followed measured values
were similar with and without NI in spite of higher NH+ 4 during a brief emission event following slurry application in
Biogeosciences, 17, 2021–2039, 2020 www.biogeosciences.net/17/2021/2020/R. F. Grant et al.: Modelling nitrification inhibitor effects on N2 O emissions 2029
Figure 3. Aqueous concentrations of O2 and N2 O modelled at depth of slurry injection (14 cm) during emission events in early spring of (a,
b) 2015 and (c, d) 2016 after fall slurry applications with or without DMPP on DOY 273 in 2014 and DOY 280 in 2015 and later in spring
of (e, f) 2015 and (g, h) 2016 after spring slurry applications on DOY 132 in 2015 and DOY 137 in 2016.
the drier spring of 2015 (Fig. 6a, b), driven by small rises ments over 30 d periods after spring slurry applications in
and declines in N2 Os (Fig. 3f). The smaller rise and decline 2015 and 2016 (Table 5). Total emissions modelled and mea-
in N2 Os modelled with NI than without drove smaller N2 O sured without NI were greater during the wetter spring of
emissions which declined more rapidly after application than 2016 than during the drier spring of 2015. Reductions in
emissions measured with DMPP (Fig. 6b). 30 d emissions modelled and measured with RI for DMPP
Emissions modelled without NI in the wetter spring of and nitrapyrin were greater during the wetter spring in 2016
2016 were larger than those in the drier spring of 2015 (53 % and 41 %) than during the drier spring in 2015 (35 %
(Fig. 7a, b), driven by a larger rise and decline in N2 Os and 30 %). These reductions were somewhat smaller than
with lower θg (Fig. 3h). These emissions were suppressed by those measured with DMPP and nitrapyrin in 2016 (72 % and
low θg with soil wetting during heavy rainfall on DOY 141– 64 %) and 2015 (45 % and 36 %). Emissions were not mea-
143 shortly after slurry application (Fig. 7a,b) but resumed sured with automated chambers after fall slurry applications,
when θg rose with soil drainage thereafter (Fig. 7b). Emis- preventing comparisons with modelled values.
sions modelled without NI remained greater than those mea-
sured until DOY 150, after which modelled values declined 5.4.2 Seasonal and annual N2 O emissions modelled
with soil drying while the measured value rose (Fig. 7b). after fall and spring slurry applications
Greater reductions in N2 Os (Fig. 3h) and hence in N2 O emis-
sions were modelled with NI after slurry application in the Fall slurry applications
wetter spring of 2016 (Fig. 7b) than in the drier spring of
2015 (Fig. 6b). In both years, emissions modelled and mea- NI greatly reduced N2 O emissions modelled from fall appli-
sured without slurry remained very small, consistent with cations during autumn (16 September–31 December in Ta-
low N2 Os (Fig. 3f, h). ble 6) in 2014 and 2015 and slightly reduced N2 O emis-
sions modelled during the following winter and early spring
5.4 NI effects on seasonal and annual N2 O emissions (1 January–30 April), but they slightly raised N2 O emissions
modelled during the following summer (1 May–15 Septem-
5.4.1 Modelled vs. measured N2 O emissions after ber) in both 2015 and 2016. Annual emissions modelled
spring slurry applications with NI were reduced from those without NI by 26 % and
38 % in 2014–2015 and 2015–2016 respectively (Table 6).
Total N2 O emissions modelled without NI and with NI us- The reduction modelled in 2014–2015 was similar to that of
ing RI for DMPP or nitrapyrin (Sect. 2.9) were compared 23 %, estimated for DMPP from manual chamber measure-
with those aggregated from automated chamber measure- ments from 1 October 2014 to 30 September 2015 by Lin et
www.biogeosciences.net/17/2021/2020/ Biogeosciences, 17, 2021–2039, 20202030 R. F. Grant et al.: Modelling nitrification inhibitor effects on N2 O emissions
Table 5. Seasonal N2 O emissions measured and modelled during late spring in 2015 and 2016 without slurry (C) or with slurry applied in
spring (S) without NI, with nitrapyrin or with DMPP on dates in the field study (Table 3). Negative values denote emissions, and positive
values denote uptake.
Year 2015 2016
Period 12 May–11 Jun 17 May–16 Jun
Measured Modelled Measured Modelled
Treat. Amend. mg N m−2 mg N m−2 mg N m−2 mg N m−2
C +3 −1 +14 −5
S None −88 −89 −160 −153
S DMPP −48 −58 −45 −72
S Nitrapyrin −56 −62 −57 −91
al. (2018), although the reduction with NI modelled in 2014– more slowly in colder soil (Eq. 1), particularly with later ap-
2016 was greater than that of 15 %, estimated from manual plication in 2016.
chamber measurements from 1 October 2015 to 30 Septem- Increasing surface litter incorporation and soil mixing dur-
ber 2016. ing fall slurry application raised N2 O emissions modelled
without NI only slightly during 2014–2015 but substantially
Spring slurry applications during 2014–2016, particularly during spring thaw (F0.5 and
F0.8 vs. F in Table 6). Increasing surface litter incorporation
Reductions in annual N2 O emissions modelled from spring and soil mixing during spring slurry application had limited
slurry applications with DMPP and nitrapyrin occurred al- effects on emissions (S0.5 and S0.8 vs. S in Table 6). Greater
most entirely during late spring and summer (1 May– mixing caused reductions in N2 O emissions modelled with
15 September in Table 6). These reductions were 22 % and NI to be smaller relative to those without NI.
40 % from those modelled without NI in 2014–2015 and
2014–2016 respectively (Table 6). The reduction modelled 5.6 NI effects on annual mineral N losses and NH3
with NI in 2014–2015 was greater than that of 0 % for DMPP emissions
estimated from manual chamber measurements from 1 Octo-
ber 2014 to 30 September 2015 by Lin et al. (2018), although
Injecting the slurry to 14 cm in the model suppressed NH3
the reduction modelled in 2014–2016 was similar to that of
emissions with limited soil mixing and caused only very
38 %, estimated from manual chamber measurements from
small emissions with greater mixing (Table 7). Higher NH+ 4
1 October 2015 to 30 September 2016.
concentrations modelled with NI (Fig. 2a, b) increased net
NH3 emissions, particularly if fall slurry application was de-
5.5 Effects of management on seasonal and annual layed or soil mixing was increased in 2014–2015.
N2 O emissions modelled after fall and spring The subhumid climate at Edmonton (Table 4) caused mod-
slurry applications elled NO− 3 losses to remain small. For both fall and spring
applications, lower NO− 3 concentrations modelled with NI
Advancing fall slurry application by 2 weeks increased N2 O (Fig. 2c, d) caused small reductions in NO− 3 losses.
emissions modelled with and without NI during autumn but
reduced those during subsequent spring thaw (F−2 in Ta-
ble 6) so that annual emissions modelled with and without 5.7 NI effects on barley silage yields
NI were similar to those in F with the application dates in
the experiment (Table 3). Delaying fall slurry application by Silage yields modelled with fall slurry application were
2 weeks reduced N2 O emissions modelled with and without smaller than those measured in the drier year 2015, but those
NI only slightly during autumn but greatly increased emis- modelled with both applications were greater than those mea-
sions modelled during subsequent spring thaw (F+2 in Ta- sured in the wetter year 2016, likely because of lodging ob-
ble 6), particularly with the later fall application in 2016 served in the field plots following the second year of heavy
(Table 3). Consequently delaying fall slurry application by manure use (Table 8). Modelled yields were unaffected by
2 weeks caused substantial increases in annual N2 O emis- NI for fall and spring applications in both years, although
sions. However reductions in N2 O emissions modelled with measured yields were raised by NI with spring application
NI in F+2 in 2015 and 2016 (34 % and 47 %) were greater in 2015. Modelled yields were affected by the cutting height
than those in F (26 % and 38 %) because inhibition declined and harvest efficiency set in the model runs (Sect. 4.2).
Biogeosciences, 17, 2021–2039, 2020 www.biogeosciences.net/17/2021/2020/R. F. Grant et al.: Modelling nitrification inhibitor effects on N2 O emissions 2031
Table 6. Seasonal and annual N2 O emissions modelled during autumn–winter, winter–spring and spring–summer in 2014–2015 and 2014–
2016 without slurry (C) or with slurry applied in fall (F) or spring (S) without NI or with RI for DMPP on dates in the field study (Table 3),
in fall on dates 2 weeks before (F−2) or after (F+2) those in the field study, and with soil mixing during slurry application (M) increased to
0.5 and 0.8 from 0.2 in the field study. Negative values denote emissions.
Year 2014 2015 2014–2015 2015 2016 2015–2016
From 16 Sep 1 Jan 1 May 16 Sep 1 Jan 1 May
To 31 Dec 30 Apr 15 Sep Total 31 Dec 30 Apr 15 Sep Total
Treat. Amend. mg N m−2 mg N m−2 mg N m−2 mg N m−2 mg N m−2 mg N m−2 mg N m−2 mg N m−2
C −2 −10 −14 −26 −2 −11 −13 −26
F None −93 −74 −17 −184 −93 −74 −27 −194
F DMPP −39 −68 −29 −136 −41 −50 −30 −121
F Nitrapyrin −50 −101 −20 −171 −48 −61 −29 −136
S None −2 −10 −119 −131 −3 −25 −182 −210
S DMPP −2 −10 −90 −102 −3 −18 −106 −127
S Nitrapyrin −2 −10 97 −109 −3 −24 −126 −153
F−2 None −102 −64 −17 −183 −137 −47 −26 −210
F−2 DMPP −56 −63 −19 −138 −55 −34 −23 −112
F+2 None −92 −111 −17 −220 −84 −189 −52 −325
F+2 DMPP −28 −78 −39 −145 −29 −99 −43 −171
F0.5 None −97 −71 −16 −184 −93 −168 −22 −283
F0.5 DMPP −58 −77 −17 −152 −59 −111 −20 −190
F0.8 None −102 −81 −21 −204 −98 −184 −19 −301
F0.8 DMPP −65 −76 −18 −159 −69 −138 −18 −225
S0.5 None −2 −10 −129 −141 −3 −27 −168 −198
S0.5 DMPP −2 −10 −98 −110 −3 −21 −124 −147
S0.8 None −2 −10 −138 −150 −3 −25 −168 −196
S0.8 DMPP −2 −10 −102 −114 −3 −19 −123 −145
6 Discussion 5 % and 1 % of atmospheric equivalent concentration, indi-
cating the importance of explicitly simulating gaseous and
6.1 Process modelling of N2 O emissions aqueous transport processes when modelling N2 O emissions.
O2 deficits were modelled in spring thaw 2015 (Fig. 3a),
N2 O emissions were driven by declines in gaseous O2 (O2g ) when diffusion was sharply reduced by soil saturation be-
and O2s modelled by equilibrating O2 active uptake by au- cause drainage from snowmelt and soil thaw was impeded
totrophic and heterotrophic oxidation (Sect. 2.5, step 3, and by underlying ice layers. These declines drove N2 O gener-
Sect. 2.3, step 3) with O2 diffusion and dissolution through ation (Fig. 3b) and emission (Fig. 4b) almost entirely from
gaseous and aqueous phases, and dissolution from gaseous NO− 2 reduced during spring thaw. O2 deficits were also mod-
to aqueous phases, largely controlled by θg (Fig. 1). These elled during winter 2016, when increased θi from soil freez-
O2 transfers were sustained by concentration gradients from ing with lower Ts under a shallower snowpack caused near-
O2g to O2s and from O2s to O2 at microbial surfaces (O2m ) surface soil porosity to be fully occupied by ice and water.
so that declines in O2s (Fig. 3) and O2m were relatively larger Consequent loss of θg greatly reduced surface gas exchange
than those in O2g . These greater declines enabled N2 O emis- and hence gradually reduced soil O2 concentrations, partic-
sions to be modelled from O2 deficits, while O2g remained ularly with increased O2 demand from fall slurry applica-
above one-half of atmospheric concentration, consistent with tion (Fig. 3c). The extended period of low O2s prolonged
observations of O2g during N2 O emissions from incubation overwinter accumulation of N2 Os after fall slurry applica-
and field experiments (Nguyen et al., 2017; Owens et al., tion (Fig. 3d). Transient increases in θg during soil freeze–
2017). These O2 deficits were modelled using a Km for O2m thaw cycles caused several N2 O emission events to be mod-
of 10 µM by nitrifiers (Sect. 2.5, step 3) and 2 µM by denitri- elled during spring thaw in 2016, mostly from degassing
fiers (Sect. 2.3, step 3) derived from biochemical studies by through volatilization of overwinter N2 Os (Fig. 5b). De-
Focht and Verstraete (1977). These Km values are less than
www.biogeosciences.net/17/2021/2020/ Biogeosciences, 17, 2021–2039, 20202032 R. F. Grant et al.: Modelling nitrification inhibitor effects on N2 O emissions
Table 7. Annual NO− 3 discharge and NH3 emissions modelled from 16 September to 15 September in 2014–2015 and 2014–2016 without
slurry (C) or with slurry applied in fall (F) or spring (S) without NI and with DMPP on dates in the field study (Table 3), in fall on dates 2
weeks before (F−2) or after (F+2) those in the field study, and with soil mixing during slurry application (M) increased to 0.5 and 0.8 from
0.2 in the field study. For NH3 positive values indicate deposition, and negative values indicate emission.
Year 2014–2015 2014–2016
NH3 NO−3 NH3 NO−3
Treat. Amend. mg N m−2 mg N m−2 mg N m−2 mg N m−2
C +14 277 +34 421
F None +7 330 +29 691
F DMPP −147 317 +13 662
S None +8 279 +21 617
S DMPP +4 279 +14 598
F−2 None +4 336 +26 678
F−2 DMPP −9 326 +12 658
F+2 None +3 336 +28 697
F+2 DMPP −194 321 +10 662
F0.5 None −9 321 +17 558
F0.5 DMPP −79 314 −3 554
F0.8 None −34 500 +1 368
F0.8 DMPP −101 473 −29 370
S0.5 None −3 279 +1 490
S0.5 DMPP −7 279 −8 493
S0.8 None −15 279 −15 361
S0.8 DMPP −21 279 −26 365
Table 8. Barley silage yields modelled and measured without slurry during the previous winter. N2 O emissions simulated dur-
(C) or with slurry applied in fall (F) or spring (S) with and without ing spring thaw were thus driven by concurrent NO− 2 reduc-
NI applied on dates in the field study (Table 3). tion during spring thaw (2015) and by earlier NO− 2 reduction
accumulated over the previous winter (2015–2016), as has
Year 2015 2016 been proposed from experimental observations (Teepe et al.,
Mod. Mes.a Mod. Mes.a,b 2004).
Treat. Amend. g C m−2 g C m−2 g C m−2 g C m−2 O2 deficits were also caused by rapid increases in O2 ac-
tive uptake with addition of labile C in slurry, the rapid de-
C 154 198 ± 24 128 124 ± 9
composition and oxidation of which (Sect. 2.3, step 1) caused
F None 284 355 ± 4 344 242 ± 45 transient declines in O2s with soil wetting from slurry appli-
F DMPP 283 360 ± 25 343 255 ± 15 cation and precipitation (Fig. 3e, g). After slurry application
S None 293 267 ± 12 334 195 ± 33 in the wetter spring of 2016, modelled O2g declined to around
S DMPP 297 317 ± 17 344 189 ± 32 one-half of atmospheric concentration, driving the sharp de-
clines in O2s shown in Fig. 3g. The modelled declines in O2g
a Calculated as 45 % dry matter. b Measured yields reduced by lodging.
were consistent with results from an incubation of wetted soil
amended with cattle slurry by Nguyen et al. (2017), in which
O2g declined below one-half of atmospheric concentration
gassing events in the model were consistent with field obser- within 1 d of slurry application and gradually rose again after
vations by Chantigny et al. (2017) that passive degassing of 2 d, while no decline occurred in an unamended soil. The pe-
accumulated gases made a significant contribution to spring riod of low O2s in this incubation study coincided with peak
thaw emissions, during which two or more consecutive emis- emissions of CO2 and N2 O from the amended soil, as was
sion peaks were often observed. In the model, the contribu- modelled here in Figs. 3f, h, 6b and 7b. This coincidence
tion by degassing of overwinter N2 Os to spring thaw emis- indicated that NH+ 4 and DOC oxidation drove O2 deficits
sions increased with intensity and duration of soil freezing from demand for O2 from oxidation vs. supply of O2 through
Biogeosciences, 17, 2021–2039, 2020 www.biogeosciences.net/17/2021/2020/R. F. Grant et al.: Modelling nitrification inhibitor effects on N2 O emissions 2033
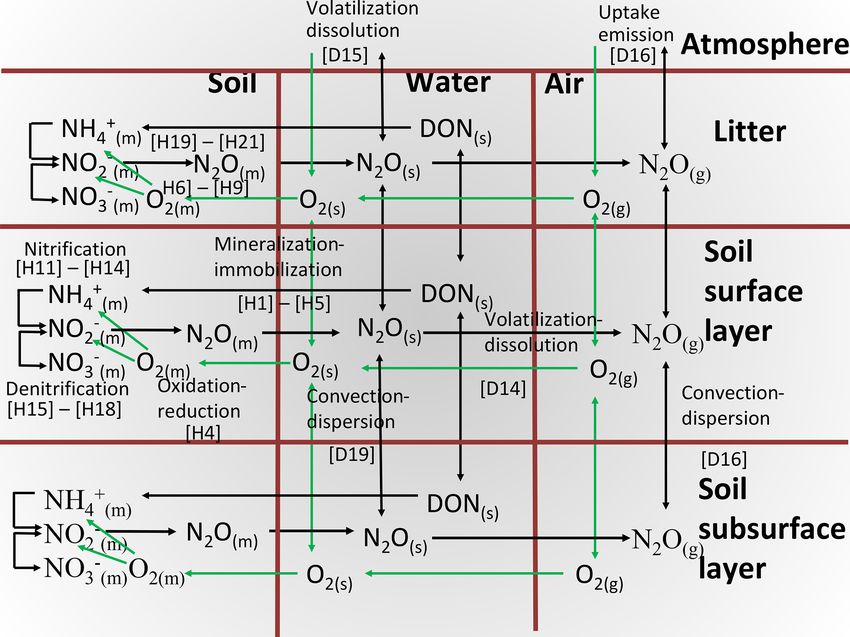
Figure 4. (a) Air temperature and precipitation and (b) N2 O Figure 5. (a) Air temperature and precipitation and (b) N2 O
fluxes measured (symbols) and modelled (lines) during early spring fluxes measured (symbols) and modelled (lines) during early spring
2015 with no slurry (control) and following slurry application on 2016 with no slurry (control) and following slurry application on
DOY 273 in 2014 with or without DMPP. Filled symbols represent DOY 280 in 2015 with or without DMPP. Filled symbols represent
manual chamber measurements by Lin et al. (2018). Negative val- manual chamber measurements. Negative values denote emissions.
ues denote emissions.
convection–dispersion, which caused NO−2 reduction as rep-
of NI in reducing overwinter N2 O emissions have been found
resented in the model, again demonstrating the importance (e.g. Pfab et al., 2012), indicating the importance of fTs in
of simulating aqueous and gaseous O2 transfers when mod- Eq. (1).
elling N2 O emissions. The slower decline of It from low fTs enabled ecosys to
simulate larger reductions in N2 O emissions with NI after
6.2 Process modelling of NI effects on N2 O emissions fall slurry applications in cooler soil vs. spring slurry appli-
cations in warmer soil during both years (F during autumn
6.2.1 Fall slurry application vs. S during late spring–summer in Table 6). Reductions in
N2 O emissions modelled with NI after fall slurry applica-
NH+ 4 oxidation in the model (Sect. 2.5, step 4) proceeded tions became greater when fall applications were delayed
rapidly after fall slurry application without NI, as indicated (F+2 in Table 6), further reducing Ts and fTs during sub-
by rapid declines in NH+ 4 (Fig. 2a), consistent with observa- sequent nitrification. The greater reductions modelled with
tions in other studies that soil NH+4 concentrations returned fall applications were consistent with experimental observa-
to background levels 30 d after fall slurry application (Ro- tions by Merino et al. (2005), who attributed larger reduc-
chette et al., 2004). Slower NH+ 4 oxidation modelled with tions in N2 O emissions measured with NI from fall-applied
NI (Eq. 3) during fall caused slower declines of soil NH+ 4 vs. spring-applied cattle slurry to slower NI degradation in
before and during freezing and hence larger NH+ 4 concen- cooler soil. These modelled and experimental results indi-
trations during spring thaw (Fig. 2a). These slower declines cated that NI effectiveness in reducing N2 O emissions varies
were modelled from slower decline of It with low fTs in with the effect of fall slurry timing on fTs .
cold soils (Eq. 1), which slowed NH+ 4 oxidation and thereby The greater reductions in N2 O emissions modelled from
reduced N2 O emissions simulated during late autumn and delayed fall applications with NI were associated with much
spring thaw (Figs. 4b and 5b), despite increased NH+ 4 con- greater N2 O emissions modelled from delayed fall appli-
centrations (Fig. 2). These reductions were consistent with cations without NI (F+2 in Table 6). These greater emis-
those from chamber measurements at the Edmonton South sions were attributed to less NH+ 4 oxidation before freeze-
Campus Farm (Lin et al., 2018) and with those from a lim- up in fall, resulting in more NH+ 4 remaining to drive NH4
+
ited number of studies elsewhere, in which persistent effects oxidation and hence N2 O emissions during spring thaw.
www.biogeosciences.net/17/2021/2020/ Biogeosciences, 17, 2021–2039, 2020You can also read