Phloem Loading through Plasmodesmata: A Biophysical Analysis1 OPEN - Plant Physiology
←
→
Page content transcription
If your browser does not render page correctly, please read the page content below
Phloem Loading through Plasmodesmata:
A Biophysical Analysis1[OPEN]
Jean Comtet,a Robert Turgeon,b and Abraham D. Stroock a,c,2
a
  School of Chemical and Biomolecular Engineering, Cornell University, Ithaca, New York 14853
b
  Plant Biology Section, Cornell University, Ithaca, New York 14853
c
  Kavli Institute at Cornell for Nanoscale Science, Cornell University, Ithaca, New York 14853
ORCID IDs: 0000-0003-2389-3879 (J.C.); 0000-0002-6019-6741 (R.T.); 0000-0002-8145-9977 (A.D.S.).

In many species, Suc en route out of the leaf migrates from photosynthetically active mesophyll cells into the phloem down its
concentration gradient via plasmodesmata, i.e. symplastically. In some of these plants, the process is entirely passive, but in
others phloem Suc is actively converted into larger sugars, raffinose and stachyose, and segregated (trapped), thus raising total
phloem sugar concentration to a level higher than in the mesophyll. Questions remain regarding the mechanisms and selective
advantages conferred by both of these symplastic-loading processes. Here, we present an integrated model—including local and
global transport and kinetics of polymerization—for passive and active symplastic loading. We also propose a physical model of
transport through the plasmodesmata. With these models, we predict that (1) relative to passive loading, polymerization of Suc
in the phloem, even in the absence of segregation, lowers the sugar content in the leaf required to achieve a given export rate and
accelerates export for a given concentration of Suc in the mesophyll and (2) segregation of oligomers and the inverted gradient of
total sugar content can be achieved for physiologically reasonable parameter values, but even higher export rates can be accessed
in scenarios in which polymers are allowed to diffuse back into the mesophyll. We discuss these predictions in relation to further
studies aimed at the clarification of loading mechanisms, fitness of active and passive symplastic loading, and potential targets
for engineering improved rates of export.

   Vascular plants export sugars and other nutrients                           Insights into these transport processes may also suggest
from leaves through a living vascular tissue, the                              ways to design efficient synthetic systems to control
phloem. This transport process drives photosynthetic                           chemical processes (Stroock et al., 2014; Comtet et al.,
products to remote tissues (sinks) for growth and                              2017).
storage, coupling synthesis, and intercellular transport                          Particular outstanding questions relate to the mech-
processes in the leaves and sink tissues to global, hy-                        anisms by which plants transfer Suc, and in some cases
draulic transport through the phloem sieve tubes and                           sugar alcohols, from the photosynthetically active me-
xylem vessels. Significant uncertainties remain regard-                         sophyll to the transport phloem (phloem loading) in the
ing the structure, chemistry, and transport phenomena                          subset of species in which this loading step occurs
governing these processes (Knoblauch and Peters, 2010;                         symplastically, i.e. through the open channels of plas-
Turgeon, 2010a, 2010b). Improved models of export                              modesmata (Fu et al., 2011; Zhang et al., 2014; Fig. 1A).
will inform our understanding of whole-plant physi-                            In most symplastic loaders, there is no buildup of
ology and open opportunities to engineer sugar con-                            sugars in the phloem, as shown in Figure 1B; this dis-
centrations and transport processes to improve growth                          tribution of sugars suggests passive transfer from me-
and yield (Schroeder et al., 2013; Giraldo et al., 2014).                      sophyll to phloem, as postulated by Münch (1930). In a
                                                                               second symplastic loading mechanism, Suc passes from
   1
     J.C. and A.D.S. acknowledge support from the Air Force Office of
                                                                               mesophyll cells into bundle sheath cells and from the
Scientific Research (FA9550-15-1-0052) and the Camille Dreyfus                  bundle sheath into specialized phloem companion cells
Teacher-Scholar Awards Program. R.T. acknowledges support from                 in the minor veins known as intermediary cells through
the National Science Foundation-Integrative Organismal Systems                 specialized plasmodesmata (Fig. 1A). In the interme-
(1354718).                                                                     diary cells, the Suc is converted, in an energetically
   2
     Address correspondence to ads10@cornell.edu.                              active polymerization process, to raffinose family oli-
   The author responsible for distribution of materials integral to the        gosaccharides (RFOs; principally raffinose and stachy-
findings presented in this article in accordance with the policy de-            ose). Transfer of RFOs back into the mesophyll does not
scribed in the Instructions for Authors (www.plantphysiol.org) is:
                                                                               appear to occur, and one observes elevated total con-
Abraham D. Strook (ads10@cornell.edu).
   A.D.S. and R.T. conceived the project; J.C. performed the modeling
                                                                               centrations of sugars in the phloem relative to the me-
work with input from R.T. and A.D.S.; J.C., R.T., and A.D.S. analyzed          sophyll (Fig. 1B; Voitsekhovskaja et al., 2006; Haritatos
and interpreted results and wrote the article.                                 et al., 1996; Fisher 1986). This inversion of the total
   [OPEN]
           Articles can be viewed without a subscription.                      concentration gradient of sugars depends on the po-
   www.plantphysiol.org/cgi/doi/10.1104/pp.16.01041                            lymerization reaction (McCaskill and Turgeon, 2007)
904       Plant PhysiologyÒ, October 2017, Vol. 175, pp. 904–915, www.plantphysiol.org Ó 2017 American Society of Plant Biologists. All Rights Reserved.

                                    Downloaded on February 13, 2021. - Published by https://plantphysiol.org
                                   Copyright (c) 2020 American Society of Plant Biologists. All rights reserved.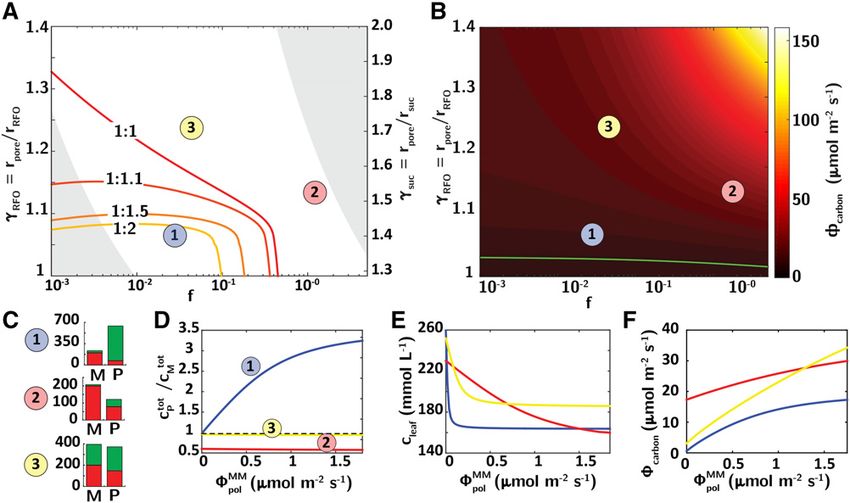
Biophysics of Phloem Loading through Plasmodesmata

          Figure 1. Overview of phloem loading and global model of symplastic phloem transport. A, Cross-sectional view of mesophyll/
          phloem (M/P) interface of a mature Cucumis melo leaf, showing plasmodesmata with the secondary branching pattern that is
          characteristic of active symplastic loaders (red arrowheads). Bar = 250 nm. Adapted from Volk et al. (1996). B, Autoradiographs of
          leaf discs from apple (Malus domestica), a passive symplastic loader, and Coleus blumei, an active symplastic loader. Abraded
          discs were incubated in [14C]Suc, washed, freeze dried, and pressed against x-ray film. Minor veins are apparent in C. blumei, but
          not apple discs. Discs are 8 mm diameter. Adapted from Turgeon (2010a) and Rennie and Turgeon (2009). C, Total leaf osmolality
          in passive and active symplastic and apoplastic loading species. Error bars are SE; derived from Rennie and Turgeon (2009). D,
          Model for water and sugar transport in active and passive symplastic loaders. Carbon fixed from CO2 is used to synthesize Suc (red
          circles) or is transiently stored as starch. Suc passes through plasmodesmata down a concentration gradient from the mesophyll to
          the phloem. In active symplastic loaders, most of the Suc entering the phloem is polymerized into RFO (green) by an enzymatic
          process (yellow stars). Depending on the plasmodesmatal properties, some of the RFO can diffuse back to the mesophyll cells. Suc
          and RFO are then exported via bulk flow in the transport phloem. E, Circuit diagram of model in D. Hydraulic interfaces are
          characterized by hydraulic permeabilities (L [m s21 Pa21]) and reflection coefficients (s [2]) (s ¼ 1 for osmotic membranes); the
          plasmodesmata interface is further characterized by a diffusive mass transfer coefficient (k [m s21]). Volumetric fluxes of water (Q
          [m s21], blue arrows) and molar fluxes of solute (f [mole m22 s21], red arrows) pass through the circuit from the xylem at pressure,
          PX [Pa] to tissue sinks for the sugars at a pressure, PS [Pa]. In the MV-phloem, n Suc are polymerized to form one RFO at a rate fpol
          [mole m22 s21]. See Table I for values of all parameters used.

and correlates with lower concentration of sugars in the                        pores from mesophyll to minor vein phloem, while si-
mesophyll, and hence in the whole leaf, relative to                             multaneously preventing the passage of larger RFOs in
plants that load passively (Rennie and Turgeon, 2009;                           the opposite direction? One possibility is that the plas-
Fig. 1C). In these two characteristics (inverted total                          modesmata in question are very narrow, allowing Suc
concentration gradient of sugars and lower total sugar                          to pass via diffusion (Haritatos and Turgeon, 1995;
content in leaves), active symplastic loaders, also                             Liesche and Schulz, 2013; Turgeon and Gowan, 1990) or
known as polymer trappers, match the characteristics                            advection (Dölger et al., 2014; Voitsekhovskaja et al.,
of apoplastic loaders in which photoassimilate is ac-                           2006) while inhibiting RFO backflow on the basis of
tively pumped into the phloem (Fig. 1C; Haritatos et al.,                       steric selectivity. However, coupling of local plasmo-
1996; Voitsekhovskaja et al., 2006; Rennie and Turgeon,                         desmatal dynamics with whole-plant transport of
2009). In this paper, we refer to RFO accumulation in                           water and sugars and the kinetics of polymerization has
the phloem as “segregation” and the elevated total                              so far been neglected. A second question is raised by
concentration of sugars in the phloem relative to the                           segregation: How can phloem osmolarity be higher
mesophyll as “gradient inversion.”                                              than in the mesophyll given that polymerization reac-
   The observation of strong segregation of sugars in the                       tions reduce the number of osmotically active mole-
phloem (Fig. 1B) and low levels of whole-leaf osmo-                             cules in the phloem sap? Finally, a more general
larity (Fig. 1C) in polymer trap plants provokes a                              question: How do the rates of symplastic loading,
number of questions. First, what mechanisms permit                              convective export, and polymerization influence sugar
passive transport of Suc through these apparently open                          segregation and translocation rates?
Plant Physiol. Vol. 175, 2017                                                                                                                     905

                                 Downloaded on February 13, 2021. - Published by https://plantphysiol.org
                                Copyright (c) 2020 American Society of Plant Biologists. All rights reserved.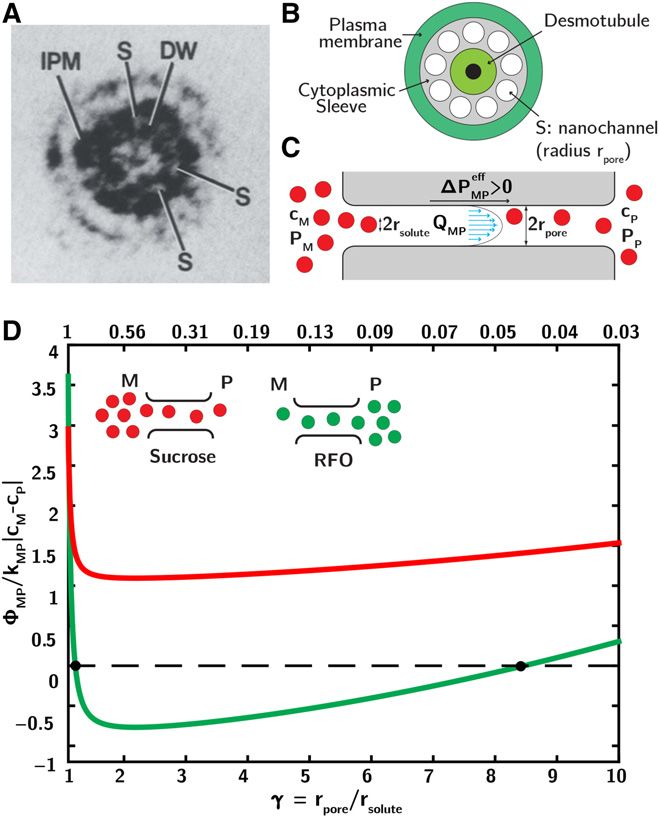
Comtet et al.

   Only a few models of phloem transport consider                    interface between the mesophyll and phloem par-
loading mechanisms and distinguish between meso-                     tially reflects sugars (0 # sMP # 1) and allows for
phyll and phloem (Dölger et al., 2014; Lacointe and                  diffusive transfer of sugars (kMP $ 0Þ; we explore details
Minchin, 2008; Thompson and Holbrook, 2003). Other                   of plasmodesmatal transport processes in Figure 2. The
simplified modeling approaches (Jensen et al., 2011,                  transport phloem allows water flow and free advective
2012; Jensen and Zwieniecki, 2013) have given insight                transfer of sugars (sP ¼ 0), and we neglect diffusion of
into phloem traits at the plant scale but avoid the                  sugars (kP ¼ 0). We consider Michaelis-Menten kinetics
question of phloem loading by considering a fixed hy-                 for polymerization of n Suc into one RFO at rate
drostatic pressure in the phloem. In this article, we in-                    fMM csuc
                                                                     fpol ¼ KMpolþcPsuc with fMM
                                                                                              pol the maximal polymerization
troduce a global model of water and sugar transport                                 P

in symplastic loading species with explicit kinetics of              rate and KM the Michaelis-Menten constant. With
polymerization (Fig. 1, D and E). We then consider the               fMM
                                                                       pol ¼ 0, the system models passive symplastic load-
transport properties of plasmodesmata, including the                 ing. See “Materials and Methods” and Supplemental
relative importance of diffusion and advection, and                  Information S1 for details.
determine how long-distance transport is affected by
the segregation of Suc polymers in the phloem. These
                                                                     Nondimensional Parameters That Characterize Loading
analyses provide new insights into the nature of sym-
plastic loading mechanisms and the adaptive advan-                      In the model of active symplastic loading described
tages they confer.                                                   above (Fig. 1, D and E), diffusive loading of Suc from
                                                                     mesophyll to phloem and advective export of sugars
                                                                     within the phloem occur simultaneously. We expect
RESULTS                                                              that the relative magnitudes of these fluxes should play
                                                                     an important role in defining distinct regimes of the
A Globally Coupled Model of Symplastic Loading
                                                                     predicted behavior, i.e. advection-limited (greater dif-
with Polymerization
                                                                     fusive Suc loading compared to advective export of
   Figure 1D is a schematic cross section of a leaf minor            sugars) versus diffusion-limited (minimal diffusive
vein in symplastic loaders (either passive or active;                loading of Suc compared to advective export of sugars).
electron micrograph in Supplemental Fig. S1) present-                Here, we identify the characteristic magnitude of these
ing the hypothesized transport processes: Photosyn-                  rates and normalize the global advection of sugars
thetic products (Fig. 1D, red circles; Suc in all plants and         within the transport phloem by the diffusive compo-
also sugar alcohols in some) diffuse and advect through              nent of transport through plasmodesmata. We call the
plasmodesmata (cross-sectional view in Figure 1A)                    resulting nondimensional ratio the flushing number (f)
down their concentration gradient from the mesophyll                 and show, in the following sections and in a separate
(site of synthesis) to the phloem (site of advective                 study (Comtet et al., 2017), that it provides a useful
evacuation). Suc is then polymerized into RFOs in the                parameterization of the predicted behavior, even
phloem (green double circles in Figure 1D). Elevated                 when we consider both advective and diffusive trans-
osmolarity in the mesophyll and phloem recruits water                port inside the plasmodesmata (see Supplemental
from the xylem (Fig. 1D, blue arrows) to drive con-                  Information S2).
vection along this pathway. Water and sugars are                        First, we identify the characteristic net driving force,
subsequently exported by advection through the                       DPc , for water flow from leaf to sink as the mesophyll
transport phloem (T-phloem) to sinks (Fig. 1D, blue and              osmotic pressure minus the negative pressure differ-
red downward arrows, respectively).                                  ence between leaf xylem and the unloading zone in the
   Figure 1E presents a circuit representation of steady             transport phloem:
fluxes of water (Qi ½m s 2 1 , blue arrows) and sugars
(fi ½mole m 2 2 s 2 1 ; red arrows) from xylem to the                                  DPc ¼ RTcsuc
                                                                                                 M þ PX 2 PS :                         ð1Þ
mesophyll (QXM ) and to the MV-phloem (QXP ), from
mesophyll to the MV-phloem (QMP ; fsuc     MP ; fMP Þ, and
                                                   RFO               Second, analysis of the hydraulic network gives a total
through the phloem to sink tissues (QP ; fP ; fRFO
                                                 suc                 conductance for the leaf in series with the transport
                                                        P ).
All fluxes are defined with respect to the exchange                    phloem:
surface area of MV-phloem through which Suc loading                                                         1
occurs. The zig-zag black lines in Figure 1E represent                                       Ltot ¼                                    ð2Þ
                                                                                                      Lleaf þ LP
                                                                                                       1       1
available paths for water and sugar transfer. Each path
presents a hydraulic conductance (L [m s21 Pa21]) for
water flow. The interface of the mesophyll and phloem                 where Lleaf ¼ 1=ð1=LXM þ 1=LMP Þ þ LXP is the effective
with the xylem is a perfect osmotic membrane that                    conductance of the leaf (LXP is in parallel with LXM and
excludes passage of sugars by either advection (re-                  LMP, which are in series). We assume here that water can
flection coefficient, sXM ¼ sXP ¼ 1) or diffusion [dif-                enter the leaf from xylem to mesophyll, or from xylem
fusive mass transfer coefficient, kXM ¼ kXP ¼ 0 ðm s 2 1 Þ           to phloem. Together, Equations 1 and 2 define the char-
(Katchalsky and Curran, 1965). The plasmodesmatal                    acteristic water flux through the phloem:
906                                                                                                           Plant Physiol. Vol. 175, 2017

                              Downloaded on February 13, 2021. - Published by https://plantphysiol.org
                             Copyright (c) 2020 American Society of Plant Biologists. All rights reserved.
Biophysics of Phloem Loading through Plasmodesmata
transfer and Suc diffusion from the mesophyll through
the plasmodesmata interface. We approximate this
diffusive loading flux as kMP ðcM 2 csuc
suc suc
P Þ kMP cM ,
suc suc
where kMPsuc
[m s 2 1 ] is the diffusive mass transfer co-
efficient of Suc through the plasmodesmatal interface.
To characterize this competition, we propose the fol-
lowing nondimensional ratio of global advection out
of the transport phloem and local diffusion through
plasmodesmata:
advection QcP csuc QcP
f ≡ ¼ suc M
¼
diffusion kMP csuc
M
suc
kMP
M þ PX 2 PS
Ltot RTcsuc
¼ suc : ð4Þ
kMP
For large values of this flushing number, f, phloem
loading is diffusion limited and the concentration of
phloem sugars will be low because sugars are flushed
out of the MV-phloem more quickly than they can dif-
fuse in; gradient inversion (elevated total concentration
of sugars in MV-phloem; Fig. 1, B and C) is suppressed
in this regime. For small values of f, loading is convec-
tion limited and sugar concentration in the MV-phloem
is high, favoring gradient inversion. This number is rel-
evant for both passive and active symplastic loaders
(Comtet et al., 2017).
Figure 2. Plasmodesmata transport. A, Transmission electron micro-
graph showing a transverse cross section of a plasmodesma between Physiology of the Plasmodesmata
phloem parenchyma cells (Fig. 1A presents longitudinal cross section).
Note spaces (S) between particles of the desmotubule wall (DW) and the Although segregation of RFOs based on a size ex-
inner leaflet of the plasma membrane (IPM; Ding et al., 1992). B, Sche- clusion mechanism has been proposed (Turgeon, 1991;
matic representation of longitudinal cross section of a plasmodesma, Dölger et al., 2014), discrimination based only on hy-
showing the desmotubule (a tube of appressed endoplasmic reticulum drodynamic radii seems difficult considering that
that extends between the adjacent cells); and the cytoplasmic sleeve stachyose is only 40% larger than Suc (Liesche and
between the desmotubule and plasma membrane. Membrane proteins Schulz, 2013), and raffinose is even smaller than
are thought to divide the cytoplasmic sleeve into nanochannels (S) which,
stachyose. Even if the RFOs mass transfer coefficient is
though irregular in form, are represented as tubes (inspired by Lucas and
Jung-Youn, 2004). C, Schematic representation of longitudinal cross reduced by steric interaction with plasmodesmatal
section of a nanochannel. Molecules of hydrodynamic radius rsolute are channels (Turgeon and Gowan, 1990; Dölger et al.,
transported by advection (QMP) and diffusion through a nanochannel of 2014), back diffusion and leakage of RFOs into the
radius rpore. Water flow is created by an effective pressure difference mesophyll will eventually occur. Dölger et al. (2014)
MP ¼ DP 2 ssuc RTDcsuc 2 sRFO RTDcRFO . 0 between mesophyll (M)
DPeff presented a physical model of hindered transport of Suc
and phloem (P). D, Ratio of total and diffusive molar fluxes of solute in a through the plasmodesmata interface, concluding that
channel submitted to an effective pressure difference DPeff MP of 0.2 bar the reentry of raffinose in the mesophyll could not be
M . PP Þ across a single channel (not coupled to the global model) as a
ðPeff eff
prevented by advective sweeping due to water flow
function of the confinement parameter g=rpore/rsolute (bottom axis) or
through plasmodesmata. Here, we present an explicit
equivalent reflection coefficient, sMP (top axis; Supplemental Eq. S21). The
gradient of solute is either with (red, Suc) or against (green, stachyose) the
model of advection and diffusion within the plasmo-
direction of water flow, with cmax ¼ 1:5$cmin desmata (Fig. 2) coupled with our global model of
i i . See Supplemental Information
S1 for details on the plasmodesmata transport model, and Supplemental symplastic transport (Fig. 1E) to reexamine the mech-
Information S3 for estimation of the effective pressure difference. anism of RFO segregation.
Pore-Scale Model of Plasmodesmata Transport
QcP M þ PX 2 PS :
¼ Ltot DPc ¼ Ltot RTcsuc ð3Þ Figure 2A presents an electron micrograph of a
plasmodesma in transverse section. Sugar mole-
This flow carries sugars out of the MV-phloem at a cules are thought to pass through the space between
rate, fcP ¼ QcP $ csuc
P QP $ cM , so that we expect that
c suc the desmotubule (Fig. 2A, “DW”) and the plasma
the concentration of sugars in the phloem will depend, membrane, i.e. the “cytoplasmic sleeve,” (Fig. 2A,
in part, on a competition between this advective “IPM”). One common, idealized interpretation of the
Plant Physiol. Vol. 175, 2017 907
Downloaded on February 13, 2021. - Published by https://plantphysiol.org
Copyright (c) 2020 American Society of Plant Biologists. All rights reserved.Comtet et al.
cytoplasmic sleeve is that of a series of nanochannels (Eq. 5) by its diffusive component, kMP jDcj . 0. Posi-
created by regularly arranged proteins within the tive flux corresponds to net transfer from mesophyll
cytoplasmic sleeve (Fig. 2A, “S”; Ding et al., 1992; Terry (Fig. 2C, left) to phloem (Fig. 2C, right). The upper axis
and Robards, 1987). In Figure 2B, we model each plas- of Figure 2D represents the reflection coefficient,
modesma as a bundle of nine pores of equivalent radius sMP ðgÞ (Dechadilok and Deen, 2006) for a given con-
rpore and length l (Terry and Robards 1987). In Figure finement parameter (Supplemental Eq. S21). For these
2C, we follow Deen (1987) and consider hindered calculations, we impose a fixed effective pressure
transport of spherical solute molecules in cylindrical difference DPeffMP ¼ DP 2 ssuc RTDcsuc 2 s RFO RTDcRFO =
pores, accounting for steric interactions of solute 0.2 bar driving a water flow between mesophyll and
molecules with the pore wall. In following this ap- phloem, with Peff M . PP (Supplemental Eqs. S5a-b and
eff
proach, we adopt a confinement parameter, the ratio S15; Supplemental Information S3). This effective differ-
r
of pore radius to sugar molecule radius, g i ¼ poreri $ 1, ence in pressure represents the combined effect of the
where i is either Suc or RFOs; this parameter con- difference in mechanical pressure and the differences in
trols the partial rejection of sugar species i due to concentration of the two solutes and depends on plas-
steric interactions with the pore, such that the flux modesmatal interface reflection coefficients for Suc and
of Suc and RFOs from mesophyll to phloem can be RFOs (Katchalsky and Curran, 1965). With this driving
expressed as force fixed (to isolate the effect of the plasmodesmatal
interface), we evaluate the rate of transfer of sugars by
ciM 2 ciP
fMP ¼ 1 2 sMP ðg i Þ QMP cM þ
i i i
ð5Þ combined hindered advection and diffusion in the pres-
expðPei Þ 2 1 ence of flow using Equation 5.
For all degrees of confinement, we predict forward
where siMP ðgi Þ [2] is the reflection coefficient that de- flux of Suc (red curve always above zero in Fig. 2D), as
pends only on the ratio gi , Pei ¼ ½1 2 siMP ðgi ÞQMP =kMPi expected given the downhill gradient of both effective
is the Péclet number characterizing the ratio of pressure and Suc concentration. For RFO, the predicted
hindered advection to hindered diffusion in the behavior is more complicated: In the limit of strong
pore, kMPi
is the mass transfer coefficient that ac- confinement (g→1), we predict forward flux of RFO
counts for hindered diffusion of solute, and QMP (red line in Fig. 2D), such that no transfer of RFO back
is the flux of water between mesophyll and phloem from phloem to mesophyll occurs, despite a higher RFO
(Deen, 1987; Dechadilok and Deen, 2006; Supplemental concentration in the phloem. The RFO will be segre-
Eqs. S18–S21). In the limit of low Péclet number, gated in the phloem. This effect arises because the pore
Pei 1, Equation 5 simplifies to fiMP ¼ kMP i
ðciM 2 ciP Þþ wall impedes more strongly solute diffusion than solute
½1 2 sMP ðg i ÞQMP cM , for which diffusive and advective
i i advection. As g→1; hindrance of diffusive transport
flux through plasmodesmata are completely decoupled occurs due to the increase in the viscous drag experi-
(Supplemental Eq. S24). This limit, for which advec- enced by solute particles, while advection of solute is
tive effects are weak, was used by Dölger et al. (2014) less hindered, as steric interactions restrict solute to the
in their model of plasmodesmatal transport. zone of maximum flow in the center of the pore, where
For clarity, we emphasize that the relative strength advection is strongest (Fig. 2C; Dechadilok and Deen,
of advection and diffusion captured by the Péclet 2006). At intermediate degrees of confinement (1.2 ,
number relates to local transport processes within the g , 8 in this example), net backward transfer of RFOs
pores of the plasmodesmata. On the other hand, from phloem to mesophyll can occur, as back diffusion
the flushing number defined in Equation 4 is the ratio outstrips advection with the forward-moving flow.
of global advection of sugars within the transport For larger pores (g . 8 in this example), we again
phloem to the diffusive component of transport through predict forward flux of RFO and thus its segregation in
the plasmodesmata, from mesophyll to phloem. In the phloem, because advection dominates again in this
Supplemental Information S5, we provide a further limit.
discussion of the relationship between these nondi- In summary, we predict that advection of water can
mensional parameters. inhibit back diffusion of RFO from phloem to meso-
phyll in the limits of both strong (g → 1) and weak
Steric Hindrance and Advection Can Inhibit Back Diffusion (g 1) confinement within the plasmodesmata. The
of RFOs conclusion of Dölger et al. (2014) that water flow cannot
prevent back diffusion of RFO should thus be reeval-
To what degree do diffusion and hindered advec- uated by considering transport over the entire range of
tion affect flux of Suc and RFO through plasmodes- Péclet number, as in Equation 5. The small Péclet
mata? In Figure 2D, we focus on the transport of these number limit assumed in their analysis underestimated
solutes across the plasmodesmatal interface. We plot the effect that advective water flow from mesophyll to
the molar fluxes [mol m22 s21] of Suc (Fig. 2D, red) phloem has on retarding the movement of RFOs in the
and RFO (Fig. 2D, green) through a model pore (Fig. opposite direction. In other words, their analysis pre-
2C) as a function of the confinement parameter dicted that an unrealistically large bulk flow was nec-
r
g i ¼ pore
ri (Eq. 5). We normalize the total sugar flux fMP essary to prevent back diffusion of RFO, compared to
908 Plant Physiol. Vol. 175, 2017
Downloaded on February 13, 2021. - Published by https://plantphysiol.org
Copyright (c) 2020 American Society of Plant Biologists. All rights reserved.Biophysics of Phloem Loading through Plasmodesmata
our predictions with the more complete expression in polymerization rate (see “Materials and Methods”). We
Equation 5. Our analysis thus predicts that advection use parameters for stachyose to represent RFO species,
through the plasmodesmata can aid in creating the with degree of polymerization n = 2. We assume here
segregation and gradient inversion that one observes in that the permeabilities of the xylem-phloem and xylem-
active symplastic loaders (Fig. 1B). Thus, one does not mesophyll interfaces have similar values: LXP ¼ LXM ¼
need to invoke chemical selectivity within the plasmo- 5$10 2 14 m s21 Pa21. Note that we find qualitatively
desmata in order to explain these observations. similar results—gradient inversion can occur—when tak-
ing smaller permeabilities (down to 5$10 2 16 m s21 Pa21)
for either one or the other interface (see Supplemental
Whole-Plant Transport and Plasmodesmatal Selectivity Information S4).
The charts in Figure 3C present the calculated con-
Figure 3 presents predictions of our global water centrations of RFO (green) and Suc (red) in the meso-
transport model (Fig. 1, D and E) with the hindered phyll cells (M) and phloem (P) at three points of
transport model presented in Figure 2. See Table I differing convection (varied by changing transport re-
for the parameter values used in the model. Figure 3 sistance) and hindrance (varied by changing plasmo-
presents distributions of sugars (Fig. 3A) and carbon desmatal radius). In Figure 3, D to F, we explore trends
export rate (Fig. 3B) with respect to the strength of with polymerization rate and present additional trends
global convection versus advection (flushing number; f) for pressure, water potential, and effective pressure
and confinement parameters (gRFO ¼ rpore =rRFO on difference in Supplemental Information S3 (see Table I
left axis; gsuc ¼ rpore =rsuc on right axis) for a typical for parameter values).
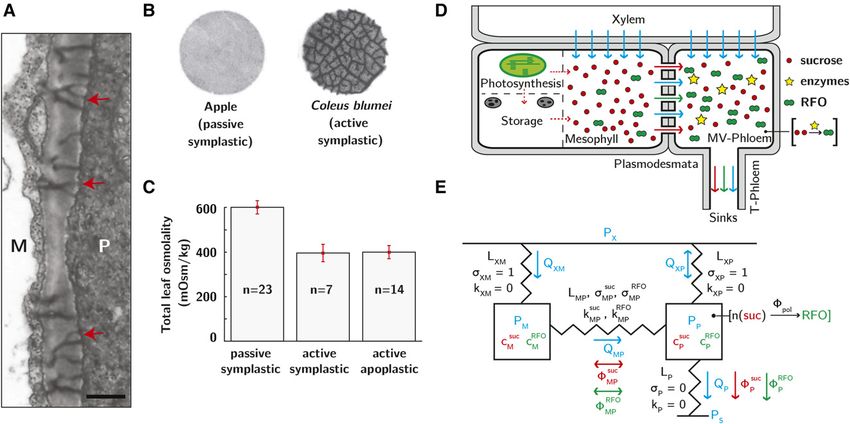
Figure 3. Gradient inversion and export with hindered transport through plasmodesmata. A, State diagram of gradient
inversion as a function of confinement parameters, gRFO and gsuc , and flushing number, f. Isolines show the ratio of the total
concentration in the phloem and in the mesophyll, for rstac/rsuc = 1.4 and hindered plasmodesmatal transport. The red curve
(1:1) is the frontier between conditions that provide gradient inversion (minor vein phloem concentration greater than
mesophyll concentration, cP . cM) and those that do not (cP , cM ). The curves 1:1.1, 1:1.5, and 1:2 correspond to 10%,
50%, and 100% excess concentration in the phloem. Point 1, rpore/rRFO = 1.13 and f = 0.04; point 2, rpore/rRFO = 1.23 and f =
1.4; point 3, rpore/rRFO = 1.07 and f = 0.02. In constructing this plot, we varied rpore and LP keeping other parameters
fixed (see “Materials and Methods” and Table I). The gray shaded areas represent conditions outside of the estimated
physiological range based on Lp (bottom left boundary, Lp ¼10 216 m/s/Pa; top right boundary, Lp ¼10212 m/s/Pa;
Supplemental Eq. S16). We discuss other scenarios in Supplemental Information S4. B, Total translocation rate of
equivalent Suc as a function of g and f. Black, low translocation rates; yellow, high translocation rates. The green line
corresponds to a constant export rate of 900 nmol/m2/s, corresponding to typical physiological values (Schmitz et al.,
1987). C, Histograms showing Suc (red) and RFO (green) levels in the mesophyll (M) and phloem (P) for the conditions
of the three points indicated in A and B. D to F, Plots of ratio of total concentration in the phloem over total concentration
syn
in the mesophyll (D); total concentration in the leaf generated for a constant export rate fcarbon (E) and equivalent
carbon flux (F; Eq. 6) for the three points in A and B. Blue line, point 1; red line, point 2; yellow line, point 3. The variation
of pressure, water potential and effective pressure difference in mesophyll and phloem are shown in Supplemental
Information S3.
Plant Physiol. Vol. 175, 2017 909
Downloaded on February 13, 2021. - Published by https://plantphysiol.org
Copyright (c) 2020 American Society of Plant Biologists. All rights reserved.Comtet et al.
Table I. Table of parameters (see Supplemental Information S5 for parameter estimation)
Notation Definition Typical Values
Concentrations, c [mmol]
csuc
M Sucrose concentration in the mesophylls 200 mmol
cRFO
M RFO concentration in the mesophylls –
csuc
P Sucrose concentration in the minor vein phloem –
cRFO
P RFO concentration in the minor vein phloem –
ctot
P Total concentration of sugars in the mesophylls
P 5 cP 1 cP )
(ctot suc RFO
ctot
M Total concentration of sugars in the minor vein phloem
M 5 cM 1 cM )
(ctot suc RFO
cleaf Average concentration of sugars in the leaf
(cleaf 5 vM ctot
M 1 vP cP )
tot
Permeabilities, L [m/s/Pa]
LXM Xylem/mesophyll permeability (Jensen et al., 2011) 5$10214 m s21 Pa21
LXP Xylem/phloem permeability (Jensen et al., 2011) 5$10214 m s21 Pa21
213
LMP Mesophyll/phloem plasmodesmatal permeability 10 to 5$10212 m s21 Pa21
LP Transport phloem equivalent permeability 10210 to 10216 m s21 Pa21
Pressures and water potentials, P [bar]
PX Xylem water pressure 21 bar
PS Sink (roots) water pressure 0 bar
PM Mesophyll hydrostatic pressure –
PP Minor veins hydrostatic pressure –
Water flux, Q [m/s]
QXM Water flux from xylem to mesophylls –
QXP Water flux from xylem to minor vein phloem –
QMP Plasmodesmatal water flux from mesophylls to phloem –
QP Water flux through the transport phloem –
Sugar flux through plasmodesmata, f [mmol/m2/s]
fsuc
MP Sucrose flux through the plasmodesmata –
fRFO
MP RFO flux through the plasmodesmata –
fcarbon Carbon flux transported through the phloem (Eq. 6)
10.8 mmol m22 s21
syn
fcarbon Photosynthetic synthetic rate in the mesophyll, equal to the carbon flux exported
through the phloem at steady-state (Schmitz et al., 1987)
Enzyme kinetics
fpol Polymerization rate of sucrose into RFO [mol/m2/s] –
fpol
MM
Michaelis-Menten maximal rate [mol/m2/s] 900 nmol m22 s21
KM Michaelis-Menten constant 50 mmol
Plasmodesmatal transport parameters
Dsuc Cytosolic sucrose diffusion coefficient [m2/s] (Henrion, 1964) 2.3 10210 m2 s21
DRFO Cytosolic RFO diffusion coefficient [m2/s] (Craig and Pulley, 1962) 1.9 10210 m2 s21
suc=RFO
kD Sucrose/RFO plasmodesmatal mass transfer coefficient [m/s]
ssuc=RFO Sucrose/RFO reflection coefficient [2] 0–1
Hsuc=RFO Sucrose/RFO diffusive hindrance [2] 0–1
Wsuc=RFO Sucrose/RFO convective hindrance (W51 2 s) [2] 0–1
r Plasmodesmatal density [m22] (Gamalei, 1991; Schmitz et al., 1987) 50 mm22
N Number of pores per plamodesmata (Terry and Robards, 1987) 9
rpore pore radius [m] (Schmitz et al., 1987) 0.7–1.5 nm
lpore pore length [m] (Liesche and Schulz, 2013) 140 nm
rsuc sucrose radius [m] (Liesche and Schulz, 2013) 0.42 nm
rRFO Stachyose/RFO radius [m] (Liesche and Schulz, 2013) 0.6 nm
g suc 5 rpore =rsuc Sucrose confinement parameter 1–10 in Fig. 2
1.3–2 in Fig. 3
g RFO 5 rpore =rRFO RFO confinement parameter 1–10 in Fig. 2
1–1.4 in Fig. 3
he Effective phloem sap viscosity including the effects for sieve plates (Jensen et al., 2012) 5 cPs
hc Typical cytoplasmic viscosity 2 cPs
Global physiological parameters
vM Volume fraction of mesophyll is the leaf (Adams et al., 2013) 97%
vP Volume fraction of phloem in the leaf (Adams et al., 2013) 3%
a Sieve tube radius [m] 5–20 mm
lload Length of the loading zone (leaf length) [m] 1–50 cm
h Length of the transport zone (plant height) [m] 0.1–10 m
910 Plant Physiol. Vol. 175, 2017
Downloaded on February 13, 2021. - Published by https://plantphysiol.org
Copyright (c) 2020 American Society of Plant Biologists. All rights reserved.Biophysics of Phloem Loading through Plasmodesmata
Gradient Inversion without Chemically Selective inversion (higher sugar concentration in the phloem)
Plasmodesmata requires strongly hindered transport through the
plasmodesmata (small gRFO as at point 1). To assess the
The solid red line in Figure 3A (“1:1”) represents the
consequences of hindrance on sugar flux, in Figure 3B
boundary between the states that show gradient in-
we plot the total carbon export rate, fcarbon , over the
version and those that do not: Below this curve, for
same domain as in Figure 3A.
lower g RFO and g suc (more restricted motion of sugars
within the plasmodesmata) and lower flushing number
fcarbon ¼ 12$QP csuc
P þ ncP
RFO
ð6Þ
(i.e. weak global convection and low transport phloem
permeability), the total concentration of sugars in the
phloem is higher than in the mesophyll. The other Note that this flux equals the flux of Suc through the
curves represent states with excess concentrations of plasmodesmatal interface times the carbon content of one
sugar in the phloem relative to the mesophyll. Impor- Suc. molecule. The green curve in Figure 3B is the isoline
for an export rate, fcarbon 5 10.8 mmol m22 s21 corre-
syn
tantly, for parameters within the physiological range
(Fig. 3A, unshaded area), we predict that inversion can sponding to a typical flux through minor veins (Schmitz
occur, with magnitudes of excess concentration in the et al., 1987; Haritatos et al., 1996). Importantly, the model
phloem (Fig. 3A, 50%–100%, point 1 on the diagram) is consistent with experiments in that strong gradient in-
that match those observed in active symplastic loaders version occurs in a regime that provides physiologically
(Rennie and Turgeon, 2009). This gradient inversion reasonable export rates (as at point 1, Fig. 3B). However,
depends on two conditions: (1) strong geometric con- maintaining gradient inversion significantly constrains ex-
finement within the plasmodesmata (g RFO , 1.3; i.e. port rates compared to those given by larger plasmodes-
small plasmodesmatal radius), for which advection of matal pores (point 3, Fig. 3B). This supports the concept
RFO in the plasmodesmata from mesophyll to phloem that the elevated density of plasmodesmata observed in
tends to overcome its back diffusion, corresponding to active symplastic loaders relative to passive ones evolved
the limit of g→1 on the solid green curve in Figure 2B; to accommodate the limitation on flux imposed by the
and (2) weak advection through the phloem (low f, i.e. narrow pores required for gradient inversion (Haritatos
low transport phloem permeability). If either of these and Turgeon, 1995; Slewinski et al., 2013). Moreover, the
conditions is violated, gradient inversion fails to occur. fact that the export rate isoline (green line, Fig. 3B) crosses
With strong hindrance and strong global advection (Fig. domains corresponding to various levels of segregation
3A, point 2), segregation of RFO occurs (green bars in Fig. and to the absence of segregation (left and right of the
3C, point 2), but sugars are flushed out of the phloem, 1:1 isoline, Fig. 3A) suggests that segregation of RFOs
prohibiting gradient inversion. With weak hindrance and gradient inversion do not provide a direct advantage
and weak advection (Fig. 3A, point 3), segregation of with respect to export rates, compared to the situation
RFO does not occur and the gradient between the me- where RFOs leak back to the mesophyll cells.
sophyll and the phloem tends to zero (Fig. 3C, point 3).
In Figure 3D, we plot the ratio of the total concen-
Polymerization Lowers the Required Concentration of
trations of sugar (ctot ¼ csuc þ cRFO ) in the phloem and
Sugars in the Leaf
mesophyll for a fixed mesophyll Suc concentration. We
P =cM . 1 with gradient inversion
associate values of ctot tot
We now explore the impact of polymerization on
(above the dashed line in Figure 3D). We see that, for total sugar concentration in the leaf for a fixed rate of
syn
weak global advection (low f, i.e. low transport phloem synthesis in the mesophyll, fcarbon , or total carbon
permeability) and hindered transport through plas- export through the phloem (these rates are equal in
modesmata (gRFO →1, i.e. small plasmodesmatal radius; moles of carbon at steady state). In Figure 3E, we track
point 1, blue curve in Fig. 3D), the strength of gradient the average concentration of sugars in the leaf,
inversion grows monotonically with polymerization cleaf ¼ vM ctot
M þ vP cP , as a function of the rate of po-
tot
rate, confirming that an increase in diffusive flux cre- lymerization, fpol , for the three cases highlighted in
MM
ated by the Suc depletion in the phloem increases
phloem osmolarity, despite the loss of particles through Figure 3, A to C. In the definition of cleaf , vM and vP are
polymerization. For flushing numbers greater than one the volume fractions of mesophyll and phloem in a
(Fig. 3D, point 2, red curve) or weak segregation (Fig. typical leaf. The values of cleaf in the absence of po-
3D, point 3, yellow curve) gradient inversion is never pol ¼ 0) correspond to passive loading.
lymerization (fMM
obtained, even for large polymerization rates. Importantly, Figure 3E shows that the average con-
centration of leaf sugars required to drive export al-
ways decreases with increasing polymerization rate in
Export Rates Are Compatible with Those Observed
Experimentally
the MV-phloem. To maintain a given carbon flux, the
difference in Suc concentration must be maintained at a
We now track the flux of carbon out of leaves expressed, fixed value to drive diffusion; increasing the rate of
no matter its chemical form, as total moles of car- polymerization lowers the phloem Suc concentration
bon ðfcarbon ); Based on the predictions in Figure 3A, and allows the concentration in the mesophyll to
the experimentally observed degree of gradient drop while maintaining a fixed gradient. Due to the
Plant Physiol. Vol. 175, 2017 911
Downloaded on February 13, 2021. - Published by https://plantphysiol.org
Copyright (c) 2020 American Society of Plant Biologists. All rights reserved.Comtet et al.
stoichiometry of polymerization and the small volume that enable segregation and gradient inversion in active
fraction occupied by the phloem (vP 1), the RFOs symplastic loaders.
produced contribute negligibly to total leaf sugar con-
tent, even in the absence of segregation (point 3, blue
curve in Fig. 3E). This prediction supports the hypoth- DISCUSSION
esis that polymerization provides a selective advantage
by reducing phloem Suc, thus allowing the total sugar The physical and chemical mechanisms that lead to
concentration in the mesophyll to be maintained at a segregation of RFOs in the phloem of “polymer trap”
low level, which in turn increases growth potential and species are still matters of debate, as are the adaptive
may minimize herbivory (Rennie and Turgeon 2009; advantages of this segregation. To shed light on these
Turgeon 2010a). topics and on symplastic loading more generally, we
have introduced a model that couples local and global
transport processes with the polymerization kinetics of
Increased Polymerization and Phloem Advection Increase
Export Rate
Suc into RFOs.
Our predictions indicate that, regardless of global
We now ask how polymerization and advection in hydraulic conditions, localized polymerization of Suc
the phloem impact export rate with a fixed concen- into RFOs in the MV-phloem decreases the total con-
tration of Suc in the mesophyll. For a fixed mesophyll centration of sugars required in the leaf to export Suc at
Suc concentration, the exported carbon flux (Eq. 6) a fixed rate (Fig. 3E) and increases the rate of export for
always increases with polymerization rate in the a fixed concentration of Suc in the mesophyll (Fig. 3F);
MV-phloem (Fig. 3F). This effect is due to the increased both of these trends could be beneficial to the plant and
gradient in Suc concentration created by Suc depletion provide a basis for a selective pressure toward this
in the phloem by polymerization. Figure 3F also shows metabolically active reaction (Turgeon, 2010a). With the
that export rate increases with decreasing transport introduction of a simple but complete model of hin-
phloem resistance, leading to increasing convection dered advection and diffusion within the plasmodes-
(higher f, comparing point 1, blue curve, and point 2, mata, we find that the conditions required to provide
red curve). We note that the favorable dependence of segregation and gradient inversion lead to physiologi-
translocation rate on polymerization holds only if RFO cally reasonable rates of export, if account is taken for
synthesis is spatially confined to the phloem, because the unusually high density of plasmodesmata at the
the reaction must selectively decrease the concentra- interface between bundle sheath and intermediary cells
tion of Suc in the phloem to increase the gradient be- (mesophyll/phloem interface) in active symplastic
tween the two cellular domains. Also note that the
loaders (trapper species). While even higher export
localization of the polymerization reactions within
rates could be achieved in conditions that do not pro-
the MV-phloem should not be confused with the
vide gradient inversion (larger pore radii and higher
spatial localization of the RFO products, which we refer
to as “segregation.” Confinement of the polymeriza- flushing number), these conditions do not lead to as
tion reaction enzymes to the companion (intermedi- large a reduction of sugar concentration in the meso-
ary) cells of the phloem has been reported for active phyll as the strongly segregated case (Fig. 3E).
symplastic loaders (Holthaus and Schmitz 1991; Taken together, our observations are consistent with
Beebe and Turgeon 1992). the hypothesis that the specialized plasmodesmata
found in active symplastic loaders—with high density
per unit area and nanometer-scale effective pore radii—
Polymerization and Segregation Minimize Leaf evolved to provide an adequate export rate (e.g. a value
Sugar Content limited by photosynthetic rates) under the additional
constraint of minimizing the total sugar content of
We now explore the possible advantages derived leaves (Fig. 1C; Rennie and Turgeon, 2009). It has been
from the polymer trap phenomenon (Fig. 3, D–F). Note argued that reducing total carbohydrate concentration
that an increased rate of polymerization lowers the total in leaves could increase growth potential and limit
sugar concentration in the leaf (cleaf; Fig. 3E) and in- herbivory (Turgeon, 2010a). We also note that mini-
creases the total carbon export out of the leaf (fcarbon ; mizing total sugar concentration in the mesophyll
Fig. 3F) regardless of the degree of gradient inversion could minimize possible inhibition of photosynthesis
(Fig. 3D). The notable distinction of the strongly hin- (Adams et al., 2013). A clear prediction of the model is
dered case (point 1, blue curves in Fig. 3, D–F) is that it that, if selectivity is the result of hindered plasmo-
displays both strong gradient inversion and a rapid desmatal transport, reducing convective flow through
decay of cleaf with fMM
pol ; in leaves operating under these plasmodesmata between the bundle sheath and inter-
conditions, a small expenditure of metabolic activity mediary cells (mesophyll/phloem interface) will im-
dedicated to polymerization will dramatically decrease pede segregation, leading to accumulation of RFOs in
its load of sugar. This trend suggests that maintaining the mesophyll. Along with dye-coupling approaches
low sugar content in leaves provides a selective ad- (Liesche and Schulz, 2012), experiments decreasing the
vantage for the evolution of specialized plasmodesmata flushing number (by applying cold or girdling the
912 Plant Physiol. Vol. 175, 2017
Downloaded on February 13, 2021. - Published by https://plantphysiol.org
Copyright (c) 2020 American Society of Plant Biologists. All rights reserved.Biophysics of Phloem Loading through Plasmodesmata
transport phloem), could give additional insight into the driving force for advective water flow, QMP
potential RFO segregation mechanisms. (Katchalsky and Curran, 1965). We note that this
Interestingly, most, if not all, symplastic loaders po- pressure difference is distinct from either the differ-
lymerize some Suc into RFOs whether or not they dis- ences in water potential or in hydrostatic pressure.
play the gradient inversion associated with polymer Indeed, because the small dimensions of the plasmo-
trapping (Slewinski et al., 2013). Our model provides a desmatal channels lead to a larger reflection coefficient
possible rational for this observation: With or without for RFOs than for Suc, the uphill gradient of RFOs
segregation and gradient inversion, localized reduction ultimately provides the dominant force that induces
of Suc in the phloem by polymerization increases ex- advective water flow from mesophyll to phloem.
port rates relative to the completely passive case (as for Our model of transport through plasmodesmata
points 2 and 3 in Fig. 3F). While trapping species appear shows that both segregation of RFOs in the phloem and
to use segregation to prioritize low concentrations gradient inversion can occur without strict steric ex-
in the mesophyll, other symplastic loaders may be clusion or chemical selectivity (Fig. 3A). We conclude
exploiting this effect to a lesser degree, prioritizing ex- that convective sweeping of RFOs downstream in the
port rate over the minimization of concentration. In plasmodesmata (from mesophyll to phloem) plays a
other words, we suggest that polymerization may critical role in driving these effects, in contrast to the
represent an active loading process in a much larger conclusions of a recent study (Dölger et al., 2014). We
fraction of symplastic loaders than has been previously do not exclude the possibility that molecular mecha-
appreciated. It would be interesting to confirm the nisms (e.g. due to molecularly specific steric or chemical
predicted relation between polymerization and trans- effects in the pores) could impact the selectivity for
location experimentally by genetically enhancing or transfer of Suc relative to RFOs. We also allow that, as
inhibiting polymerization rates in both symplastic noted by Liesche and Schulz (2013), stachyose diffusing
loaders that show gradient inversion and those that do into the mesophyll could be hydrolyzed back into Suc
not (Cao et al., 2013; McCaskill and Turgeon, 2007). and monosaccharides by the a-galactosidase present in
Such techniques could potentially play a role in im- mature leaves, preventing stachyose accumulation in
proving phloem export rates and yields in symplastic the mesophyll. To clarify this mechanism further will
loaders. require additional information on sugar gradients, hy-
Finally, we note that apoplastic loading could theo- draulic coupling between mesophyll and phloem
retically occur in parallel with active and passive (Voitsekhovskaja et al., 2006), and the structure and
symplastic loading mechanisms, either in the same or in biochemistry of the pore spaces within plasmodesmata;
different cells. However, available evidence does not
additionally, more detailed models of molecular trans-
support the presence of complementary apoplastic and
port under strong confinement should be employed
symplastic mechanisms in intermediary cells: The Suc
(Bosi et al., 2012). Our model provides a framework in
transporter does not immunolocalize to the intermedi-
which to evaluate the impact of these details on the
ary cell plasma membrane (Voitsekhovskaja et al.,
global characteristics of the loading process.
2009). It is possible, even likely, that apoplastic loading
In conclusion, our study highlights the impact of
occurs in other companion cells in RFO plants (those
system-scale coupling on the dynamics of symplastic
that do not express the RFO pathway), but if so this
loading and sheds light on the possible selective ad-
contribution is apparently minimal since blocking the
Suc transporter chemically (Turgeon and Gowan, 1990) vantages derived from the polymerization and segre-
or by RNAi (Zhang and Turgeon, 2009) does not no- gation that are observed in polymer trap species. We
ticeably inhibit growth. Nonetheless, the effect of ad- propose that evolutionary drivers other than increased
ditional Suc flux at the mesophyll/phloem interface export rate should be sought to explain sugar segrega-
due to apoplastic loading could be implemented in the tion in active symplastic loaders and that up-regulation
model. These issues will be addressed in future studies. of the enzymatic pathways that synthesize RFO could
Our study allowed us to characterize the flow pat- lead to improved export rates in passive symplastic
terns arising from coupled water and solute transport in loaders. In conjunction with future experiments, refine-
leaf phloem, when water is allowed to flow through ments of this model could provide a basis for directing
the design of engineered plants with more efficient
plasmodesmata. Importantly, in the presence of gradi-
translocation of sugars, faster growth, and higher yields.
ent inversion, we found that water always flows
advectively from mesophyll to phloem, even when
there exists an adverse gradient in both hydrostatic
MATERIALS AND METHODS
pressure and water potential (Supplemental Information
S3; gradient inversion leads to larger pressure and Boundary Condition for Mesophyll Suc
water potential in the phloem than in the mesophyll). Photosynthesized carbohydrates can selectively be stored as starch or Suc.
This effect arises due to the properties of the plasmo- This partitioning led us to consider, in Figure 3, two extreme boundary con-
desmatal interface—partially reflective to both Suc ditions for the export and concentration of mesophyll Suc. When photosyn-
thesis is not limiting, we consider Suc concentration to be fixed at 200 mM in the
and RFOs—for which an effective pressure difference, mesophyll (Fig. 3, A–D and F). For limiting photosynthesis, all sugars are
DPeff ¼ DPMP 2 RT½ssuc Dcsuc MP þ s
RFO
DcRFO
MP , provides exported and a fixed carbon flux fcarbon ¼ 10.8 mmol m22 s21 has to be
syn
Plant Physiol. Vol. 175, 2017 913
Downloaded on February 13, 2021. - Published by https://plantphysiol.org
Copyright (c) 2020 American Society of Plant Biologists. All rights reserved.Comtet et al.
accommodated through the phloem (Schmitz et al., 1987; Haritatos et al., 1996; Supplemental Figure S4. Details of hydrostatic pressures, water potentials,
Fig. 3E; see Supplemental Information S1 and Supplemental Eq. S11 for more and effective pressure differences for the three scenarios of Figure 3.
details).
Supplemental Figure S5. Ratio of RFO and sucrose Peclet numbers as a
function of the confinement parameter and plasmodesmatal pore radius.
Coupling to the Xylem Supplemental Information S1. Mathematical treatment.
Windt et al. (2006) showed experimentally that the impact of phloem flow on Supplemental Information S2. Relationship between local plasmodesma-
xylem water status is weak. We thus take fixed water pressure in the xylem, tal transport and flushing number.
PX ¼ 2 0:1 MPa, to represent leaves at moderate stress. Change in xylem water
potential would simply shift the flushing number f. Mesophyll cells and minor Supplemental Information S3. Pressure, water potential, and effective
veins are surrounded by cell walls, which, as part of the apoplast, can lead to pressure difference in mesophyll and phloem.
direct hydraulic coupling to the xylem. Due to differences in water potential, Supplemental Information S4. An alternative scenario for water transport.
water from the xylem can enter these cells via osmosis through mem-
brane aquaporins (Fig. 1, D and E, blue arrows; Patrick et al., 2001). In Figure 3, Supplemental Information S5. Parameter estimation.
we take the equivalent water permeability of these interfaces to be
LXP ¼ LXM ¼ 5$10 2 14 m s21 Pa21 (Thompson and Holbrook, 2003; the effect of
different permeabilities is presented in Supplemental Information S4). ACKNOWLEDGMENTS
We thank Kaare Jensen for fruitful discussions and one anonymous reviewer
Enzyme Kinetics for insightful comments.
We assume segregation of the enzymes in the minor veins and assume that the Received July 6, 2016; accepted July 28, 2017; published August 9, 2017.
enzyme-mediated polymerization follows Michaelis-Menten kinetics with a
maximal polymerization rate fMM pol (Fig. 3, E and F), and Km ¼ 50 mmol
22 21
(Supplemental Eq. S16). In Figure 3, A and B, we take fMM
pol = 900 nmol m s LITERATURE CITED
(the typical export rate of Suc in polymer trappers; Schmitz et al., 1987).
Adams III WW, Muller O, Cohu CM, Demmig-Adams B (2013) May
Sink Kinetics photoinhibition be a consequence, rather than a cause, of limited plant
productivity? Photosynth Res 117: 31–44
We take pressure in the phloem sap at the sinks, PS ¼ 0 MPa; this choice is Beebe DU, Turgeon R (1992) Localization of galactinol, raffinose, and
equivalent to neglecting rate limitations at the unloading step, but variations of stachyose synthesis in Cucurbita pepo leaves. Planta 188: 354–361
the unloading rate can be accounted for by varying the conductance of the Bosi L, Ghosh PK, Marchesoni F (2012) Analytical estimates of free brownian
transport phloem, LP . diffusion times in corrugated narrow channels. J Chem Phys 137: 174110
Cao T, Lahiri I, Singh V, Louis J, Shah J, Ayre BG (2013) Metabolic en-
gineering of raffinose-family oligosaccharides in the phloem reveals al-
Plasmodesmatal Interface and Sugar Filtering terations in carbon partitioning and enhances resistance to green peach
We assume a density of 50 plasmodesmata/mm2 of cell wall at the bundle aphid. Front Plant Sci 4: 263
sheath-intermediary cells interface (Schmitz et al., 1987; Gamalei, 1991). We Comtet J, Jensen KH, Turgeon R, Stroock AD, Hosoi AE (2017) Passive
take pore-length of 140 nm, equal to half of the total wall thickness (Volk et al., phloem loading and long-distance transport in a synthetic tree-on-a-
1996), corresponding to the length of the branched side of the plasmodesmata, chip. Nat Plants 3: 17032
as this section of the passage is more constricted and will thus dominate both Dechadilok P, Deen WM (2006) Hindrance factors for diffusion and con-
hydraulic resistance and transport selectivity. We treat each plasmodesma as a vection in pores. Ind Eng Chem Res 45: 6953–6959
bundle of n = 9 pores (Fig. 2A; Terry and Robards, 1987). For solute hydrody- Deen WM (1987) Hindered transport of large molecules in liquid-filled
namic radius, we calculated values from 3D hydrated models of Suc (rsuc = pores. AIChE J 33: 1409–1425
0.42 nm) and stachyose (rstac = 0.6 nm; Liesche and Schulz, 2013). We vary Ding B, Turgeon R, Parthasarathy MV (1992) Substructure of freeze-
plasmodesmata pore size between rpore = 0.6 nm and 0.84 nm in Figure 3. substituted plasmodesmata. Protoplasma 169: 28–41
Dölger J, Rademaker H, Liesche J, Schulz A, Bohr T (2014) Diffusion and
bulk flow in phloem loading: A theoretical analysis of the polymer trap
General Modeling Hypothesis mechanism for sugar transport in plants. Phys Rev E Stat Nonlin Soft
Matter Phys 90: 042704
We assume throughout our model that all the supracellular compartments
Fisher DG (1986) Ultrastructure, plasmodesmatal frequency, and solute
are well mixed. Phloem sap viscosity can be affected by the relative sugar content
concentration in green areas of variegated Coleus blumei Benth. leaves.
and concentration (Hölttä et al., 2006; Lang, 1978; Jensen et al., 2013), but we
Planta 169: 141–152
neglect this effect by considering a hydraulic permeability LP independent of
Fu Q, Cheng L, Guo Y, Turgeon R (2011) Phloem loading strategies and
sap composition. The physiological values above and in Table I are of the right
water relations in trees and herbaceous plants. Plant Physiol 157: 1518–
order of magnitude and provide a basis for exploring trends, via changes of the
1527
nondimensional flushing number, f (changing the transport phloem hydraulic
Gamalei Y (1991) Phloem loading and its development related to plant
permeability LP), reaction rate, fMM
pol , and confinement parameter g (changing
plasmodesmatal pore size rpore ). At steady state, our model provides fourteen evolution from trees to herbs. Trees (Berl West) 5: 50–64
Giraldo JP, Landry MP, Faltermeier SM, McNicholas TP, Iverson NM,
equations (Supplemental Eqs. S1–S14) that we solve for the fourteen unknown
pressures, concentrations, and fluxes shown in blue and red in Figure 1E Boghossian AA, Reuel NF, Hilmer AJ, Sen F, Brew JA, et al (2014)
(Supplemental Information S1). Plant nanobionics approach to augment photosynthesis and biochemical
sensing. Nat Mater 13: 400–408
Haritatos E, Keller F, Turgeon R (1996) Raffinose oligosaccharide con-
Supplemental Data centrations measured in individual cell and tissue types in Cucumis melo
L. leaves: Implications for phloem loading. Planta 198: 614–622
The following supplemental materials are available.
Haritatos E, Turgeon R (1995) Symplastic phloem loading by polymer
Supplemental Figure S1. Labeled electron micrograph corresponding to trapping. In HG Pontis, GL Salerno, EJ Echeverria, eds, Sucrose Me-
the model of Figure 1D. tabolism, Biochemistry, Physiology and Molecular Biology. Amer Soc
Plant Physiol, Rockville, MD, pp 216–224.
Supplemental Figure S2. Concentration profile inside the plasmodesmatal
Henrion PN (1964) Diffusion of sucrose in some three-component aqueous
pore.
solutions. Trans Faraday Soc 60: 75–82
Supplemental Figure S3. Effect of xylem to phloem and xylem to meso- Holthaus U, Schmitz K (1991) Distribution and immunolocalization of
phyll permeabilities on segregation levels. stachyose synthase in Cucumis melo L. Planta 185: 479–486
914 Plant Physiol. Vol. 175, 2017
Downloaded on February 13, 2021. - Published by https://plantphysiol.org
Copyright (c) 2020 American Society of Plant Biologists. All rights reserved.You can also read