Focal adhesion size uniquely predicts cell migration

Page created by Jon Fischer
 
CONTINUE READING
Focal adhesion size uniquely predicts cell migration
The FASEB Journal article fj.12-220160. Published online December 19, 2012.
The FASEB Journal • Research Communication

Focal adhesion size uniquely predicts cell migration
            Dong-Hwee Kim and Denis Wirtz1
            Johns Hopkins Physical Sciences–Oncology Center and Department of Chemical and Biomolecular
            Engineering, Johns Hopkins University, Baltimore, Maryland, USA

ABSTRACT        Focal adhesions are large protein com-          ing between cell and environment (4, 7). Focal adhe-
plexes organized at the basal surface of cells, which           sions have long been speculated to play a critical role in
physically connect the extracellular matrix to the cyto-        many cell functions, in particular, cell migration (8).
skeleton and have long been speculated to mediate cell          The presumption that focal adhesions play a role in cell
migration. However, whether clustering of these molec-          migration stems in part from the fact that rapidly
ular components into focal adhesions is actually re-            moving cells, such as Dictyostelium discoideum and neu-
quired for these proteins to regulate cell motility is          trophils, display vanishingly small focal adhesions (14),
unclear. Here we use quantitative microscopy to char-           while slowly moving cells such as fibroblasts show
acterize descriptors of focal adhesion and cell motility        prominent focal adhesions. On the other hand, theo-
for mouse embryonic fibroblasts and human fibrosar-             retical modeling and manipulation of ligand density on
coma cells, across a wide range of matrix compliance            the substrate have also shown that the cell migration
and following genetic manipulations of focal adhesion
                                                                speed changes biphasically depending on the adhesion
proteins (vinculin, talin, zyxin, FAK, and paxilin). This
                                                                strength between cell and substratum (15, 16).
analysis reveals a tight, biphasic gaussian relationship
                                                                   The apparent role of individual focal adhesion pro-
between mean size of focal adhesions (not their num-
ber, surface density, or shape) and cell speed. The             teins in cell migration has been extensively studied
predictive power of this relationship is comprehen-             through genetic manipulations and pharmacological
sively validated by disrupting nonfocal adhesion pro-           interventions affecting the expresssion or activity of
teins (␣-actinin, F-actin, and myosin II) and subcellular       focal adhesion proteins (1–5, 7, 8, 13). However,
organelles (mitochondria, nuclear DNA, etc.) not                whether a subset or all focal adhesion-specific proteins
known to affect either focal adhesions or cell migra-           need to cluster into focal adhesion complexes in order
tion. This study suggests that the mean size of focal           to mediate cell migration is unknown, i.e., whether any
adhesions robustly and precisely predicts cell speed            change in the clustering of focal adhesion proteins
independently of focal adhesion surface density and             induced by a change in expression/activation of a
molecular composition.—Kim, D.-H., Wirtz, D. Focal              known or yet unidentified regulator of focal adhesions
adhesion size uniquely predicts cell migration. FASEB J.        or biophysical/biochemical changes in the microenvi-
27, 000 – 000 (2013). www.fasebj.org                            ronment necessarily can predict a change in cell migra-
                                                                tion is unknown. This is partly due to the fact that a
Key Words: motility 䡠 mechanosensing 䡠 high-throughput pheno-   functional relationship between focal adhesions (size,
typing 䡠 systems biology                                        shape, number, turnover dynamics, etc.) and cell motil-
                                                                ity, if it exists, is largely missing.
Cell migration is a highly integrated process result-              That any change in cell speed could be predicted by
ing from multiple, complex interactions among a myr-            a change in focal adhesions is a priori unlikely. We first
iad of proteins and intracellular organelles (nucleus,          determined functional relationships among descriptors
microtubule organizing center, endoplasmic reticu-              of focal adhesion morphology and descriptors of cell
lum, etc.) in response to the rapidly changing extracel-        motility, and then assessed the predictive power of
lular environment (1–12) Focal adhesions are orga-              relationships between these two families of descriptors
nized aggregates of specialized proteins (including             through comprehensive blind tests affecting known
cytoskeletal, signaling, regulatory, mechanosensing,            and previously unknown regulators of cell speed and
structural, and scaffolding proteins) distributed at the        focal adhesions.
basal surface of adherent cells (4, 7, 13). These proteins
are involved in physical connections between the extra-
cellular matrix and the actin cytoskeleton through
transmembrane receptor integrins and mediate signal-              1
                                                                    Correspondence: Johns Hopkins University, 3400 N.
                                                                Charles St., NEB Hall Suite 100, Baltimore, MD 21218, USA.
                                                                E-mail: wirtz@jhu.edu
  Abbreviations: FAK, focal adhesion kinase; MEF, mouse           doi: 10.1096/fj.12-220160
embryonic fibroblast; MSD, mean squared displacement;             This article includes supplemental data. Please visit http://
shRNA, small hairpin RNA; WT, wild-type                         www.fasebj.org to obtain this information.

0892-6638/13/0027-0001 © FASEB                                                                                               1
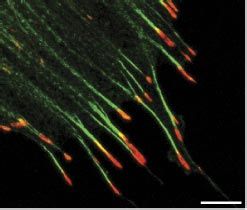
Focal adhesion size uniquely predicts cell migration
A                                                                                                                                                                            B                                                                                                                                   C
                                                                                                                                                                                                                                                                                                                                     4                          NS
                                                                                                                                                                                                                                                                               Length
                                                                                                                                                                                           Perimeter
                                                                                                                                                                                                                                                                                                                                     3

                                                                                                                                                                                                                                                                                                                        Area (µm2)
                                                                                                                                                                                           Area                                                                                                                                      2
                                                                                                                                                                                                                                                                   Breadth
                                                                                                                                                                                                                                                              4π(Area)                                                               1
                                                                                                                                                                                                   Shape factor =
                                                                                                                                                                                                                                                            (Perimeter)

                                                                                                                                                               10 µm                                             S.F.=1                                                       S.F.=0                                                 0
                                                                                                                                                                                                                                                                                                                                         Vinculin FAK Paxillin Zyxin

     D                                                                                             E                                                                                            F                                                                                                                 G
                             15                     NS                                                             6                                             NS                                              2.0                                                NS                                                           0.5                            NS
                                                                                                                                                                                                                                                                                                                                 0.4
     Perimeter (µm)

                                                                                                                                                                                                                 1.5

                                                                                                                                                                                                  Breadth (µm)

                                                                                                                                                                                                                                                                                                                  Shape factor
                                                                                                     Length (µm)
                             10                                                                                    4
                                                                                                                                                                                                                                                                                                                                 0.3
                                                                                                                                                                                                                 1.0
                                                                                                                                                                                                                                                                                                                                 0.2
                              5                                                                                    2
                                                                                                                                                                                                                 0.5
                                                                                                                                                                                                                                                                                                                                 0.1

                              0                                                                                    0                                                                                             0.0                                                                                                             0.0
                                   Vinculin FAK Paxillin Zyxin                                                         Vinculin FAK Paxillin Zyxin                                                                             Vinculin FAK Paxillin Zyxin                                                                               Vinculin FAK Paxillin Zyxin

     H                                                                                                                               I                                                                                                                                           J
                             0.6                                                      3                                                                    0.4                                                                                  12                                                    0.5                                                                   5

                                             r2=0.97                                                    ***                                                                       r2=0.96                              FA Perimeter (um)                                                                                                 2                                  4
                                                                                                                                                                                                                                                                                                                                         r =0.97

                                                                                                                                                                                                                                                                                                                                                           FA Length (um)
     Relative frequency

                                                                                                                                     Relative frequency

                                                                                                                                                                                                                                                             ***

                                                                                                                                                                                                                                                                                 Relative frequency
                                                                                                                                                                                                                                                 9
                                                                      FA Area (um2)

                                                                                                                                                                                                                                                                                                      0.4                                                                               ***
                                               r2=0.92                                2
                                                                                                                                                           0.3
                                                                                                                                                                                     r2=0.93                                                                                                                                                 2                              3
                                                                                                                                                                                                                                                                                                                                                                                              ***
                             0.4                                                                                       ***                                                                                                                       6
                                                                                                                                                                                                                                                                    ***                                                                      r =0.93
                                                   r2=0.92                                                                                                                             r2=0.92                                                                                                        0.3
                                                                                                                                                                                                                                                                                                                                               r2=0.92
                                                                                                                                                                                                                                                                                                                                                                            2
                                                                                      1
                                                                                                                                                           0.2                                                                                   3
                                                                                                                                                                                                                                                                                                                                                                            1
                                                                                                                                                                                                                                                                                                      0.2
                             0.2                                                      0                                                                                                                                                          0                                                                                                                          0
                                                                                          Glass Stiff              Soft                                    0.1                                                                                       Glass Stiff    Soft                                                                                                        Glass Stiff   Soft
                                                                                                gel                gel                                                                                                                                     gel      gel                               0.1                                                                             gel     gel

                             0.0                                                                                                                           0.0                                                                                                                                        0.0
                                   0           2            4                               6                                8                                   0           5             10                      15                                   20              25                                  0                2                4        6                            8           10
                                                                      2                                                                                                                Perimeter (µm)
                                                        Area (µm )                                                                                                                                                                                                                                                                           Length (µm)

     K                                                                                                                               L
                             0.4                                                   1.5                                                                     0.8                                                                                  0.8
                                                                                                        ***
                                                                                                                                                                                                                                                                        ***
                                                   r2=0.94
                                                                 FA Breadth (um)

                                                                                                                                                                                                                              FA Shape factor

                                                                                                                                                                                   2
     Relative frequency

                                                                                                                                      Relative frequency

                                                                                                                                                                                  r =0.96
                                                                                                                                                                                                                                                0.6
                                                                                   1.0                                 ***                                                                                                                                    ***
                             0.3                                                                                                                           0.6
                                                     r2=0.93                                                                                                                           r2=0.91                                                  0.4
                                                      r2=0.92
                             0.2
                                                                                   0.5
                                                                                                                                                           0.4                            r2=0.84                                               0.2
                                                                                                                                                                                                                                                                                                                Glass
                                                                                   0.0                                                                                                                                                          0.0
                             0.1                                                          Glass Stiff
                                                                                                gel
                                                                                                                   Soft
                                                                                                                   gel
                                                                                                                                                           0.2                                                                                        Glass Stiff
                                                                                                                                                                                                                                                            gel
                                                                                                                                                                                                                                                                        Soft
                                                                                                                                                                                                                                                                        gel                                     Stiff gel

                             0.0                                                                                                                           0.0
                                                                                                                                                                                                                                                                                                                Soft gel
                               0.0      0.5        1.0     1.5                     2.0           2.5                    3.0                                  0.00                  0.50                                           1.00                               1.50
                                                    Breadth (µm)                                                                                                                        Shape factor

     M                                                                                          N                                                                                               O
                             15               Strong                                                           1.0                               Moderate                                                        2.0                                         Weak
                                                                                                                                                                                                                                                                                                                            Glass
                                                                                                               0.8
                                                                                                                                                                                                                                                                                                                            Stiff gel
            Perimeter (µm)

                                                                                                                                                                                                                 1.5
                                                                                                Shape factor

                                                                                                                                                                                                Breadth (µm)

                             10
                                                                                                               0.6                                                                                                                                                                                                          Soft gel
                                                                                                                                                                                                                 1.0
                                                                                                               0.4
                              5                                                                                                                                                                                                                                                                                           0.80               ≤ ІrІ ≤     1   Strong
                                                                                                                                                                                                                 0.5
                                                                                                               0.2                                                                                                                                                                                                        0.65               ≤ ІrІ <   0.80 Moderate
                                                           r = 0.94                                                                                                       r = -0.70                                                                                            r = 0.42                                     0                ≤ ІrІ <   0.65  Weak
                              0                                                                                0.0                                                                                               0.0
                                   0     2          4       6                         8                                0         1                         2          3       4        5                               0                                2           4           6                           8
                                              Length (µm)                                                                                      Area (µm2)                                                                                                Length (µm)

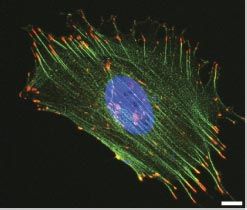
Figure 1. Relationships among descriptors of focal adhesion morphology. A) Organization of actin filaments and focal adhesions
in an MEF lying on a collagen-coated glass substrate. F-actin (green), nucleus (blue), and vinculin-marked focal adhesions (red)
are imaged with a confocal microscope ⫻60. Details of actin filaments and associated focal adhesions in the region of interest
are shown. Focal adhesions are elongated in the same direction of corresponding actin stress fibers. Scale bars ⫽ 10 ␮m.
                                                                                                         (continued on next page)

2   Vol. 27                            April 2013                                                                                                          The FASEB Journal 䡠 www.fasebj.org                                                                                                                                                                               KIM AND WIRTZ
MATERIALS AND METHODS                                               ral-mediated RNAi, cells showing ⬎ 90% knockdown effi-
                                                                    ciency were selected. They include the following (number
Cell culture and drug treatments                                    after the sequence denotes the targeting position in mRNA):
                                                                    mh-Talin1,2, GTGGATGAGAAGACCAAGGA (1372); mh-Paxillin,
Mouse embryonic fibroblasts (MEFs) and HT-1080 cells were           gTCAAGGAGCAGAACGACAA (1770); mh-FAK, GGGCAT-
cultured in DMEM [American Type Culture Collection                  CATTCAGAAGATA (507); m-ACTN1,4, GGAGGACTTCCGA-
(ATCC), Manassas, VA, USA] supplemented with 10% FBS                GACTATA (1164); and m-Zyxin, GCCTGTGTCTTCTGCTAATA
(ATCC). Penicillin (100 U/ml) and 100 ␮g/ml streptomy-              (1004). A firefly luciferase shRNA was used as a control
cin (Sigma, St. Louis, MO, USA) for MEFs and 0.1% gentimi-          (5=-GCTTACGCTGAGTACTTCGA). Using the predicted
cin (Sigma) for HT-1080 were added, respectively. Cells             sequences above, the shRNA expression cassettes were
infected with small hairpin RNA (shRNA) constructs were             constructed by joint PCR, as described. shRNA-induced
initially selected with medium containing 4 ␮g/ml puromycin         protein depletion was fully validated by Western blots
(Sigma) for 3 d and then maintained in medium with 3                before use (17, 18).
␮g/ml puromycin added. Cells were maintained at 37°C with
5% CO2 in a humidified incubator and passaged every 3– 4 d.         Immunofluorescence and morphometric analysis
F-actin depolymerizing drug latrunculin B (Sigma), mito-
chondrial complex I inhibitor rotenone (Sigma), and cell            Cells were incubated for 6 h after plating, fixed with 2%
cycle inhibitor bleomycin (Sigma) were diluted to final con-        paraformaldehyde (Sigma) for 10 min, permeabilized with
centrations of 0.1 ␮M (or 1 ␮M for high-dose treatment), 1          0.1% Triton X-100 (Fisher Biotech, Hampton, NH, USA) for
␮M, and 1 mM, respectively. Cells were incubated with each          10 min, and then blocked with PBS supplemented with FBS
drug in culture medium for 1 h before fixation.                     (10%, v/v) for 20 min. For immunostaining of focal adhe-
                                                                    sions, anti-vinculin antibody (Sigma) at 1:200, anti-focal ad-
Substrate preparation                                               hesion kinase (FAK) antibody (Santa Cruz Biotechnology,
                                                                    Santa Cruz, CA, USA) at 1:50, anti-paxillin antibody (G. D.
Following the established method (1, 17), soft substrates           Longmore, Washington University in St. Louis, St. Louis, MO,
denoted by stiff gel or soft gel were prepared by synthesizing      USA) at 1:100, and anti-zyxin antibody (Sigma) at 1:100 were
polyacrylamide gel onto the 3-aminopropyl-trimethoxysilane          used. Actin filaments and nuclear DNA were stained using
and 10% glutaraldehyde-treated glass slides. Acrylamide and         Alexa-Fluor phalloidin 488 and 300 nM 4=,6-diamidino-2-
N,N-methylenebisacrylamide were mixed at a final concentra-         phenylindole (both from Invitrogen), respectively. For
tion of 5 and 0.15% (for stiff gel or 0.015% for soft gel) in       quantitative analysis of focal adhesions, fluorescent images
distilled H2O (w/v), respectively. Ammonium persulfate              were collected using a Cascade 1K CCD camera (Roper
(10%) and N,N,N=,N=-tetramethylethylenediamine (Invitro-            Scientific, Tucson, AZ, USA) mounted on a fluorescence
gen, Carlsbad, CA, USA) were introduced as 5 and 0.5% (v/v)         microscope (TE2000E; Nikon, Melville, NY, USA) or a
of total mixture. The hydrogels were then treated with the          confocal laser microscope (A1; Nikon) equipped with an
UV-activable cross-linker, N-sulfosuccinimidyl-6-(4=-azido-2=-      ⫻60 Plan Fluor lens (N.A. 1.4). Morphometric analysis
nitrophenylamino) hexanoate (Pierce, Rockford, IL, USA) to          (area, perimeter, length, breadth, and shape factor) of
bind collagen to the surface where 0.2 mg/ml type I collagen        focal adhesions was conducted using image analysis soft-
(BD Biosciences, San Jose, CA, USA) diluted in 0.2 N acetic         ware, Metamorph (Molecular Devices, Downingtown, PA,
acid was coated for 6 h at 4°C. Glass slides were also prepared     USA), and images collected by confocal microscope were
by coating the same collagen. All substrates were soaked into       processed using NIS-Elements (Nikon).
medium and kept in the incubator for 30 min to adapt
substrates to the cell culture environment before plating cells.    Analysis of cell motility

Protein depletion                                                   After incubating cells for 6 h, cells were moved to the live cell
                                                                    chamber, mounted on a fluorescence microscope (TE2000E;
Following RNAi, sequences targeting mRNA were selected as           Nikon) and monitored using an ⫻10 lens for 8 h. Single cells
described previously (17, 18). After treating cells with lentivi-   were tracked using Metamorph Offline, and their x, y coor-

B) Schematic defining the morphological descriptors of focal adhesions used in this study. C–G) Area (C), perimeter (D), length
(E), breadth (F), and shape factor (G) of focal adhesions stained with anti-vinculin, anti-FAK, anti-paxillin, and anti-zyxin
antibodies. More than 20 cells were analyzed for each condition; values were averaged per cell. Error bars represent sem of
averaged values; 1-way ANOVA using Bonferroni post test was applied to compare all possible pairs of conditions. No significant
difference in morphological parameters from different focal adhesion staining was detected. H–L) Changes in area (H),
perimeter (I), length (J), breadth (K), and shape factor (L) of focal adhesions in response to changes in substrate stiffness: rigid
glass (black), a stiff gel (gray), and a soft gel (white). Distributions of these descriptors for different substrate compliances are
plotted with color-coded gaussian fits: glass (red), stiff gel (green), and soft gel (blue), respectively, and the same color-coded
coefficients of determination (r2) are shown in each plot. Higher average values show broader distributions. More than 900, 600,
and 200 focal adhesions were analyzed for glass, stiff gel, and soft gel, respectively, from ⱖ30 cells/condition. Error bars indicate
sem, and statistical differences were calculated using the unpaired t test. ***P ⬍ 0.001. M–O) Representative strong (M),
moderate (N), and weak (O) correlations among descriptors of focal adhesion morphology. Length of focal adhesions is
positively correlated with perimeter and breadth but to different extents (M, O). Size (i.e., area) of focal adhesions in cells is
anticorrelated with shape factor (N). Data points are the averaged values from each cell. Degree of correlation is assessed by the
Pearson product moment correlation coefficient (denoted by r). Straight line in each plot shows a linear regression of analyzed
data set. Red, green, and black colors represent strong (0.80ⱕ|r|ⱕ1), moderate (0.65ⱕ|r|⬍0.80), and weak (|r|⬍0.65)
correlations; ⫹ and ⫺ denote positive and negative correlations, respectively. Correlation assessment and linear regression are
applied to the merged data sets regardless of substrate stiffness. Correlation coefficients among all pairs of morphological
parameters are summarized in Supplemental Fig. S1.

FOCAL ADHESION SIZE UNIQUELY PREDICTS CELL MIGRATION                                                                               3
dinates were recorded every 2 min. Cell speed was defined as        independently of substrate stiffness, and determined
root-mean-squared displacement calculated every 2 min of            the degree of correlation through calculated r values.
time interval divided by 2 min. Custom-made MatLab code             Degrees of correlation among focal adhesion descrip-
was used to calculate mean squared displacement (MSD).
Final distance was the displacement that a cell made for 8 h.       tors were denoted as strong, moderate, and weak for r
To introduce persistence distance, persistence time, and            values: 0.80 ⱕ |r| ⱕ 1, 0.65 ⱕ |r| ⬍ 0.80, and |r| ⬍ 0.65,
number of turns, persistence vectors were calculated from cell      respectively (see summary in Supplemental Fig. S1). As
tracking data (x, y coordinates, distance, and time) using an       expected, the perimeter of focal adhesions increased
Excel macro (Microsoft, Redmond, WA, USA) as described              with the length of long axis (Fig. 1M), while the shape
previously (18).A persistent move was defined as the traveling      factor of focal adhesions decreased as their size (de-
length (ⱖ10 ␮m) of a cell before it changed a moving
                                                                    noted by area) increased (Fig. 1N). Length and breadth
direction significantly (⬎70°). Accordingly, persistent dis-
tance and persistent time were defined as the distance and          of focal adhesions were weakly correlated (Fig. 1O).
duration that a cell traveled during a persistent move. The         Confocal microscopy indicated that focal adhesions
number of turns that defines the changes of persistent moves        were elongated in the direction of their associated actin
for 8 h of tracking interval was also counted. At least 50 cells    stress fibers (Fig. 1A). These results are consistent with
were analyzed per condition.                                        the growth model of force-induced focal adhesion
                                                                    driven by actomyosin-mediated tension (24 –27) Conse-
Data processing and statistical analysis                            quently, large focal adhesions tended to be elongated,
                                                                    while small focal adhesions tended to be round over a
To calculate and plot means ⫾ sem of measured quantities,           wide range of substrate compliance.
GraphPad Prism (GraphPad Software, San Diego, CA, USA)
was used. Significances were assessed by 2-tailed unpaired
t-tests. For multiple comparisons, 1-way ANOVA was applied,         Cell speed weakly correlates with persistent motion of
using Bonferroni’s test to compare every pair of data or using      the cell
Dunnette’s test to compare all other conditions to control,
respectively. Degree of correlation of compared data sets was       To characterize randomly migrating cells, we measured
assessed by Pearson product moment correlation, and data
were regressed by gaussian fit or linear fit. See individual        cell speed as well as persistence time and distance,
figure captions to see the selected method.                         number of turns, and final distance (defined as the
                                                                    total displacement that a cell made during the obser-
                                                                    vation time; Fig. 2A, B). Cell speed was calculated from
RESULTS                                                             the root mean square displacement, which is a more
                                                                    rigorous measure of distance than a direct use of
Size and shape of focal adhesions are closely related               segment length, as it eliminates sources of noises
                                                                    stemming from erratically meandering cell motion (see
Focal adhesions localized at the basal surface of MEFs              more details on defining parameters in Materials and
and terminating actin stress fibers typically displayed an          Methods). Mean values and distributions of cell motility
ellipsoidal shape (Fig. 1A). Fibrillar adhesions, which             descriptors readily changed in cells placed on sub-
evolve from mature focal adhesions, are located toward              strates of different compliance (refs. 28, 29 and Fig.
the center of the cell and contain very little focal                2C–G). Similarly to focal adhesion descriptors (Fig.
adhesion components, such as paxillin and vinculin                  1H–L), cell motility descriptors were well distributed.
(19, 20). Therefore, we focused on vinculin-containing              (Fig. 2C–G).
focal adhesions (21). Size and shape of individual focal               As expected, when cells spent more time in each
adhesions were characterized by surface area, perime-               persistent move, they had fewer chances of switching
ter, length, breadth, and shape factor, defined as                  into a next persistent move in the limited observation
4␲(area)/(perimeter)2, approaching 1 for a rounded                  time, which resulted in fewer numbers of turns (r⫽⫺0.87;
and 0 for an elongated focal adhesion (Fig. 1B).                    Fig. 2H). Interestingly, the final distance was moder-
Notably, we observed no significant difference in mea-              ately correlated with persistence distance (r⫽0.68; Fig.
suring morphological parameters from staining with                  2I), but weakly correlated with cell speed (r⫽0.40; Fig.
various antifocal adhesion antibodies, including vincu-             2J). These results indicate that fast-moving cells do not
lin, FAK, paxillin, and zyxin (Fig. 1C–G). To ensure                guarantee that they can move farther (Fig. 2J) but
sufficient distribution in the values of the measured               rather cells that can maintain their directional move-
morphological parameters, cells were placed on sub-                 ment (thus higher persistence distance) move farther
strates of different mechanical compliance, where size              (Fig. 2I); cell speed is weakly correlated with persis-
and shape of focal adhesions readily changed (refs. 1, 4,           tence of migration (Supplemental Fig. S1A).
22, 23 and Fig. 1H–L). We found that all considered
morphological parameters approximately followed                     Functional relationship between focal adhesion
gaussian statistics (see color-coded normal distribution            morphology and cell migration
curves and corresponding r2 values in Fig. 1H–L).
   To assess relationships among descriptors of focal               Now we can begin to test whether focal adhesion
adhesion morphology, we calculated the Pearson prod-                morphology can predict cell motility. To determine
uct-moment correlation coefficients r between any 2                 global correlations between focal adhesion morphology
parameters, which were averaged per cell and merged                 and cell motility, genetic manipulations of the cells

4   Vol. 27   April 2013                         The FASEB Journal 䡠 www.fasebj.org                           KIM AND WIRTZ
A                                                                                                      B                                                                                                                                   C
                                                                                                                                                                                                                                                                        0.8                                                           2.0
                                                                                                                                                                                                                                                                                    r2=0.99
                                                                                                                                                      nce

                                                                                                                                                                                                                                                                                                         Speed (µm/min)
                                                                                                                                                 dista

                                                                                                                                                                                                                                                 Relative frequency
                                                                                                                                                                                                                                                                                                                                      1.5

                                                                                                                                           Final                                                                                                                        0.6
                                                                                                                                                                                                                                                                                         r2=0.98                                      1.0                 ***
                                                                                                                                                                                                                                                                                            r2=0.94                                                               ***
                                                                                                                                                                                                                                                                        0.4                                                           0.5

                                                                                                                                                    Persistence                                                                                                         0.2
                                                                                                                                                                                                                                                                                                                                      0.0
                                                                                                                                                                                                                                                                                                                                               Glass Stiff        Soft
                                                                                                                                                      vectors                                                             Turns                                                                                                                      gel          gel

                                                                                                                                                        +                                                                                                     0.0
                                                                                                                                     Speed =                                                                                                                                  0          1          2                                               3                   4
                                                                                                                                                            2min
                                                                                                                                                                                                                                                                                             Speed (µm/min)

                                                                                                    D                                                                                                                                            E
                                                                                                                          1.0                                                                                 150                                                       1.0                                                                   30

                                                                                                                                                                                                                                                                                                                  Persistence distance (µm)
                                                                                                                                                                                                                                                                                             r 2=0.99

                                                                                                                                                                                       Final distance (µm)
                                                                                                                                                                                                                                                                                                                                                             *

                                                                                                    Relative frequency

                                                                                                                                                                                                                                                 Relative frequency
                                                                                                                          0.8
                                                                                                                                    r 2=1.00                                                                  100                                                       0.8                                                                   20

                                                                                                                                                                                                                                ***                                                                                                                                ***
                                                                                                                          0.6         r 2=0.93                                                                 50
                                                                                                                                                                                                                                                                        0.6                   r 2=0.94                                        10

                                                                                                                          0.4                  r 2=0.72                                                                                 ***                             0.4                    r 2=0.95
                                                                                                                                                                                                                   0                                                                                                                           0
                                                                                                                                                                                                                       Glass Stiff      Soft                                                                                                       Glass Stiff    Soft
                                                                                                                          0.2                                                                                                gel        gel                             0.2                                                                              gel      gel

                                                                                                                          0.0                                                                                                                                           0.0
                                                                                                                                0                   100                                                   200                           300                                   0     10         20        30                                             40          50
                                                                                                                                               Final distance (µm)                                                                                                                 Persistence distance (µm)

                                 50 µm                                                              F                                                                                                                                            G
                                                                                                                                                    2                                                         50                                                                                                                              20
                                                                                                                          25                    r =0.98                                                                                                                 50
                                                                                                                                                                                                                                                                                r 2=0.95
                                                                                                                                                  r 2=0.96                           Persistence time (min)                            **                                                                                                                    NS
                                                                                                                                                                                                                                                                               r 2=0.92
                                                                                                                                                                                                              40

                                                                                                                                                                                                                                                                                                                    Number of turns
                                                                                                     Relative frequency

                                                                                                                                                                                                                                                   Relative frequency
                                                                                                                                                   r 2=0.94
                                                                                                                                                                                                                                                                                                                                              15
                                                                                                                          20                                                                                                NS                                          40                                                                                          **
                                                                                                                                                                                                              30                                                              r 2=0.91                                                        10
                                                                                                                          15                                                                                  20                                                        30
                                                                Glass                                                                                                                                         10
                                                                                                                                                                                                                                                                                                                                               5
                                                                                                                          10                                                                                                                                            20
                                                                Stiff gel                                                                                                                                      0
                                                                                                                                                                                                                   Glass Stiff        Soft
                                                                                                                                                                                                                                                                                                                                               0
                                                                                                                                                                                                                                                                                                                                                   Glass Stiff    Soft
                                                                                                                           5                                                                                             gel          gel                               10                                                                               gel      gel
                                                                Soft gel
                                                                                                                           0                                                                                                                                             0
                                                                                                                                0         20              40                         60                                   80                                                  0       10            20                                              30               40
                                                                                                                                           Persistence time (min)                                                                                                                            Number of turns

      H                                                             I                                                                                          J
                                80              Strong                                    250                             Moderate                                                   250                                         Weak
                                                                                                                                                                                                                                                                                    Glass
       Persistence time (min)

                                                                    Final distance (µm)

                                                                                                                                                               Final distance (µm)

                                                                                          200                                                                                        200
                                60                                                                                                                                                                                                                                                  Stiff gel
                                                                                          150                                                                                        150
                                                                                                                                                                                                                                                                                    Soft gel
                                40
                                                                                          100                                                                                        100
                                                                                                                                                                                                                                                                                   0.80        ≤ ІrІ ≤      1   Strong
                                20
                                                                                           50                                                                                          50                                                                                          0.65        ≤ ІrІ <    0.80 Moderate
                                         r = -0.87                                                                                     r = 0.68                                                                                                 r = 0.40
                                 0                                                          0                                                                                                           0                                                                            0         ≤ ІrІ <    0.65  Weak
                                     0     10        20   30   40                               0   10                      20       30        40       50                                                    0             1               2       3                         4
                                           Number of turns                                      Persistence distance (µm)                                                                                                  Speed (µm/min)

Figure 2. Relationships among descriptors of cell motility. A) Defining cell motility. A trajectory (green), persistence vectors (yellow), and
final distance (blue) in a MEF moving on a collagen-coated glass substrate. When a cell changes both its step size and direction significantly
(⬎10 ␮m and ⬎70°, respectively) a new persistence move is defined. Change of persistent move between neighboring persistence vectors
is denoted by a turn. Persistence distances are not uniform during the tracking period. B) Schematic defining cell-motility parameters used
in this study. Cell speed was defined as the root MSD calculated every 2 min divided by 2 min. C–G) Changes in speed (C), final distance
(D), persistence distance (E), persistence time (F), and number of turns (G) of migrating cells in response to substrate stiffness, from a rigid
glass (black), to a stiff gel (gray) and a soft gel (white). Relative frequency distributions of measured quantities for different substrate stiffness
are plotted with color-coded gaussian fits: glass (red), stiff gel (green), and soft gel (blue), respectively, and the same color-coded coefficients
of determination (r2) are shown in each plot. Error bars indicate sem, and statistical differences were calculated using the unpaired t test.
NS, not significant (P⬎0.05). *P ⬍ 0.05, **P ⬍ 0.01, ***P ⬍ 0.001. H–J) Representative strong (H), moderate (I), and weak (J) correlations
among descriptors of cell motility. While the number of turns and final distance that cells made correlate with persistence time and distance
in strong and moderate manners, respectively (H, I), cell migration speed weakly correlated with final distance (J). Degree of correlation
is assessed by the Pearson product moment correlation coefficient (denoted by r). Straight line in each plot shows linear regression of
analyzed data set. Red, green, and black represent strong (0.80ⱕ|r|ⱕ 1), moderate (0.65ⱕ|r|⬍0.80), and weak (|r|⬍0.65) correlations; ⫹ and
⫺ denote positive and negative correlations, respectively. Correlation assessment and linear regression are applied to the merged data sets
regardless of substrate stiffness. In panels C–J, ⱖ50 cells were monitored for 8 h per condition. Persistence vectors were calculated with a
custom Excel macro (see Materials and Methods). Correlation coefficients among all pairs of motility parameters are summarized in
Supplemental Fig. S1.

FOCAL ADHESION SIZE UNIQUELY PREDICTS CELL MIGRATION                                                                                                                                                                                                                                                                                                                        5
A                                                  WT                                                                        FAK KD                                                                                    Paxillin KD                                                                            Talin KD                                   Zyxin KD

                   Glass

                                     20µm
                   Soft gel

                                                                                                                                                                                                                                                                                                                                                  Representative cell trajectories

        B4                                                                                                           C0.8                                                                                                                                   D2.0

                                                                                                                                                                                                                                                         Cell Speed (µm/min)
                                                     *
                                                                                                                                                                      ***
                                                                                                                   FA Shape factor
     FA Area (µm2)

                                 3                                                                                                   0.6                                                                                                                                       1.5
                                                               **                                                                                                ***                                ***                                     ***                                                                            *                 *
                                           ***                   ***        ***       ***                                                                                                                                   ***                                                               *****
                                                                                                                                                                               *** **           *                         **            *                                             ***                                           ***
                                 2                                                                                                   0.4                                                                                                                                       1.0
                                                                                         ***                                                                                                                                                                                                                                                               Control
                                               ***                                                                                                                                                                                                                                                                                               ***
                                                                                                                                                                                                                                                                                        ***                                                                Glass
                                 1                                                                                                   0.2                                                                                                                                       0.5
                                                                                                                                                                                                                                                                                                                                                           Stiff gel
                                                                                                                                                                                                                                                                                                                                                           Soft gel
                                 0                                                                                                   0.0                                                                                                                                       0.0
                                           WT        FAK       Paxillin   Talin          Zyxin                                                                   WT             FAK            Paxillin                    Talin        Zyxin                                         WT       FAK                    Paxillin    Talin     Zyxin
                                                     KD         KD         KD             KD                                                                                     KD              KD                         KD           KD                                                     KD                      KD         KD        KD

    E 2.0                                                                           F 2.0                                                                                                           G                                                                                                  H
                                                                                                                                                                                                                    1.00                                                                                            1.00
       Cell Speed (µm/min)

                                                                                     Cell Speed (µm/min)

                                                                                                                                                                                                 Norm. Cell Speed

                                                                                                                                                                                                                                                                                                 Norm. Cell Speed

                                 1.5                                                                       1.5
                                                                                                                                                                                                                    0.75                                                                                            0.75

                                 1.0                                                                       1.0
                                                                                                                                                                                                                    0.50                                                                                            0.50

                                 0.5                                                                       0.5
                                                                                                                                                                                                                    0.25                                                                                            0.25
                                                                   r = 0.66                                                                                            r = -0.78                                                                              r = 0.93                                                     r = 0.61
                                 0.0                                                                       0.0
                                       0         1         2         3       4                               0.0                0.2                      0.4                   0.6         0.8                      0.00                                                                                            0.00
                                                                                                                                                                                                                       0.00        0.25         0.50                           0.75   1.00                             0.00      0.25     0.50     0.75   1.00
                                                 FA Area (µm2)                                                               FA Shape factor
                                                                                                                                                                                                                                    Norm. FA Area                                                                          Norm. FA Shape factor

                                                                                                                                                                                                                                                                               Figure 3. Functional relation-
    I                        60                                                   Control                                                  J                                                                                                       K                           ship between focal adhesion
                                                                                  Glass                                                                              2.0                                                                         1.00
                                                                                                                                                                                                                                                                               morphology and cell speed:
                                                                                  Stiff gel
                                                                                                                                           Cell Speed (µm/min)

                                                                                                                                                                                                                                                   Norm. Cell Speed

                                                                                                                                                                                                                                                 0.75                          primary data set. A) Immuno-
                                                                                  Soft gel                                                                           1.5
    FA Number

                             40
                                           *
                                                                                                                                                                                                                                                                               fluorescence images of vincu-
                                                                            ***              *                                                                       1.0                                                                         0.50                          lin-stained focal adhesions
                             20                                   ***                                      ***                                                                                                                                                                 and representative cell trajec-
                                                                                                                                                                                                                                                 0.25
                                               ***                                                                                                                   0.5
                                                                                                                                                                                                                                                                      r 2=0.38 tories reveal a wide range of
                                                                                                                                                                                                                     r = 0.62                                         r 2=0.60 focal adhesion morphology
                                 0                                                                                                                                   0.0                                                                         0.00
                                           WT        FAK       Paxillin   Talin             Zyxin                                                                          0              20                         40            60               0.00 0.25 0.50 0.75 1.00   and cell speed in primary data
    L                                                KD          KD        KD                KD
                                                                                                                                           M2.0
                                                                                                                                                                                        FA Number
                                                                                                                                                                                                                                              N1.00
                                                                                                                                                                                                                                                          Norm. FA Number      set. B–D) Effect of changes in
                                 4
                                                                                                                                                                                                                                                                               substrate compliance and de-
          FA Aread density (%)

                                                                                                                                                                                                                                                                               pletion of focal adhesion pro-
                                                                                                                                               Cell Speed (µm/min)

                                                                                                                                                                                                                                                   Norm. Cell Speed

                                 3                                                                                                                                                                                                               0.75
                                                                                                                                                                     1.5                                                                                                       teins on the size (B) and
                                           ***                            * **                                                                                                                                                                                                 shape (C) of focal adhesions
                                 2                                                                                                                                                                                                               0.50
                                                                  ***                 ******                                                                         1.0
                                                                                                                                                                                                                                                                               and cell migration speed (D).
                                               ***                                                                                                                                                                                                                             E, F) Correlations of size and
                                 1                                                                                                                                                                                                               0.25                   2
                                                                                                                                                                     0.5
                                                                                                                                                                                                                                                                      r =0.39  shape of focal adhesions with
                                                                                                                                                                                                                                                                        2
                                                                                                                                                                                                                      r = 0.63                                        r =0.45
                                 0                                                                                                                                   0.0                                                                         0.00                          cell speed. Size (i.e., area)
                                           WT        FAK       Paxillin   Talin            Zyxin                                                                           0          1                2                   3       4                0.00 0.25 0.50 0.75 1.00
                                                     KD          KD        KD               KD                                                                                   FA Area density (%)                                                    Norm. FA Area density
                                                                                                                                                                                                                                                                               and shape factor of focal ad-
                                                                                                                                                                                                                                                                               hesions are positively (E) and
negatively (F) correlated with cell speed, respectively. Straight                                                                                                                                                                        line in each plot shows linear regression of analyzed data set.
Degree of correlation between focal adhesion size and cell                                                                                                                                                                               speed is not very strong (r⫽0.66), and cell speed changes
                                                                                                                                                                                                                                                                                      (continued on next page)

6                                Vol. 27                 April 2013                                                                                                              The FASEB Journal 䡠 www.fasebj.org                                                                                                                                                KIM AND WIRTZ
were added to the extracellular physical variations                 nonlinear) and linear models were applied to the
discussed so far so as to expand the data sets. Major               normalized data set ranged between 0 to 1 to assess the
focal adhesion proteins (FAK, paxillin, talin, and zyxin)           nonmonotonic response of cell speed to the changes in
were depleted using shRNA technology as reported                    focal adhesion size (Fig. 3G, H). We found that a
previously (17), and resulting cells were placed on                 gaussian fit of focal adhesion size vs. cell speed was
substrates of controlled stiffness (Fig. 3A). Although              excellent (r2⫽0.93; Fig. 3G), revealing a tight, non-
individual effects of depletion of a focal adhesion                 monotonic relationship between focal adhesion size
protein or changes in substrate compliance on focal                 and cell speed. This result indicated that, over a wide
adhesion morphology or cell motility have been exten-               range of conditions (⬃70% of the total range in
sively studied (1, 2, 4, 30, 31), effects of combined               measured focal adhesion size), cell speed increased
disturbances (genetic and physical) are hard to inter-              when focal adhesions increase in size, until an optimum
pret, since deviation of measured quantities from the               was reached. Moreover, a gaussian relationship be-
control condition is not simply sum of the two individ-             tween focal adhesion size and cell speed (r2⫽0.93; Fig.
ual effects, but the results of synergistic or compensa-            3G) was much tighter than the linear relationship
tory effects that may be triggered by unrevealed or less            between focal adhesion shape factor and cell speed
related signal pathways. Therefore, instead of identify-            (r2⫽0.61; Fig. 3H), which suggests that focal adhesion
ing the effects of individual disturbances, we compared             size, rather than shape, was highly predictive of cell
the combined effect of 2 variations (i.e., substrate                migration speed.
stiffness and genetic manipulations of focal adhesion                  We asked whether not only the mean size of individ-
proteins) to the control condition (i.e., wild type [WT]            ual focal adhesions but also cumulative effect of all
cells on glass slide) using 1-way ANOVA (Fig. 3B–D and              focal adhesions present in a cell predicted cell speed.
Supplemental Fig. S2A, B).                                          To test this hypothesis, we measured the total number
   Pearson correlation analysis revealed that cell speed            of focal adhesions per cell and focal adhesion area
and persistence of migration were correlated with a                 density, defined as the fraction of the cell area occu-
subset of focal adhesion parameters (Figs. 3E, F and 4              pied by focal adhesions (Fig. 3I, L). These parameters
and Supplemental Fig. S2). Specifically, focal adhesion             did not show considerable correlations with cell speed
size moderately correlated with cell speed (Fig. 3E) but            (i.e., at least, |r|ⱖ0.65) and they were poorly approxi-
weakly correlated with descriptors of migratory persis-             mated by linear and nonlinear fits (Fig. 3J, K, M, N).
tence (Supplemental Fig. S2C), while the shape factor               These results reinforce the notion that focal adhesion
of focal adhesions moderately correlated with cell                  size is a parameter that uniquely predicts cell speed,
speed (Fig. 3F) as well as final distance traveled and              independently of the surface coverage of focal adhe-
persistence distance (Supplemental Fig. S2D). Notably,              sions in a cell.
focal adhesions were larger and more elongated in
fast-moving cells (Fig. 3E, F). However, we also noted              Predictive power of focal adhesion size for cell
that the magnitude of correlation coefficient between               migration speed
focal adhesion size and cell speed was not high, which
suggested that focal adhesion size and cell speed were              So far, we have assessed the relationship between focal
not well described by a linear relationship, as assumed             adhesion morphology and cell motility through genetic
by Pearson correlation analysis.                                    manipulation of focal adhesion components and con-
   Indeed, while focal adhesion shape and cell speed                trolled changes in substrate compliance, which are known to
were monotonically related (Fig. 3F), we observed a                 affect focal adhesions (which we shall call the primary
prominent biphasic relationship between focal adhe-                 data set). Through 5 blind validating tests, we next
sion size and cell speed (Fig. 3E). Thus, gaussian (i.e.,           tested disturbances progressively more remote (physi-

nonmonotonously with focal adhesion size (E). Pearson coefficient r, r2, and P values and corresponding plots of all pairs of
descriptors of focal adhesion morphology and cell motility are summarized in Supplemental Fig. S2 and Fig. 4. G, H) Gaussian
(G) and linear (H) regressions of size and shape factor of focal adhesions vs. cell speed. Goodness of the fit of the gaussian
relationship between focal adhesion size and cell speed (r2⫽0.93) was greater than the linear relationship between focal
adhesion shape factor and cell speed (r2⫽0.61). I, L) Changes in number of focal adhesions per cell (I) and focal adhesion area
density, defined as the fraction of cell area occupied by focal adhesions (L), in response to changes in substrate stiffness: rigid
glass (black), a stiff gel (gray), and a soft gel (white) and depletion of focal adhesion proteins (FAK, paxillin, talin, and zyxin).
J, M) Correlations of number of focal adhesions per cell (J) and area density (%) of focal adhesions (M) with cell speed. Both
number and area density of focal adhesions per cell weakly correlate with cell speed (i.e., |r|⬍0.65). K, N) Assessment of
regressed relationships of number of focal adhesions per cell (K) and area density of focal adhesions (N) with cell speed using
either linear (orange) or gaussian (blue) models. goodness of fits for both linear and gaussian relationships was relatively weak
compared to focal adhesion size vs. cell speed (G). In panels B–D, I, and L, focal adhesions were analyzed in ⬎30 cells, and ⬎50
cells were tracked per condition. Error bars represent sem of averaged values; 1-way ANOVA using Dunnett’s post test was applied
based on the values in the WT cells on stiff substrate (control) for multiple comparisons. Only comparisons with significant
statistical difference (P⬍0.05) are shown. In panels E, F, J, and M, criteria for assessing the degree of correlation is the same as
those in Fig. 1M–O and Fig. 2H–J. In panels G, H, K, and N, data are normalized as (x ⫺ xmin)/(xmax ⫺ xmin) so that all data
ranges between 0 (min) and 1 (max). *P ⬍ 0.05, **P ⬍ 0.01, ***P ⬍ 0.001.

FOCAL ADHESION SIZE UNIQUELY PREDICTS CELL MIGRATION                                                                               7
Cell Motility
                                             Primary
      Primary
                                           + Blind test                                                    Persistence
                                                                  Speed              Final distance                           Persistence time   Number of turns
                                                                                                            distance
                                                          0.66            0.68      0.51        0.44     0.46         0.53    -0.05      0.13    0.02        -0.12
                                           Area           0.43            0.48      0.26        0.20     0.21         0.29    0.00       0.02    0.00        0.02
                                                          0.027           0.003    0.108       0.085     0.155       0.033    0.895      0.638   0.957      0.647
        Focal adhesion morphology

                                                          0.68            0.65      0.51        0.35     0.46         0.48    -0.09      0.24    0.12        -0.21
                                         Perimeter        0.46            0.42      0.26        0.12     0.21         0.23    0.01       0.06    0.01        0.04
                                                          0.022           0.007    0.106       0.184     0.154       0.058    0.803      0.370   0.725      0.433
                                                          0.71            0.66      0.57        0.36     0.53         0.53    -0.03       0.3    0.06        -0.26
                                          Length          0.51            0.44      0.33        0.13     0.28         0.29    0.00       0.09    0.00        0.07
                                                          0.014           0.005    0.066       0.171     0.097       0.033    0.926      0.262   0.865      0.336
                                                          0.64            0.57      0.54        0.42     0.41         0.34    -0.26       -0.1   0.28        0.07
                                          Breadth         0.41            0.33      0.30        0.18     0.17         0.12    0.07       0.01    0.08        0.00
                                                          0.032           0.020    0.083       0.104     0.207       0.198    0.437      0.721   0.409      0.799
                                                          -0.78           -0.81    -0.78       -0.68     -0.75        -0.78   -0.03      -0.04   -0.08       -0.04
                                        Shape factor      0.61            0.65      0.61        0.46     0.56         0.61    0.00       0.00    0.01        0.00
                                                          0.005           0.000    0.004       0.004     0.008       0.000    0.921      0.874   0.818      0.885

Figure 4. Summary of correlations between focal adhesion morphology and cell motility. Pearson correlation coefficient r,
r2, and P values are calculated (top, middle, and bottom, respectively) between focal adhesion morphology (area,
perimeter, length, breadth, and shape factor) and cell motility (speed, final distance, persistence distance, persistence
time, and number of turns) in primary data set (left) and blind test results included data set (right). Data in green
represent moderate (0.65ⱕ |r| ⬍0.80) correlations; ⫹ and ⫺ denote positive and negative correlations, respectively. Focal
adhesion size (denoted by area) correlates with cell speed, but the magnitude is not very high (r⫽0.66 or 0.68). Blind test
results do not substantially disturb the degree of correlations determined by the primary data set.

cally and functionally) from focal adhesions to assess                                                 speed to the extent predicted by the primary data set
whether aggregation of focal adhesion proteins was the                                                 (Fig. 5E–G, blue).
functional unit required to modulate cell migration                                                       Finally, in order to further test the predictive power
and to determine whether focal adhesion size indeed                                                    of the relationship between focal adhesion size and cell
predicted cell speed.                                                                                  speed and to verify whether clustering of focal adhesion
   First, ␣-actinin-1,4, a major F-actin cross-linking/                                                components into focal adhesions actually controlled
bundling protein (32–36), which is associated with, but                                                cell motility, we next deactivated cell components that
is not a component of, focal adhesions, was shRNA                                                      had not previously been reported as regulators of focal
depleted, and resulting cells were tested on substrates                                                adhesions or cell migration. Here we used rotenone,
of low and high compliance. Compared to control WT                                                     which inhibits mitochondrial complexes by interfer-
cells (Fig. 5A), the depletion of ␣-actinin in cells on stiff                                          ing with electron transport chain in the mitochon-
substrates slightly reduced the size of focal adhesions,                                               dria (40), and bleomycin, which disrupts cell cycle by
which led to little change in cell speed (red bars, Fig.                                               forming free radicals that break DNA strands and
5E, F), as correctly predicted by the primary data set                                                 inhibiting thymidine incorporation into DNA (41,
(red diamond, Fig. 5G). When these cells were placed                                                   42). Cells treated with these drugs simultaneously
on soft substrates, however, the size of focal adhesions                                               reduced focal adhesion size and cell speed in accor-
changed significantly (Fig. 5B), which in turn changed                                                 dance to the primary data set (Fig. 5D, green and
cell speed (Supplemental Movie S1). These coordi-                                                      purple; E–G).
nated changes in focal adhesion size and cell speed                                                       To test the robustness of the above relationship
were again correctly predicted by the primary data set                                                 between focal adhesions and cell migration, we merged
(Fig. 5E–G, orange).                                                                                   the primary data set (Supplemental Fig. S2A, B) based
   Next, cells were treated with latrunculin B, which                                                  on the depletion of focal adhesion components and
inhibits the assembly of actin filaments (17, 37–39).                                                  changes in substrate compliance with the blind test
Actin stress fibers were gradually disassembled depend-                                                results (Supplemental Fig. S3A, B) generated by the
ing on the concentration of latrunculin B (Fig. 5C). In                                                depletion of ␣-actinin on stiff and soft substrates, the
cells treated with a high dose of latrunculin B (1 ␮M),                                                disruption of F-actin, the deactivation of mitochondria,
actin filaments were dismantled, and a majority of focal                                               and the inhibition of cell cycle through release of free
adhesions disappeared or diminished to small round                                                     radicals (data summarized in Supplemental Fig. S3 and
punctuate focal adhesions (Fig. 5C), which restricted                                                  Fig. 4). The functional relationships obtained from the
cell migration. By reducing the concentration of latrun-                                               primary data set were remarkably well maintained, even
culin B to 0.1 ␮M to avoid such an extreme response,                                                   after addition of the validating tests (Supplemental
we observed significant decrease in the size of focal                                                  Figs. S2 vs. S3 and Fig. 4), and the characteristic
adhesions, which quantitatively decreased migration                                                    biphasic relationship between focal adhesion size and

8   Vol. 27                         April 2013                                   The FASEB Journal 䡠 www.fasebj.org                                      KIM AND WIRTZ
A                                                                    E                         4
                                                                                                                                        F                         2.0
         Control

                                                                                                                                          Cell Speed ( µ m/min)
                                                                                FA Area (µ m 2)
                                                                                                  3                                                               1.5
                                                                                                           *
                                                                                                                *** ***     **                                                            **            *
                                                                                                  2                     ***                                       1.0
                                                                                                                                                                                   ***           ***

                                                                                                  1                                                               0.5

                                                                                                  0                                                               0.0

                                                                                                     La D D

                                                                                                                                                                      La KD D
                                                                                                             cu ft

                                                                                                                                                                             cu ft
                                                                                                                    ol

                                                                                                                                                                      C CT l
                                                                                                             om e

                                                                                                                                                                           le one
                                                                                                                   in

                                                                                                                                                                                   in
                                                                                                         R in B

                                                                                                                                                                          R in B
                                                                                                                                                                                    o
                                                                                                                  K

                                                                                                                                                                                  K
                                                                                                         un so

                                                                                                                                                                          un so
                                                                                                        B non
                                                                                                  α- α-A ntr

                                                                                                                                                                   α- α-A ntr
                                                                                                                 yc

                                                                                                                                                                                 yc
                                                                                                       TN TN

                                                                                                                                                                        TN N

                                                                                                                                                                               en
                                                                                                                l

                                                                                                                                                                                l
                                                                                                                /

                                                                                                                                                                                /

                                                                                                                                                                             om
                                                                                                              o

                                                                                                                                                                               o
                                                                                                              e
                                                                                              C

                                                                                                                                                                  C
                                                                                                            C

                                                                                                                                                                            ot
                                                                                                           ot
                                                                                                           K

                                                                                                          le

                                                                                                                                                                         B
                                                                                                       tr

                                                                                                                                                                        tr
         20µm

                                                                                                     C
                                         F-actin            Merge

                                                                                                    A

                                                                                                                                                                     A
   B                                                                    G                                                               H
         α-ACTN KD                      α-ACTN KD / soft                                    1.00                                                                  1.25

                                                                         Norm. Cell Speed

                                                                                                                                        Norm. Cell Speed
                                                                                                                                                                  1.00
                                                                                            0.75
                                                                                                                                                                  0.75
                                                                                            0.50
                                                                                                                                                                  0.50
                                                                                            0.25
                                                                                                                        r = 0.91                                  0.25
                                                                                                                        r = 0.93                                              r = 0.83
         20µm                                                                               0.00
                                                                                               0.00      0.25    0.50    0.75    1.00
                                                                                                                                                                  0.00
                                                                                                                                                                     0.00   0.25   0.50        0.75    1.00

    C                                                                                                     Norm. FA Size                                                      Norm. FA Area
         Latrunculin B                  Latrunculin B (high)                                          Primary data      Latrunculin B                                              HT-1080
                                                                                                      α-ACTN KD         Rotenone
                                                                                                      α-ACTN KD/soft    Bleomycin

                                                                        I
                                                                                            Focal adhesion              Cytoskeletal            Mitochondrial                             Cell cycle
                                                                                             disruption                  inhibition              inhibition                               inhibition
         20µm                 F-actin                      F-actin
   D
         Rotenone                       Bleomycin
                                                                                                                          Focal adhesion size

                                                                                                                                 Cell speed
         20µm

Figure 5. Functional relationship between focal adhesions and cell speed: validation. A–D) Representative immunofluorescence images of
focal adhesions in control cells (A), ␣-actinin-depleted cells on glass substrate and polyacrylamide gel (denoted by soft; B), and cells subjected
to actin depolymerizing latrunculin B (C), or mitochondrial deactivator rotenone and cell cycle inhibitor bleomycin (D). Thick actin stress
fibers in control cells (A) were gradually disorganized depending on the concentration of latrunculin B (C). Only small round punctuate
focal adhesions were detected when cells were treated with high dose of latrunculin B. E, F) Changes in focal adhesion size (E) and cell speed
(F) resulting from the blind tests. One-way ANOVA using Dunnett’s post test was applied based on the values in the WT cells on stiff substrate
(control) for multiple comparisons. Only comparisons with significant statistical difference (P⬍0.05) are shown. *P ⬍ 0.05, **P ⬍
0.01, ***P ⬍ 0.001. G) Comparison of relationship between focal adhesion size and cell speed before and after merging blind test results
with the primary data set (gray dotted line vs. red solid line), including depletion of ␣-actinin, treatment of latrunculin B, rotenone, and
bleomycin. All the calculated Pearson coefficient r, r2, and P values and corresponding plots of all pairs of normalized values of focal
adhesion morphology and cell motility including blind test results are summarized in Supplemental Fig. S3 and Fig. 4. Blind test results do
not disturb the relationships calculated from primary data set. H) Confirmation of relationship between focal adhesion size and cell speed
in human cells. A tight biphasic relationship was reconstructed using WT and FAK-, talin-, and zyxin-depleted human fibrosarcoma HT-1080
cells (r2⫽0.83). Focal adhesion size and cell speed of these cells are summarized in Supplemental Fig. S3C. In panels E–H, focal adhesions
were analyzed ⬎30 cells and ⬎50 cells were tracked per condition. Error bars represent sem of averaged values. In panels G–H, data are
normalized as (x ⫺ xmin)/(xmax ⫺ xmin), so that all data are ranged between 0 (min) and 1 (max). I) Schematic of cell speed prediction
by focal adhesion size. Regardless of the type of cell disturbance, focal adhesion size directly predicts cell speed.

cell speed was preserved (r2⫽0.93 and r2⫽0.91, before                                       cell migration speed across species and types of cells.
and after merging blind test results, Fig. 5G).                                             Using previously characterized control HT-1080 cells
   Finally, we tested human fibrosarcoma cells to con-                                      and FAK-, talin-, and zyxin-depleted HT-1080 cells (18,
firm the relationship between focal adhesion size and                                       43), we quantified focal adhesion size and cell speed as

FOCAL ADHESION SIZE UNIQUELY PREDICTS CELL MIGRATION                                                                                                                                                          9
discussed so far (Supplemental Fig. 3C). A tight bipha-        (Fig. 5I). Future work will determine whether the
sic relationship between focal adhesion size and cell          characteristic correlation between focal adhesion pro-
speed was maintained in human cancer cells (r2⫽0.83,           tein clustering and cell migration speed demonstrated
Fig. 5H).                                                      in this study applies to cells in settings of different
   Together, these results reveal that the mean size of        dimensionality, such as cancers cells fully embedded in
focal adhesions is highly predictive of cell migration         a three-dimensional extracellular matrix (12, 43).
speed; i.e., any observed change in cell speed following
a modulation of a known or unknown regulator of cell             The authors thank Dr. Sean X. Sun (Johns Hopkins
migration can be quantitatively predicted by a change          University) for helpful discussions about the interpretation of
in the mean size of focal adhesions in these cells (see        correlations discussed in this paper. The authors thank G. D.
                                                               Longmore and Y. Feng (Washington University in St. Louis,
schematic, Fig. 5I).                                           School of Medicine, St. Louis, MO, USA) for using their
                                                               knockdown cells. This work was supported by U.S. National
                                                               Institutes of Health grants U54CA143868 and R01CA174388.
                                                               The authors declare no conflicts of interest.
DISCUSSION

The existence of a robustly predictive, functional rela-
tionship between cell migration and focal adhesions
has not been previously established. Prior to this work,       REFERENCES
disparate observations across cell types (e.g., fast-mov-       1.   Pelham, R. J., Jr., and Wang, Y. (1997) Cell locomotion and focal
ing Dictyostelium discoideum and neutrophils vs. slowly              adhesions are regulated by substrate flexibility. Proc. Natl. Acad.
moving fibroblasts) suggested an inverse relation be-                Sci. U. S. A. 94, 13661–13665
tween focal adhesion size and cell migration speed (14,         2.   Discher, D. E., Janmey, P., and Wang, Y. L. (2005) Tissue cells
                                                                     feel and respond to the stiffness of their substrate. Science 310,
44, 45). In contrast, our results reveal that cell speed             1139 –1143
largely changes biphasically with focal adhesion size.          3.   Small, J. V., Kaverina, I., Krylyshkina, O., and Rottner, K. (1999)
More precisely, MEF speed steadily increases with focal              Cytoskeleton cross-talk during cell motility. FEBS Lett. 452,
                                                                     96 –99
adhesion size, until a threshold value of ⬃0.7 (corre-          4.   Prager-Khoutorsky, M., Lichtenstein, A., Krishnan, R., Rajen-
sponding to ⬃2.6 ␮m2) in normalized focal adhesion                   dran, K., Mayo, A., Kam, Z., Geiger, B., and Bershadsky, A. D.
size (Figs. 3G and 5G) beyond which cell speed de-                   (2011) Fibroblast polarization is a matrix-rigidity-dependent
clines. The late stage is mainly due to the FAK-depleted             process controlled by focal adhesion mechanosensing. Nat. Cell
                                                                     Biol. 13, 1457–1465
cells whose focal adhesions outgrew and thus cell               5.   Webb, D. J., Parsons, J. T., and Horwitz, A. F. (2002) Adhesion
motility was retarded. This result is in concordance with            assembly, disassembly and turnover in migrating cells: over and
a previous study showing that inhibition of FAK activity             over and over again. Nat. Cell Biol. 4, E97–100
                                                                6.   Lock, J. G., Wehrle-Haller, B., and Stromblad, S. (2008) Cell-
decreased focal adhesion turnover and significantly                  matrix adhesion complexes: master control machinery of cell
reduced cell speed (44, 46).                                         migration. Sem. Cancer Biol. 18, 65–76
   In previous studies (15, 16, 47), cell migration speed       7.   Geiger, B., Spatz, J. P., and Bershadsky, A. D. (2009) Environ-
biphasically changed depending on the adhesion                       mental sensing through focal adhesions. Nat. Rev. Mol. Cell Biol.
                                                                     10, 21–33
strength between cell and underlying substrates where           8.   Ridley, A. J., Schwartz, M. A., Burridge, K., Firtel, R. A.,
ligand density was referred to the adhesion strength                 Ginsberg, M. H., Borisy, G., Parsons, J. T., and Horwitz, A. R.
and biphasic behavior of cell speed was observed when                (2003) Cell migration: integrating signals from front to back.
plotted to the logarithmic scale of the adhesion                     Science 302, 1704 –1709
                                                                9.   Lauffenburger, D. A., and Horwitz, A. F. (1996) Cell migration:
strength. This may suggest that adhesion strength in-                a physically integrated molecular process. Cell 84, 359 –369
creases nonlinearly with focal adhesion size. Initially        10.   Lee, J. S. H., Chang, M. I., Tseng, Y., and Wirtz, D. (2005) Cdc42
focal adhesion molecules nucleate and grow in size,                  mediates nucleus movement and MTOC polarization in Swiss
                                                                     3T3 fibroblasts under mechanical shear stress. Mol. Biol. Cell 16,
where adhesion strength rapidly increases to the avail-              871–880
able maximum value, but adhesion strength might not            11.   Hale, C. M., Chen, W. C., Khatau, S. B., Daniels, B. R., Lee,
be further increased even though apparent size of focal              J. S. H., and Wirtz, D. (2011) SMRT analysis of MTOC and
adhesions keeps growing, and this focal adhesion en-                 nuclear positioning reveals the role of EB1 and LIC1 in single-
                                                                     cell polarization. J. Cell Sci. 124, 4267–4285
ters the decaying phase, where the size of focal adhe-         12.   Khatau, S. B., Bloom, R. J., Bajpai, S., Razafsky, D., Zang, S., Giri,
sions would progressively decrease due to the dissipa-               A., Wu, P. H., Marchand, J., Celedon, A., Hale, C. M., Sun, S. X.,
tion of focal adhesion molecules. This notion is                     Hodzic, D., and Wirtz, D. (2012) The distinct roles of the
                                                                     nucleus and nucleus-cytoskeleton connections in three-dimen-
supported by the finding that adhesion strength in-                  sional cell migration. Sci. Rep. 2, 488
creases nonlinearly with adhesive area controlled by           13.   Patla, I., Volberg, T., Elad, N., Hirschfeld-Warneken, V., Gra-
micropatterned adhesive island size (48).                            shoff, C., Fassler, R., Spatz, J. P., Geiger, B., and Medalia, O.
   Changes in focal adhesion size seem to serve as a                 (2010) Dissecting the molecular architecture of integrin adhe-
                                                                     sion sites by cryo-electron tomography. Nat. Cell Biol. 12, 909 –
necessary funnel through which intracellular or extra-               915
cellular disturbances (including changes in substrate          14.   Nagasaki, A., Kanada, M., and Uyeda, T. Q. P. (2009) Cell
compliance, depletion of focal adhesion proteins, dis-               adhesion molecules regulate contractile ring-independent cyto-
ruption of cytoskeleton, deactivation of nonfocal adhe-              kinesis in Dictyostelium discoideum. Cell Res. 19, 236 –246
                                                               15.   DiMilla, P. A., Barbee, K., and Lauffenburger, D. A. (1991)
sion proteins, e.g., mitochondria, inhibition of cell                Mathematical model for the effects of adhesion and mechanics
cycle, etc.) have to go through to regulate cell speed               on cell migration speed. Biophys. J. 60, 15–37

10   Vol. 27   April 2013                   The FASEB Journal 䡠 www.fasebj.org                                        KIM AND WIRTZ
16.   Maheshwari, G., Brown, G., Lauffenburger, D. A., Wells, A., and           34.   Tseng, Y., Fedorov, E., McCaffery, J. M., Almo, S. C., and Wirtz,
      Griffith, L. G. (2000) Cell adhesion and motility depend on                     D. (2001) Micromechanics and ultrastructure of actin filament
      nanoscale RGD clustering. J. Cell Sci. 113(Pt. 10), 1677–1686                   networks crosslinked by human fascin: a comparison with
17.   Katz, B. Z., Zamir, E., Bershadsky, A., Kam, Z., Yamada, K. M.,                 alpha-actinin. J. Mol. Biol. 310, 351–366
      and Geiger, B. (2000) Physical state of the extracellular matrix          35.   Esue, O., Tseng, Y., and Wirtz, D. (2009) Alpha-actinin and
      regulates the structure and molecular composition of cell-                      filamin cooperatively enhance the stiffness of actin filament
      matrix adhesions. Mol. Biol. Cell 11, 1047–1060                                 networks. PloS ONE 4, e4411
18.   Scales, T. M., and Parsons, M. (2011) Spatial and temporal                36.   Wakatsuki, T., Schwab, B., Thompson, N. C., and Elson, E. L.
      regulation of integrin signalling during cell migration. Curr.                  (2001) Effects of cytochalasin D and latrunculin B on mechan-
      Opin. Cell Biol. 23, 562–568                                                    ical properties of cells. J. Cell Sci. 114, 1025–1036
19.   Dumbauld, D. W., Michael, K. E., Hanks, S. K., and Garcia, A. J.          37.   Khatau, S. B., Hale, C. M., Stewart-Hutchinson, P. J., Patel, M. S.,
      (2010) Focal adhesion kinase-dependent regulation of adhesive                   Stewart, C. L., Searson, P. C., Hodzic, D., and Wirtz, D. (2009)
      forces involves vinculin recruitment to focal adhesions. Biol. Cell             A perinuclear actin cap regulates nuclear shape. Proc. Natl. Acad.
      102, 203–213                                                                    Sci. U. S. A. 106, 19017–19022
20.   Goffin, J. M., Pittet, P., Csucs, G., Lussi, J. W., Meister, J. J., and   38.   Hale, C. M., Sun, S. X., and Wirtz, D. (2009) Resolving the role
      Hinz, B. (2006) Focal adhesion size controls tension-dependent                  of actoymyosin contractility in cell microrheology. PloS ONE 4,
      recruitment of alpha-smooth muscle actin to stress fibers. J. Cell              e7054
      Biol. 172, 259 –268                                                       39.   Li, N., Ragheb, K., Lawler, G., Sturgis, J., Rajwa, B., Melendez,
21.   Guo, W. H., Frey, M. T., Burnham, N. A., and Wang, Y. L. (2006)                 J. A., and Robinson, J. P. (2003) Mitochondrial complex I
      Substrate rigidity regulates the formation and maintenance of                   inhibitor rotenone induces apoptosis through enhancing mito-
      tissues. Biophys. J. 90, 2213–2220                                              chondrial reactive oxygen species production. J. Biol. Chem. 278,
22.   Chan, C. E., and Odde, D. J. (2008) Traction dynamics of                        8516 –8525
      Filopodia on compliant substrates. Science 322, 1687–1691                 40.   Byrnes, R. W., and Petering, D. H. (1994) DNA double-strand
23.   Galbraith, C. G., Yamada, K. M., and Sheetz, M. P. (2002) The                   breakage by bleomycin in Ehrlich ascites tumor cells as mea-
      relationship between force and focal complex development. J.                    sured by nondenaturing filter elution. Rad. Res. 137, 162–170
      Cell Biol. 159, 695–705                                                   41.   Cloos, J., Reid, C. B., van der Sterre, M. L., Tobi, H., Leemans,
24.   Besser, A., and Safran, S. A. (2006) Force-induced adsorption                   C. R., Snow, G. B., and Braakhuis, B. J. (1999) A comparison of
      and anisotropic growth of focal adhesions. Biophys. J. 90, 3469 –               bleomycin-induced damage in lymphocytes and primary oral
      3484                                                                            fibroblasts and keratinocytes in 30 subjects. Mutagenesis 14,
25.   Parsons, J. T., Horwitz, A. R., and Schwartz, M. A. (2010) Cell                 87–93
      adhesion: integrating cytoskeletal dynamics and cellular ten-             42.   Fraley, S. I., Feng, Y., Krishnamurthy, R., Kim, D. H., Celedon,
      sion. Nat. Rev. Mol. Cell Biol. 11, 633–643                                     A., Longmore, G. D., and Wirtz, D. (2010) A distinctive role for
26.   Khatiwala, C. B., Peyton, S. R., and Putnam, A. J. (2006) Intrinsic             focal adhesion proteins in three-dimensional cell motility. Nat.
      mechanical properties of the extracellular matrix affect the                    Cell Biol. 12, 598 –604
      behavior of pre-osteoblastic MC3T3-E1 cells. Am. J. Physiol. Cell         43.   Fraley, S. I., Feng, Y. F., Giri, A., Longmore, G. D., and Wirtz, D.
      Physiol. 290, C1640 –C1650                                                      (2012) Dimensional and temporal controls of three-dimen-
27.   Ulrich, T. A., Pardo, E. M. D., and Kumar, S. (2009) The                        sional cell migration by zyxin and binding partners. Nat. Com-
      mechanical rigidity of the extracellular matrix regulates the                   mun. 3, 719 –732
      structure, motility, and proliferation of glioma cells. Cancer Res.       44.   Ilic, D., Furuta, Y., Kanazawa, S., Takeda, N., Sobue, K., Nakat-
      69, 4167–4174                                                                   suji, N., Nomura, S., Fujimoto, J., Okada, M., and Yamamoto, T.
28.   Kim, D. H., Khatau, S. B., Feng, Y., Walcott, S., Sun, S. X.,                   (1995) Reduced cell motility and enhanced focal adhesion
      Longmore, G. D., and Wirtz, D. (2012) Actin cap associated                      contact formation in cells from FAK-deficient mice. Nature 377,
      focal adhesions and their distinct role in cellular mechanosens-                539 –544
      ing. Sci. Rep. 2, 555                                                     45.   Thompson, O., Moore, C. J., Hussain, S. A., Kleino, I., Peckham,
29.   Wang, H. B., Dembo, M., Hanks, S. K., and Wang, Y. L. (2001)                    M., Hohenester, E., Ayscough, K. R., Saksela, K., and Winder,
      Focal adhesion kinase is involved in mechanosensing during                      S. J. (2010) Modulation of cell spreading and cell-substrate
      fibroblast migration. Proc. Natl. Acad. Sci. U. S. A. 98, 11295–                adhesion dynamics by dystroglycan. J. Cell Sci. 123, 118 –127
      11300                                                                     46.   Iwanicki, M. P., Vomastek, T., Tilghman, R. W., Martin, K. H.,
30.   Xu, W. M., Baribault, H., and Adamson, E. D. (1998) Vinculin                    Banerjee, J., Wedegaertner, P. B., and Parsons, J. T. (2008) FAK,
      knockout results in heart and brain defects during embryonic                    PDZ-RhoGEF and ROCKII cooperate to regulate adhesion
      development. Development 125, 327–337                                           movement and trailing-edge retraction in fibroblasts. J. Cell Sci.
31.   Honda, K., Yamada, T., Endo, R., Ino, Y., Gotoh, M., Tsuda, H.,                 121, 895–905
      Yamada, Y., Chiba, H., and Hirohashi, S. (1998) Actinin-4, a              47.   Palecek, S. P., Loftus, J. C., Ginsberg, M. H., Lauffenburger,
      novel actin-bundling protein associated with cell motility and                  D. A., and Horwitz, A. F. (1997) Integrin-ligand binding prop-
      cancer invasion. J. Cell Biol. 140, 1383–1393                                   erties govern cell migration speed through cell-substratum
32.   Choi, C. K., Vicente-Manzanares, M., Zareno, J., Whitmore,                      adhesiveness. Nature 385, 537–540
      L. A., Mogilner, A., and Horwitz, A. R. (2008) Actin and                  48.   Gallant, N. D., Michael, K. E., and Garcia, A. J. (2005) Cell
      alpha-actinin orchestrate the assembly and maturation of nas-                   adhesion strengthening: contributions of adhesive area, integ-
      cent adhesions in a myosin II motor-independent manner. Nat.                    rin binding, and focal adhesion assembly. Mol. Biol. Cell 16,
      Cell Biol. 10, 1039 –1050                                                       4329 –4340
33.   Xu, J. Y., Tseng, Y., and Wirtz, D. (2000) Strain hardening of
      actin filament networks: regulation by the dynamic cross-linking                                        Received for publication September 24, 2012.
      protein alpha-actinin. J. Biol. Chem. 275, 35886 –35892                                                  Accepted for publication December 4, 2012.

FOCAL ADHESION SIZE UNIQUELY PREDICTS CELL MIGRATION                                                                                                   11
You can also read