Meta-analysis of Gene Expression Microarray Datasets in Chronic Obstructive Pulmonary Disease - bioRxiv
←
→
Page content transcription
If your browser does not render page correctly, please read the page content below
bioRxiv preprint first posted online Jun. 14, 2019; doi: http://dx.doi.org/10.1101/671206. The copyright holder for this preprint
      (which was not peer-reviewed) is the author/funder, who has granted bioRxiv a license to display the preprint in perpetuity.
                                       It is made available under a CC-BY 4.0 International license.

                                             Meta-analysis of Gene Expression Microarray Datasets in
                                             Chronic Obstructive Pulmonary Disease
                                             Lavida R. K. Rogers1,3 , Madison Verlinde 3 , George I. Mias2,3*

                                            1 Microbiology and Molecular Genetics, Michigan State University, East Lansing, MI,
                                            USA
                                            2 Biochemistry and Molecular Biology, Michigan State University, East Lansing, MI,
                                            USA
                                            3 Institute for Quantitative Health Science and Engineering, Michigan State University,
                                            East Lansing, MI, USA

                                            * gmias@msu.edu

                                             Abstract
                                            Chronic obstructive pulmonary disease (COPD) was classified by the Centers for
                                            Disease Control and Prevention in 2014 as the 3rd leading cause of death in the United
                                            States (US). The main cause of COPD is exposure to tobacco smoke and air pollutants.
                                            Problems associated with COPD include under-diagnosis of the disease and an increase
                                            in the number of smokers worldwide. The goal of our study is to identify disease
                                            variability in the gene expression profiles of COPD subjects compared to controls. We
                                            used pre-existing, publicly available microarray expression datasets to conduct a
                                            meta-analysis. Our inclusion criteria for microarray datasets selected for smoking status,
                                            age and sex of blood donors reported. Our datasets used Affymetrix, Agilent microarray
                                            platforms (7 datasets, 1,262 samples). We re-analyzed the curated raw microarray
                                            expression data using R packages, and used Box-Cox power transformations to
                                            normalize datasets. To identify significant differentially expressed genes we ran an
                                            analysis of variance with a linear model with disease state, age, sex, smoking status and
                                            study as effects that also included binary interactions. We found 1,513 statistically
                                            significant (Benjamini-Hochberg-adjusted p-value
bioRxiv preprint first posted online Jun. 14, 2019; doi: http://dx.doi.org/10.1101/671206. The copyright holder for this preprint
(which was not peer-reviewed) is the author/funder, who has granted bioRxiv a license to display the preprint in perpetuity.
It is made available under a CC-BY 4.0 International license.
bronchitis and emphysema often occur together and are grouped under COPD [1, 2]. 5
Furthermore, the Global Initiative for Chronic Obstructive Lung Disease (GOLD) 6
describes COPD as a common and preventable disease that is caused by exposure to 7
harmful particles and gases that affect the airways and alveolar of the lungs [7, 8]. 8
Individuals with COPD experience shortness of breath due to lowered concentrations of 9
oxygen in the blood and a chronic cough accompanied by mucus production [1–4, 6]. 10
COPD progresses with time and the damage caused to the lungs is irreversible [8, 9]. 11
However, there are treatments available to control disease progression [8, 9]. 12
COPD, the 3rd leading cause of death in the United States (US), is expected to rise 13
in 15 years to the leading cause of death [8–10]. Globally, there were over 250 million 14
cases of COPD reported in 2016 and in 2015 3.17 million individuals died from the 15
disease [5]. COPD is prevalent in low- and middle-income countries with over 90% of 16
COPD cases occurring in these areas [5, 10]. The disease is mainly caused by tobacco 17
exposure through smoking cigarettes or second-hand exposure to smoke [8, 9]. In 18
addition to this, continuous exposure to other irritants such as burning fuels, chemicals, 19
polluted air and dust can lead to COPD [5]. Cigarette smoke exposes the lungs to large 20
amounts of oxidants that induce inflammation of the airways. Previous research on 21
bronchial biopsies highlighted the presence of increased concentrations of inflammatory 22
cells throughout the lungs [11, 12]. Studies have also suggested that COPD acts like an 23
autoimmune disease due to persistent inflammation even after smoking has 24
ceased [12–14]. In addition to environmental pollutants, there is also also a genetic 25
deficiency, alpha-1 antitrypsin deficiency (AATD), that is associated with COPD [8]. 26
AATD protects the lungs, and without it the lungs become vulnerable to COPD. The 27
prevalence of COPD is expected to rise due to increasing smoking rates and larger 28
populations of elderly individuals in many countries [5]. 29
COPD is often underdiagnosed and despite tobacco exposure being the highest risk 30
factor, not all smokers get COPD, and non-smokers can also develop COPD. Previous 31
work has been done to identify biomarkers for earlier diagnosis of COPD in blood, a 32
non-invasive approach. Bahr et al., compared expression profiles of smokers with COPD 33
and smokers without COPD [15]. They used multiple linear regression to identify 34
candidate genes and pathways. Their results highlighted pathways involved in the 35
immune system and inflammatory response [15]. Another study of blood gene expression 36
in COPD explored using pre-existing gene interaction networks to perform unsupervised 37
clustering to identify COPD disease sub-types [16]. More recently, Reinhold et al., took 38
a different approach by conducting a meta-analysis that identified groups of genes 39
associated with COPD by using consensus modules of gene co-expression. They built 40
networks of genes that were co-expressed and associated with COPD phenotypes [17]. 41
In our meta-analysis, the objective was to identify the effects of age, sex, and 42
smoking status on gene expression in COPD. We investigated gene expression changes 43
in blood for 1,262 samples (574 healthy samples and 688 COPD samples) to identify 44
genes and their associated pathways in COPD. Our study is the largest meta-analysis 45
on blood expression for COPD to date, to the best of our knowledge, and our results 46
offer prospective gene and pathway associations that may be targeted for improving 47
COPD diagnosis and treatment. Our meta-analysis also highlighted disease genes that 48
interact with smoking status, and these genes can be used to further characterize the 49
effects of smoking on COPD development. 50
Materials and Methods 51
We used seven publicly available COPD microarray gene expression datasets in our 52
meta-analysis to evaluate variation in gene expression across samples due to disease 53
status, sex, age and smoking status (Table 1). The 7 expression datasets were from 3 54
June 14, 2019 2/26bioRxiv preprint first posted online Jun. 14, 2019; doi: http://dx.doi.org/10.1101/671206. The copyright holder for this preprint
(which was not peer-reviewed) is the author/funder, who has granted bioRxiv a license to display the preprint in perpetuity.
It is made available under a CC-BY 4.0 International license.
different microarray platforms: Affymetrix GeneChip Human Genome U133 Plus 2.0, 55
Affymetrix Human Gene 1.1 ST Array and Agilent Whole Human Genome Microarray 56
4x44K. Our current meta-analysis pipeline (similar to Brooks et al. [18]), included 5 57
main steps (Fig 1): (1) data curation; (2) pre-processing of raw expression data; (3) 58
analysis of variance (ANOVA) on our linear model which compared gene expression 59
changes due to disease state, smoking status, sex and age group; (4) post-hoc analysis 60
using Tukey Honest Significance Difference test (TukeyHSD) for biological significance; 61
and (5) Gene ontology (GO) and pathway enrichment analysis of the differentially 62
expressed and biologically significant genes. 63
Table 1. Description of datasets used in the meta-analysis.
Database Repository Dataset Accession Control COPD Platform
Array Express E-MTAB-5278 181 53 Affymetrix Human Genome Plus 2.0
Array Express E-MTAB-5279 89 0 Affymetrix Human Genome Plus 2.0
GEO GSE42057 42 94 Affymetrix Human Genome Plus 2.0
GEO GSE47415 48 0 Agilent-014850 Whole Human Genome Microarray 4x44K
GEO GSE54837 90 136 Affymetrix Human Genome Plus 2.0
GEO GSE71220 44 405 Affymetrix Human Gene 1.1 ST Array
GEO GSE87072 80 0 Affymetrix Human Genome Plus 2.0
Microarray Data Curation from Gene Expression Omnibus and 64
Array Express 65
To gather the datasets for our meta-analysis, we searched the National Center for 66
Biotechnology Information (NCBI)’s data repository, Gene Expression Omnibus 67
(GEO) [19], and the European Bioinformatics Institute (EMBL-EBI)’s data repository, 68
Array Express (AE) [20] for microarray expression data. We used the following 69
keywords to search the repositories: COPD, Homo sapiens, blood (whole blood and 70
peripheral blood mononuclear cells) and expression profiling by array (Fig 1B). The 71
search results were further filtered to include datasets where the age, sex and smoking 72
status of the samples were reported (Fig 1B). We found 3 datasets from GEO 73
(GSE42057 [21], GSE71220 [22], GSE54837 [23]) and 1 from AE (E-MTAB-5278 [24]) 74
that met our search criteria (Table 1 and Fig 1B). We conducted an additional search 75
on GEO and AE to find healthy subjects with their smoking history reported to balance 76
our control subjects with our COPD subjects. The search keywords included: Homo 77
sapiens, blood, smoking and expression profiling by array. We also filtered these search 78
results for datasets that reported the age, sex and smoking status of subjects. With this 79
additional search, we added 3 more datasets: GSE87072 [25], GSE47415 [26], and 80
E-MTAB-5279 [24] which helped improve the balance between COPD and control 81
subjects (Table 1 and DF1 of online data files). 82
After selecting the datasets for our meta-analysis, we retrieved the raw microarray 83
expression data for each dataset, and created a demographics file per study, which 84
included sample characteristics using e-utils in Mathematica [27] (Table 2). The 85
demographics files were further filtered to eliminate samples that did not fit our 86
inclusion criteria. For example, GSE71220 included subjects that were using statin 87
drugs [22], and hence we excluded all samples that were receiving treatment from our 88
analysis. For GSE87072, we removed the samples that were moist snuff consumers [25] 89
and only used smokers and non-smokers in our analysis. In our additional search for 90
controls with smoking status reported, we filtered the selected datasets (GSE87072, 91
GSE47415 and E-MTAB-5279) and only used the healthy samples for our analysis. In 92
addition to this, we excluded the subjects in GSE23515 [28] from our analysis because 93
June 14, 2019 3/26bioRxiv preprint first posted online Jun. 14, 2019; doi: http://dx.doi.org/10.1101/671206. The copyright holder for this preprint
(which was not peer-reviewed) is the author/funder, who has granted bioRxiv a license to display the preprint in perpetuity.
It is made available under a CC-BY 4.0 International license.
Fig 1. Meta-analysis pipeline for Chronic Obstructive Pulmonary Disease.
(A)Summary of workflow used for the meta-analysis,(B) Microarray curation and
filtering steps, (C) Pre-processing steps used on the microarray data,(D) Data analysis
post ANOVA, (E) post-hoc analysis steps using ANOVA results.
22 of the 24 samples are duplicates from GSE47415 [26]. Our demographics files were 94
created to include variables that were reported across all samples (see merged 95
Demographics file DF1 of online supplementary data files) because study annotations 96
had not been uniformly reported in the databases (S1 File). 97
Microarray Pre-processing and BoxCox Normalization 98
To download the raw microarray expression for each dataset we used Mathematica [29]. 99
All raw expression data files were pre-processed in R [30] using R packages specific to 100
each microarray platform (Fig 1C). For the datasets from the Affymetrix Human 101
Genome Plus 2.0 platform, we used the affy package [31] for pre-processing all of the 102
.CEL files. The oligo [32] and affycoretools [33] packages were used to pre-process 103
the data files from the Affymetrix Human Gene 1.1 ST microarry platform, while the 104
limma package [34] was used for the data files from the Agilent Whole Human Genome 105
microarray platform. We performed background correction, normalization, and all 106
June 14, 2019 4/26bioRxiv preprint first posted online Jun. 14, 2019; doi: http://dx.doi.org/10.1101/671206. The copyright holder for this preprint
(which was not peer-reviewed) is the author/funder, who has granted bioRxiv a license to display the preprint in perpetuity.
It is made available under a CC-BY 4.0 International license.
Table 2. Sample Characteristics By Dataset.
Dataset Accession Sex(M/F) Smoking Status (S/NS/FS)* Age Range
E-MTAB-5279 46/43 30/29/30 24 - 65
EMTAB5278 136/98 114/60/60 41 - 70
GSE42057 74/62 35/2/99 45 - 80
GSE47415 24/24 24/24/0 20 - 64
GSE54837 148/78 84/6/136 40 - 75
GSE71220 285/165 91/22/336 49 - 75
GSE87072 80/0 40/40/0 35 - 60
*S=smoker, NS=non-smoker, FS= former smoker
probes were annotated and summarized (Fig 1C). For the Affymetrix Human Genome 107
Plus 2.0 expression data files, the expresso function was used to pre-process the files 108
with the following parameters: background correction with robust multi-array analysis 109
(RMA), correcting the perfect-match (PM) probes, and ‘avdiff’ to calculate expression 110
values [31]. Subsequently, the avereps function from limma was used to summarize the 111
probes and remove replicates [34]. The Affymetrix Human Gene 1.1 ST data files were 112
also background corrected using RMA, and the probes were summarized and replicates 113
removed using the avereps function. As for the Agilent data files, background 114
correction was performed using the backgroundCorrect function with NormExp 115
Background Correction as the method from the limma package [35]. The probes for 116
both Affymetrix Human Gene 1.1 ST and Agilent were also summarized and replicates 117
were removed using the avereps function from limma. Once pre-processing was 118
completed, the 8 datasets (Table 1) were merged by common gene symbols into a single 119
matrix file. Using the ApplyBoxCoxTransform function and the StandardizeExtended 120
function from the MathIOmica (version 1.1.3) package [27, 36] in Mathematica, we 121
performed a Box-Cox power transformation and data standardization on the merged 122
expression file [37] (Fig 1C and DF2 of online supplementary data files). 123
Identifying and Visualizing Batch Effects 124
Conducting meta-analyses by combining expression datasets across different microarray 125
platforms and research labs/studies introduces batch effects/confounding factors to the 126
data. The batch effects can introduce non-biological variation in the data, which affects 127
the interpretation of the results. In order to visualize variation in the expression data 128
across factors, we conducted principal component analysis (PCA) on the expression 129
data and generated PCA plots (Fig 2 and S1 Fig). As we also previously described [18], 130
the study factor is directly related to the microarray platform type. To address this, the 131
ComBat function in the sva package was used to correct for variation in the data due to 132
the study factor [38, 39]. PCA plots were used to visualize variation in expression data 133
before and after batch correction with ComBat [40] (Fig 2 and S1 Fig), confirming the 134
main batch effect removal by adjusting for study. 135
Analysis of Variance to Identify Differentially Expressed Genes 136
by Factor 137
To determine if the factors of disease status, sex, study, and smoking status had an 138
impact on gene expression in COPD, we modeled (see linear model below) our merged 139
expression matrix (DF2 of online supplementary data files) and then ran ANOVA to 140
identify differentially expressed genes (Fig 1C) using aov and anova from base R’s 141
June 14, 2019 5/26bioRxiv preprint first posted online Jun. 14, 2019; doi: http://dx.doi.org/10.1101/671206. The copyright holder for this preprint
(which was not peer-reviewed) is the author/funder, who has granted bioRxiv a license to display the preprint in perpetuity.
It is made available under a CC-BY 4.0 International license.
stats package (as previously described [18]). Schematically our linear model formula 142
for gene expression, g, per each gene included main effects and interactions: 143
X X
g∼ xi + xi : xj (1)
i i,j;j>i
where xi ∈ {age group, sex, smoker, disease status} and the factors have the following 144
levels: 145
• disease status = {control, COPD} 146
• sex = {male, female} 147
• age group = {under 50, 50-55, 55-60, 60-70, over 70} 148
• smoker = {non-smoker, former smoker, smoker} 149
• study = {GSE42057, GSE47415, GSE54837, GSE71220, GSE87072, 150
E-MTAB-5278, E-MTAB-5279} 151
ANOVA p-values were adjusted using the Benjamini-Hochberg (BH) correction method 152
for multiple hypothesis testing [41–43]. Genes were considered statistically significant if 153
their BH-adjusted p-values werebioRxiv preprint first posted online Jun. 14, 2019; doi: http://dx.doi.org/10.1101/671206. The copyright holder for this preprint
(which was not peer-reviewed) is the author/funder, who has granted bioRxiv a license to display the preprint in perpetuity.
It is made available under a CC-BY 4.0 International license.
Results 184
Our meta-analysis selection criteria for data curation (Fig 1B) resulted in 8 datasets 185
from GEO and AE (Table 1). After pre-processing the data, we combined all datasets 186
into a large matrix by merging by common gene names. This data merge resulted in 187
1,262 samples (574 controls and 688 COPD subjects) and 16,237 genes. Our 1,262 188
samples consists of 792 males and 470 females, and also 661 former smokers, 418 current 189
smokers and 183 non-smokers. 190
Visualizing Batch Effects and Batch Effect Correction 191
Prior to designing our linear model, we wanted to visualize variation introduced into the 192
data due to batch effects, and how the variation changes when the data is adjusted with 193
ComBat for batch effects. We used ComBat in R to adjust for the study effect on the 194
data and generated PCA plots before and after batch correction (Fig 2). In Fig 2A, 195
before running ComBat, the data separates into four major clusters with a variance of 196
49.9% in PC1 and 15.7% in PC2. After running ComBat, the clustering of the data is 197
removed, and variance reduced to 17.7% in PC1 and 4.4% in PC2 (Fig 2B). We also 198
plotted the PCAs for the other factors (S1 Fig) before and after using ComBat for 199
batch effect correction. The ComBat batch effect corrected expression data was only 200
used to visualize changes in variation due to removal of batch and to confirm the 201
inclusion of study as an effect factor in our linear model. 202
Fig 2. Visualizing batch effects introduced by using multiple studies in our
meta-analysis. (A) PCA before and (B) PCA after batch effect correction with
ComBat.
Variance in Gene Expression Due to Disease Status 203
With our ANOVA results, we were able to evaluate variance in gene expression 204
introduced by each factor and their pair-wise interactions [43]. To determine which 205
genes from our ANOVA results were statistically significant by the disease status factor, 206
we filtered the genes by using BH-adjusted p-valuebioRxiv preprint first posted online Jun. 14, 2019; doi: http://dx.doi.org/10.1101/671206. The copyright holder for this preprint
(which was not peer-reviewed) is the author/funder, who has granted bioRxiv a license to display the preprint in perpetuity.
It is made available under a CC-BY 4.0 International license.
immunodeficiency (11 gene hits), lysosome (22 gene hits), and cytokine-cytokine 215
receptor interaction (35 gene hits) (Table 3 and DF5 of online supplementary data files). 216
The 1,513 genes are involved in Reactome pathways such as Neutrophil degranulation 217
(103 gene hits), Eukaryotic Translation Elongation (31 gene hits), Signaling by 218
Interleukins (66 gene hits) Diseases of Immune System (8 gene hits) Fc epsilon receptor 219
(FCERI) signaling (24 gene hits) and Signaling by the B Cell Receptor (BCR) (21 gene 220
hits) (see DF6 of online supplementary data files for full table). We also used the 221
KEGGPathwayVisual function in the MathIOmica package to highlight whether our gene 222
hits for the enriched KEGG pathways were up- or down- regulated in the pathway 223
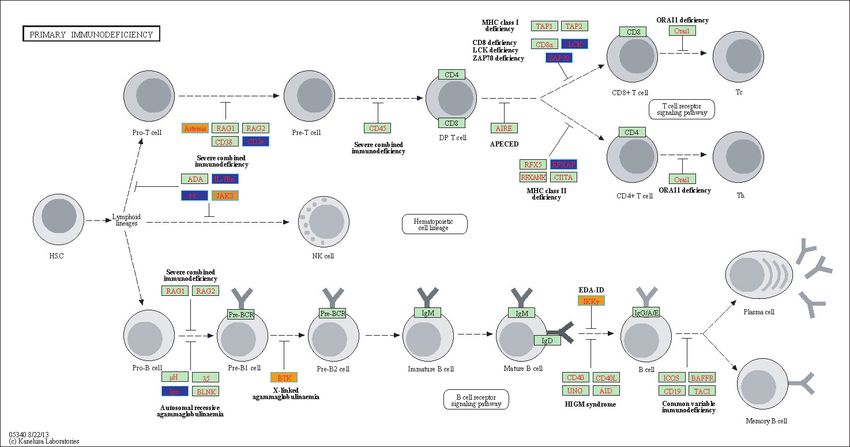
(based on TukeyHSD calculated differences in means), Fig 3 and S2-S7 Fig. For example, 224
Fig 3 depicts the Primary Immunodeficiency KEGG pathway and highlights our gene 225
hits (with yellow: up-regulated, and blue: down-regulated gene expression). In this 226
pathway, Fig 3, our results indicate that Igα is down-regulated in COPD compared to 227
controls (involved in differentiating from a Pro-B Cell to a Pre-B cell 1), and also BTK9 228
is up-regulated in COPD (involved in differentiating from Pre-B1 cell to Pre-B2 cell), . 229
Of the 1,513 disease genes we further filtered our ANOVA results (see DF4 of online 230
supplementary data files) to identify genes with statistically significant interactions with 231
smoking status (disease:smoking status, BH-adjusted p-value < 0.05). We found 39 232
genes that had a statistically significant pairwise interaction between disease status and 233
smoking status (see DF14 of online supplementary data files). Using the 39 interacting 234
genes, we calculated the row means across the different pairings of smoking status and 235
disease status to compare expression (Fig 7). We used the row means of the 236
non-smoking controls as our baseline to calculate the difference in means for the 237
different disease and smoking groups. In Fig 7 the data clusters by disease state (COPD 238
together and controls together), and smokers and former smokers across both disease 239
states have similar expression profiles. There are subset of genes that are over expressed 240
in COPD smokers compared to control non-smokers as well as a subset of genes that are 241
down-regulated. Finally, control smokers and former smokers have similar expression 242
profiles with GGT6 being an outlier (Fig 7). 243
Table 3. Enriched KEGG Pathways using the ANOVA Differentially Expressed Genes from Disease Factor.
KEGG ID KEGG Pathway Name Gene Count p-value adjusted p-value
path:hsa03010 Ribosome 29 5.34E-08 1.50E-05
path:hsa05340 Primary immunodeficiency 11 2.74E-05 3.15E-03
path:hsa04142 Lysosome 22 3.37E-05 3.15E-03
path:hsa04060 Cytokine-cytokine receptor interaction 35 1.64E-04 1.16E-02
path:hsa04520 Adherens junction 14 4.97E-04 2.80E-02
path:hsa05200 Pathways in cancer 45 7.00E-04 3.28E-02
path:hsa04640 Hematopoietic cell lineage 15 9.98E-04 3.88E-02
path:hsa05162 Measles 20 1.10E-03 3.88E-02
Up and Down- Regulated Gene Expression in COPD 244
To assess biological effect and determine factorial differences in gene expression we ran 245
TukeyHSD on our 1,513 statistically significant disease genes. We first focused on 246
COPD and control gene expression differences and used BH-adjusted p-valuebioRxiv preprint first posted online Jun. 14, 2019; doi: http://dx.doi.org/10.1101/671206. The copyright holder for this preprint
(which was not peer-reviewed) is the author/funder, who has granted bioRxiv a license to display the preprint in perpetuity.
It is made available under a CC-BY 4.0 International license.
Fig 3. Highlighted Primary Immunodeficiency KEGG Pathway (hsa05340)
with enriched genes from the ANOVA (BH-adjusted p-value <
0.05) [46–48]. Yellow-colored genes are up-regulated and blue-colored genes are
down-regulated in COPD samples.
Fig 4. Highlighted Cytokine-cytokine receptor interaction KEGG Pathway
(hsa04060) with enriched genes from the ANOVA (BH-adjusted p-value <
0.05) [46–48]. Yellow-colored genes are up-regulated and blue-colored genes are
down-regulated in COPD samples.
(mean differences ' 0.0338) in our COPD subjects. Of the 304 differentially expressed 253
genes (DEG), 152 genes were down-regulated and 152 genes were up-regulated (DF9 of 254
online supplementary data files). The top 25 up- and down- regulated genes are 255
June 14, 2019 9/26bioRxiv preprint first posted online Jun. 14, 2019; doi: http://dx.doi.org/10.1101/671206. The copyright holder for this preprint
(which was not peer-reviewed) is the author/funder, who has granted bioRxiv a license to display the preprint in perpetuity.
It is made available under a CC-BY 4.0 International license.
displayed in Table 4. KEGG enrichment analysis on the 152 down-regulated disease 256
genes resulted in two significantly enriched pathways: Hematopoietic cell lineage (5 257
Gene hits: CD2, CD3E, CD7, FLT3LG and MS4A1) and Cytokine-cytokine receptor 258
interaction (8 gene hits:CCL5, CCR6, CD27, CXCR3, CXCR6, FLT3LG, IL2RB, and 259
IL2RG). For the Reactome enrichment analysis on 152 up-regulated genes, they were 260
enriched in Neutrophil degranulation (30 gene hits) Fig 5, while the down-regulated 261
gens were enriched in the Immunoregulatory interactions between a Lymphoid and a 262
non-Lymphoid cell pathway (8 gene hits) (Fig 6). 263
Table 4. Top 25 up and down regulated differentially expressed genes in
COPD based on effect size.
Up-Regulated Down-Regulated
Gene Difference of Means Gene Difference of Means
GPR15 0.123 LBH -0.032
HK3 0.046 CD3E -0.039
CLEC4D 0.075 DUSP7 -0.030
F5 0.050 TCF7 -0.031
DOCK4 0.063 RRAS2 -0.045
GPR55 0.045 ST6GAL1 -0.029
STAB1 0.043 PYHIN1 -0.042
ASGR2 0.046 CCNK -0.026
ARG1 0.087 CD79A -0.053
MPO 0.063 GORASP2 -0.028
NRG1 0.064 IL2RG -0.029
HP 0.086 LRIG1 -0.028
PLD1 0.037 PURA -0.027
CLEC4E 0.041 LPAR5 -0.033
PLSCR1 0.048 FAM102A -0.030
FCGR1B 0.051 UCP2 -0.027
FKBP5 0.035 SPON1 -0.035
ANG 0.042 B3GNT7 -0.042
DSC2 0.063 CAMK2N1 -0.040
OSBPL1A 0.035 DENND2D -0.027
TLR5 0.040 IGFBP4 -0.036
FLVCR2 0.035 IL2RB -0.036
NLRC4 0.037 CD74 -0.031
AHRR 0.063 CBLB -0.031
CAPNS2 0.043 DCXR -0.037
Sex and Age on COPD Expression 264
We further analyzed the 304 DEG found to have a biological effect by disease status to 265
identify sex and aging effects on gene expression. We found 44 genes that were 266
differentially expressed by sex: 22 up- and 22 down-regulated in males compared to 267
females by filtering the mean differences using two-tailed 10% quantiles, / -0.0957 268
(down-regulated) and ' 0.0908 (up-regulated). With the 44 genes we performed 269
pathway enrichment analysis using the ReactomePA package. There were 7 enriched 270
Reactome pathways (BH-corrected p-valuebioRxiv preprint first posted online Jun. 14, 2019; doi: http://dx.doi.org/10.1101/671206. The copyright holder for this preprint
(which was not peer-reviewed) is the author/funder, who has granted bioRxiv a license to display the preprint in perpetuity.
It is made available under a CC-BY 4.0 International license.
CLEC4D LTF
HK3
VNN1
CRISP3
MCEMP1
TNFAIP6
MMP8 RNASE3
MPO
MMP9 SLPI Difference in Means
CEACAM6
(COPD-control)
0.08
0.07
MS4A3 0.06
Neutrophil degranulation
0.05
CLEC5A TCN1
0.04
CEACAM8
size
30
CR1
SERPINB10
ABCA13
ARG1
PLD1 GPR84 OLR1
CAMP
FCAR
ELANE
DEFA4
CTSG
HP
Fig 5. Enriched Reactome pathway-gene network from up-regulated
disease genes in COPD subjects. The enrichment analysis was based on the 304
statistically significant differentially expressed genes filtered for effect size.
generated a gene network for the up-regulated enriched pathways in males (S9 Fig). We 276
did not find any statistically significant interacting genes between disease status and sex 277
from our ANOVA results. 278
To determine the age effect on our DEG associated with COPD (304 genes), we 279
focused on our TukeyHSD results where the age groupbioRxiv preprint first posted online Jun. 14, 2019; doi: http://dx.doi.org/10.1101/671206. The copyright holder for this preprint
(which was not peer-reviewed) is the author/funder, who has granted bioRxiv a license to display the preprint in perpetuity.
It is made available under a CC-BY 4.0 International license.
ICAM2
CD3E
KLRG1
Difference in Means
(COPD-control)
−0.030
KLRB1 −0.035
Immunoregulatory interactions between a Lymphoid and a non−Lymphoid cell
−0.040
SLAMF6
size
8
CD96
SH2D1B
CD81
Fig 6. Enriched Reactome pathway-gene network from down-regulated
disease genes in COPD subjects. The enrichment analysis was based on the 304
statistically significant differentially expressed genes filtered for effect size.
Furthermore, we decided to carry out a 10-fold cross-validation analysis of randomized 297
order samples, where we trained on 90% of the data each time and tested on the 298
remaining 10%. On average the model had an accuracy of 84.2% (standard deviation of 299
3.1%), and ROC AUC of 0.921 (standard deviation of 0.022). An example of the worst 300
performing realization from the cross-validation is shown in Fig. 9D-F, where 48/57 301
controls and 42/69 COPD samples were classified correctly, whereas 9/57 controls were 302
mis-classified as COPD, and 17/69 COPD were misclassified as controls. Equivalently, 303
the false positive rates were on average 0.17 (control) and 0.14 (COPD), and the false 304
discovery rates were on average 0.19 (control) and 0.12 (COPD). 305
Discussion 306
Chronic obstructive pulmonary disease causes damage to the lungs because of exposure 307
to toxic irritants or genetic factors, and is a rising global health problem. With an 308
increase in the elderly population’s life expectancy and the number of smokers, the 309
prevalence of COPD and its morbidity rates are expected to rise. Researchers are 310
working to identify strategies that can help to clearly understand COPD, its pathology, 311
and to find biomarkers in easily accessible body fluids to promote earlier detection of 312
COPD and improve accuracy of diagnosis [15–17]. Our research objective was to 313
identify age, sex and smoking status effects on gene expression between COPD and 314
controls in blood. We curated and downloaded 7 microarray expression datasets for our 315
meta-analysis on COPD. Using the raw expression data, we removed the background, 316
June 14, 2019 12/26bioRxiv preprint first posted online Jun. 14, 2019; doi: http://dx.doi.org/10.1101/671206. The copyright holder for this preprint
(which was not peer-reviewed) is the author/funder, who has granted bioRxiv a license to display the preprint in perpetuity.
It is made available under a CC-BY 4.0 International license.
Difference
in Means
CAPN5 0.4
IGFBP4
AFF3
ZNF667
BEND4
PTGDR
0.2
OSBPL10
SGSM1
FGGY
ERBB2 0
SH2D1B
COLQ
BCL7A
TNFRSF18 −0.2
IL2RB
LAMA2
CELSR1
GPRC5D −0.4
MYO1E
CLIC3
C14orf93
TMED8
ABCB4
STK32B
NTNG2
KANK3
ZNF618
FAM129C
FCRLA
FEZ1
VPREB3
GPM6A
PNOC
GGT6
PTGDS
TMEM136
IL24
MYOM2
POU2AF1
COPD COPD Smoking Control
Smokers Former Smokers Controls Former Smokers
Fig 7. Heatmap of statistically significant interacting genes across disease
states and smoking statuses. Difference in means calculated using control
non-smokers as the baseline.
annotated and summarized the probes, and merged the 7 datasets together by common 317
gene names. This was followed by data normalization using BoxCox power 318
transformation and downstream analyses to identify differentially expressed genes and 319
genes that were biologically significant. This is the largest COPD meta-analysis and 320
explores expression variability in 1,262 samples by modeling linear and binary effects of 321
disease status, age, sex and smoking status. 322
Our ANOVA highlighted 1,513 statistically significant (BH-adjusted p-valuebioRxiv preprint first posted online Jun. 14, 2019; doi: http://dx.doi.org/10.1101/671206. The copyright holder for this preprint
(which was not peer-reviewed) is the author/funder, who has granted bioRxiv a license to display the preprint in perpetuity.
It is made available under a CC-BY 4.0 International license.
AgeGroup
50−55 −bioRxiv preprint first posted online Jun. 14, 2019; doi: http://dx.doi.org/10.1101/671206. The copyright holder for this preprint
(which was not peer-reviewed) is the author/funder, who has granted bioRxiv a license to display the preprint in perpetuity.
It is made available under a CC-BY 4.0 International license.
A. Classifier Information D. Classifier Measurements
Data type NumericalVector(length: 304) Number of test examples 126
Classes control, COPD Accuracy (79.±4.)%
Accuracy (87.0±3.0)% Accuracy baseline (55.±4.)%
Method LogisticRegression Geometric mean of probabilities 0.640 ± 0.027
Single evaluation time 2.76 ms/example Mean cross entropy 0.446 ± 0.042
Batch evaluation speed 75.7 examples/ms Single evaluation time 2.99 ms/example
Loss 0.327 ± 0.052 Batch evaluation speed 30.4 examples/ms
Model memory 246. kB Rejection rate 0%
Training examples used 1262 examples
control
COPD
Training time 3.93 s
Learning curve
control 48 9 57
0.50
actual class
0.45
0.40
COPD 17 52 69
0.35
10 50 100 500 1000
65
61
training examples used predicted class
control
COPD
B. C. ROC curve COPD E. ROC curve Control F. ROC curve COPD
1.0 1.0 1.0
0.8 0.8 0.8
control 523 51 574 0.6 0.6
Recall
0.6
Recall
Recall
actual class
0.4 0.4 0.4
0.2 0.2 0.2
COPD 47 641 688 0.0 0.0
0.0
0.0 0.2 0.4 0.6 0.8 1.0 0.0 0.2 0.4 0.6 0.8 1.0 0.0 0.2 0.4 0.6 0.8 1.0
FalsePositiveRate FalsePositiveRate FalsePositiveRate
570
692
ROC curve
predicted class
No discrimination line
Fig 9. Trained logistic regression model can classify COPD and healthy
profiles. (A)The logistic regression model trained on all the data achieves 87.0±3.0%
accuracy), with the (B) confusion matrix and (C) ROC curves indicating good
performance overall, with AUC 0.979. Training with 10-fold cross validation gives an
average accuracy of 84.2%, with the worst testing model shown in (D) and its ROC for
(E) Controls and (F) COPD shown respectively, with an AUC of 0.882.
DCLRE1C (Artemis) and CD3E are both involved in Pro-T to Pre-T cell differentiation 349
and were up- and down-regulated respectively in COPD subjects (Fig 3). Genes such as 350
LCK ZAP70 and RFXAP are involved in T cell differentiation into CD8+ and CD4+ 351
cells and were found to be down-regulated in COPD (Fig 3). In B-cell differentiation, 352
our gene hits, BTK (B-cell development) and IKBKG (alias IKKγ ) were up-regulated 353
in COPD while Igα was down-regulated (Fig 3). Reduced Igα or deficiencies in Igα 354
promote reoccurring infections and disease exacerbation in COPD subjects [50, 55]. 355
In the highlighted Cytokine-cytokine receptor interaction KEGG pathway there are 356
different classes of cytokines such as chemokines, class I cytokines and the Tumor 357
necrosis factor and Transforming growth factor beta families with varying expression 358
June 14, 2019 15/26bioRxiv preprint first posted online Jun. 14, 2019; doi: http://dx.doi.org/10.1101/671206. The copyright holder for this preprint
(which was not peer-reviewed) is the author/funder, who has granted bioRxiv a license to display the preprint in perpetuity.
It is made available under a CC-BY 4.0 International license.
(Fig 4). Cytokines play a major role in the inflammatory response observed in COPD 359
subjects. For instance, CCR8 (chemokine) was up-regulated in COPD subjects (Fig 4). 360
Increased levels of CCR8 has been previously observed in allergic asthmatics [56] and 361
has a functional role in macrophage processes and release of cytokines in the lungs [57]. 362
We also visualized our up- and down- regulated gene hits in the other enriched 363
KEGG pathways (Table 3 and S2 - S6 Fig). We highlighted our 45 gene hits in the 364
Pathways in Cancer KEGG pathway (S2 Fig). COPD is a known risk factor for lung 365
cancer and it leads to 1% of cancer cases each year [58]. Furthermore, there is a five-fold 366
increase to developing lung cancer in patients with COPD compared to individuals with 367
normal pulmonary function [58]. Some of our highlighted genes are involved in 368
apoptosis (Fas and CASP9), DNA damage (MDM2), Extra-cellular matrix (ECM) 369
receptor interaction (ECM) and proliferation (CyclinD1) (S4 Fig). As for the KEGG 370
Lysosome pathway (S3 Fig), lysosome function and distribution in the cells of COPD 371
subjects and smokers have been previously examined. The lysosomes in smokers have 372
been previously shown to cluster around the nucleus of the cell and with reduced 373
concentrations of lysosomes throughout the cell compared to subjects who did not 374
smoke. Additionally, dysregulation of the lysosomal pathway has also been previously 375
described in COPD patients [59]. 376
We observed some down-regulated genes in the adherens junction pathway for 377
COPD subjects (S4 Fig). This may be connected to the increase in lung epithelial 378
permeability due to smoking. Also, one study highlighted that apical junctional 379
complex (AJC) genes were down-regulated in COPD smokers, and that the cigarette 380
smoke promotes a cancer-like molecular phenotype by causing reprogramming of 381
transcription of the AJC [60]. The hematopoietic cell lineage pathway highlights genes 382
involved in the differentiation of immune cells from hematopoietic stem cells (S5 Fig). 383
As for the enriched measles pathway, research suggests that heavy smokers who had 384
childhood measles has an increased risk for developing COPD [61]. The Reactome 385
pathway analysis also resulted in immune related pathways such as Neutrophil 386
degranulation, Signaling by Interleukins, Diseases of the Immune System and Signaling 387
by the B Cell Receptor which all highlight components of the pathology of COPD (DF6 388
of online supplementary data files). 389
Focusing on the 304 differentially expressed disease genes (filtered for biological 390
effect), some of the top up-regulated genes are GPR15 (found on lymphocytes and 391
involved in trafficking of lymphocytes), HK3 (glucose metabolism), CLEC4D (role in 392
inflammation and immunity) and F5 (blood coagulation factor) [53] (Table 4. As for 393
our top down-regulated genes CD3E (role in T-cell development), DUSP7 (involved in 394
MAPK signaling), TCF7 (role in natural killer cell development), RRAS2 (involved in 395
cell proliferation). We also wanted to compare our gene list to a previously published 396
meta-analysis. Reinhold et al., had a total of 6,243 genes which they grouped into 15 397
modules for each cohort [17]. Out of our 304 genes, 97 of them overlapped with their 398
findings while 207 of our genes were unique. We used BINGO in Cytoscape v.3.7.1 for 399
GO analysis on our 207 unique genes (Fig S9 and S3 File) [62, 63]. Our BINGO results 400
(BH-adjusted p-value < 0.05) include GO terms such as defense response, response to 401
bacterium, response to stress, response to wounding, immune response, cell adhesion, 402
and inflammatory response (Fig S9 and S3 File). 403
In addition to exploring enriched GO terms associated with our 304 disease genes, 404
Fig 5 - 6 highlight the genes that were up-regulated in COPD and were enriched in the 405
Reactome pathways Neutrophil degranulation (Fig 5) (genes up-regulated in COPD), 406
and Immunoregulatory interactions between a Lymphoid and a non−Lymphoid cell 407
pathway (genes up-regulated in COPD). Neutrophil degranulation (release of granules 408
by exocytosis) has been associated with pulmonary disorders including asthma and 409
COPD. In COPD patients’ neutrophils are the highest number of inflammatory cells 410
June 14, 2019 16/26bioRxiv preprint first posted online Jun. 14, 2019; doi: http://dx.doi.org/10.1101/671206. The copyright holder for this preprint
(which was not peer-reviewed) is the author/funder, who has granted bioRxiv a license to display the preprint in perpetuity.
It is made available under a CC-BY 4.0 International license.
present in the bronchial walls [64]. Increase neutrophil degranulation induces tissue 411
damage and this is due to high inflammatory state and constant priming of neutrophils 412
by cytokines and chemokines [64]. Our up-regulated genes in the neutrophil granulation 413
pathway include CEACAM6 (cell adhesion), MMP8 (tissue remodeling and breakdown 414
of extracellular matrix), CLEC4D (cell-adhesion, cell signaling and inflammation), LTF 415
(granules in neutrophils), MS4A3 (signal transduction), and DEFA4 (defense 416
antimicrobial peptides). Immunoregulatory interactions between a Lymphoid and a 417
non−Lymphoid cell pathway down-regulated genes include KLRB1 and KLRG1 (role in 418
the regulation of natural killer cell function), CD3E (involved in adaptive immune 419
response), ICAM2 (leukocyte adhesion and recirculation), SLAMF6 (natural killer cell 420
activation) and CD81 and CD96 (role in adaptive immunity) [53]. 421
To assess the effect of smoking status on gene expression, we focused on the 422
biologically significant genes with a significant interaction between disease status and 423
smoking status. We identified 39 disease genes that significantly interacted with 424
smoking status (Fig 7). The baseline in Fig 7 was non-smoking controls. For the two 425
control groups: current and former smokers, they both have elevated gene expression 426
levels compared to non-smoking controls. This indicates changes due solely to smoking 427
with moderate differences between former and current smokers. As for the COPD 428
smokers and non-smokers, the majority of these genes are elevated compared to 429
non-smoking controls with GGT6, PTGDS, TMEM136, IL24, MYOM2 and POU2AF1 430
being down-regulated in COPD compared to healthy non-smokers. Some of these genes 431
have been associated with lung function and disorders such as GCT6 which plays a role 432
in gluthathione homeostasis and lung airspace epithelial barrier [65], IL-24 can induce 433
apoptosis and helps control cancer cells [66] and POU2AF1 is a regulator of host 434
defenses but cigarette smoke suppresses its gene expression [67] (Fig 7). In our analysis 435
there was only 1 COPD non-smoker which was excluded from this analysis. 436
As for sex specific effects on gene expression, we identified 44 of the 304 disease 437
genes to have a sex effect. The enriched pathways from using the genes that were 438
up-regulated in males are highlighted in S7 Fig. These genes are involved in Reactome 439
pathways such as Neutrophil degranulation, Extracellular matrix organization, Collagen 440
degradation, Degradation of the extracellular matrix, and antimicrobial peptides (S7 441
Fig). Neutrophil degranulation was discussed above as being up-regulated by disease 442
status in COPD subjects compared to controls. In COPD, the extracellular matrix of 443
the airway and parenchyma of the lungs are restructured [68, 69]. Previous findings 444
observed altered expression of elastin and collagen in COPD compared to controls, and 445
the stage/severity of COPD affected extracellular matrix remodeling [68, 69]. Studies on 446
COPD and sex, previously suggested higher prevalence in males due to them having 447
higher smoking rates [70, 71]. However, currently with larger numbers of women 448
smoking the prevalence of COPD in women is on the rise. Studies have shown that 449
women are 50% more susceptible to COPD than males and why this is the case is still 450
an on going debate [70, 71]. Some reasons include, smaller airways so larger 451
concentrations of tobacco smoke in the lungs and hormonal effects [70, 71]. Of the 44 452
genes with a sex effect, we did not find any genes with a significant interaction between 453
disease status and sex. 454
Aging trends were visualized on the biologically significant disease genes. 95 genes 455
showed significant aging trends compared to our baseline (bioRxiv preprint first posted online Jun. 14, 2019; doi: http://dx.doi.org/10.1101/671206. The copyright holder for this preprint
(which was not peer-reviewed) is the author/funder, who has granted bioRxiv a license to display the preprint in perpetuity.
It is made available under a CC-BY 4.0 International license.
which has previously been described above as being up-regulated in COPD subjects. 463
Genes within group 2 displayed an opposite trend with most genes being down-regulated 464
with increasing age (Fig 8). These genes did not result in any statistically significant 465
enrichment. However, genes in group 2 include C11orf74 (involved in transcription 466
regulation) [53], CD163 (previously found to be over expressed in lungs of individuals 467
with severe COPD) [73], TCF7 (natural killer and lymphoid cell development) [53], 468
CYP1B1 (previously shown to be up-regulated in COPD and smokers) [74] and SASH1 469
(involved in TLR4 signaling and can promote cytokine production) [53]. In addition to 470
this, we did not find any significant interacting genes between disease status and age. 471
To test the possibility of using blood expression data from micro-arrays to predict 472
disease status, we performed machine learning with a logistic regression model using the 473
304 disease genes. This resulted in an average accuracy of 84.2% (Fig 9). These results 474
are promising despite using aggregate expression versus cell-type specific expression. 475
Previous studies explored using computed tomography (CT) images COPD patients and 476
controls for disease classification [75]. Some studies also used patient reported data 477
(such as heart rate, respiratory rate) to predict disease exacerbation and resulted in an 478
ROC of 0.87 [76] and another with 70% sensitivity and 71% specificity [77]. 479
Conducting a meta-analysis with microarray expression data limits our findings to 480
annotated genes, and hinders us from discovering novel genes and looking at the entire 481
transcriptome. Additionally, using publicly available data limits us to specific factors we 482
can explore in our analysis due to subject characteristics not being reported uniformly 483
across datasets (see S1 File). For example, all studies did not report ethnicity and 484
therefore we could not investigate the effect of ethnicity on gene expression in COPD. 485
This would be a good factor to explore due to over 90% of COPD cases occurring in 486
low-middle class communities [5, 10]. We also did not have consistently reported disease 487
severity information to factor into our analysis and findings. Our selection criteria for 488
the publicly available data limits our sample size (Fig 1). In addition to this, the 489
limitations of available data resulted in unbalance in sample constitution: 1,262 samples 490
with 574 controls and 688 COPD, of which 792 are males and 470 females, and have 491
smoking status as 183 non-smokers, 418 smokers, and 661 former smokers. As for our 492
machine learning algorithm, despite having a good predictive power and accuracy, we 493
could not explore cell-type specific data. Furthermore, the observed confounding 494
between studies suggests that samples would need to be analysed together with the 495
current sample sets in new investigations, prior to prediction of status. 496
Our study highlights new gene candidates by factor (disease status, age, sex and 497
smoking status) and genes that statistically interact between disease status and smoking 498
status that can be studied further to understand their role in COPD. Future work to 499
expand on our findings must include the use of cell-type specific expression data and 500
RNA-sequencing data. Due to COPD being characterized by inflammation, increased 501
macrophages and neutrophils and their release of cytokines, looking at cell-type specific 502
data can give more insight on pathology of COPD. Using cell-type specific data for 503
predicting disease states will also expand on our findings. RNA-sequencing data can 504
introduce novel gene candidates and biomarkers for COPD. Furthermore, implementing 505
proteomics and metabolomics can help characterize disease pathology and may lead to 506
discovery of additional signatures for early detection of COPD using a systems biology 507
approach. 508
Data Availability 509
Online Supplementary Data files. All of our datasets, data files and results from our 510
COPD meta-analysis have been deposited to FigShare. The file names begin with the 511
prefix “DF” and are referred to throughout the manuscript. To access our supplemental 512
June 14, 2019 18/26bioRxiv preprint first posted online Jun. 14, 2019; doi: http://dx.doi.org/10.1101/671206. The copyright holder for this preprint
(which was not peer-reviewed) is the author/funder, who has granted bioRxiv a license to display the preprint in perpetuity.
It is made available under a CC-BY 4.0 International license.
data files access the FigShare online repository at: 513
https://doi.org/10.6084/m9.figshare.8233175. Datasets used in the meta-analysis are 514
available from Gene Expression Omnibus and Array Express, and their accessions are 515
listed in Table 1. 516
Supporting information 517
S1 Fig. Principal Component Analysis to visualize changes in variation in 518
datasets before and after combat. (A) PCA using disease state as batch before 519
ComBat, (B) PCA on disease state after ComBat, (C) PCA using sex as batch before 520
ComBat (D) PCA on sex after ComBat (E) PCA using smoking status as batch (F) 521
PCA on smoking status after ComBat. 522
S2 Fig. Highlighted Pathways in Cancer KEGG Pathway with enriched 523
genes from the ANOVA (BH-adjusted p-value < 0.05; disease status 524
factor) [46–48]. This figure highlights the relative expression (difference in means) of 525
the gene hits from our data on the Pathways in Cancer pathway. Genes colored in 526
yellow are up-regulated and blue-colored genes are down-regulated in COPD. The 527
enriched genes are from the ANOVA statistically significant disease status gene list 528
(BH-adjusted p-value < 0.05, disease status factor). Our TukeyHSD (used to determine 529
up- or down- regulation of genes) results are with our online data files (DF16 of online 530
supplementary data files). 531
S3 Fig. Highlighted Lysosome KEGG Pathway with enriched genes from 532
the ANOVA (BH-adjusted p-value < 0.05; disease status factor). This 533
figure highlights the relative expression (difference in means) of the gene hits from our 534
data on the Lysosome pathway. Genes colored in yellow are up-regulated and 535
blue-colored genes are down-regulated in COPD. Our TukeyHSD (used to determine up- 536
or down- regulation of genes) results are with our online data files (DF17 of online 537
supplementary data files). 538
S4 Fig. Highlighted Adherens KEGG Pathway with enriched genes from 539
the ANOVA (BH-adjusted p-value < 0.05; disease status factor) [46–48]. 540
This figure highlights the relative expression (difference in means) of the gene hits from 541
our data on the Adherens pathway. Genes colored in yellow are up-regulated and 542
blue-colored genes are down-regulated in COPD. Our TukeyHSD (used to determine up- 543
or down- regulation of genes) results are with our online data files (DF18 of online 544
supplementary data files). 545
S5 Fig. Highlighted Hematopoietic Cell Lineage KEGG pathway with 546
enriched genes from the ANOVA (BH-adjusted p-value < 0.05; disease 547
status factor) [46–48]. This figure highlights the relative expression (difference in 548
means) of the gene hits from our data on the Hematopoietic Cell Lineage pathway 549
Genes colored in yellow are up-regulated and blue-colored genes are down-regulated in 550
COPD. Our TukeyHSD (used to determine up- or down- regulation of genes) results are 551
with our online data files (DF20 of online supplementary data files). 552
S6 Fig. Highlighted Measles KEGG pathway with enriched genes from 553
the ANOVA (BH-adjusted p-value < 0.05; disease status factor) [46–48]. 554
This figure highlights the relative expression (difference in means) of the gene hits from 555
our data on the Measles pathway. Genes colored in yellow are up-regulated and 556
June 14, 2019 19/26bioRxiv preprint first posted online Jun. 14, 2019; doi: http://dx.doi.org/10.1101/671206. The copyright holder for this preprint
(which was not peer-reviewed) is the author/funder, who has granted bioRxiv a license to display the preprint in perpetuity.
It is made available under a CC-BY 4.0 International license.
blue-colored genes are down-regulated in COPD. Our TukeyHSD (used to determine up- 557
or down- regulation of genes) results are with our online data files (DF21 of online 558
supplementary data files). 559
S7 Fig. Enriched Reactome pathway-gene network using the differentially 560
expressed disease genes with a sex effect (no significant interaction 561
between sex and disease) that were up-regulated in males). The gene list used 562
and the pathway results can be found in DF11-12 of online supplementary data files. 563
S8 Fig. Gene ontology results from BINGO using our 207 unique 564
statistically significant disease genes filtered for biological effect. Our 304 565
biologically significant genes were compared to Reinhold et al., [17] We ran GO with 566
BINGO on 207 of our unique genes. The node size relates to number of genes, and the 567
yellow nodes are statistically significant with a BH-adjusted p-valuebioRxiv preprint first posted online Jun. 14, 2019; doi: http://dx.doi.org/10.1101/671206. The copyright holder for this preprint
(which was not peer-reviewed) is the author/funder, who has granted bioRxiv a license to display the preprint in perpetuity.
It is made available under a CC-BY 4.0 International license.
6. Centers for Disease Control and Prevention. Chronic Obstructive Pulmonary
Disease (COPD); 2019, (Accessed: 2019-06-02). Available from:
https://www.cdc.gov/copd/basics-about.html.
7. Mirza S, Clay RD, Koslow MA, Scanlon PD. COPD Guidelines: A Review of the
2018 GOLD Report. Mayo Clinic Proceedings. 2018;93(10):1488 – 1502.
doi:https://doi.org/10.1016/j.mayocp.2018.05.026.
8. Barnes PJ SECBVJWJWE Burney PGJ. Chronic obstructive pulmonary disease.
Nature Reviews Disease Primers. 2015;1. doi:10.1038/nrdp.2015.76.
9. Rabe KF WH. Chronic obstructive pulmonary disease. The lancet.
2017;389:1931–1940. doi:10.1016/S0140-6736(17)31222-9.
10. Quaderi S, Hurst J. The unmet global burden of COPD. Global health,
epidemiology and genomics. 2018;3. doi:10.1017/gheg.2018.1.
11. Saetta M, Di Stefano A, Maestrelli P, Ferraresso A, Drigo R, Potena A, et al.
Activated T-lymphocytes and macrophages in bronchial mucosa of subjects with
chronic bronchitis. American review of respiratory disease. 1993;147:301–301.
12. Laniado-Laborı́n R. Smoking and chronic obstructive pulmonary disease (COPD).
Parallel epidemics of the 21st century. International journal of environmental
research and public health. 2009;6(1):209–224.
13. Agusti A, MacNee W, Donaldson K, Cosio M. Hypothesis: does COPD have an
autoimmune component?; 2003.
14. Rutgers SR, Postma DS, ten Hacken NH, Kauffman HF, van der Mark TW,
Koëter GH, et al. Ongoing airway inflammation in patients with COPD who do
not currently smoke. Thorax. 2000;55(1):12–18. doi:10.1136/thorax.55.1.12.
15. Bahr TM, Hughes GJ, Armstrong M, Reisdorph R, Coldren CD, Edwards MG,
et al. Peripheral blood mononuclear cell gene expression in chronic obstructive
pulmonary disease. American journal of respiratory cell and molecular biology.
2013;49(2):316–323. doi:10.1165/rcmb.2012-0230OC.
16. Chang Y, Glass K, Liu YY, Silverman EK, Crapo JD, Tal-Singer R, et al. COPD
subtypes identified by network-based clustering of blood gene expression.
Genomics. 2016;107(2-3):51–58. doi:10.1016/j.ygeno.2016.01.004.
17. Reinhold D, Morrow JD, Jacobson S, Hu J, Ringel B, Seibold MA, et al.
Meta-analysis of peripheral blood gene expression modules for COPD phenotypes.
PloS one. 2017;12(10):e0185682. doi:10.1371/journal.pone.0185682.
18. Brooks LR, Mias GI. Data-Driven Analysis of Age, Sex, and Tissue Effects on
Gene Expression Variability in Alzheimer’s Disease. Frontiers in Neuroscience.
2019;13:392. doi:10.3389/fnins.2019.00392.
19. Edgar R, Domrachev M, Lash AE. Gene Expression Omnibus: NCBI gene
expression and hybridization array data repository. Nucleic Acids Res.
2002;30(1):207–10. doi:10.1093/nar/30.1.207.
20. Brazma A, Parkinson H, Sarkans U, Shojatalab M, Vilo J, Abeygunawardena N,
et al. ArrayExpress—a public repository for microarray gene expression data at
the EBI. Nucleic acids research. 2003;31(1):68–71. doi:10.1093/nar/gkg091.
June 14, 2019 21/26bioRxiv preprint first posted online Jun. 14, 2019; doi: http://dx.doi.org/10.1101/671206. The copyright holder for this preprint
(which was not peer-reviewed) is the author/funder, who has granted bioRxiv a license to display the preprint in perpetuity.
It is made available under a CC-BY 4.0 International license.
21. Bahr TM, Hughes GJ, Armstrong M, Reisdorph R, Coldren CD, Edwards MG,
et al. Peripheral blood mononuclear cell gene expression in chronic obstructive
pulmonary disease. American journal of respiratory cell and molecular biology.
2013;49(2):316–323. doi:10.1165/rcmb.2012-0230OC.
22. Fishbane N, Nie Y, Chen V, Hollander Z, Tebbutt SJ, Bossé Y, et al. The effect
of statins on blood gene expression in COPD. PloS one. 2015;10(10):e0140022.
doi:10.1371/journal.pone.0140022.
23. Singh D, Fox SM, Tal-Singer R, Bates S, Riley JH, Celli B. Altered gene
expression in blood and sputum in COPD frequent exacerbators in the ECLIPSE
cohort. PloS one. 2014;9(9):e107381. doi:10.1371/journal.pone.0107381.
24. Martin F, Talikka M, Hoeng J, Peitsch M. Identification of gene expression
signature for cigarette smoke exposure response—from man to mouse. Human &
experimental toxicology. 2015;34(12):1200–1211. doi:10.1177/0960327115600364.
25. Arimilli S, Madahian B, Chen P, Marano K, Prasad G. Gene expression profiles
associated with cigarette smoking and moist snuff consumption. BMC genomics.
2017;18(1):156. doi:10.1186/s12864-017-3565-1.
26. Paul S, Amundson SA. Differential effect of active smoking on gene expression in
male and female smokers. Journal of carcinogenesis & mutagenesis. 2014;5.
doi:10.4172/2157-2518.1000198.
27. Mias G. Chapter 4: Databases: E-Utilities and UCSC Genome Browser. In:
Mathematica for Bioinformatics: A Wolfram Language Approach to Omics.
Cham: Springer International Publishing; 2018. p. 133–170.
28. Paul S, Amundson SA. Gene expression signatures of radiation exposure in
peripheral white blood cells of smokers and non-smokers. International journal of
radiation biology. 2011;87(8):791–801. doi:10.3109/09553002.2011.568574.
29. Wolfram Research, Inc . Mathematica; 2017. Available from:
http://www.wolfram.com/mathematica/.
30. R Core Team. R: A Language and Environment for Statistical Computing; 2018.
Available from: https://www.R-project.org/.
31. Gautier L, Cope L, Bolstad BM, Irizarry RA. affy—analysis of Affymetrix
GeneChip data at the probe level. Bioinformatics. 2004;20(3):307–315.
doi:10.1093/bioinformatics/btg405.
32. Carvalho BS, Irizarry RA. A framework for oligonucleotide microarray
preprocessing. Bioinformatics. 2010;26(19):2363–2367.
doi:10.1093/bioinformatics/btq431.
33. MacDonald JW. affycoretools: Functions useful for those doing repetitive
analyses with Affymetrix GeneChips; 2018, (Accessed: 2019-03-30). Available
from: https://www.bioconductor.org/packages/release/bioc/html/
affycoretools.html/.
34. Ritchie ME, Phipson B, Wu D, Hu Y, Law CW, Shi W, et al. limma powers
differential expression analyses for RNA-sequencing and microarray studies.
Nucleic acids research. 2015;43(7):e47–e47. doi:10.1093/nar/gkv007.
June 14, 2019 22/26You can also read