The sensitivity of the El Niño-Southern Oscillation to volcanic aerosol spatial distribution in the MPI Grand Ensemble
←
→
Page content transcription
If your browser does not render page correctly, please read the page content below
Research article
Earth Syst. Dynam., 12, 975–996, 2021
https://doi.org/10.5194/esd-12-975-2021
© Author(s) 2021. This work is distributed under
the Creative Commons Attribution 4.0 License.

           The sensitivity of the El Niño–Southern Oscillation to
           volcanic aerosol spatial distribution in the MPI Grand
                                  Ensemble
                            Benjamin Ward1,a , Francesco S. R. Pausata1 , and Nicola Maher2,3,4
           1 Department  of Earth and Atmospheric Sciences, University of Quebec in Montreal, Montreal, Canada
                                  2 Max Planck Institute for Meteorology, Hamburg, Germany
         3 Cooperative Institute for Research in Environmental Sciences (CIRES), University of Colorado at Boulder,

                                                       Boulder, CO, USA
               4 Department of Atmospheric and Oceanic Sciences (ATOC), University of Colorado at Boulder,

                                                       Boulder, CO, USA
              a now at: Department of Atmospheric and Oceanic Sciences, McGill University, Montreal, Canada

              Correspondence: Benjamin Ward (benjamin.ward@mcgill.mail.ca) and Francesco S. R. Pausata
                                                 (pausata.francesco@uqam.ca)
                                    Received: 7 August 2020 – Discussion started: 19 August 2020
                          Revised: 30 July 2021 – Accepted: 5 August 2021 – Published: 17 September 2021

       Abstract. Using the Max Planck Institute Grand Ensemble (MPI-GE) with 200 members for the historical
       simulation (1850–2005), we investigate the impact of the spatial distribution of volcanic aerosols on the El
       Niño–Southern Oscillation (ENSO) response. In particular, we select three eruptions (El Chichón, Agung and
       Pinatubo) in which the aerosol is respectively confined to the Northern Hemisphere, the Southern Hemisphere
       or equally distributed across the Equator. Our results show that relative ENSO anomalies start at the end of the
       year of the eruption and peak in the following one. We especially found that when the aerosol is located in the
       Northern Hemisphere or is symmetrically distributed, relative El Niño-like anomalies develop, while aerosol
       distribution confined to the Southern Hemisphere leads to a relative La Niña-like anomaly. Our results point to
       the volcanically induced displacement of the Intertropical Convergence Zone (ITCZ) as a key mechanism that
       drives the ENSO response, while suggesting that the other mechanisms (the ocean dynamical thermostat and the
       cooling of tropical northern Africa or the Maritime Continent) commonly invoked to explain the post-eruption
       ENSO response may be less important in our model.

1   Introduction                                                   Timmreck, 2012). For intense and sulfur-rich volcanic erup-
                                                                   tions, the net effect is a general cooling of the surface and
Aerosol particles from volcanic eruptions are one of the most      a warming in the stratosphere where the aerosols tend to re-
important non-anthropogenic radiative forcings that have in-       side longer (Harshvardhan, 1979; Rampino and Self, 1984).
fluenced the climate system in the past centuries (Robock,         The maximum global cooling seen in modelling studies is
2000). Oxidized sulfur gases (mainly in form of SO2 ) in-          generally reached within 6–8 months following the eruption
jected into the stratosphere by large Plinian eruptions form       peak in optical depth before returning to normal values af-
sulfate aerosols (H2 SO4 ) (Pinto et al., 1989; Pollack et al.,    ter about 3 to 4 years (Thompson et al., 2009). These rapid
1976) that have a time residence of 1–3 years (Barnes and          modifications in temperature may induce dynamical changes
Hofmann, 1997; Robock and Liu, 1994). These particles both         in the atmosphere and in the ocean, including a strengthen-
scatter and absorb incoming solar radiation as well as part        ing of the polar vortex (e.g. Christiansen, 2008; Driscoll et
of the outgoing longwave radiation (Stenchikov et al., 1998;       al., 2012; Kodera, 1994; Stenchikov et al., 2006), a weak-

Published by Copernicus Publications on behalf of the European Geosciences Union.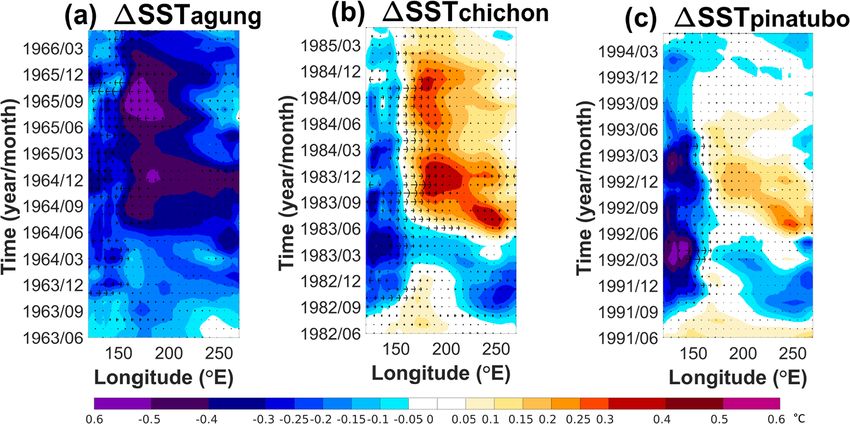
976                                                        B. Ward et al.: ENSO response to volcanic eruptions in the MPI-GE

ening in the African and Indian Monsoon (e.g. Iles et al.,          winds within the tropics). One of the most frequently used
2013; Man et al., 2014; Paik et al., 2020; Trenberth and Dai,       hypotheses is the “ocean dynamical thermostat” mechanism
2007; Zambri and Robock, 2016), and forced changes in the           (ODT) (Clement et al., 1996), where a preferential cooling
El Niño–Southern Oscillation (ENSO) (e.g. Emile-Geay et             in the western Pacific relative to the eastern Pacific takes
al., 2008; McGregor and Timmermann, 2011; Pausata et al.,           place. Such a differential cooling weakens the zonal SST
2015a, b; Wang et al., 2018)                                        gradient along the equatorial Pacific, which causes a relax-
   Paleoclimate archives and observations from the past cen-        ation of the trade winds, leading to a temporary weakening
turies suggested that large tropical eruptions are usually fol-     of the ocean upwelling in the eastern Pacific. This process
lowed by a warm sea surface temperature (SST) anomaly in            is then amplified by the Bjerknes feedback, yielding an El
the Pacific (e.g. Adams et al., 2003; D’Arrigo et al., 2005;        Niño (Bjerknes, 1969). A related mechanism for the pref-
Li et al., 2013; McGregor et al., 2010; Wilson et al., 2010)        erential El Niño anomalies following volcanic eruptions is
even if there are still uncertainties about the significance of     based on the recharge–discharge theory of ENSO, including
theses results (Dee et al., 2020). In addition, El Niño events      changes in the wind stress curl during the eruption year as
followed in the first or the second winter after the five largest   one of the triggering factors (McGregor and Timmermann,
eruptions of the last 150 years (Krakatau in August 1883,           2011; Stevenson et al. 2017). However, through a set of sensi-
Santa Maria in October 1902, Agung in February 1963, El             tivity experiments, Pausata et al. (2020) have questioned the
Chichón in March 1982 and Pinatubo in June 1991). How-              existence of the ODT mechanism in coupled climate mod-
ever, the Santa Maria, El Chichón and Pinatubo eruptions oc-        els following volcanic eruptions, pointing to the Intertropical
curred after an El Niño event was already developing, mak-          Convergence Zone (ITCZ) displacement and extratropical-
ing it difficult to determine a causal link between ENSO and        to-tropical teleconnections as key mechanisms in affecting
these eruptions (e.g. Self et al., 1997; Nicholls, 1988).           post-eruption ENSO. The ITCZ shift mechanism was origi-
   Moreover, modelling studies initially found divergent re-        nally proposed for the ENSO response to high-latitude erup-
sponses for the ENSO changes after large tropical eruptions         tions (Pausata et al., 2015b; 2016) and then suggested to
(e.g. Ding et al., 2014; McGregor and Timmermann, 2011;             also be at work for tropical asymmetric eruptions (Colose
Stenchikov et al., 2006; Zanchettin et al., 2012). However,         et al., 2016; Stevenson et al., 2016). Trade winds converge
the majority of the studies have pointed to an El Niño-like         towards the ITCZ where their intensity weakens as the air
response following volcanic eruption (for a review of these         circulates in an upward direction, creating the so-called dol-
studies, see McGregor et al., 2020). In particular, the use         drums (areas of windless waters). Consequently, a shift of
of relative sea surface temperature (RSST) or sea surface           the ITCZ affects the position of the doldrums and the in-
height (SSH) instead of SST have helped to disentangle the          tensity of the trade winds over the Equator. In general, the
ENSO response from volcanically induced cooling in the Pa-          ITCZ shifts away from the hemisphere that is cooled (Kang
cific and to highlight the dynamical ENSO response (Khodri          et al., 2008; Schneider et al., 2014). Consequently, for an
et al., 2017; Maher et al., 2015). In this study, the terms El      eruption with aerosol concentrated in the NH, the ITCZ lo-
Niño-like and La Niña-like conditions are used to describe an       cation moves equatorward, weakening the trade winds and
anomalous warming or cooling of the equatorial Pacific rela-        leading to an El Niño-like anomaly via the Bjerknes feedback
tive to a climatology, and the term relative is used to describe    (Bjerknes, 1969). In contrast, the ITCZ moves northward fol-
deviations from the tropical average (20◦ N–20◦ S).                 lowing a larger SH cooling compared to NH, strengthen-
   Although a consensus is emerging, different aerosol spa-         ing the trade winds and triggering La Niña-like anomalies,
tial distributions may give rise to different ENSO responses.       as seen in Colose et al. (2016) and Stevenson et al. (2016).
Stevenson et al. (2016) investigated the impact of North-           Khodri et al. (2017) suggested that the cooling of tropical
ern Hemisphere (NH), Southern Hemisphere (SH) and trop-             Africa following volcanic eruptions may increase the like-
ical volcanic eruptions using the Community Earth System            lihood of an El Niño events through the weakening of the
Model Last Millennium Ensemble (CESM-LME). They con-                West African Monsoon and changes in the Walker circula-
cluded that while NH and tropical eruptions tend to favour El       tion. More specifically, the authors suggest that the reduction
Niño-like conditions, SH eruptions enhance the probability          of the tropical precipitation and tropospheric cooling favours
of La Niña-like events within 1 year following the eruptions.       anomalous atmospheric Rossby and Kelvin waves in autumn
Conversely, Liu et al. (2018), through a millennium simula-         (SON), with a weakening of the trade winds over the west-
tion performed with CESM 1.0, and Zuo et al. (2018), using          ern Pacific, leading to El Niño-like conditions in the year af-
the CESM-LME, both concluded that SH, NH and tropical               ter the eruption. A similar mechanism has been suggested
eruptions all resulted in El Niño-like conditions in the sec-       based on the cooling of the Maritime Continent or southeast-
ond year after the eruption.                                        ern Asia instead of tropical Africa (Eddebbar et al., 2019;
   The mechanisms that trigger a change in the ENSO state           Ohba et al., 2013; Predybaylo et al., 2017). However, there is
following volcanic eruptions are still debated. The centre of       no consensus yet as to which of these proposed mechanisms
the argument is explaining how a volcanic eruption weakens          is the main driver of the ENSO response after large volcanic
or amplifies the trade winds (i.e. constant surface eastward        eruptions.

Earth Syst. Dynam., 12, 975–996, 2021                                                 https://doi.org/10.5194/esd-12-975-2021
B. Ward et al.: ENSO response to volcanic eruptions in the MPI-GE                                                            977

   Modelling studies have investigated the impact of volcanic     played in Appendix A (Figs. A7, A8 and A9). The strato-
eruptions on ENSO using different approaches. Many stud-          spheric aerosols used in this study are prescribed in the his-
ies have used a superposed epoch (SEA) or composite anal-         torical simulations of the model (MPI ESM) from the data
ysis, in which they used a window of a few years before           set of Stenchikov et al. (1998) (Giorgetta et al., 2013). The
the eruption to create a reference to compare with the post-      data set consists of monthly averages of the radiative prop-
eruption period (e.g. Liu et al., 2018; Zuo et al., 2018). The    erties of the aerosols, such as the single-scattering albedo,
significance of the response to volcanic eruptions is then as-    and the aerosols extinction and the asymmetry factor, and
sessed using a Monte Carlo method. However, this statistical      they are based on satellite observations of Pinatubo’s erup-
methodology has some shortcomings as it is not able to fully      tion (Schmidt et al., 2013).
remove the signal of internal variability: ENSO anomalies            We use 200 ensemble members of the historical simula-
can still be seen in the reference period (see, for example,      tions (1850–2005) performed using the Max Plank Institute
Fig. 4 in Liu et al., 2018). Some other studies use a small       for Meteorology Earth System Model 1.1 (MPI-ESM 1.1)
number of ensemble members with volcanic forcing and en-          (Giorgetta et al., 2013) as part of the Max Planck Institute
semble members without volcanic forcing starting from dif-        Grand Ensemble (Maher et al., 2019). Such a large ensem-
ferent initial conditions (e.g. McGregor and Timmermann,          ble also allows us to analyse the ENSO response of indi-
2011; Predybaylo et al., 2017; Sun et al., 2019). However,        vidual eruptions instead of a composite of multiple erup-
when starting the two ensemble sets from different initial        tions as done in some previous studies that used a small
conditions, a large number of ensemble members (equivalent        number of ensembles (e.g. Maher et al., 2015; Stevenson et
to at least 150 years reference period/climatology) is needed     al., 2016; Zuo et al., 2018). All the ensemble members are
to isolate the internal variability of ENSO (Milinski et al.,     initialized from different years of a long preindustrial con-
2020; Wittenberg, 2009). A recent study by Predybaylo et          trol run (2000 years) after it has reached a quasi-stationarity
al. (2020) additionally demonstrates the need for using large     state. The model horizontal resolution is roughly 1.8◦ for the
ensembles to investigate the ENSO response to volcanoes:          atmosphere and 1.5◦ for the ocean with 16 vertical levels
by utilizing 54 100-member ensembles of idealized experi-         for both the atmosphere and the ocean. The MPI-ESM has
ments, they found that the role of the initial ENSO state and     been extensively used to investigate the impacts of volcanic
the decomposition of the response into a deterministic and        eruptions on climate (e.g. Bittner et al., 2016; Illing et al.,
stochastic component is important, especially when high-          2018; Timmreck et al., 2016). Specifically, our model is able
lighting the role of the ODT mechanism. Here, for the first       to reproduce the global cooling of around 0.2 ◦ C following
time, we use a 200-member ensemble taken from the Max             the three eruptions investigated in this study, as well as the
Planck Institute Grand Ensemble (MPI-GE) for the histori-         high-latitude winter warming (locally up to 2 ◦ C) after El
cal simulations (1850–2005) (Maher et al., 2019) to investi-      Chichón and Pinatubo in the first winter after the eruption
gate the ENSO response to hemispherically symmetric and           (see Fig. A18), in agreement with the estimates provided in
asymmetric volcanic eruptions. The large ensemble and the         the literature (e.g. Robock and Mao, 1995; Timmreck, 2012).
different aerosol distributions allow us to shed light on the     Furthermore, while it has been argued that models need a
mechanisms at play in altering the ENSO state after volcanic      sufficiently high top and that good vertical resolution is nec-
eruptions.                                                        essary to properly represent many of the surface climate ef-
                                                                  fects of volcanic eruptions (e.g. Driscoll et al., 2012, Suarez-
                                                                  Gutierrez et al., 2021), we analysed 10 different global cli-
2   Methodology and experimental design                           mate models and found that MPI-GE was the best model
                                                                  for representing both global and regional internal variability
In this study we consider the three largest eruptions, in         and forced response. Therefore, the limited number of verti-
terms of quantity of aerosols injected in the stratosphere,       cal levels does not translate into a poor representation of the
of the last 100 years; Agung in Indonesia (8◦ S 115◦ E) in        forced response associated with volcanic eruptions.
February 1963; El Chichón in Mexico (17◦ N 93◦ W) in                 The anomalies calculated are the difference between the
March 1982; and Pinatubo in the Philippines (15◦ N 120◦ E)        reference (3 years before the eruption and for the 200 en-
in June 1991. Two eruptions have an asymmetrical aerosol          semble members that we refer to as climatology) and periods
distribution, so the aerosols are either confined to the NH (El   after the eruption. A Student’s t test is used to estimate the
Chichón) or to the SH (Agung). The Pinatubo eruption has          significance of the mean changes before and after the erup-
an approximately symmetrical distribution with the sulfate        tions at the 95 % confidence level.
aerosols spread across both hemispheres. We also considered          Large tropical eruptions induce a global cooling so that
the eruption of Krakatau in Indonesia (6◦ S 105◦ E) in 1883,      the El Niño response may be partly masked and the La Niña
which is also modelled with an approximately symmetrical          response amplified (Maher et al., 2015). Furthermore, some
aerosol plume to further corroborate our results. For clarity,    climate models overestimate the volcanically induced cool-
we only show the results for Pinatubo, which are qualita-         ing (e.g. Anchukaitis et al., 2012; Stoffel et al., 2015). To
tively similar to Krakatau. The results of Krakatau are dis-      better highlight the dynamical changes, we remove the trop-

https://doi.org/10.5194/esd-12-975-2021                                              Earth Syst. Dynam., 12, 975–996, 2021
978 B. Ward et al.: ENSO response to volcanic eruptions in the MPI-GE
ical SST mean from the original SST, this is known as the the pattern is indeed remarkably similar to a composite of
relative sea surface temperature (RSST) (Vecchi and Soden, La Niña events occurring in the reference periods before the
2007). In this study, we use the RSST to isolate the intrinsic three eruptions (Fig. A17). On the other hand, the temper-
ENSO signal, but the analyses using the SST are available in ature anomalies for the El Chichón and Pinatubo eruptions
Appendix A (Khodri et al., 2017). show opposite results to what is expected under El Niño-like
conditions (Figs. A15 and A16). Moreover, the wind anoma-
lies following Agung (see Figs. 2 and 3) are the opposite of
3 Results
El Chichón, hence leading to opposite upwelling conditions
3.1 ENSO response and its links to the ITCZ shift
along the Equator, further corroborating that the ocean tem-
mechanism
perature anomalies are mostly dynamically driven through
the Bjerknes feedback (Bjerknes, 1969). The different forc-
The volcanic eruptions analysed in the present study show ing caused by the three eruptions induces a different cooling
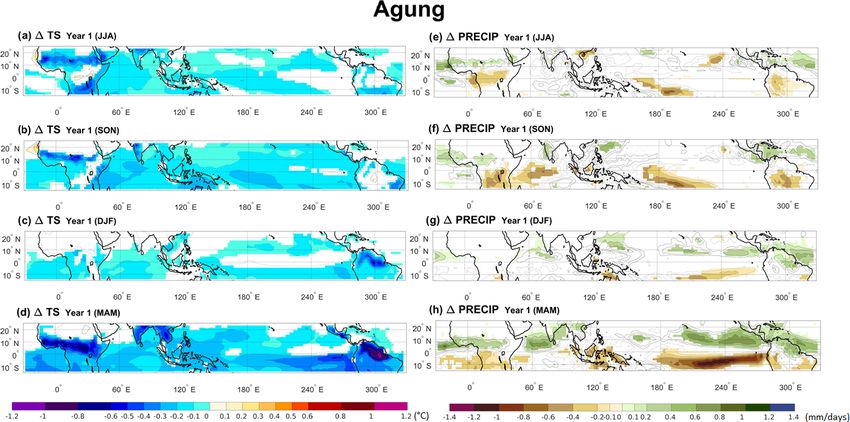
three distinct aerosol plumes. While the aerosol distribution of the surface temperature in the two hemispheres (Fig. 4).
from the Pinatubo eruption is symmetrical around the Equa- Although Pinatubo is the most intense eruption and has the
tor, the Agung and El Chichón eruptions created, to a large largest global temperature decrease (Fig. A1), El Chichón
extent, a confined distribution in the SH and the NH, respec- shows the strongest hemispherical cooling (Fig. 4). The rel-
tively (Fig. 1). For Pinatubo and El Chichón the aerosol op- ative hemispherical cooling associated with Agung (SH) is
tical depth peaks in the winter that follows the eruptions. For in absolute values comparable to Pinatubo even if Agung’s
Agung this maximum is reached in the winter of the second quantity of aerosols injected in the stratosphere was twice as
year after the eruption. The reasons why similar eruptions small (Bluth et al., 1992; Self and Rampino, 2012). Further-
can lead to different aerosol distributions are still being inves- more, while the aerosol distribution of the Pinatubo eruption
tigated, but some causes are the location of the volcanoes, the is symmetric, the relative cooling is not and is concentrated
season and the strength of the eruption (Stoffel et al., 2015; in the NH, which is likely due to uneven distribution of land-
Toohey et al., 2011), the quasi-biennial oscillation, and local mass between hemispheres (i.e. reduced heat capacity in the
meteorology (e.g. Choi et al., 1998), which determine wind NH). The maximum cooling for all three eruptions occurs in
direction and the aerosols distribution across the Equator. Re- the second year, as does the temperature difference between
garding the Pinatubo aerosol distribution, we note that the the two hemispheres (Figs. 4 and A1).
eruption was followed after a few months by the eruption of Precipitation anomalies (Figs. 5 and 6) show the displace-
Mount Hudson (Chile) in the Southern Hemisphere. As the ment of the Hadley cell associated with the differential cool-
aerosol distribution for Pinatubo is based on satellite obser- ing between the hemispheres, showing a northward shift of
vations, the aerosol properties prescribed to the model also the ITCZ for the eruption of Agung and a southward shift
include Mount Hudson eruption. for both El Chichón and Pinatubo for the 3 years follow-
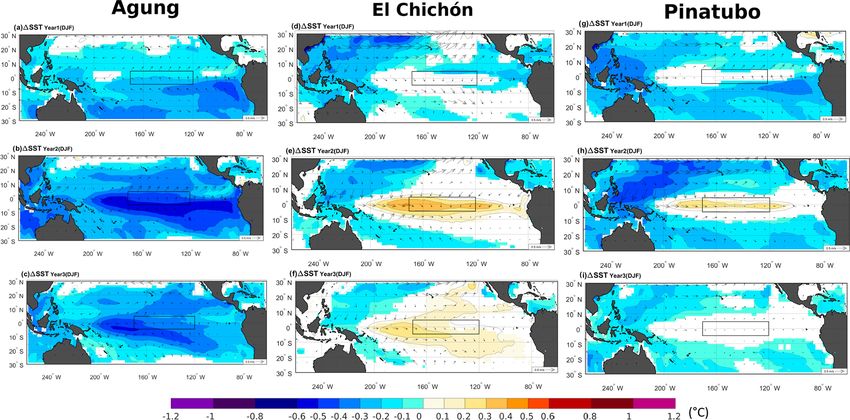
Our simulations show a relative El Niño-like response to ing the eruptions. Additionally, Pinatubo’s rainfall anomaly
the El Chichón and Pinatubo eruptions and a relative La is the largest even though the difference in the cooling of
Niña-like response to the Agung eruption (Figs. 2 and 3). each hemisphere is stronger for El Chichón. This indicates
The relative ENSO anomalies develop at the beginning of that the ITCZ response is sensitive to the magnitude and spa-
the year after the eruption (Year 2) and then peak that bo- tial distribution of the forcing. The on-going global warming
real winter for El Chichón and Pinatubo or in the third boreal could also amplify the rainfall anomaly following the vol-
winter for Agung. The westerly anomalies in the trade winds canic eruptions through modulation in the ocean stratification
are detected starting in the autumn of the eruption (Year 1). and near-surface winds amplifying the response as suggested
For all of the eruptions, the relative Niño 3.4 index peaks in in a recent study (Fasullo et al., 2017) (Fig. A9). Moreover,
the winter of the year after the eruption, reaching a maxi- the precipitation asymmetry index (PAi) (Colose et al., 2016)
mum of approximately +0.3◦ for El Chichón and Pinatubo further highlights the ITCZ shift and weakening (Fig. 7). The
and a minimum of −0.2◦ for Agung (Fig. A3). The results expression for the PAi is given by
using the SST (Figs. A11, A12 and A13) are qualitatively
similar to the RSST (Figs. 2, 3, and A3), but the El Niño- P20◦ N−10◦ N − P10◦ N−Eq
PAi = . (1)
like anomalies are less strong since they are partially masked P20◦ N−Eq
by the global cooling induced by the stratospheric aerosols,
which is in agreement with other studies (Khodri et al., 2017; It represents the variation of the zonal precipitation around
Maher et al., 2015). the average climatological mean of the ITCZ in our model,
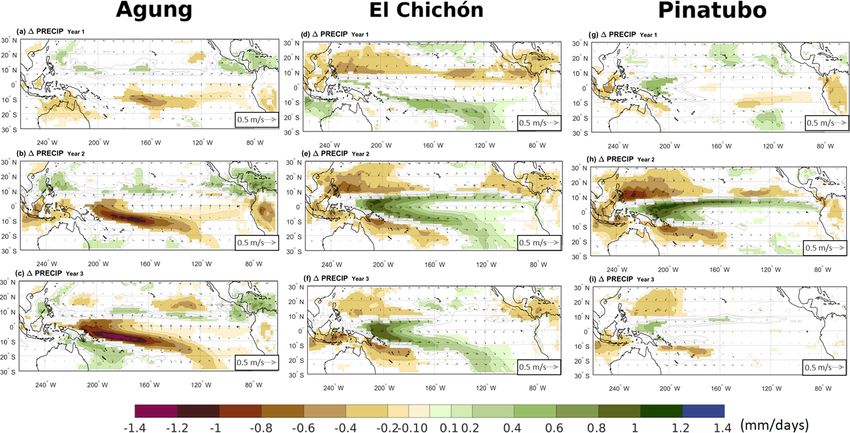
Furthermore, the temperature anomalies following the which is roughly 10◦ N. In Fig. 7, the positive variation of
Agung eruption are not merely superficial but extend down the PAi after the Agung eruption corresponds to a northward
to 200 m depth (Fig. A14). The warming below 100 m in the shift of the ITCZ and the negative variations of the PAi af-
western Pacific and the cooling along the thermocline in the ter the Pinatubo and El Chichón eruptions corresponds to a
eastern side of the basin are typical of an ongoing La Niña: southward shift of the ITCZ.
Earth Syst. Dynam., 12, 975–996, 2021 https://doi.org/10.5194/esd-12-975-2021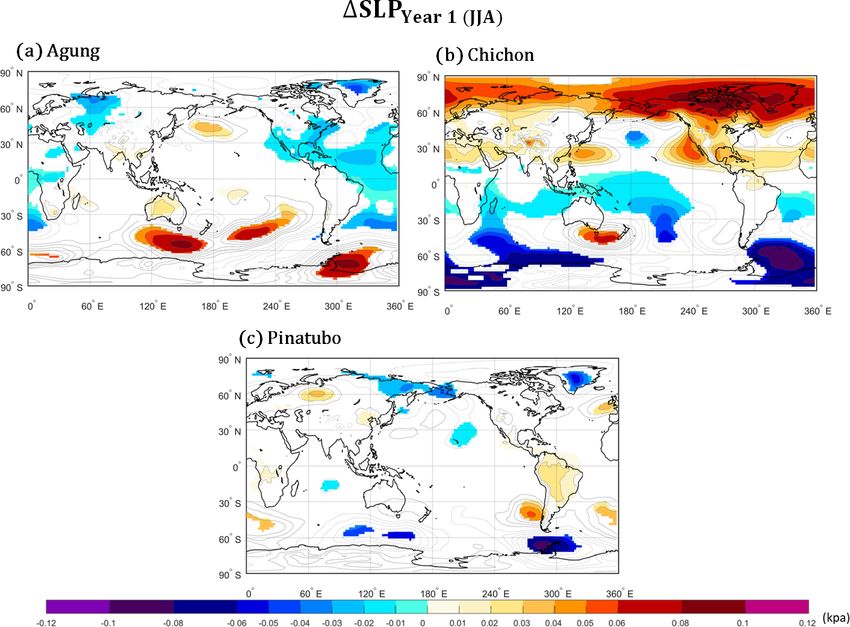
B. Ward et al.: ENSO response to volcanic eruptions in the MPI-GE                                                                       979

Figure 1. Evolution of the aerosol optical depth during 4 years for the three eruptions. The band of wavelength used is between approximately
462 and 625 nm.

Figure 2. Ensemble mean of changes in relative sea surface temperature (RSST) (shadings) and 10 m winds (arrows) between the volcano
case and the climatology for each of the following three winter seasons (DJF) after the Agung (a–c), El Chichón (d–f), and Pinatubo (g–i)
eruptions. Only significant RSST changes are shaded with an approximate 95 % confidence level using Student’s t test. Contours show the
RSST anomalies following the colour bar scale (solid lines for positive anomalies and dashed lines for negative anomalies; the 0 line is
omitted). The boxes indicate the Niño 3.4 area.

   We find that the ITCZ displacement and associated rainfall            weakening for the El Chichón and Pinatubo eruptions as ex-
anomalies peak in the second year after the eruption, when               pected by the direction of the ITCZ movement in each case.
the differential cooling of the hemisphere is larger (Figs. 4,           These wind anomalies then affect the ENSO state: a change
5, 6 and 7). The ITCZ displacement is associated with a                  in the strength of the trade winds along the equatorial Pacific
strengthening of the trade winds for the Agung eruption and a            alters the ocean upwelling in the eastern side. This leads to a

https://doi.org/10.5194/esd-12-975-2021                                                       Earth Syst. Dynam., 12, 975–996, 2021
980                                                          B. Ward et al.: ENSO response to volcanic eruptions in the MPI-GE

Figure 3. Hovmöller plot of the ensemble mean of the relative SST anomalies in the equatorial Pacific (averaged over −5 and 5◦ N) and the
change in the zonal component of the 10 m winds (m/s) for the 3 years following each eruption. The anomalies are calculated relative to the
3 years before each eruption.

                                                                        3.2   ENSO response and its link to other mechanisms

                                                                        The most commonly invoked mechanism that explains the
                                                                        ENSO response after large tropical volcanic eruptions is the
                                                                        ODT mechanism (Clement et al., 1996) and the preferential
                                                                        cooling of the warm pool relative to the eastern equatorial Pa-
                                                                        cific, leading to an El Niño-like response (e.g. Emile-Geay et
                                                                        al., 2008; Mann et al., 2005). However, in our simulations,
                                                                        even if there is a volcanic aerosol over the equatorial Pa-
                                                                        cific and a surface cooling for all the eruptions (Figs. 1, A3,
                                                                        A4 and A5), we see a negative phase of the relative ENSO
                                                                        and an anomalous easterly wind stress developing after the
Figure 4. Evolution of the difference in the ensemble mean be-
tween the volcanically induced cooling of the SH and the NH after       Agung eruption (Figs. 2 and 3). Should the ODT mechanism
each eruption (1TNH − 1TSH ). Shading represents twice the stan-        be dominant in our model, we would expect the opposite re-
dard error of the ensemble mean (i.e. ∼ 95 % confidence interval).      sponse of both the relative SST and wind stress. This sug-
                                                                        gests that the ODT is likely not the leading mechanism in our
                                                                        model, while not ruling out that it can still play a role under
change in the east–west temperature contrast across the tropi-          specific initial conditions (e.g. Predybaylo et al., 2020). An-
cal Pacific, which is amplified by the Bjerknes feedback, thus          other mechanism often used to explain how the post-eruption
altering the ENSO state. All of our results (the evolution of           El Niño-like response is related to the cooling of the Mar-
the relative Niño 3.4 index, the precipitation anomalies or the         itime Continent first proposed by Ohba et al. (2013) and also
relative temperature anomalies) show an almost perfect sym-             suggested in recent studies (e.g. Eddebbar et al., 2019): the
metry between the symmetrical and NH distribution, versus               smaller heat capacity of the land in comparison to the ocean
the SH distribution (Figs. 2, 3, 4, 5, 6 and A2), which strongly        cause a stronger land cooling that reduces the temperature
suggests that the volcanically induced ITCZ displacement is             gradient between the Maritime Continent and the western
the key mechanism to explain the ENSO response to the vol-              Pacific Ocean. Such temperature changes lead to a weaken-
canic forcing in agreement with other studies (Colose et al.,           ing of the trade winds and an eastward shift of the rainfall
2016; Pausata et al., 2016; Stevenson et al., 2016; Pausata et          (El Niño pattern). Our results show a cooling of the Mar-
al., 2020).                                                             itime Continent and a reduction of the convective activity in
                                                                        the three eruptions (Figs. A3, A4 and A5). Nevertheless, our
                                                                        model simulates the development of a relative La Niña-like
                                                                        conditions after the eruption of the Agung (Figs. 1 and 2),
                                                                        which is at odds with the cooling of the Maritime Continent

Earth Syst. Dynam., 12, 975–996, 2021                                                       https://doi.org/10.5194/esd-12-975-2021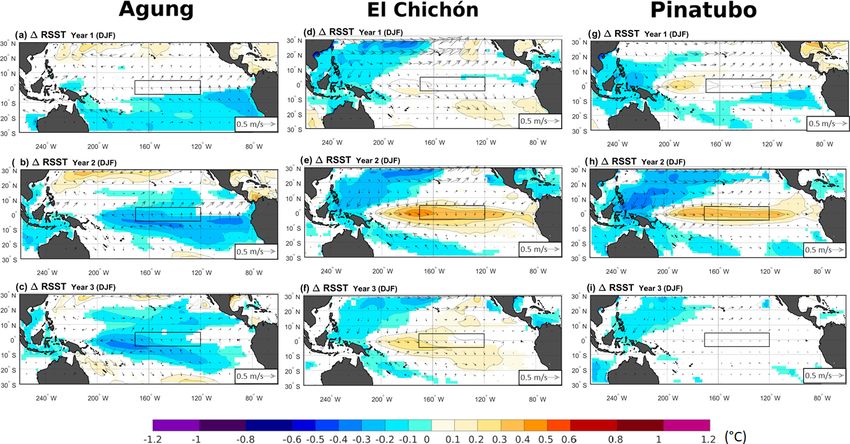
B. Ward et al.: ENSO response to volcanic eruptions in the MPI-GE                                                                         981

Figure 5. Change in ensemble mean precipitation and 10 m winds (arrows) between the reference years and the volcano case for the three
summer to winter seasons (June to February) following the Agung (a–c), El Chichón (d–f) and Pinatubo (g–i) eruptions. Contours show the
precipitation anomaly following the colour bar scale (solid lines for positive anomalies and dashed lines for negative anomalies, the 0 line is
omitted). Only precipitation changes that are significant at the 95 % confidence level using Student’s t test are shaded.

                                                                          Figure 7. Evolution of the difference in the ensemble mean be-
Figure 6. Ensemble mean of the zonal precipitation anomaly over           tween the precipitation asymmetry index (PAi) after each eruption
the Pacific Ocean (160◦ E–100◦ W) between the summer to winter            (PAiV ) and the climatology (PAiNV ). Shading represents twice the
seasons (June to February) of the second year after each eruption         standard error of the ensemble mean (i.e. ∼ 95 % confidence inter-
and the 3-year climatology. Shading represents twice the standard         val). The three stars represents the moment of each eruption.
error of the ensemble mean (i.e. ∼ 95 % confidence interval). The
horizontal line highlights the ensemble-mean 3-year climatology
position of the ITCZ (defined as the location of the zonal-average        the West African Monsoon and changes in the Walker cir-
precipitation maximum).                                                   culation. More specifically, the reduction of the tropical pre-
                                                                          cipitation and tropospheric cooling favours anomalous atmo-
                                                                          spheric Rossby and Kelvin waves in autumn (SON), with a
mechanism, where relative El Niño-like conditions would be                weakening of the trade winds over the western Pacific, lead-
expected for all three eruptions.                                         ing to El Niño-like conditions in the year after the eruption.
   Khodri et al. (2017) suggested that the cooling of trop-               Our results show a mixed response over Africa, with Agung
ical Africa, following volcanic eruptions, may increase the               and Pinatubo both displaying a cooling (Figs. A3 and A5)
likelihood of an El Niño events through the weakening of                  but leading to different relative ENSO responses (Figs. 1 and

https://doi.org/10.5194/esd-12-975-2021                                                        Earth Syst. Dynam., 12, 975–996, 2021
982                                                       B. Ward et al.: ENSO response to volcanic eruptions in the MPI-GE

2). Moreover, after the El Chichón eruption a warming of the       eruptions is caused by the asymmetric cooling of the hemi-
tropical northern Africa takes place in the first year and an El   sphere that pushes the ITCZ towards the hemisphere that is
Niño-like anomaly develops (Figs. 2, 3 and A4). Hence, in          less cooled (Kang et al., 2008; Schneider et al., 2014). Both
our model the volcanically induced cooling of tropical Africa      the eruptions with aerosol confined to the NH and symmet-
and the atmospheric perturbations associated with the sup-         rically distributed across the hemispheres preferentially cool
pression of the African monsoon seem to not play a critical        the NH, consequently shifting the ITCZ southwards, weak-
role in altering the ENSO state following volcanic eruptions.      ening the trade winds over the equatorial Pacific and trigger-
   Recently, Pausata et al. (2020) proposed an additional          ing an El Niño like response through the Bjerknes feedback
mechanism related to the extratropical-to-tropical telecon-        (Bjerknes, 1969). The eruption with the aerosol plume con-
nections that tends to favour an El Niño-like response for         fined to the SH instead exclusively cools the SH, pushing the
both NH and SH eruptions, hence playing in synergy with            ITCZ northward and strengthening the trade winds, leading
(NH eruptions) or against (SH eruptions) the ITCZ shift            to La Niña-like response (Figs. 5, 6 and 7).
mechanism. However, our qualitative analysis of the sea level         The ITCZ mechanism we see at play in our model is sup-
pressure (SLP) anomalies does not match the changes ex-            ported by other recent studies performed with different cli-
pected by this mechanism (cf. Figs. A10 with 4a–d in Pausata       mate models (Pausata et al., 2015b, 2020; Stevenson et al.,
et al., 2020). In this recent study, the volcanic aerosol alters   2016; Colose et al., 2016). Pausata et al. (2020), through a
the meridional temperature gradient of the atmosphere that         set of sensitivity experiments in which the volcanic aerosol
eventually causes a poleward shift of the Pacific jet stream       forcing is confined to either the NH or the SH, show the key
and a strong cyclonic surface pressure anomaly over the mid-       role of the ITCZ displacement in driving the ENSO response.
latitudes to the subtropical Pacific basin in both NH and          They also highlighted the presence of another mechanism re-
SH eruptions in the first summer following the eruptions.          lated to the extratropical-to-tropical teleconnections that no
In our simulation, the response is opposite for the Agung          matter the type of eruption (NH or SH) tends to favour an
and El Chichón or Pinatubo eruptions, suggesting more that         El-Niño like response. Hence, it plays in synergy with (NH
the simulated extratropical anomalies are induced by the           eruptions) or against (SH eruptions) the ITCZ shift mecha-
relative ENSO changes due to the eruption rather than af-          nism. However, the simulated SLP changes in the extratrop-
fecting ENSO (Fig. A10). The reason for the disagreement           ics in our model seem to be in response to the volcanically
could lie in the fact that the El Niño and La Niña-like re-        induced ENSO changes rather than affecting the ENSO re-
sponses following the volcanic eruptions peak in the first         sponse (cf. Figs. A10 with 4a–d in Pausata et al., 2020).
winter in the Pausata et al. (2020) modelling study, while            Our work also pointed out that the ODT (Clement et al.,
in our model they peak in the second winter (Figs. 2 and           1996) and the cooling of the Maritime Continent (Ohba et al.,
3). The extratropical-to-tropical teleconnection could make        2013) and tropical Africa (Khodri et al., 2017) are likely not
the El Niño development following NH and symmetric erup-           the dominant drivers of the ENSO response in the MPI-GE
tions occur faster than in our case, where such a teleconnec-      model. Discrepancies between these previous studies and our
tion appears to not be present. Ad hoc sensitivity experiments     results may occur for three reasons. First, different models
are necessary to rule out the above-mentioned mechanisms in        may present different mechanisms. The fact that the above-
our model.                                                         mentioned mechanisms are not dominant is also in qualita-
                                                                   tive agreement with the modelling experiments in Pausata
                                                                   et al. (2020), who use the Norwegian Earth System Model
4   Discussion and conclusions                                     (NorESM). Another study using all the ensemble members
                                                                   (14) of a large ensemble (CESM-LME) is also in overall
Our study used the largest ensemble simulation (200 ensem-         agreement with our results (Stevenson et al., 2016), finding
bles) currently available of the historical period performed       a La Niña-like response to SH eruption and an El Niño-like
with the MPI-ESM model to better understand the impact of          response to NH and tropical eruption. However, other stud-
the volcanic eruptions on ENSO. Our results strongly point to      ies using either a subset (five members) of the CESM total
the volcanically induced ITCZ displacement as the primary          ensemble (Zuo et al., 2018) or an early version of CESM
driver of the ENSO response following volcanic eruptions           with only one ensemble (Liu et al., 2018) display El Niño-
in this model. In our simulations, the ENSO response af-           like anomalies for all type of eruptions, which brings us to
ter the eruptions critically depends on the distribution of the    the following point. Second, most previous studies are based
aerosol plume. When the volcanic aerosol distribution is con-      on a small number of ensemble members (e.g. five members
fined to the NH or its distribution is symmetrical across the      for three eruptions for the SH plume in Zuo et al., 2018) or
hemispheres, the ENSO state tends towards a positive phase         they heavily rely on statistical tools using a small sample of
(relative El-Niño-like conditions; Fig. 2d–i), while when the      events (e.g. SEA in Liu et al., 2018). Consequently, those
aerosols are confined to the SH the ENSO state is pushed           results may be biased by the use of a restrained number of
towards a negative phase (relative La Niña-like conditions;        ensemble members. Here, our study points out the impor-
Figs. 2a–c). The displacement of the ITCZ following the            tance of a large number of ensemble members when investi-

Earth Syst. Dynam., 12, 975–996, 2021                                                https://doi.org/10.5194/esd-12-975-2021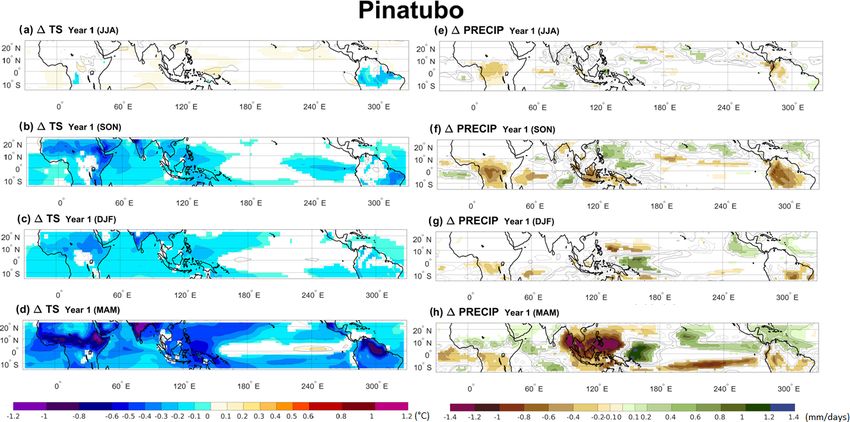
B. Ward et al.: ENSO response to volcanic eruptions in the MPI-GE                                                              983

gating the ENSO response to volcanic eruptions. Third, the              In conclusion, our results provide further insights into the
role of the initial ENSO state is important for determining          mechanism driving the ENSO response to volcanic erup-
the ENSO response (Pausata et al., 2016; Predybaylo et al.,          tions, highlighting the role of the ITCZ shift in particular.
2017) and consequently it influences the role of the ODT and         However, further coordinated efforts with specific sensitiv-
the other above-mentioned mechanisms. Our study only con-            ity studies are necessary to delve into the other proposed
siders the total climate response to volcanic forcing; how-          mechanisms and to unravel the difference between modelling
ever, in a recent study, Predybaylo et al. (2020) separated          studies and reconstructions with regards to the peak of the
the ENSO response to volcanic eruptions into a deterministic         ENSO response. Given that ENSO is the major leading mode
and stochastic response. They have shown that the determin-          of tropical climate variability, which has worldwide impacts,
istic response is dominant for spring and summer eruptions,          these types of studies are also necessary to help improve sea-
while stochastic response plays a major role for eruptions           sonal forecasts following large volcanic eruptions.
occurring in winter. However, our experimental design does
not allow the separation of the total climate response into the
deterministic and stochastic component, with further future
experiments needed in which the volcano and the reference
non-volcano ensemble members start from the same initial
conditions.
   Finally, our results are consistent with the predominance
of post-eruption El Niño events (Adams et al., 2003; McGre-
gor et al., 2020) and can provide an explanation as to why
the majority of both observations and reconstructions are dis-
playing El Niño events instead of La Niña events. However,
the ENSO responses discussed in this study are only tenden-
tial (El Niño-like or La Niña-like response); i.e. intrinsic vari-
ability evolving toward a La Niña at the time of the eruption
does not necessarily lead to a post-eruption El Niño event
even for a NH or symmetrical eruption but instead to a damp-
ening of the ongoing La Niña. Furthermore, our model sug-
gests the peak of ENSO anomalies to be in the second or third
winter after the eruption, similar to most modelling studies
(Khodri et al., 2017; Lim et al., 2016; McGregor and Tim-
mermann, 2011; Ohba et al., 2013; Stevenson et al., 2017).
This is at odds with the reconstructions and observations that
see a peak in ENSO anomalies in the first winter following
the eruption (McGregor et al., 2010, 2020) and possibly ex-
tending to the second year (Adams et al., 2003). The delayed
ENSO response in our model simulations relative to recon-
structions and observations may be related to the apparent
lack of extratropical-to-tropical teleconnections (Pausata et
al., 2020) that could favour El Niño-like response already in
the first winter following the eruption or other biases within
the climate models (e.g. double ITCZ).

https://doi.org/10.5194/esd-12-975-2021                                                 Earth Syst. Dynam., 12, 975–996, 2021
984                                                           B. Ward et al.: ENSO response to volcanic eruptions in the MPI-GE

Appendix A

Figure A1. Evolution of the ensemble mean of the global cooling in the three eruption cases for 3 years, starting at the first summer after the
eruption. The 3-year climatology is subtracted to calculate the anomalies. Shading represents twice the standard error of the ensemble mean
(i.e. ∼ 95 % confidence interval).

Figure A2. Ensemble mean changes in the relative Niño 3.4 index after each eruption. The 3-year climatology is subtracted to calculate the
anomalies. Shading represent twice the standard error of the mean using an approximate 95 % confidence interval.

Earth Syst. Dynam., 12, 975–996, 2021                                                         https://doi.org/10.5194/esd-12-975-2021
B. Ward et al.: ENSO response to volcanic eruptions in the MPI-GE                                                                         985

Figure A3. Ensemble mean of changes in surface temperature (a, b, c, d) and precipitation (e, f, g, h) between the climatology and the volcano
case for each season of the year after the Agung eruption. Only significant anomalies are shown with an approximate 95 % confidence level
using Student’s t test. Contours show temperature and precipitation anomalies following the colour bar scale (solid line for positive anomalies
and dashed line for negative anomalies).

Figure A4. Ensemble mean of changes in surface temperature (a, b, c, d) and precipitation (e, f, g, h) between the climatology and the
volcano case for each season of the year after the El Chichón eruption. Only significant anomalies are shown with an approximate 95 %
confidence level using Student’s t test. Contours show temperature and precipitation anomalies following the colour bar scale (solid line for
positive anomalies and dashed line for negative anomalies).

https://doi.org/10.5194/esd-12-975-2021                                                        Earth Syst. Dynam., 12, 975–996, 2021
986                                                          B. Ward et al.: ENSO response to volcanic eruptions in the MPI-GE

Figure A5. Ensemble mean of changes in surface temperature (a, b, c, d) and precipitation (e, f, g, h) between the climatology and the
volcano case for each season of the year after the Pinatubo eruption. Only significant anomalies are shown with an approximate 95 %
confidence level using Student’s t test. Contours show temperature and precipitation anomalies following the colour bar scale (solid line for
positive anomalies and dashed line for negative anomalies).

Figure A6. Evolution of the aerosol optical depth and ensemble average of the difference between the cooling of the SH (1T SH) and
the NH (1T NH) for the Krakatau eruption. (a) The band of wavelength used is between approximatively 462 and 625 nm. (b) The 3-
year climatology is subtracted to calculate the anomalies. Shading represents twice the standard error of the ensemble mean (i.e. ∼ 95 %
confidence interval).

Earth Syst. Dynam., 12, 975–996, 2021                                                        https://doi.org/10.5194/esd-12-975-2021
B. Ward et al.: ENSO response to volcanic eruptions in the MPI-GE                                                                       987

Figure A7. Ensemble mean of changes in relative sea surface temperature anomalies and 10 m winds (arrows) between the climatology
and the volcano case for the three winter seasons (DJF) after the Krakatau eruption. Only significant RSST changes are shown with an
approximate 95 % confidence level using Student’s t test. Contours show the RSST anomalies following the colour bar scale (solid lines for
positive anomalies and dashed lines for negative anomalies). The boxes indicate the Niño 3.4 area.

Figure A8. (a, b, c) Ensemble mean of changes in precipitation and 10 m wind (arrows) between the 3-year climatology and the volcano case
for the three summer-to-winter seasons (June to February) following the Krakatau eruption. Only precipitation changes that are significant
at the 95 % confidence level using Student’s t test are shaded. Contours show the precipitation anomaly following the colour bar scale (solid
lines for positive anomalies and dashed lines for negative anomalies; the 0 line is omitted). (d) Ensemble average of the zonal precipitation
anomaly over the Pacific Ocean (160◦ E–100◦ W) between the 3-year climatology and the summer-to-winter season (June to February) of
the second year after the Krakatau eruption. Shading represents twice the standard error of the ensemble mean (i.e. ∼ 95 % confidence
interval). The blue line highlights the ensemble-averaged 3-year climatology position of the ITCZ (defined as the location of the zonal-
average precipitation maximum).

https://doi.org/10.5194/esd-12-975-2021                                                       Earth Syst. Dynam., 12, 975–996, 2021
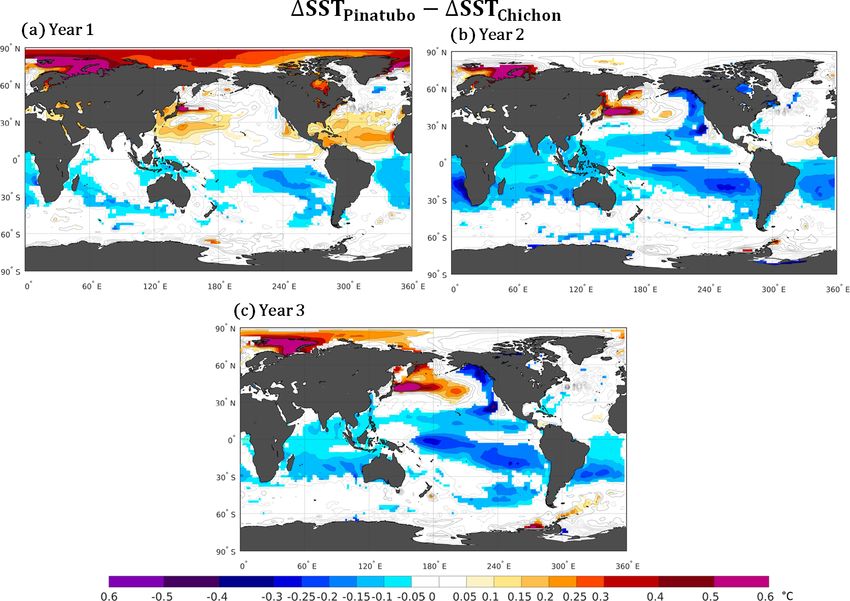
988                                                          B. Ward et al.: ENSO response to volcanic eruptions in the MPI-GE

Figure A9. Difference in the ensemble mean sea surface temperature anomalies between the Pinatubo and El Chichón eruptions
(1TSPinatubo − 1TSChichón ). Only significant anomalies are shown with an approximate 95 % confidence level using Student’s t test. Con-
tours show temperature anomalies following the colour bar scale (solid line for positive anomalies and dashed line for negative anomalies).

Figure A10. Ensemble average of change in the sea level pressure between the climatology and the volcano case for the first summer after
the Agung (a), El Chichón (b) and Pinatubo (c) eruptions. Only significant anomalies are shown with an approximate 95 % confidence level
using Student’s t test. Contours show SLP anomalies following the colour bar scale (solid line for positive anomalies and dashed line for
negative anomalies).

Earth Syst. Dynam., 12, 975–996, 2021                                                       https://doi.org/10.5194/esd-12-975-2021
B. Ward et al.: ENSO response to volcanic eruptions in the MPI-GE                                                                       989

Figure A11. Ensemble mean of changes in sea surface temperature (SST) (shadings) and 10 m winds (arrows) between the volcano case and
the climatology for each of the following three winter seasons (DJF) after the Agung (a–c), El Chichón (d–f) and Pinatubo (g–i) eruptions.
Only significant SST changes are shaded with an approximate 95 % confidence level using Student’s t test. Contours show the SST anomalies
following the colour bar scale (solid lines for positive anomalies and dashed lines for negative anomalies; the 0 line is omitted). The boxes
indicate the Niño 3.4 area.

Figure A12. Hovmöller plot of the ensemble mean of the SST anomalies in the equatorial Pacific (averaged over −5 and 5◦ N) and the
change in the zonal component of the 10 m winds (m/s) for the 3 years following each eruption. The anomalies are calculated relative to the
3 years before each eruption.

https://doi.org/10.5194/esd-12-975-2021                                                       Earth Syst. Dynam., 12, 975–996, 2021
990                                                         B. Ward et al.: ENSO response to volcanic eruptions in the MPI-GE

Figure A13. Ensemble mean changes in the Niño 3.4 index after each eruption. The 3-year climatology is subtracted to calculate the
anomalies. Shading represents twice the standard error of the mean using an approximate 95 % confidence interval.

Figure A14. Ensemble mean changes shown for a transect in the equatorial Pacific (averaged 5◦ N–5◦ S) of the ocean temperature (shadings)
between the volcano case and the climatology for each of the following three winter seasons (DJF) after the Agung eruption. Contours show
the SST anomalies following the colour bar scale (solid lines for positive anomalies and dashed lines for negative anomalies; the 0 line
is omitted). The bold grey line shows the climatological thermocline depth (as defined using the 20 ◦ C isotherm). This is shown for 100
ensemble members.

Earth Syst. Dynam., 12, 975–996, 2021                                                      https://doi.org/10.5194/esd-12-975-2021
B. Ward et al.: ENSO response to volcanic eruptions in the MPI-GE                                                                       991

Figure A15. Ensemble mean changes shown for a transect in the equatorial Pacific (averaged 5◦ N–5◦ S) of the ocean temperature (shadings)
between the volcano case and the climatology for each of the following three winter seasons (DJF) after the Chichón eruption. Contours show
the SST anomalies following the colour bar scale (solid lines for positive anomalies and dashed lines for negative anomalies; the 0 line is
omitted). The bold grey line shows the climatological thermocline depth (as defined using the 20 ◦ C isotherm). This is shown for 100
ensemble members.

Figure A16. Ensemble mean changes shown for a transect in the equatorial Pacific (averaged 5◦ N–5◦ S) of the ocean temperature (shadings)
between the volcano case and the climatology for each of the following three winter seasons (DJF) after the Pinatubo eruption. Contours
show the SST anomalies following the colour bar scale (solid lines for positive anomalies and dashed lines for negative anomalies; the 0
line is omitted). The bold grey line shows the climatological thermocline depth (as defined using the 20 ◦ C isotherm). This is shown for 100
ensemble members.

https://doi.org/10.5194/esd-12-975-2021                                                       Earth Syst. Dynam., 12, 975–996, 2021
992                                                           B. Ward et al.: ENSO response to volcanic eruptions in the MPI-GE

Figure A17. Temperature composite of La Niña events (Niño3.4 index ≤ 0.4 ◦ C) for a transect in the equatorial Pacific (averaged between
5◦ S and 5◦ N) in the reference period of each eruption (4 years before each eruption) and for the winter season (DJF). A total of 100 ensemble
members are considered, leading to a total of 1200 years as a reference period and 237 La Niña events. Contours show the SST anomalies
following the colour bar scale (solid lines for positive anomalies and dashed lines for negative anomalies; the 0 line is omitted). The bold
grey line shows the climatological thermocline depth (as defined using the 20 ◦ C isotherm).

A1    Model validation
Our model simulates a global cooling around 0.2–0.4 ◦ C fol-
lowing the three major eruptions investigated in the study
(Agung, El Chichón and Pinatubo). Robock and Mao (1995)
provided an estimate for the cooling following these large
volcanic eruptions to be of a similar magnitude as those sim-
ulated by our model. Our model also reproduces the high-
latitude winter warming after El Chichón and Pinatubo with
temperature anomalies locally exceeding 2 ◦ C.

Figure A18. Ensemble mean of changes in sea surface temperature (SST) (shadings) between the volcano case and the climatology for the
year following the Agung (a–c), El Chichón (d–f) and Pinatubo (g–i) eruptions. Contours show the SST anomalies following the colour bar
scale (solid lines for positive anomalies and dashed lines for negative anomalies; the 0 line is omitted).

Earth Syst. Dynam., 12, 975–996, 2021                                                         https://doi.org/10.5194/esd-12-975-2021
B. Ward et al.: ENSO response to volcanic eruptions in the MPI-GE                                                                       993

Code availability. The codes used to analyse the data are available       M. N., Frank, D., Grudd, H., Gunnarson, B. E., Hughes, M. K.,
from the corresponding author on reasonable request.                      Kirdyanov, A. V., Körner, C., Krusic, P. J., Luckman, B., Melvin,
                                                                          T. M., Salzer, M. W., Shashkin, A. V., Timmreck, C., Vaganov,
                                                                          E. A., and Wilson, R. J. S.: Tree rings and volcanic cooling, Nat.
Data availability. The first 100 ensembles generated and anal-            Geoci., 5, 836–837, https://doi.org/10.1038/ngeo1645, 2012.
ysed in this study are available at https://mpimet.mpg.de/en/          Barnes, J. E. and Hofmann, D. J.: Lidar measurements of strato-
grand-ensemble/ (Max-Planck-Institut für Meteorologie, 2021).             spheric aerosol over Mauna Loa Observatory, Geophys. Res.
The other 100 ensembles are available from the corresponding au-          Lett., 24, 1923–1926, https://doi.org/10.1029/97GL01943, 1997.
thor on reasonable request. All data needed to evaluate the conclu-    Bittner, M., Schmidt, H., Timmreck, C., and Sienz, F.: Using a
sions in the paper are present in the paper. Additional data related      large ensemble of simulations to assess the Northern Hemi-
to this paper may be requested from the authors.                          sphere stratospheric dynamical response to tropical volcanic
                                                                          eruptions and its uncertainty, Geophys. Res. Lett., 43, 9324–
                                                                          9332, https://doi.org/10.1002/2016GL070587, 2016.
Author contributions. BW analysed the model output and wrote           Bjerknes, J.: Atmospheric Teleconnections From the Equatorial Pa-
the manuscript with the support of FSRP and NM. FSRP conceived            cific, Mon. Weather Rev., 97, 163–172, 1969.
the study and supervised the findings of this work. NM provided        Bluth, G. J. S., Doiron, S. D., Schnetzler, C. C., Krueger, A. J., and
the model output. All authors contributed to the interpretation of        Walter, L. S.: Global tracking of the SO2 clouds from the June,
the results and the writing of the manuscript.                            1991 Mount Pinatubo eruptions, Geophys. Res. Lett., 19, 151–
                                                                          154, https://doi.org/10.1029/91GL02792, 1992.
                                                                       Choi, W., Grant, W. B., Park, J. H., Lee, K.-M., Lee, H., and
                                                                          Russell, J. M.: Role of the quasi-biennial oscillation in the
Competing interests. The authors declare that they have no con-
                                                                          transport of aerosols from the tropical stratospheric reservoir
flict of interest.
                                                                          to midlatitudes, J. Geophys. Res.-Atmos., 103, 6033–6042,
                                                                          https://doi.org/10.1029/97JD03118, 1998.
                                                                       Christiansen, B.: Volcanic eruptions, large-scale modes in the
Disclaimer. Publisher’s note: Copernicus Publications remains             Northern Hemisphere, and the El Niño-Southern Oscillation, J.
neutral with regard to jurisdictional claims in published maps and        Climate, 21, 910–922, https://doi.org/10.1175/2007JCLI1657.1,
institutional affiliations.                                               2008.
                                                                       Clement, A. C., Seager, R., Cane, M. A., and Ze-
                                                                          biak, S. E.: An ocean dynamical thermostat, J. Cli-
Acknowledgements. We thank Mikhail Dobrynin and Jo-                       mate,       9,     2190–2196,        https://doi.org/10.1175/1520-
hanna Baehr from the University of Hamburg for completing the             0442(1996)0092.0.CO;2, 1996.
second set of 100 ensembles from the MPI-GE simulation and pro-        Colose, C. M., LeGrande, A. N., and Vuille, M.: Hemispher-
viding the data from these simulations for use in this paper.             ically asymmetric volcanic forcing of tropical hydroclimate
                                                                          during the last millennium, Earth Syst. Dynam., 7, 681–696,
                                                                          https://doi.org/10.5194/esd-7-681-2016, 2016.
Financial support. Benjamin Ward and Francesco S. R. Pausata           D’Arrigo, R., Cook, E. R., Wilson, R. J., Allan, R.,
have been supported by the Natural Sciences and Engineering               and Mann, M. E.: On the variability of ENSO over
Research Council of Canada (grant no. RGPIN201804981) and                 the past six centuries, Geophys. Res. Lett., 32, 1–4,
the Fonds de recherche du Québec–Nature et technologies (grant            https://doi.org/10.1029/2004GL022055, 2005.
no. 2020NC268559). Nicola Maher has been supported by the Max          Dee, S. G., Cobb, K. M., Emile-Geay, J., Ault, T. R., Lawrence
Planck Society for the Advancement of Science and the Alexan-             Edwards, R., Cheng, H., and Charles, C. D.: No consistent ENSO
der von Humboldt Foundation. Nicola Maher has been supported              response to volcanic forcing over the last millennium, Science,
by the Max Planck Society for the Advancement of Science, the             367, 1477–1481, https://doi.org/10.1126/science.aax2000, 2020.
Alexander von Humboldt Foundation and the Cooperative Institute        Ding, Y., Carton, J. A., Chepurin, G. A., Stenchikov, G., Robock,
for Research in Environmental Sciences (CIRES) at CU Boulder.             A., Sentman, L. T., and Krasting, J. P.: Ocean response to
                                                                          volcanic eruptions in Coupled Model Intercomparison Project
                                                                          5 simulations, J. Geophys. Res.-Ocean., 119, 5622–5637,
Review statement. This paper was edited by Ben Kravitz and re-            https://doi.org/10.1002/2013JC009780, 2014.
viewed by three anonymous referees.                                    Driscoll, S., Bozzo, A., Gray, L. J., Robock, A., and Stenchikov,
                                                                          G.: Coupled Model Intercomparison Project 5 (CMIP5) simula-
                                                                          tions of climate following volcanic eruptions, J. Geophys. Res.-
                                                                          Atmos., 117, 17105, https://doi.org/10.1029/2012JD017607,
References                                                                2012.
                                                                       Eddebbar, Y. A., Rodgers, K. B., Long, M. C., Subramanian, A.
Adams, J. B., Mann, M. E., and Ammann, C. M.: Proxy evidence              C., Xie, S. P., and Keeling, R. F.: El Niño-like physical and bio-
  for an El Niño-like response to volcanic forcing, Nature, 426,          geochemical ocean response to tropical eruptions, J. Climate, 32,
  274–278, https://doi.org/10.1038/nature02101, 2003.                     2627–2649, https://doi.org/10.1175/JCLI-D-18-0458.1, 2019.
Anchukaitis, K. J., Breitenmoser, P., Briffa, K. R., Buchwal, A.,
  Büntgen, U., Cook, E. R., D’Arrigo, R. D., Esper, J., Evans,

https://doi.org/10.5194/esd-12-975-2021                                                     Earth Syst. Dynam., 12, 975–996, 2021
994 B. Ward et al.: ENSO response to volcanic eruptions in the MPI-GE
Emile-Geay, J., Seager, R., Cane, M. A., Cook, E. R., and Haug, G. Maher, N., McGregor, S., England, M. H., and Gupta, A. Sen: Ef-
H.: Volcanoes and ENSO over the past millennium, J. Climate, fects of volcanism on tropical variability, Geophys. Res. Lett.,
21, 3134–3148, https://doi.org/10.1175/2007JCLI1884.1, 2008. 42, 6024–6033, https://doi.org/10.1002/2015GL064751, 2015.
Fasullo, J. T., Tomas, R., Stevenson, S., Otto-Bliesner, B., Brady, Maher, N., Milinski, S., Suarez-Gutierrez, L., Botzet, M., Dobrynin,
E., and Wahl, E.: The amplifying influence of increased ocean M., Kornblueh, L., Kröger, J., Takano, Y., Ghosh, R., Hede-
stratification on a future year without a summer, Nat. Commun., mann, C., Li, C., Li, H., Manzini, E., Notz, D., Putrasahan,
8, 1–10, https://doi.org/10.1038/s41467-017-01302-z, 2017. D., Boysen, L., Claussen, M., Ilyina, T., Olonscheck, D., Rad-
Giorgetta, M. A., Jungclaus, J., Reick, C. H., Legutke, S., Bader, datz, T., Stevens, B., and Marotzke, J.: The Max Planck In-
J., Böttinger, M., Brovkin, V., Crueger, T., Esch, M., Fieg, K., stitute Grand Ensemble – Enabling the Exploration of Climate
Glushak, K., Gayler, V., Haak, H., Hollweg, H.-D., Ilyina, T., System Variability, J. Adv. Model. Earth Sy., 11, 2050–2069,
Kinne, S., Kornblueh, L., Matei, D., Mauritsen, T., Mikolajew- https://doi.org/10.1029/2019MS001639, 2019.
icz, U., Mueller, W., Notz, D., Pithan, F., Raddatz, T., Rast, S., Man, W., Zhou, T., and Jungclaus, J. H.: Effects of large volcanic
Redler, R., Roeckner, E., Schmidt, H., Schnur, R., Segschnei- eruptions on global summer climate and east asian monsoon
der, J., Six, K. D., Stockhause, M., Timmreck, C., Wegner, J., changes during the last millennium: Analysis of MPI-ESM simu-
Widmann, H., Wieners, K.-H., Claussen, M., Marotzke, J., and lations, J. Climate, 27, 7394–7409, https://doi.org/10.1175/JCLI-
Stevens, B.: Climate and carbon cycle changes from 1850 to D-13-00739.1, 2014.
2100 in MPI-ESM simulations for the Coupled Model Intercom- Mann, M. E., Cane, M. A., Zebiak, S. E., and Clement, A.: Volcanic
parison Project phase 5, J. Adv. Model. Earth Sy., 5, 572–597, and solar forcing of the tropical Pacific over the past 1000 years,
https://doi.org/10.1002/jame.20038, 2013. J. Climate, 18, 447–456, https://doi.org/10.1175/JCLI-3276.1,
Harshvardhan, M. R.: Perturbation of the Zonal Radiation Balance 2005.
by a Stratospheric Aerosol Layer, J. Atmos. Sci., 36, 1274–1285, Max-Planck-Institut für Meteorologie: Grand Ensemble, avail-
1979. able at: https://mpimet.mpg.de/en/grand-ensemble/, last access:
Iles, C. E., Hegerl, G. C., Schurer, A. P., and Zhang, X.: The effect 15 September 2021.
of volcanic eruptions on global precipitation, J. Geophys. Res.- McGregor, S. and Timmermann, A.: The effect of explosive
Atmos., 118, 8770–8786, https://doi.org/10.1002/jgrd.50678, tropical volcanism on ENSO, J. Climate, 24, 2178–2191,
2013. https://doi.org/10.1175/2010JCLI3990.1, 2011.
Illing, S., Kadow, C., Pohlmann, H., and Timmreck, C.: Assessing McGregor, S., Timmermann, A., and Timm, O.: A unified proxy
the impact of a future volcanic eruption on decadal predictions, for ENSO and PDO variability since 1650, Clim. Past, 6, 1–17,
Earth Syst. Dynam., 9, 701–715, https://doi.org/10.5194/esd-9- https://doi.org/10.5194/cp-6-1-2010, 2010.
701-2018, 2018. McGregor, S., Khodri, M., Maher, N., Ohba, M., Pausata, F.
Kang, S. M., Held, I. M., Frierson, D. M. W., and Zhao, M.: The S. R., and Stevenson, S.: The Effect of Strong Volcanic
response of the ITCZ to extratropical thermal forcing: Idealized Eruptions on ENSO, ENSO Chang. Clim., 12, 267–287,
slab-ocean experiments with a GCM, J. Climate, 21, 3521–3532, https://doi.org/10.1002/9781119548164.ch12, 2020.
https://doi.org/10.1175/2007JCLI2146.1, 2008. Milinski, S., Maher, N., and Olonscheck, D.: How large does a
Khodri, M., Izumo, T., Vialard, J., Janicot, S., Cassou, C., large ensemble need to be?, Earth Syst. Dynam., 11, 885–901,
Lengaigne, M., Mignot, J., Gastineau, G., Guilyardi, E., Lebas, https://doi.org/10.5194/esd-11-885-2020, 2020.
N., Robock, A., and McPhaden, M. J.: Tropical explosive vol- Nicholls, N.: Low latitude volcanic eruptions and the
canic eruptions can trigger El Ninõ by cooling tropical Africa, El Niño-Southern Oscillation, J. Climatol., 8, 91–95,
Nat. Commun., 8, 1–13, https://doi.org/10.1038/s41467-017- https://doi.org/10.1002/joc.3370080109, 1988.
00755-6, 2017. Ohba, M., Shiogama, H., Yokohata, T., and Watanabe, M.: Im-
Kodera, K.: Influence of volcanic eruptions on the tropo- pact of Strong Tropical Volcanic Eruptions on ENSO Sim-
sphere through stratospheric dynamical processes in the North- ulated in a Coupled GCM, J. Climate, 26, 5169–5182,
ern Hemisphere winter, J. Geophys. Res., 99, 1273–1282, https://doi.org/10.1175/JCLI-D-12-00471.1, 2013.
https://doi.org/10.1029/93JD02731, 1994. Paik, S., Min, S. K., Iles, C. E., Fischer, E. M., and Schurer,
Li, J., Xie, S. P., Cook, E. R., Morales, M. S., Christie, A. P.: Volcanic-induced global monsoon drying modulated
D. A., Johnson, N. C., Chen, F., D’Arrigo, R., Fowler, by diverse El Ninõ responses, Sci. Adv., 6, eaba1212,
A. M., Gou, X., and Fang, K.: El Niño modulations over https://doi.org/10.1126/sciadv.aba1212, 2020.
the past seven centuries, Nat. Clim. Change, 3, 822–826, Pausata, F. S. R., Grini, A., Caballero, R., Hannachi, A., and
https://doi.org/10.1038/nclimate1936, 2013. Seland, Ø.: High-latitude volcanic eruptions in the Norwe-
Lim, H. G., Yeh, S. W., Kug, J. S., Park, Y. G., Park, J. H., gian Earth System Model: The effect of different initial con-
Park, R., and Song, C. K.: Threshold of the volcanic forcing ditions and of the ensemble size, Tellus, B, 67, 26728,
that leads the El Niño-like warming in the last millennium: re- https://doi.org/10.3402/tellusb.v67.26728, 2015a.
sults from the ERIK simulation, Clim. Dynam., 11, 3725–3736, Pausata, F. S. R., Chafik, L., Caballero, R., and Battisti, D.
https://doi.org/10.1007/s00382-015-2799-3, 2016. S.: Impacts of high-latitude volcanic eruptions on ENSO
Liu, F., Li, J., Wang, B., Liu, J., Li, T., Huang, G., and Wang, Z.: Di- and AMOC, P. Natl. Acad. Sci. USA, 112, 13784–13788,
vergent El Niño responses to volcanic eruptions at different lat- https://doi.org/10.1073/pnas.1509153112, 2015b.
itudes over the past millennium, Clim. Dynam., 50, 3799–3812, Pausata, F. S. R., Karamperidou, C., Caballero, R., and
https://doi.org/10.1007/s00382-017-3846-z, 2018. Battisti, D. S.: ENSO response to high-latitude volcanic
eruptions in the Northern Hemisphere: The role of the
Earth Syst. Dynam., 12, 975–996, 2021 https://doi.org/10.5194/esd-12-975-2021You can also read