KEY INFORMATION RELATED TO QUALITY BY DESIGN (QBD) APPLICATIONS IN ANALYTICAL METHODS DEVELOPMENT
←
→
Page content transcription
If your browser does not render page correctly, please read the page content below
Brazilian Journal of Analytical Chemistry
2021, Volume 8, Issue 30, pp 14-28
doi: 10.30744/brjac.2179-3425.RV-27-2020

REV I E W

 Key Information Related to Quality by Design (QbD)
 Applications in Analytical Methods Development
 Alisson Silva Araújo1 , Daniel Fernandes Andrade1 , Diego Victor Babos1 , Jeyne Pricylla
 Castro1 , José Augusto Garcia1 , Marco Aurelio Sperança2 , Raimundo Rafael Gamela1 ,
 Raquel Cardoso Machado1 , Vinícius Câmara Costa3 , Wesley Nascimento Guedes2 ,
 Edenir Rodrigues Pereira-Filho1 and Fabíola Manhas Verbi Pereira2,4*

 1
   Grupo de Análise Instrumental Aplicada (GAIA), Departamento de Química, Universidade Federal de São Carlos
   (UFSCar), 13565-905 São Carlos - SP, Brazil
 2
   Grupo de Abordagens Analíticas Alternativas (GAAA), Instituto de Pesquisa em Bioenergia (IPBEN), Instituto de
   Química, Universidade Estadual Paulista (Unesp), 14800-060 Araraquara - SP, Brazil
 3
   Laboratório de Espectrometria Atômica (LEA)/LabPetro, Departamento de Química, Universidade Federal do
   Espírito Santo (UFES), 29075-910 Vitória - ES, Brazil
 4
   Instituto Nacional de Tecnologias Alternativas para Detecção, Avaliação Toxicológica e Remoção de
   Contaminantes Emergentes e Radioativos (INCT-DATREM), 14800-060 Araraquara - SP, Brazil

                                                                              In this review, quality by design (QbD)
                                                                              initiatives are described as applications for
                                                                              many types of processes, such as in the
                                                                              pharmaceutical industry, biotechnology
                                                                              field, and for analytical methods
                                                                              development. Design space (DS) and
                                                                              design of experiments (DoE) provide
                                                                              useful results for analytical methods
                                                                              development and simulation of advanced
                                                                              processes in traditional manufacturing
                                                                              relationships. The three topics, QbD, DS
                                                                              and DoE are the best way to achieve
                                                                              strong and efficient industrial production.

Keywords: chemometrics, quality by design, control strategy, design of experiments, analytical chemistry
in industrial applications

Cite: Araújo, A. S.; Andrade, D. F.; Babos, D. V.; Castro, J. P.; Garcia, J. A.; Sperança, M. A.; Gamela, R. R.; Machado, R.
C.; Costa, V. C.; Guedes, W. N.; Pereira-Filho, E. R.; Pereira, F. M. V. Key Information Related to Quality by Design (QbD)
Applications in Analytical Methods Development. Braz. J. Anal. Chem., 2021, 8 (30), pp 14-28. doi: http://dx.doi.org/10.30744/
brjac.2179-3425.RV-27-2020

Submitted 1 June 2020, Resubmitted 9 August 2020, 2nd time Resubmitted 6 October 2020, Accepted 8 October 2020, Available
online 20 October 2020.

                                                             14
Braz. J. Anal. Chem., 2021, 8 (30), pp 14-28.

                                                 List of Selected Acronyms
  Analytical quality by design            AQbD               Plackett-Burman                              PB
  Box-Behnken design                      BBD                Principal component analysis                 PCA
  Capillary electrophoresis               CE                 Process analytical technology                PAT
  Central composite design                CCD                Quality by design                            QbD
  Coefficient of determination            R2                 Quality by testing                           QbT
  Critical method attributes              CMAs               Quality control                              QC
  Critical quality attributes             CQAs               Quality target product profiles              QTPPs
  Design of experiments                   DoE                Response surface methodology                 RSM
  Design space or Design spaces           DS or DSs          Risk assessment                              RA
  Fractional factorial design             FFD                United States Food and Drug Administration   US FDA
  Method operational design region        MODR               United States Pharmacopeia                   USP

INTRODUCTION
   Quality by design (QbD) approach has been extensively applied to pharmaceutical products development
as can be observed by many applications in industry quality control, and research and development
(R&D) laboratories. When compared with quality by testing (QbT), QbD improves the understanding of
processes and products with predefined goals based on statistical, mathematical, chemistry and quality
risk management. There are four steps related to QbD processes:

1. Analytical target profile (ATP), which includes the purpose of an analytical method and its required
   performance criteria (critical quality attributes - CQAs);
2. Risk assessment. This step is related to sample preparation for further analytes determination, focuses
   on data analysis. Then, further potential variables as noise variables can be identified so, they are
   evaluated by measurement system analysis approaches, and instrumental parameters, which is
   assessed by design of experiment (DoE) strategies (a critical part);
3. From DoE results, the design space (DS) is obtained. DS shows the analytical chemistry conditions
   where an analytical method or production procedure can work without compromise the final result.
   This component is the establishment of reliable methods intended to be used in analytical chemistry
   laboratories;
4. Control strategy and validation are conducted via observation of several analytical figures of merit,
   such as accuracy and precision expressed as relative standard deviation (RSD) and coefficient of
   determination (R2), among others [1-4].

    Pharmaceutical laboratories and companies have employed QbD to reach the excellence of their
products. Drug efficacy and safety are key criteria to ensure pharmaceutical product quality. Thus, QbD
initiatives are able to analyze factors that can compromise the stability of a drug. For example, Michels
and coworkers [5] applied the QbD framework to develop and validate a capillary electrophoresis‐sodium
dodecyl sulfate assay using a laser-induced fluorescence detector for monitoring impurities from the
manufacturing process of therapeutic monoclonal antibodies to ensure patient safety and product efficacy.
    Since then, QbD was introduced to chemical manufacturing control (CMC), and this approach has
gained popularity in the pharmaceutical manufacturing sector [6]. As mentioned before, QbD has been

                                                            15
Araújo, A. S.; Andrade, D. F.; Babos, D. V.; Castro, J. P.; Garcia, J. A.; Sperança, M. A.; Gamela, R.
R.; Machado, R. C.; Costa, V. C.; Guedes, W. N.; Pereira-Filho, E. R.; Pereira, F. M. V. .
extensively useful in the pharmaceutical industry to understand drug quality parameters. Excipients, for
example, are critical to drug performance, requiring a thorough interpretation of their chemical properties,
composition and control of their variability to ensure high product quality.
Direct compression is an important attribute in the manufacturing of new tablets, and thus, it is necessary
to know the properties of raw materials, as excipients, to ensure the effectiveness of large batch production.
In addition, some properties of these materials are closely correlated, presenting interaction effects, so a
multivariate analysis is mandatory to identify and relate these attributes to excipient performance [7].
An important mechanism that take several advantages of QbD is process analytical technology (PAT).
Actually, PAT and QbD are aligned. PAT can be defined as a series of analytical control procedures and
the manufacturing of new materials that are focused on the quality parameters of a target product. In the
chemical industry, PAT concept has been used for some decades, in which process analyzers such as near
infrared spectroscopy (NIRS) and nuclear magnetic resonance (NMR) are used to optimize productivity, as
well as quality. The data generated by these analytical instrumental techniques are modeled by statistical
and mathematical tools, such as principal component analysis (PCA) and partial least squares (PLS).
Thus, due to these innovations of analytical instruments and the ability to model the data generated by
these detection methods, PAT has been increasingly adopted by the pharmaceutical industry to assist in
improving and modernizing the manufacturing of new drugs.
Nowadays, the implementation of PAT in the field of biotechnology has received special attention due
to the complexities of the raw materials used in products development [8].
Covering all aspects described in the previous paragraphs, we must mention the Chemometric tools.
Chemometrics is a science dedicated to perform a better visualization and interpretation from chemical
data. This science has been barely used for optimization in electroanalytical applications when comparing
to spectroscopy and chromatography methods [9,10].
This review is intended to present some applications of QbD in pharmaceutical field as also, other
promising areas. Chemometrics is “spread” in all text, turning QbD a powerful tool for variables optimization of
chromatographic analytical methods allowing that experimental conditions achieve successful separation,
identification and quantification of the target species.
DoE can be used for several applications depending on issue to be solved. In a review paper, Hibbert
[11] described the use of several DoE processes applied to chromatographic separation and highlighted
the most used in optimization and validation studies such as: (1) Factorial design [12-14]; (2) Plackett-
Burman (PB) design [15-17]; (3) Central Composite design (CCD) [18-20]; (4) Box–Behnken design (BBD)
[21-23]; (5) Doehlert design (DD) [24-26] and (6) Mixture design [27-29]. Other types of DoE have been
used and often cited in the literature, as examples Mixed-level fractional factorial design [30-32]; Definitive
Screening design (DSD) [33-35] and D-optimal design [36-38].
The interest in QbD by industry and laboratories is increasing. Figure 1 shows the number of publications
related to this topic since 1977 using Web of Science database. From 1977 to 2006, only 23 papers were
published. It is possible to see the ever-increasing number of publications on this topic which in 2018 and
2019 more than 200 articles were published.
16Braz. J. Anal. Chem., 2021, 8 (30), pp 14-28.
Figure 1. Publications related to quality by design (QbD) from 1977 to 2019.
The dataset used in this research was downloaded from the online database Science Citation Index
Expanded (SCI-EXPANDED), and all documents types were considered. These results were exported
from the Web of Science using 500 records at a time, file format in full record and cited references as well
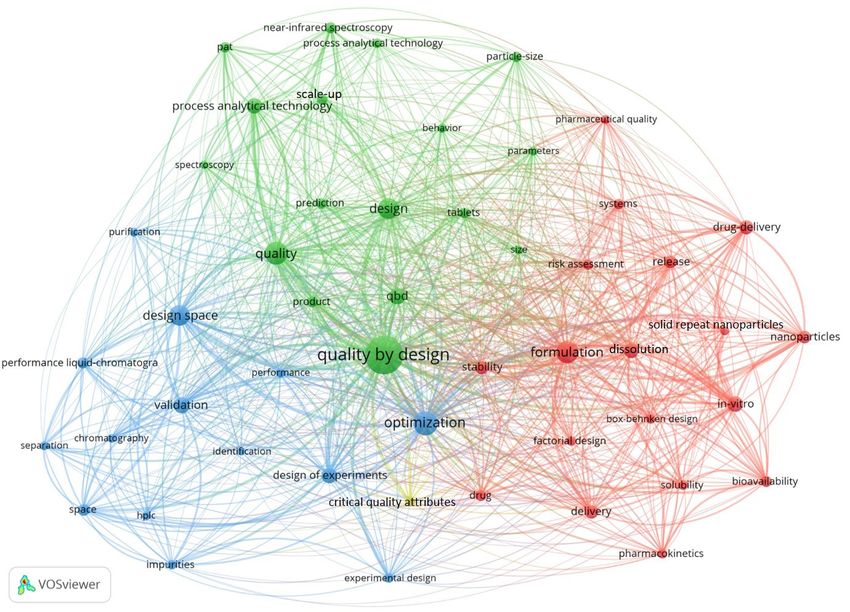
as tab-delimited (Win) for the file format. A bibliometric map for occurrence analysis of author keywords
was obtained using the VOSviewer software (version 1.6.15; www.vosviewer.com). Figure 2 shows the top
50 author keywords with the highest co-occurrence among the 1,607 articles addressed to the keywords
“analytical quality by design” OR “quality by design” on July 27, 2020. This bibliometric map shows a
set of links connecting different research topics (i.e. clusters indicated in different colors) and how QbD
can be associated with other important topics, such as DS, DoE, and PAT. Details explaining how this
bibliometric analysis is prepared can be found in the following Youtube Playlist: https://www.youtube.com/
playlist?list=PL4CuftF4l_fCc9t1xoQSaYOUq-UBz_2VD
17Key Information Related to Quality by Design (QbD) Applications in Analytical Methods Development
Figure 2. Bibliometric map for quality by design (QbD) relations with main important topics. Keywords used: “analytical
quality by design” OR “quality by design”. Number of words: 50 and more details about the bibliometric analysis can
be found in the following Youtube Channel: https://www.youtube.com/c/EdenirPereiraFilho
This review aims to introduce the reader to this important topic and mainly, show how the scientific
authors applied these concepts. The text addresses three complementary parts: QbD, DS and DoE and,
Table I emphasizes recent applications.
Quality by design (QbD), design of space and design of experiments applications
In 2018, Dispas et al. [39] discussed the importance of QbD strategy for analyzing drug impurities. They
mentioned that QbD facilitates quality risk management and provides ways to identify and control potential
quality issues during both product development and manufacturing. It was also mentioned that one of the
key challenges during the implementation of QbD strategies is the development of appropriate analytical
methods to achieve the intended goals.
In 2017, a CE-based limit test for levomethorphan was developed. Critical method parameters were
determined throughout scouting experiments and screened by FFD to establish the CQAs, which were
optimized using Central composite face-centered design to define the method DS. The validation process
was performed according to the International Council for Harmonisation of Technical Requirements for
Pharmaceuticals for Human Use (ICH) guideline Q2 (R1) [40].
A rapid colorimetric microplate bioassay for the estimation of bacitracin was proposed using QbD
18Braz. J. Anal. Chem., 2021, 8 (30), pp 14-28.
approach. For the optimization of the method, factorial design and response surface methodologies (RSM)
were performed, and DS was established to ensure the method reproducibility [41].
Hashem and El-Sayed [42] proposed a new RP-HPLC method for the simultaneous determination of
levetiracetam and pyridoxine HCl in prepared tablets using QbD. Screening of four independent variables:
pH of the mobile phase, flow rate, injection volume and percentage of the organic modifier at two levels,
and optimization of the chromatographic variables were performed by FFD and CCD, respectively.
Tol et al. [43] developed a selective and robust HPLC method for separation of abacavir, lamivudine
and dolutegravir (anti-retroviral formulation) in a drug product. QbD principles combined with a DoE were
proposed to establish the relationship between critical response and tested variables.
QbD strategy was used by Mohamed et al. [44] to develop a new method combining vortex-aided
salting-out-assisted liquid-liquid microextraction with a core-shell HPLC method establishing an efficient,
sensitive and simultaneous determination of dorzolamide hydrochloride (DOR) and timolol maleate (TIM)
in rabbit plasma with high analytical frequency. Screening of the knowledge space was performed with a
PB design, and a BBD was applied for RSM.
Kozaki et al. [45] also studied the application of QbD to pharmaceutical development for analyzing
critical process parameters (CPPs) of poly (lactic-co-glycolic acid) nanoparticle formulations encapsulating
triamcinolone acetonide. CPPs were assessed by FFD and CCD, and then the results were visualized
using RSM to identify DS.
In 2009, an overview of key developments and a roadmap regarding QbD principles for therapeutic
biotechnology products was reported [46].
Terzić et al. [47] developed a specific and robust hydrophilic interaction liquid chromatography (HILIC)
method for the determination of bilastine and its degradation impurities with high analytical frequency
following analytical QbD (AQbD) strategy. Through the use of BBD, a relationship between the CPPs
and the CQAs was established, and further regression models and Monte Carlo simulations were used
to identify the DS. Robustness testing was performed using FFD. In another study proposed by Kasagic-
Vujanović and Jancic-Stojanovic, the HILIC system was used for the determination of amitriptyline and its
impurities as following substances, dibenzosuberone, cyclobenzaprine, nortriptyline and (5EZ,10RS)–5–
[3-(dimethylamino)propylidene-10,11-dihydro-5H-dibenzo[a,d][7]annulen–10–ol, and the same statistical
treatment was applied [48].
Through QbD, Sylvester et al. [49] developed an HPLC method for the simultaneous determination
of curcuminoids and doxorubicin from long-circulating liposomes. The authors established a MODR by
means of a DoE and RSM. Within a linear range from 2 to 20 µg/ml, and trueness between 97 to 104%
were successfully achieved.
Sankar et al. [50] used QbD for determination of enzalutamide (ENZ), an atypical anticancer drug, in
a drug formulation and in spiked plasma samples using UHPLC-electrospray ionization-tandem mass
spectrometry (UHPLC-ESI-MS/MS). A DoE and CCD were used to screen and extensively evaluate the
critical process attributes (CPAs), which can influence analytical parameters.
Another study using the QbD for method development of the estimation of quercetin dihydrate by HPLC
was proposed by Sandhu et al. [51] FFD was used to screen the critical analytical attributes (CAAs),
including the organic modifier, injection volume, column temperature and buffer strength. After that, the
optimal conditions were determined through BBD and RSM, respectively.
Green analytical chemistry principles and QbD were applied to develop and validate the determination
of fenoverine (FEN) in bulk and dosage form. In this study, a two-level FFD (27-3) was applied to screening
and identifying the influential chromatography method variables. Furthermore, the BBD was used to
optimize the most important variables that actively affect the CAAs [52].
Mukthinuthalapati et al. [53] simultaneously determined antidiabetic drugs in their combined dosage
forms employing HPLC. The effects of the variables, such as mobile phase composition, buffer strength,
and flow rate were optimized using a BBD. Thus, the DoE and QbD allowed the separation of five analytes:
metformin, pioglitazone, glibenclamide, glimepiride and repaglinide.
19Araújo, A. S.; Andrade, D. F.; Babos, D. V.; Castro, J. P.; Garcia, J. A.; Sperança, M. A.; Gamela, R.
R.; Machado, R. C.; Costa, V. C.; Guedes, W. N.; Pereira-Filho, E. R.; Pereira, F. M. V. .
In addition, Awotwe-Otoo et al. [54] used QbD to optimize a method based on the separation of
hydrolyzed protamine sulfate peptides from a robust RP-HPLC method. Two experimental designs were
used: (i) a PB design to evaluate main effect of the different variables, such as mobile phase pH, flow
rate of the mobile phase, injection volume, methanol concentration and column temperature, on peak
resolution; and (ii) a three-level BBD with three center points to evaluate the principal, quadratic and
interaction effects considering the column temperature, flow rate (on peak resolution), USP (United
States Pharmacopeia) tailing and mobile phase pH (on the response), reducing the required number of
experiments after optimization.
Dobricic et al. [55] used RP-HPLC for the simultaneous determination of telmisartan and impurities using
QbD. Variables including the acetonitrile (ACN) content in the first (ACN 1) and second (ACN 2) gradient
steps were evaluated. In addition, time (t2), the second gradient step and their combination affected the
separation of telmisartan and its impurities.
QbD was also applied in bioanalytical method development for olmesartan medoxomil (OLM)
determination in rat plasma using ultra-performance liquid chromatography (UPLC). For instance, Beg
et al. [56] performed a 25-2 FFD as a screening method to identify important variables and, posteriorly, to
optimize them (mobile phase ratio and injection volume) using a CCD at three levels. BBD was also used
for optimization of the extraction process conditions.
With the help of QbD concept, Sharma et al. [57] used a full factorial DoE 33 to optimize the conditions
of analyte separation for the determination of bambuterol. In another paper, Schmidt et al. [58] developed a
method using DoE for the determination of impurities in the active pharmaceutical ingredient carbamazepine.
QbD was also applied to optimize lipid-polymer nanoparticles from a DoE at three levels of two critical
independent variables, the lipidoid 5, L5 content and the L5:ASO ratio, for customizing luciferase gene
transcription of antisense oligonucleotides (Luc-ASO) for delivery in HeLa pLuc/705 cells containing an
aberrant luciferase gene [59].
Bade et al. [60] applied QbD using a DoE for optimization of the refolding process for a recombinant,
biotech, therapeutic, granulocyte colony-stimulating factor. Risk analysis was performed to identify
variables that required more attention. Afterwards, the chosen parameters were evaluated using an FFD.
QbD and PAT were used to investigate particle characterization during in-line, high-shear, wet granulation
(HSWG) using focused beam reflectance measurement (FBRM). The optimizations were conducted from
a DoE with nine scale-up levels developed in batches and eight clinical sublots using an FBRM probe to
assess the variables and improve the process of development of this drug product [61].
A study using the QbD was applied in the production of a pharmaceutical gel. The quality target product
profiles (QTPPs) were obtained from reference values of the previously batches. The critical variables of
the process (viscosity and pH) were optimized using a DoE that comprised 13 gel with triplicates at the
center point. Afterwards, the best synergism values from the optimization of the QTPPs were defined using
a desirability function [62].
Pasquini et al. [63] used a DoE to optimize the experimental parameters and variables from an
electrokinetic method following QbD. From the optimization, a DS was defined, and the developed method
was dedicated to quantify three antimigraine drugs in different pharmaceutical products available on the
market.
Design of Experiments (DoE) is a statistical technique for screening of factors, planning, conducting,
analyzing, optimizing the conditions of the system to be used and interpreting data from experiments. For
QbD, the use of DoE includes advantages as not requiring detailed knowledge of the system, definition of
the number of experiments to be performed, and data modelling for empirical functions that are generally
linear or quadratic [11,64].
QbD concepts are normally used to analytical method development. Its use is increasing based
on predefined requirements for an analytical method stated in the ATP. From this perspective, a DoE
is mandatory to visualize the influence of the variables and its interactions on responses. For variable
screening studies, the two-level full factorial design is the most widely used. Afterwards, variable screening
20Braz. J. Anal. Chem., 2021, 8 (30), pp 14-28.
and multilevel designs are generally considered for the efficient exploration of response functions from
empirical models. The critical conditions of factors as maximum or minimum values are determined by
RSM. Among these, the most used are the CCD, BBD, and DD [11,65,66].
Ferreira et al. [10] reported an overview of most common factorial design methods for the optimization
of sample preparation procedures and experimental conditions of analytical instrumental techniques
dedicated to determination of organic and inorganic analytes in food. According to the authors, CCD is the
most commonly used method, although it has a lower efficiency than DD or BBD. They also conclude that
there is a high frequent use of chemometric tools for the optimization of analytical methods.
For instance, a DoE and RSM were used to optimize the process of biodiesel production using different
types of catalysts (homogeneous and heterogeneous and acid) [67].
Wu et al. [68] proposed the Generalized Multiplicative ANOVA (GEMANOVA) model as an alternative
to ANOVA (analysis of variance) for improving the interpretation and understanding of complex data sets
obtained from monitoring the physical stability of a solid dispersion with X-ray powder diffraction (XRPD).
The results obtained by the GEMANOVA model were easier to interpret and understand than those
obtained from the ANOVA model, and a DS was established according to the QbD. Table I shows some
selected papers and its remarks about QbD application in Pharmaceutical industry, Industrial purposes
and Optimization using DoE.
Table I. Selected papers of applying QbD principles to common scientific fields
Field Remark References
• Chromatographic methods for separation, identification and
determination
Pharmaceutical • Starting materials and reagents evaluation in manufacturing [69-86]
industry • Identification of unexpected impurities
• Granulation and tableting processes
• Dosage form of a solid inhaled drug
• Development and optimization a chitosan film formulation
• Identification of stable and robust microemulsions
Industrial purposes [87-95]
• Evaluation of the kinetics of a powder mixing process
• QbD to assess the subfractions of lipoprotein
• Nanoprecipitation (NPR) and nanospray drying (NSD)
application
Optimization tools • Optimization of cell culture parameters [96-108]
using DoE • Determination, development and improvement of analytical
methods
• Selection of relevant variables in a system
DoEs have been used in these biotechnological processes for some years, as reported by Mandenius
et al. [109] in a review paper, in which DoEs are a powerful tool for the optimization of bioprocesses.
QbD has been shown as a relevant scientific tool for developing efficient and safe medicinal products,
as well as for reducing costs in the development of these products in health care industries [110].
DoE and RSM are critical tools for QbD implementation. Therefore, to comply with the established
guidelines (ICH Q1, Q2 and Q3), studies have reported the importance of these tools to achieve successful
results regarding the implementation of QbD. Bezerra et al. [111] outlined a tutorial review about simplex
optimization. This particular approach does not need complex mathematical and statistical tools to be
performed and, consequently can be easily implemented. Another important study, from Ferreira et al. [112]
21Key Information Related to Quality by Design (QbD) Applications in Analytical Methods Development
is a review about the most known experimental designs, such as the BBD, DD, and the CCD. In addition, a
tutorial entitled “Application of free computational program in experimental design: a tutorial” [113] makes
DoE, one of the tools discussed in this review, accessible for any analyst or industry professional.
A fast HPLC screening method for the separation of eight antidiabetic compounds: pioglitazone (PZ),
rosiglitazone (RZ), glyburide (GB), glimepiride (GM), gliquidone (GQ), gliclazide (GL), glipizide (GP), and
repaglinide (RG), was proposed by Mokhtar et al. [114]. DS was developed using an in silico simulation of
practical robustness testing procedures. The DS was calculated using a full two-level DoE for three different
stationary phases varying buffer pH, gradient elution parameters, and ternary solvent ratio. Furthermore,
the method offered a fast separation (less than 6 min) of the analytes that achieved the required levels of
the CQAs.
Following the QbD principles, Schmidt et al. [115] defined a DS for a chromatographic method for the
purity testing of pramipexole. Influential separation parameters were identified and assessed experimentally
in a DoE (36= 729 experiments were performed in silico).
A DS was used by Arai et al. [116] in the granulation process of mefenamic acid tablets. Bootstrap
resampling technique was used to evaluate robustness of the procedure. This procedure is used when
predictions estimated by the quadratic polynomial model present unsatisfactory results in complex
nonlinear problems. Thus, the Bootstrap resampling method is applicable to verify the accuracy of a
nonlinear response surface.
DS and QbD concepts were implemented to evaluate the CPPs in ICH, Q8 R2, Q9 and Q10 for analytical
method development and optimization of three chiral compounds. These compounds were developed as
modulators of small conductance calcium-activated potassium (SK) channels using HPLC [117]. A DoE-
DS and CCD were used to investigate the effects of trifluoroacetic acid (TFA) and n-hexane concentration
in an acetonitrile mobile phase for enantiomeric separation.
In the pharmaceutical field, the DS and DoE concepts are being increasingly used to optimize analytical
methods. For instance, Jambo et al. [118] evaluated the use of mass spectrometric detection supercritical
fluid chromatography (SFC-MS) to identify adulteration in medicinal cannabis plants. In order to optimize
this method, DoE and DS approaches were applied. Kurmi et al. [119] also used a DoE to optimize the
forced degradation conditions of furosemide acid.
In the study by Maeda et al. [120], QbD was used to build a more reliable large-scale D. The experimental
model system selected to construct the DS was the lubrication process for theophylline tablet manufacturing.
Mokhtar et al. [121] proposed a method to ensure more confidence in the produced DS regarding the
robustness in compliance with ICH Q2 (R1). In this sense, a new DS calculation was developed that was
compared to the conventional calculation. For this, a HPLC instrument was used and, with the assistance
of a DoE, this DS mapped by the in silico robustness simulation provided more compliance to ICH Q2 (R1)
than the previous alternatives.
A quantitative structure-retention relationship-design-of-experiment (QSRR-DoE) protocol to propose an
optimal DS in a QbD procedure to improve HILIC method development in the separation of pharmaceutical
targets was proposed by Taraji et al. [122]. A CCD for three selected chromatographic variables: acetonitrile
concentration, mobile-phase pH and salt concentration, was used to model the retention times of a mixture
of pharmaceutical analytes in HILIC. A QSRR model was generated and used to predict the retention time
and, consequently, the selectivity variable between new target analytes.
Chhatre et al. [123] provided an important discussion about the combination of QbD and biochemical
engineering to enable an efficient bioprocess development and manufacturing. The highlights of the main
steps of QbD: risk assessment, statistical experimental design, scale-down techniques, rapid assays and
graphical representation methods.
A study using QbD and a DS to develop a bioassay for the relative potency of linezolid in pharmaceutical
samples was proposed by Saviano et al. [124]. DoE and CCD were applied to evaluate the influence of
inoculum concentration and triphenyltetrazolium chloride on microbial growth.
22Braz. J. Anal. Chem., 2021, 8 (30), pp 14-28.
In 2017, Kormány et al. [125] proposed a generic workflow to compare the resolution of a pharmacopeia
impurity profiling method in a large DS of 3 measured and 3 calculated variables. A modern LC modeling
software (Drylab) was used for comparing critical variables in relation of different parts of the DS. The results
showed that it is possible to interchange two columns and map the retention behavior of the compounds
of interest in a small number of steps in an experimental study.
Sun et al. [126] combined a computer simulation program and a design of experiments statistical
software to develop a multicomponent analytical determination method using HPLC, combining two
detectors, a diode-array detector (DAD) and an evaporative light scattering detector (ELSD), connected in
series. DoE was applied to in the workflow steps to minimize experimental risk variables and provide an
efficient DS method.
Nadella et al. [127] used a DoE by applying QbD to identify a DS for determination of teriflunomide by
a UPLC method in the presence of degradation products. A CCD was performed to evaluate the variables:
resolution, retention time and peak tailing. The proposed method presented high analytical frequency.
CONCLUSION AND PERSPECTIVE
This review shows that traditional manufacturing relationships have been changing by QbD. These
methods are part of analytical quality improvements and mainly, aid to save energy and time. In addition,
most methods described here are related to pharmaceutical purposes, but it was possible to verify the first
steps in other areas. It is worthy to reinforce the importance of the design tools (QbD, DS and DoE) and
that they would be able to enhance other industrial processes. From the practical point of view, there is
enough room for other applications in different fields of chemical industry.
Acknowledgments
This study was supported by the São Paulo Research Foundation (FAPESP) [grant numbers
2019/24223-5, 2018/18212-8, 2019/01102-8 and 2014/50945-4], the National Council for Scientific and
Technological Development (CNPq) [grant numbers 307328/2019-8 and 465571/2014-0], the Coordination
for the Improvement of Higher Education Personnel (CAPES) - Finance Code 001 [grant number
88887136426/2017/00].
REFERENCES
1. Rozet, E.; Lebrun, P.; Debrus, B.; Boulanger, B.; Hubert, P. TrAC, Trends Anal. Chem., 2013, 42, pp
157-167 (http://dx.doi.org/10.1016/j.trac.2012.09.007).
2. Deidda, R.; Orlandini, S.; Hubert, P.; Hubert, C. J. Pharm. Biomed. Anal., 2018, 161, pp 110-121
(https://doi.org/10.1016/j.jpba.2018.07.050).
3. Fukuda, I. M.; Pinto, C. F. F.; Moreira, C. D. S.; Saviano, A. M.; Lourenço, F. R. Braz. J. Pharm. Sci.,
2018, 54, pp 1-16 (http://dx.doi.org/10.1590/s2175-97902018000001006).
4. Orlandini, S.; Pinzauti, S.; Furlanetto, S. Anal. Bioanal. Chem., 2013, 405, pp 443-450 (https://doi.
org/10.1007/s00216-012-6302-2).
5. Michels, D. A.; Parker, M.; Salas-Solano, O. Electrophoresis, 2012, 33 (5), pp 815-826 (https://doi.
org/10.1002/elps.201100528).
6. Yu, L. X.; Amidon, G.; Khan, M. A.; Hoag, S. W.; Polli J.; Raju, G. K.; Woodcock, J. The AAPS Journal,
2014, 16 (4), pp 771-783 (https://doi.org/10.1208/s12248-014-9598-3).
7. Thoorens, G.; Krier, F.; Leclercq, B.; Carlin, B.; Evrard, B. Int. J. Pharm., 2014, 473, pp 64-72 (http://
dx.doi.org/10.1016/j.ijpharm.2014.06.055).
8. Rathore, A. S.; Bhambure, R.; Ghare, V. Anal. Bioanal. Chem., 2010, 398, pp 137-154 (https://doi.
org/10.1007/s00216-010-3781-x).
9. Tarley, C. R. T.; Silveira, G.; dos Santos, W. N. L.; Matos, G. D.; da Silva, E. G. P.; Bezerra, M. A.; Miró, M.;
Ferreira, S. L. C. Microchem. J., 2009, 92 (1), pp 58-67 (http://dx.doi.org/10.1016/j.microc.2009.02.002).
23Araújo, A. S.; Andrade, D. F.; Babos, D. V.; Castro, J. P.; Garcia, J. A.; Sperança, M. A.; Gamela, R.
R.; Machado, R. C.; Costa, V. C.; Guedes, W. N.; Pereira-Filho, E. R.; Pereira, F. M. V. .
10. Ferreira, S. L. C.; Silva Junior, M. M.; Felix, C. S. A.; Silva, D. L. F.; Santos, A. S.; Santos Neto, J. H.;
Souza, C.T.; Cruz Junior, R. A.; Souza, A.S. Food Chem., 2019, 273, pp 3-8 (https://doi.org/10.1016/j.
foodchem.2017.11.114).
11. Hibbert, D. B. J. Chromatogr. B, 2012, 910, pp 2–13 (http://dx.doi.org/10.1016/j.jchromb.2012.01.020).
12. Vdovenko, M. M.; Demiyanova, A. S.; Chemleva, T. A.; Sakharov, I. Y. Talanta, 2012, 94, pp 223-226
(https://doi.org/10.1016/j.talanta.2012.03.025).
13. Araújo, J. E.; Oliveira, E.; Otero-Glez, A.; Nores, J. S.; Igrejas, G.; Lodeiro, C.; Capelo, J. L.; Santos,
H. M. Talanta, 2014, 119, pp 90-97 (http://dx.doi.org/10.1016/j.talanta.2013.10.019).
14. Lima, D. C.; Guedes, W. N.; Costa, V. C.; Amorim, F. A. C. J. Braz. Chem. Soc., 2018, 29 (9), pp 1885-
1893 (http://dx.doi.org/10.21577/0103-5053.20180064).
15. Dejaegher, B.; Dumarey, M.; Capron, X.; Bloomfield, M. S.; Vander Heyden, Y. Anal. Chim. Acta.,
2007, 595, pp 59-71 (https://doi.org/10.1016/j.aca.2006.11.077).
16. Olivieri, A. C.; Magallanes, J. F. Talanta, 2012, 97, pp 242-248 (https://doi.org/10.1016/j.talanta.2012.04.025).
17. Callao, M. P. TrAC, Trends Anal. Chem., 2014, 62, pp 86-92 (https://doi.org/10.1016/j.trac.2014.07.009).
18. Gustavo González, A.; González-Arjona, D. Talanta, 1999, 49, pp 433-439 (https://doi.org/10.1016/
S0039-9140(99)00005-3).
19. Djoudi, W.; Aissani-Benissad, F.; Bourouina-Bacha, S. Chem. Eng. J., 2007, 133, pp 1-6 (https://doi.
org/10.1016/j.cej.2007.01.033).
20. Li, J.; Wang, H.; Li, H.; Xu, L.; Guo, Y.; Lu, F.; Pan, W.; Li, S. Int. J. Pharm., 2016, 498, pp 32-39
(https://doi.org/10.1016/j.ijpharm.2015.12.005).
21. Ferreira, S. L. C.; Bruns, R. E.; Ferreira, H. S.; Matos, G. D.; David, J. M.; Brandão, G. C.; Silva, E. G.
P.; Portugal, L. A.; Reis, O. S.; Souza, A. S., et al. Anal. Chim. Acta, 2007, 597, pp 179-186 (https://
doi.org/10.1016/j.aca.2007.07.011).
22. Amorim, F. A. C.; Costa, V. C.; Guedes, W. N.; Sá, I. P.; Santos, M. C.; Silva, E. G. P.; Lima, D. C. Food
Anal. Methods, 2016, 9, pp 1719-1725 (https://doi.org/10.1007/s12161-015-0296-2).
23. Costa, V. C.; Guedes, W. N.; Santos, A. S.; Nascimento, M. M. Food Anal. Methods, 2018, 11, pp
2004-2012 (https://doi.org/10.1007/s12161-018-1171-8).
24. Hellal, F.; Dachraoui, M. Talanta, 2004, 63 (4), pp 1089-1094 (https://doi.org/10.1016/j.talanta.2004.01.011).
25. Reboucas, M. V.; Santos, J. B.; Pimentel, M. F.; Teixeira, L. S. G. Chemom. Intell. Lab. Syst., 2011,
107 (1), pp 185-193 (https://doi.org/10.1016/j.chemolab.2011.03.007).
26. Silva, D. S.; dos Santos, C. S.; Pando, L. A.; Gomes, M. S. R.; Novaes, C. G.; Dos Santos, W. N. L.;
Bezerra, M. A. Food Chem., 2019, 273, pp 71-76 (https://doi.org/10.1016/j.foodchem.2018.02.049).
27. Ferreira-Nunes, R.; Gratieri, T.; Gelfuso, G. M.; Cunha-Filho, M. J. Pharm. Biomed. Anal., 2018, 149,
pp 612-617 (https://doi.org/10.1016/j.jpba.2017.11.069).
28. Li, N.; Shi, C.; Zhang, Z.; Wang, H.; Liu, Y. Compos. Part B Eng., 2019, 178, pp 1-14 (https://doi.
org/10.1016/j.compositesb.2019.107490).
29. Bezerra, M. A.; Lemos, V. A.; Novaes, C. G.; de Jesus, R. M.; Souza-Filho, H. R.; Araújo, A. S.; Alves,
J. P. S. Microchem. J., 2020, 152, pp 1-13 (https://doi.org/10.1016/j.microc.2019.104336).
30. Ai, M.; Yang, G.; Zhang, R. J. Stat. Plan. Inference., 2006, 136 (4), pp 1493-1511 (https://doi.
org/10.1016/j.jspi.2004.10.001).
31. Pistone, G.; Rogantin, M. P. J. Stat. Plan. Inference., 2008, 138 (3), pp 787-802 (https://doi.
org/10.1016/j.jspi.2007.02.007).
32. Han, X.; Liu, M. Q.; Yang, J. F.; Zhao, S. J. Stat. Plan. Inference., 2020, 204, pp 206-216 (https://doi.
org/10.1016/j.jspi.2019.04.012).
33. Libbrecht, W.; Deruyck, F.; Poelman, H.; Verberckmoes, A.; Thybaut, J.; Clercq, J. D.; Voort, P. V. D.
Chem. Eng. J., 2015, 259, pp 126-134 (https://doi.org/10.1016/j.cej.2014.07.113).
34. Gabbay, R. S.; Kenett, R. S.; Scaffaro, R.; Rubinstein, A. Eur. J. Pharm. Sci., 2018, 125, pp 102-109
(https://doi.org/10.1016/j.ejps.2018.09.020).
24Braz. J. Anal. Chem., 2021, 8 (30), pp 14-28.
35. Pereira, A. C.; Reis, M. S.; Leça, J. M.; Rodrigues, P. M.; Marques, J. C. Chemom. Intell. Lab. Syst.,
2018, 179, pp 73-81 (https://doi.org/10.1016/j.chemolab.2018.06.010).
36. Harman, R.; Pronzato, L. Stat. Probab. Lett., 2007, 77 (1), pp 90-94 (https://doi.org/10.1016/j.spl.2006.05.014).
37. Khaw, K. W.; Chew, X.; Yeong, W. C.; Lim, S. L. Chemom. Intell. Lab. Syst., 2019, 186, pp 33-40
(https://doi.org/10.1016/j.chemolab.2019.02.001).
38. Abdel-Raoof, A. M.; Said R. A. M.; Emara, M. S.; El-Desouky, E. A.; Abdelzaher, A. M.; Hasan, M. A.;
Osman, A. E. Spectrochim. Acta - Part A, 2020, 235, pp 1-7 (https://doi.org/10.1016/j.saa.2020.118313).
39. Dispas, A.; Avohou, H. T.; Lebrun, P.; Hubert, P.; Hubert, C. TrAC, Trends Anal. Chem., 2018, 101, pp
24-33 (https://doi.org/10.1016/j.trac.2017.10.028).
40. Krait, S.; Heuermann, M.; Scriba, G. K. E. J. Sep. Sci., 2018, 41, pp 1405-1413 (https://doi.org/10.1002/
jssc.201701166).
41. Francisco, F. L.; Saviano, A. M.; Pinto, T. J. A.; Lourenço, F. R. Curr. Anal. Chem., 2016, 12, pp 620-
627 (https://doi.org/10.2174/15734110126661601122304 07).
42. Hashem, H.; El-Sayed, H. M. Microchem. J., 2018, 143, pp 55-63 (https://doi.org/10.1016/j.microc.2018.07.031).
43. Tol, T.; Kadam, N.; Raotole, N.; Desai, A.; Samanta, G. J. Chromatogr. A, 2016, 1432, pp 26-38
(http://dx.doi.org/10.1016/j.chroma.2015.12.080).
44. Mohamed, A. M. I.; Abdel-Wadood, H. M.; Mousa, H. S. New J. Chem., 2016, 40, pp 8424-8437
(https://doi.org/10.1039/C5NJ03719K).
45. Kozaki, M.; Kobayashi, S. I.; Goda, Y.; Okuda, H.; Sakai-Kato, K. Chem. Pharm. Bull., 2017, 65, pp
218-228 (https://doi.org/10.1248/cpb.c16-00415).
46. Rathore, A. S. TrAC, Trends in Biotechnol., 2009, 27 (9), pp 546-553 (https://doi.org/10.1016/j.
tibtech.2009.06.006).
47. Terzić, J.; Popović, I.; Stajić, A.; Tumpa, A.; Jančić-Stojanović, B. J. Pharm. Biomed., 2016, 125, pp
385–393 (http://dx.doi.org/10.1016/j.jpba.2016.04.022).
48. Kasagić-Vujanović, I.; Jančić-Stojanović, B. J. Pharm. Biomed., 2019, 173, pp 86–95 (https://doi.
org/10.1016/j.jpba.2019.05.026).
49. Sylvester, B.; Tefas, L.; Vlase, L.; Tomuta, I.; Porfire, A. J. Pharm. Biomed., 2018, 158, pp 395–404
(https://doi.org/10.1016/j.jpba.2018.06.018).
50. Sankar, A.; Palani, S.; Velayudham, R. Anal. Chem. Insights, 2017, 12, pp 1-11 (https://doi.
org/10.1177/1177390117726776).
51. Sandhu, P. S.; Beg, S.; Kumar, R.; Katare, O. P.; Singh, B. J. Liq. Chromatogr. Relat. Technol., 2017,
40 (10), pp 506-516 (https://doi.org/10.1080/10826076.2017.1329744).
52. Saroj, S.; Jairaj, V.; Rathod, R. J. Liq. Chromatogr. Relat. Technol., 2017, 40 (7), pp 340-352 (http://
dx.doi.org/10.1080/10826076.2017.1304414).
53. Mukthinuthalapati, M. A.; Bukkapatnam, V.; Kallepalli, P. J. Chromatogr. Sci., 2019, 57 (4), pp 339-348
(https://doi.org/10.1093/chromsci/bmz003).
54. Awotwe-Otoo, D.; Agarabi, C.; Faustino, P. J.; Habib, M. J.; Lee, S.; Khan, M. A.; Shaha, R. B. J.
Pharm. Biomed. Anal., 2012, 62, pp 61–67 (https://doi.org/10.1016/j.jpba.2012.01.002).
55. Dobricic, V.; Vukadinovic, D.; JancicStojanovic, B.; Vladimirov, S.; Cudina, O. Chromatographia, 2017,
80, pp 1199–1209 (https://doi.org/10.1007/s10337-017-3330-2).
56. Beg, S.; Jainb, A.; Kaur, R.; Panda, S. S.; Katare, O. P.; Singh, B. J. Liq. Chromatogr. Relat. Technol.,
2016, 39 (13), pp 587–597 (http://dx.doi.org/10.1080/10826076.2016.1206023).
57. Sharma, R.; Kamboj, S.; Khurana, R.; Singh, G.; Rana, V. Carbohyd. Polym., 2015, 134, pp 364-374
(http://dx.doi.org/10.1016/j.carbpol.2015.07.073).
58. Schmidt, A. H.; Stanic, M.; Molnár, I. J. Pharm. Biomed. Anal., 2014, 91, pp 97-107 (http://dx.doi.
org/10.1016/j.jpba.2013.12.023).
59. Thanki, K.; Papai, S.; Lokras, A.; Rose, F.; Falkenberg, E.; Franzyk, H.; Foged, C. Pharm Res.,
2019, 36, pp 1-15 (https://doi.org/10.1007/s11095-018-2566-3).
25Key Information Related to Quality by Design (QbD) Applications in Analytical Methods Development
60. Bade, P. D.; Kotu, S. P.; Rathore, A. S. J. Sep. Sci., 2012, 35, pp 3160-3169 (https://doi.org/10.1002/
jssc.201200476).
61. Huang, J.; Kaul, G.; Utz, J.; Hernandez, P.; Wong, V.; Bradley, D.; Nagi, A.; O’Grady, D. J. Pharm. Sci.,
2010, 99 (7), pp 3205–3212 (https://doi.org/10.1002/jps.22089).
62. Rosas, J. G.; Blanco, M.; Alez, J. M. G. J. Pharm. Sci., 2011, 100, pp 4432–4441 (https://doi.
org/10.1002/jps.22611).
63. Pasquini, B.; Orlandini, S.; Bubba, M. D.; Bertol, E.; Furlanetto, S. Electrophoresis, 2015, 36, pp 2650-
2657 (https://doi.org/10.1002/elps.201400472).
64. Grangeia, H. B.; Silva, C.; Simões, S. P.; Reis, M. S. Eur. J. Pharm. Biopharm., 2020, 147, pp 19-37
(https://doi.org/10.1016/j.ejpb.2019.12.007).
65. Ferreira, S. L. C.; Korn, M. G. A.; Ferreira, H. S.; Silva, E. G. P.; Araújo, R. G. O.; Souza, A. S.;
Macedo, S. M.; Lima, D. C.; Jesus, R. M.; Amorim, F. A. C.; Bosque-Sendra, J. M. Appl. Spectrosc.
Rev., 2007, 42, pp 475–491 (https://doi.org/10.1080/05704920701551506).
66. Ferreira, S. L. C.; Lemos, V. A.; Carvalho, V. S.; Silva, E. G. P.; Queiroz, A. F. S.; Felix, C. S. A.;
Silva, D. L. F.; Dourado, G. B.; Oliveira, R. V. Microchem. J., 2018, 140, pp 176–182 (https://doi.
org/10.1016/j.microc.2018.04.002).
67. Vicente, G.; Coteron, A.; Martinez, M.; Aracil, J. Ind. Crops. Prod., 1998, 8, pp 29–35 (https://doi.
org/10.1016/S0926-6690(97)10003-6).
68. Wu, J. X.; Berg, F. V. D.; Søgaard, S. V.; Rantanen, J. J. Pharm. Sci., 2013, 102, pp 904–914 (https://
doi.org/10.1002/jps.23409).
69. Debrus, B.; Guillarme, D.; Rudaz, S. J. Pharm. Biomed., 2013, 84, pp 215-223 (http://dx.doi.
org/10.1016/j.jpba.2013.06.013).
70. Talluri, M. V.; Kalariya, P. D.; Dharavath, S.; Shaikh, N.; Garg, P.; Ramisetti, N. R.; Ragampeta, S. J.
Sep. Sci., 2016, 39 (18), pp 3528-3535 (https://doi.org/10.1002/jssc.201501405).
71. Mohammed, A. Q.; Sunkari, P. K.; Mohammed, A. B.; Srinivas, P.; Roy, A. K. Org. Process. Res. Dev.,
2015, 19 (11), pp 1645-1654 (https://doi.org/10.1021/op500297g).
72. Krait, S.; Scriba, G. K. E. Electrophoresis, 2018, 39 (20), pp 2575–2580 (https://doi.org/10.1002/
elps.201800100).
73. Garg, L. K.; Reddy, V. S.; Sait, S. S.; Krishnamurthy, T.; Vali, S. J.; Reddy, A. M. Chromatographia,
2013, 76, pp 1697–1706 (https://doi.org/10.1007/s10337-013-2509-4).
74. Shakya, A. K. Orient. J. Chem., 2016, 32 (2), pp 777–788 (http://dx.doi.org/10.13005/ojc/320203).
75. Petrusevska, V.; Krtalic, I.; Rasic, A.; Mornar. A. Anal. Methods, 2019, 11, pp 1777–1787 (https://doi.
org/10.1039/C9AY00117D).
76. Yang, S. H.; Wang, J.; Zhang, K. J. Chromatogr. A, 2017, 1492, pp 89-97 (http://dx.doi.org/10.1016/j.
chroma.2017.02.074).
77. Debrus, B.; Lebrun P.; Hubert, Ph.; Schofield, T.; Marini, R. D.; Rudazm S.; Boulanger, B.; Rozet, E.;
Mbinze, J. K. LCGC Europe, 2013, 26, pp 370-377. Available from: http://www.chromatographyonline.
com/new-method-quality-design-robust-optimization-liquid-chromatography?id=&pageID=1&sk=&da
te= [Accessed 20 October 2019].
78. Hubert, C.; Lebrun, P.; Houari, S.; Ziemons, E.; Rozet, E.; Hubert, Ph. J. Pharm. Biomed., 2014, 88,
pp 401-409 (http://dx.doi.org/10.1016/j.jpba.2013.09.026).
79. Jain, A.; Beg, S.; Saini, S.; Sharma, T.; Katare, O. P.; Singh, B. J. Liq. Chromatogr. Relat. Technol.,
2019, 42, pp 502-512 (https://doi.org/10.1080/10826076.2019.1626742).
80. Sharma, T.; Khurana, R. K.; Jain, A.; Katare, O. P.; Singh, B. Biomed. Chromatogr., 2018, 32, pp 1-15
(https://doi.org/10.1002/bmc.4169).
81. Trichta, E. V.; Geurink, L.; Backus, H.; Germano, M.; Somsen, G. W.; Griend, C. E. S. V. Talanta, 2017,
166, pp 8-14 (http://dx.doi.org/10.1016/j.talanta.2017.01.013).
82. Garg, L. K.; Sait, S. S.; Krishnamurthy, T.; Kumar, C. H. R. P. J. Liq. Chromatogr. Relat. Technol.,
2015, 38 (6), pp 677-686 (https://doi.org/10.1080/10826076.2014.951766).
26Braz. J. Anal. Chem., 2021, 8 (30), pp 14-28.
83. Miloševic, N.; Vemic, A.; Čolovic, J.; Kostic, N.; Malenovic, A. Chromatographia, 2017, 80, pp 585–592
(https://doi.org/10.1007/s10337-017-3275-5).
84. Djuris, J.; Medarevic, D.; Krstic, M.; Djuric, Z.; Ibric, S. J. Pharm. Sci., 2013, 102, pp 1869-1882
(https://doi.org/10.1002/jps.23530).
85. Yao, H.; Vancoillie, J.; D’Hondt, M.; Wynendaele, E.; Bracke, N.; Spiegeleer, B. D. J. Pharm. Biomed.,
2016, 117, pp 232-239.
86. Dormenval, C.; Lokras, A.; Cano-Garcia, G.; Wadhwa, A.; Thanki, K.; Rose, F.; Thakur, A.; Franzyk,
H.; Foged, C. Pharm. Res., 2019, 36, pp 1-15 (https://doi.org/10.1007/s11095-019-2663-y).
87. Colobatiu, L.; Gavan, A.; Mocan, A.; Bogdan, C.; Mirel, S.; Tomuta, I. React. Funct. Polym., 2019, 138,
pp 46–54 (https://doi.org/10.1016/j.reactfunctpolym.2019.02.013).
88. Herneisey, M.; Lambert, E.; Kachel, A.; Shychuck, E.; Drennen III, J. K.; Janjic, J. M. Molecules, 2019,
24, pp 1-20 (https://doi.org/10.3390/molecules24112066).
89. Wu, H.; Khan, M. A. J. Pharm. Sci., 2009, 98 (10), pp 2784-2798 (https://doi.org/10.1002/jps.21646).
90. Reid, G. L.; Cheng, G.; Fortin, D. T.; Harwood, J. W.; Morgado, J. E.; Wang, J.; Xue, G. J. Liq.
Chromatogr. Relat. Technol., 2013, 36, pp 2612-2638 (https://doi.org/10.1080/10826076.2013.7654
57).
91. Agrawal, V. P.; Desai, S. S.; Jani, G. K. Eurasian J. Anal. Chem., 2016, 11 (2), pp 63-78 (https://doi.
org/10.12973/ejac.2016.122a).
92. Basso, J.; Mendes, M.; Cova, T. F. G. G.; Sousa, J. J.; Pais, A. A. C. C.; Vitorino, C. Anal. Methods,
2018, 10, pp 5659-5671 (https://doi.org/10.1039/c8ay01695j).
93. Joshi, V. S.; Kumar, V.; Rathore, A. S. J. Chromatogr. A, 2017, 1491, pp 145-152 (http://dx.doi.
org/10.1016/j.chroma.2017.02.058).
94. Kochling, J.; Wu, W.; Hua, Y.; Guan, Q.; Castaneda-Merced, J. J. Pharm. Biomed., 2016, 125, pp 130-
139 (http://dx.doi.org/10.1016/j.jpba.2016.03.031).
95. Pathak, M.; Chaudhary, N.; Rathore, A. S. J. Pharm. Biomed., 2014, 92, pp 119–126 (http://dx.doi.
org/10.1016/j.jpba.2014.01.007).
96. Draheim, C.; Crécy, F.; Hansen, S.; Collnot, E. M.; Lehr, C. M. Pharm. Res., 2015, 32, pp 2609-2624
(https://doi.org/10.1007/s11095-015-1647-9).
97. Agarabi, C. D.; Schiel, J. E.; Lute, S. C.; Chavez, B. K.; Boyne, M. T.; Brorson, K. A.; Khan, M. A.;
Read, E. K. J. Pharm. Sci., 2015, 104, pp 1919–1928 (https://doi.org/10.1002/jps.24420).
98. Kormány, R.; Tamás, K.; Guillarme, D.; Fekete, S. J. Pharm. Biomed. Anal., 2017, 146, pp 220-225
(http://dx.doi.org/10.1016/j.jpba.2017.08.032).
99. Hubert, C.; Hauari, S.; Rozet, E.; Lebrun, P.; Hubert, Ph. J. Chromatogr. A, 2015, 1395, pp 88-98
(http://dx.doi.org/10.1016/j.chroma.2015.03.059).
100. Ismail, R.; Sovány, T.; Gácsi, A.; Ambrus, R.; Katona, G.; Imre, N.; Csóka, I. Pharm. Res., 2019, 36,
pp 1-16 (https://doi.org/10.1007/s11095-019-2620-9).
101. Bracke, N.; Barhdadi, S.; Wynendaele, E.; Gevaert, B.; D’Hondt, M.; Spiegeleer, B. Sens. Actuators
B, 2015, 210, pp 103-112 (http://dx.doi.org/10.1016/j.snb.2014.12.092).
102. Yerlikaya, F.; Ozgen, A.; Vural, I.; Guven, O.; Karaagauglu, E.; Khan, M. A.; Capan, Y. J. Pharm. Sci.,
2013, 102, pp 3748-3761 (https://doi.org/10.1002/jps.23686).
103. Girotra, P.; Singh, S. K.; Kumar, G. Int. J. Biol. Macromol., 2016, 85, pp 92-101 (http://dx.doi.
org/10.1016/j.ijbiomac.2015.12.069).
104. Nagashima, H.; Watari, A.; Shinoda, Y.; Okamoto, H.; Takuma, S. J. Pharm. Sci., 2013, 102, pp 4274-
4283 (https://doi.org/10.1002/jps.23744).
105. Paul, J.; Jensen, S.; Dukart, A.; Cornelissen, G. J. Chromatogr. A, 2014, 1366, pp 38–44 (http://dx.doi.
org/10.1016/j.chroma.2014.09.029).
106. Panda, S. S.; Sharma, K.; Mohanty, B.; Bera, R. K. V. V.; Acharjya, S. K.; Sarwar, B. J. Liq. Chromatogr.
Relat. Technol., 2017, 40 (19), pp 951–958 (https://doi.org/10.1080/10826076.2017.1387558).
27Araújo, A. S.; Andrade, D. F.; Babos, D. V.; Castro, J. P.; Garcia, J. A.; Sperança, M. A.; Gamela, R.
R.; Machado, R. C.; Costa, V. C.; Guedes, W. N.; Pereira-Filho, E. R.; Pereira, F. M. V. .
107. Debrus, B.; Lebrun, P.; Kindenge, J. M.; Lecomte, F.; Ceccato, A.; Caliaro, G.; Mbay, J. M. T.; Boulanger,
B.; Marini, R. D.; Rozet, E.; Hubert, Ph. J. Chromatogr. A, 2011, 1218 (31), pp 5205–5215 (https://doi.
org/10.1016/j.chroma.2011.05.102).
108. Patel, M.; Kothari, C. Biomed. Chromatogr., 2019, 33 (10), pp 1-10 (https://doi.org/10.1002/bmc.4607).
109. Mandenius, C. F.; Brundin, A. Biotechnol. Prog., 2008, 24 (6), pp 1191-1203 (https://doi.org/ 10.1002/
btpr.67).
110. Venkatesh, M. P.; Philip, A.; Gangadharappa, H. V. Int. J. Pharm. Sci. Res., 2019, 10 (3), pp 1095-
1100 (http://dx.doi.org/10.13040/IJPSR.0975-8232.10(3).1095-00).
111. Bezerra, M. A.; Santos, Q. O.; Santos, A. G.; Novaes, C. G.; Ferreira, S. L. C.; Souza, V. S.
Microchem. J., 2016, 124, pp 45–54 (http://dx.doi.org/10.1016/j.microc.2015.07.023).
112. Ferreira, S. L. C.; Bruns, R. E.; Ferreira, H. S.; Matos, G. D.; David, J. M.; Brandao, G. C.; da Silva, E.
G. P.; Portugal, L. A.; dos Reis, P. S.; Souza, A. S., et al. Anal. Chim. Acta, 2007, 597 (2), pp 179-186
(http://doi.org/10.1016/j.aca.2007.07.011).
113. Pereira, F. M. V.; Pereira-Filho, E. R. Quím. Nova, 2018, 41 (9), pp 1061-1071 (http://dx.doi.
org/10.21577/0100-4042.20170254).
114. Mokhtar, H. I.; Abdel-Salam, R. A.; Hadad, G. M. Chromatographia, 2015, 78, pp 457–466 (https://doi.
org/10.1007/s10337-015-2858-2).
115. Schmidt, A. H.; Wess, C. J. Liquid. Chromatogr. Relat. Technol., 2014, 37 (18), pp 2653–2666 (https://
doi.org/10.1080/10826076.2013.853312).
116. Arai, H.; Suzuki, T.; Yada, S.; Kaseda, C.; Onuki, Y.; Takayama, K. Chem. Pharm. Bull., 2011, 59 (5),
pp 608-617 (https://doi.org/10.1248/cpb.59.608).
117. Nistor, I.; Lebrun, P.; Ceccato, A.; Lecomte, F.; Slama, I.; Oprean, R.; Badarau, E.; Dufour, F.; Dossou,
K. S. S.; Fillet, M., et al. J. Pharm. Biomed. Anal., 2013, 74, pp 273-283 (http://dx.doi.org/10.1016/j.
jpba.2012.10.015).
118. Jambo, H.; Dispas, A.; Avohou, H. T.; André, S.; Hubert, C.; Lebrun, P.; Ziemons, E.; Hubert, P. J.
Chromatogr. B, 2018, 1092, pp 332-342 (https://doi.org/10.1016/j.jchromb.2018.05.049).
119. Kurmi, M.; Kumar, S.; Singh, B.; Singh, S. J. Pharm. Biomed. Anal., 2014, 96, pp 135-143 (http://
dx.doi.org/10.1016/j.jpba.2014.03.035).
120. Maeda, J.; Suzuki, T.; Takayama, K. Chem. Pharm. Bull., 2012, 60 (9), pp 1155-1163 (https://doi.
org/10.1248/cpb.c12-00340).
121. Mokhtar, H. I.; Abdel-Salam, R. A.; Hadad, G. M. J. Chromatogr. A., 2015, 1399, pp 32-44 (http://
dx.doi.org/10.1016/j.chroma.2015.04.038).
122. Taraji, M.; Haddad, P. R.; Amos, R. I. J.; Talebi, M.; Szucs, R.; Dolan, J. W.; Pohl, C. A. Anal. Chem.,
2017, 89 (3), pp 1870-1878 (https://doi.org/10.1021/acs.analchem.6b04282).
123. Chhatre, S.; Farid, S. S.; Coffman, J.; Bird, P.; Newcombe, A. R.; Titchener-Hooker, N. J. J. Chem.
Technol. Biotechnol., 2011, 86 (9), pp 1125–1129 (https://doi.org/10.1002/jctb.2628).
124. Saviano, A. M.; Francisco, F. L.; Ostronoff, C. S.; Lourenço, F. R. J. AOAC Int., 2015, 98 (5), pp 1267-
1275 (https://doi.org/10.5740/jaoacint.15-074).
125. Kormány, R.; Molnár, I.; Fekete, J. J. Pharm. Biomed., 2017, 135, pp 8-15 (http://dx.doi.org/10.1016/j.
jpba.2016.11.050).
126. Sun, X. T.; Tan, Q. J.; Wang, S. X.; Shan, J. F.; Jiang, J. L. Anal Methods, 2015, 7 (13), pp 5428-5435
(https://doi.org/10.1039/C5AY01000D).
127. Nadella, N. P.; Ratnakaram, V. N.; Srinivasu, N. J. Liq. Chromatogr. Relat. Technol., 2017, 40 (10), pp
517-527 (https://doi.org/10.1080/10826076.2017.1330211).
28You can also read