QBD ENABLED OPTIMIZATION OF SOLVENT SHIFTING METHOD FOR FABRICATION OF PLGA BASED NANOPARTICLES FOR PROMISING DELIVERY OF CAPECITABINE FOR ...
←
→
Page content transcription
If your browser does not render page correctly, please read the page content below
QbD Enabled Optimization of Solvent Shifting Method for Fabrication of PLGA Based Nanoparticles for Promising Delivery of Capecitabine for Antitumor Activity Goutam Kumar Jena ( goutam2902@gmail.com ) Roland Institute of Pharmaceutical Sciences https://orcid.org/0000-0002-0374-5433 Ch Niranjan Patra Roland Institute of Pharmaceutical Sciences Kahnu Charan Panigrahi Roland Institute of Pharmaceutical Sciences Jammula Sruti Roland Institute of Pharmaceutical Sciences Parameswar Patro BITS: Birla Institute of Technology and Science Rabinarayan Parhi Assam University Research Article Keywords: Capecitabine, PLGA, Quality by Design (QbD), MTT assay, Cytotoxic Potential, DoE DOI: https://doi.org/10.21203/rs.3.rs-501109/v1 License: This work is licensed under a Creative Commons Attribution 4.0 International License. Read Full License
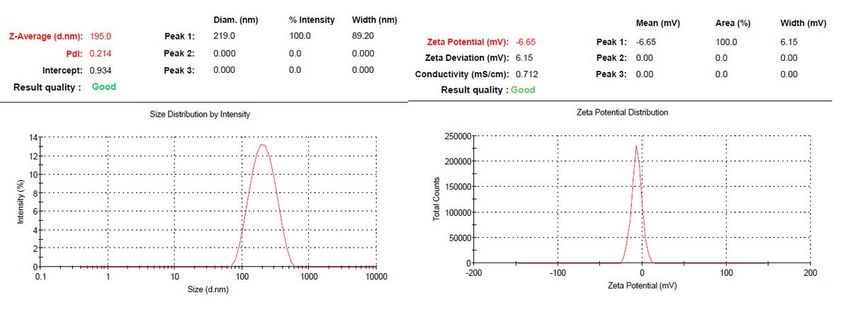
QbD Enabled Optimization of Solvent Shifting Method for Fabrication of PLGA Based Nanoparticles for
 Promising Delivery of Capecitabine for Antitumor Activity
 Goutam Kumar Jena1, Ch Niranjan Patra1, Kahnu Charan Panigrahi1, Jammula Sruti1, Parameswar Patra2,
 Rabinarayan Parhi3
 1.
 Department of Pharmaceutics, Roland Institute of Pharmaceutical Sciences, Berhampur, Odisha, India
 2. Department of Pharmacy, BITS Pilani, Hyderabad Campus, India
3. Department of Pharmaceutical Sciences, Susruta School of Medical and Paramedical Sciences, Assam University
 (A Central University), Silchar, Assam, India

Abstract:

 The key objective of the current research was to fabricate and optimize Capecitabine loaded PLGA based

nanoparticles (NPs) by enabling Quality by Design (QbD) approach for enhancing antitumor activity by promising

delivery of the drug at the colonic site. The current research was based on fabricating PLGA based nanoparticles

along with eudragit S100 as enteric polymer employing solvent shifting method followed by optimization using

QbD approach. This approach was found to be useful for understanding the multiple factors and their interaction

influencing the product by utilizing Design of Experiment (DOE). Box- Behken Design (BBD) was adopted to

achieve the required critical quality attributes (CQAs) i.e. minimizing particle size, maximizing entrapment

efficiency and minimizing PDI value. The optimized nanoparticles were lyophilized and characterized by FT-IR,

DSC, TEM, DLS, MTT assay using HT-29 cell lines and in vivo pharmacokinetic studies. The optimized PLGA

based nanoparticles were found to possess average particle size, PDI, zeta potential as well as entrapment efficiency

of 195 nm, 0.214, -6.65 mV and 65% respectively. TEM analysis revealed the spherical nature of nanoparticles. The

FT-IR and DSC studies revealed no interaction. The bioavailability of Capecitabine loaded nanoparticles was found

to be two fold increased than the pure drug and also it exhibited significantly more cytotoxic to tumor cells as

compared to pure drug as confirmed by MTT assay using HT 29 cell lines. The optimized PLGA based

nanoparticles found to possess enhanced bioavailability and significantly more cytotoxic potential i.e. antitumor

activity as compared to pure drug.

Keywords: Capecitabine; PLGA; Quality by Design (QbD); MTT assay; Cytotoxic Potential; DoE

Graphical Abstract

 1
1. Introduction

Capecitabine is a prodrug of 5-Fluorouracil (5 FU) with antineoplastic activity. It is highly recommended for the

treatment of advanced stage of colorectal cancer and metastatic breast cancer [1,2]. It has short tenure of elimination

half-life of about 2 h [3]. It is available in the market as film coated tablet. It is highly unstable in acidic medium. Its

ultra-short elimination half-life may lead to increase in dosing frequency, side effect and decrease in patient

compliance [4].

This prodrug is tumor-activated to cytotoxic moiety as 5 FU by the enzyme thymidine phosphorylase. This enzyme

is found abundance in tumor cells as compared to normal cells. The 5 FU is further activated to two active

metabolites which cause cell injury by two different mechanisms i.e. by inhibition of DNA as well as protein

synthesis [5]. Our research was concentrated to fabricate and optimize the Capecitabine loaded PLGA based

nanoparticles by solvent shifting method implementing Quality by Design (QbD) platform which would boost drug

availability at the target site with more cytotoxic potential to colon tumor cells.

PLGA is a USFDA approved biodegradable and biocompatible co-polymer of lactic and glycolic acid [6]. The most

common method for developing PLGA nanoparticles i.e. by nanoprecipitation method may lead to low entrapment

efficiency for hydrophilic drugs as reported in the literature [7], but of course it is not an issue for hydrophobic

drugs. Hence hydrophobic drug i.e. Capecitabine has been selected in our research.

The purpose of including Eudragit S 100 in the optimized batch is to prevent premature release in the gastric

environment as it is a pH sensitive polymer.

Nanotechnology based delivery of drugs has emerged as the most promising approach to address all the challenges

associated with conventional delivery approach of drugs and again the Polymeric nanoparticles have generated huge

interest among researchers last few decades as an effective drug delivery carrier [8,9]. There are different methods

available for synthesizing nanoparticles but nanoprecipitation method is widely accepted as it is the simplest

technique of few steps [10,11].

 2
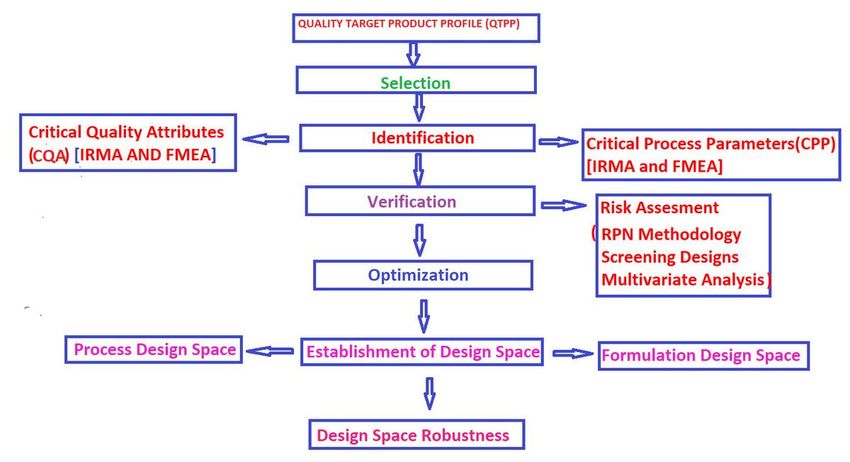
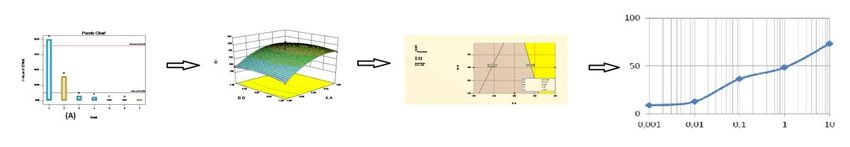
The optimization of formulation and process parameters for synthesis of nanoparticles is very complex when

classical optimization technique was being adopted. In classical optimization process one factor at a time was being

adopted which was very complicated, time consuming and tedious. In order to overcome the barriers arisen due to

classical optimization technique, a systematic, modern technique was adopted in our research known as QbD

(Quality by Design) technique. This technique not only eradicates the problems of classical optimization technique

but also has some additional benefits like taking into account the interaction among different independent variables

and their impact on the critical quality attributes (CQAs). In the QbD technique, at first QTPP (Quality Target

Product Profile) is fixed based on the desired quality to be built into the product. Based on the QTPP, Critical

quality attributes (CQAs) are identified [12,13]. The factors which influence the CQAs known as CMAs (Critical

Material Attributes) and CPPs (Critical Process Parameters are decided and the impact of CMAs and CPPs on CQAs

are investigated [14,15]. The different steps involved in QbD approach was summarized in Fig. 1. In our research

from the preliminary investigation and knowledge gained through the literature reports seven factors are identified

and screened using Taguchi Orthogonal Array method to investigate the main effects by using licensed Design

Expert version 8.0.6. The Pareto chat and ANOVA table obtained from Taguchi method three independent variables

and three dependent variables were selected. Then the Box-Behnken Design (BBD) are adopted to study the impacts

of CMAs (Conc, of PLGA and Conc. of Poloxamer 188) and CPPs (Amplitude of sonication) on CQAs (Particle

size, Entrapment efficiency and Polydispersity index) and to optimize the nano formulations. In BBD, seventeen

nanoformulations are fabricated using solvent shifting technique [16,17], and evaluated and the results are analyzed.

From the counter plots as well as 3D surface plots the effects of independent variables on dependent variables are

interpreted and finally the formulations are optimized using numerical as well as graphical technique. The overlay

plot obtained during optimization revealed that the operating conditions are coming under the design space. The

optimized formulation is used for cytotoxicity study using HT 29 cell lines and in vivo study by using Rabbit model.

2. Materials and Methods

2.1 Materials Capecitabine, Poloxamer 188 and PLGA (Lactide: Glycolide 50:50) were received as a gift sample

from Ra Chem pharma Ltd, Hyderabad, India. The acetone and mannitol were purchased from Sigma Aldrich, India.

All other chemicals used in the experiment were of high purity. The double distilled water was used throughout the

experiment.

 3
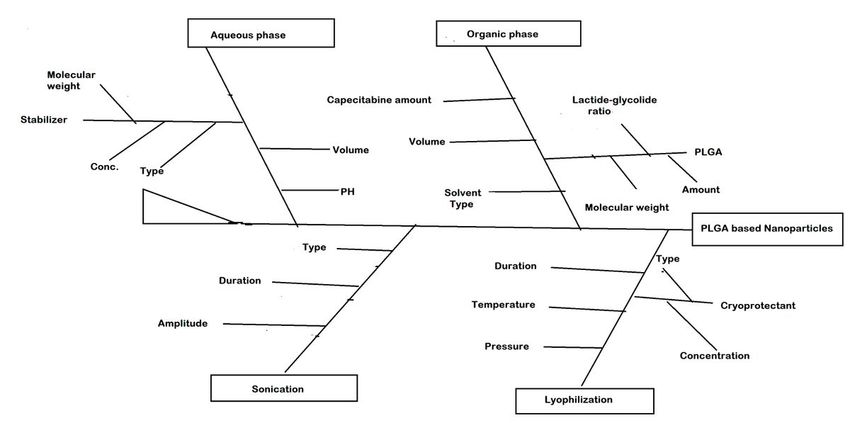
2.2 Method of preparation of PLGA based nanoparticles The nanoparticles were prepared by modified solvent

shifting method [18–20]. Briefly, required amount of Capecitabine and PLGA as depicted in Table 1 were dissolved

in 10 ml of acetone which constitutes the organic phase. Then 1 mL of organic phase was directly injected into the

19 mL of aqueous phase containing 1% Poloxamer 188 as stabilizer and followed by stirring using a magnetic bead

at required rpm for 1h in order to remove acetone followed by sonication at 60% amplitude for 3 sec for producing

uniform dispersion and size reduction. Then the nanosuspension was filtered and subjected to lyophilization using

mannitol as cryoprotectant at -500C temperature and 0.045 Torr of pressure. The lyophilized products were stored in

desiccator until further used.

The optimized batch was prepared same as the above mentioned method except Eudragit S100 was added as same

quantity as PLGA.

2.3 Quality Target Product Profile (QTPP) and Critical Quality Attributes (CQAs)

QTPP is the predestined expected attributes of drug product in a nutshell, prerequisite to establish desired quality

with respect to safety and efficacy as well as promotes diagnosing CQAs of the product [21]. QTPP was resolved

based on regulatory aspects, scientific aspects, practical aspects as well as risk assessments as portrayed in Table 2.

CQAs are evolved from the QTPP and are employed to navigate the product and process development and also

associated with in process materials i.e. Critical Material Attributes (CMAs) as well as process parameters i.e.

Critical Process Parameters (CPPs) for fabricating nanomaterials [22,23]. List of most commonly Critical Quality

Attributes (CQAs) for nanoformulations was presented in Table 3.

2.4 Establishment of Risk by implementing Fishbone diagram

For the recognition of critical material attributes and critical process parameters for the preparation of PLGA based

nanoparticles and to figure out their influence on Critical Quality Attributes (CQAs), a Fishbone diagram was drawn

[24] and portrayed in Figure 2. From the fundamental scientific knowledge gained through the literature survey,

particle size, polydispersity index and entrapment efficiency were assigned as CQAs because these factors have

potential influence on the therapeutic efficacy of drug loaded nanoparticles [14]. Fishbone diagram exhibited twelve

manufacturing and process variables which have tendency to affect the properties of the nanoparticles and hence

these factors are considered for further investigations.

2.5 Qualitative assessment of Risk

 4
Qualitative analysis for selecting CMAs and/or CPPs was carried out by setting up REM (Risk Estimation Matrix)

by allocating low, medium and high risks levels to individual formulation and process variable [25] with their

justification as portrayed in Table 4, Table 5 and Table 6.

2.6 Quantitative assessment of Risk

Quantitative assessment of risk was carried out by implementing FMEA (Failure Mode Effective Analysis) in order

to track likelihood of failure mode native to drug product out[26]. Basing on the impact of each CMA on the dug

product, the ranking scores from 1 to 10 were allocated to each CMA for severity, detectability and risk occurance,

to compute RPN i.e. Risk Priority Number which is calculated from the following formula and presented in Table 7.

 = ( ) × ( ) × ( ) (1)

The Taguchi Design was implemented to the factors native to high RPN for factor screening studies.

2.7 Experimental Design

Taguchi screening design was adopted for scrutinizing the diagnosing factors affecting QTPP. Taguchi screening

design was performed with seven factors at two levels and eight runs using design expert 8.0.6 software. The factors

selected for Taguchi design were detailed with their levels in Table 8. The values of low and high levels were fixed

based on preliminary experiment as well as previously reported literatures [27,28]. Some potential factors such as

Eudragit S100 amount, solvent types were not taken in experimental design in order to avoid unnecessary

complications during manufacturing step. The responses evaluated for screening design were particle size,

Entrapment efficiency and PDI. The obtained data was analyzed by using ANOVA as well as linear regression to

investigate the influence of each independent variable i.e. CMAs and/ or CPPs on responses.

2.8 Optimization of PLGA based nanoparticles by solvent shifting method using Box-Behnken Design

By using Taguchi design and other qualitative as well as quantitative methods, the three factors were screened and

their major impact on the selected responses were observed and subjected to optimization by employing Box-

Behnken Design at three levels [29]. The three levels (-1, 0, 1) were fixed from the preliminary experiment as

portrayed in Table 1. Four factors which were evaluated by Taguchi were kept at fixed level, as their influence on

CQAs were found to be statistically insignificant considering the ANOVA results and Pareto charts from Taguchi

model.

2.9 Enactment of design space and optimization

 5
The design space was endorsed from the prediction plot obtained from the results of Taguchi design as well as

FMEA. The software suggested a batch taking into account desired values of responses. The software suggested

formula was fabricated and subjected to evaluation for desired responses. Each predicted response is compared with

observed response. The aforesaid process was echoed for BBD[30,31].

2.10 Design Space Robustness Analysis

The optimized batch suggested by the software for Taguchi design and BBD were fabricated thrice each for

confirmation of reproducibility and lack of variation.

3. Characterization of PLGA Based Nanoparticles

3.1 Measurement of particle dimension (Size), PDI (polydispersity index) and ZP (Zeta potential)

The nanosuspension was 10 times diluted and subjected to analysis for particle dimension (size), PDI and ZP by the

phenomenon of dynamic light scattering and electrophoresis light scattering employing Malvern Zetasizer.

3.2 Estimation of entrapment efficiency

The nanosuspension was centrifuged at 10,000 rpm for 25 min to sediment the nanoparticles. The clear supernatant

was collected and suitably diluted and analyzed for free Capecitabine content by using UV spectroscopy at 273 nm.

The % EE was calculated using the following formula

 Total amount of Capecitabine − Free Capecitabine
 Entrapment efficiency (% ) = × 100
 Total amount of Capectabine

3.3 In vitro drug release study

The dialysis membrane with molecular weight layoff 12-14 kDa purchased from HiMedia Laboratories Pvt. Ltd.

was kept in Phosphate buffer solution pH 7.4 throughout the night before day of the experiment. Then the dialysis

membrane was opened and 5 mL of nanosuspension was kept inside and both the ends of the dialysis membrane was

closed by dialysis clips and suspended in the dissolution medium.USP II dissolution apparatus was used to carry out

the experiment [32]. The same procedure was followed for Capecitabine in pure form by taking 10 mg of the drug in

5 mL water. The study was performed using 500mL phosphate buffer (pH 7.4) and maintaining temperature at

370C±0.50C and speed of paddle at 50 rpm. The fixed quantity of sample (2mL) was withdrawn at predestined

interval of time and replaced with 2 mL of freshly prepared phosphate buffer solution pH 7.4 in order to keep the

sink condition up. The first 2h dissolution study was performed using 0.1N HCl instead of Phosphate buffer solution

 6
pH 7.4 as the same way as mentioned in the above process. The samples were subjected to recovery, filtration,

suitable dilution and analysis by High Performance Liquid Chromatographic technique.

3.4 In vitro cytotoxicity studies

The cytotoxicity of optimized Capecitabine loaded PLGA based nanoparticles was investigated by MTT test to

assess the cytotoxicity potential of the formulation[23,33]. The HT 29 cell lines were seeded in 96 well plates at a

density of 1.25×10⁴ cells/well and incubated for 24h to allow sufficient adhesion. The different concentrations of

Capecitabine loaded PLGA based nanoparticles and the pure Capecitabine were added to grown cells in 96-well

plates in three replicates and incubated for 24h.

After 24h incubation, cells were washed with phosphate buffer solutions and 15 µL MTT dye solution was added to

each well. The plates were incubated at 370C and 5% CO2 for additional 3h. The medium was discarded and the

formazan crystals were solubilized by adding DMSO to dissolve etrazonium dye. The optical density of each well

was measured at 570 nm in a micro plate reader. The absorbance of untreated culture was set at 100%.

3.5 In vivo pharmacokinetic studies

The experiment on animal was carried out on male rabbits weighing 1.5 kg and procured by Roland institute of

pharmaceutical sciences from Saha enterprises, 386/2 Nilachal, Birati, Kolkata-700051, India. Registration No-

1828/PO/Bt/S/15/C PCSEA. The designed scientific animal experimentation procedure was reassessed and

sanctioned by Roland institute of pharmaceutical sciences, Berhampur, Institutional Animal Ethical Committee

(IAEC), RIPS, Berhampur (IAEC/RIPS/04/2016) on dated 15/07/2016. The all experiments related to animals were

conducted as per the Committee for the Purpose of command and surveillance on Experiments on Animals and the

animal attention directives of RIPS, Berhampur, IAEC having protocol Registration number and date of registration

Reg. No.-926/PO/Re/S/06/CPCSEA and 22/02/2006 respectively.

3.6 Study Design and Blood Sample Collections

The rabbits were randomly selected and placed in two groups having 3 rabbits in each group Both groups were

administered orally with Capecitabine suspension (pure drug) and Capecitabine nanosuspension (optimized

nanoformulations) respectively. Blood samples were collected from the marginal ear vein of each rabbit into

microcentrifuge tubes and allowed to coagulate followed by centrifugation and the supernatant was collected. The

drug was estimated from the collected serum by using HPLC technique using reported method of development(Jena

et al., 2020).

 7
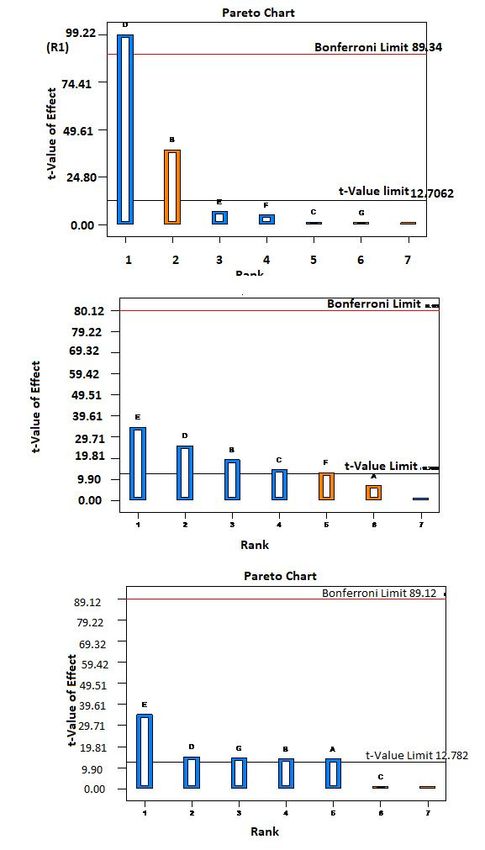
3.7 Transmission Electron Microscopy of Optimized PLGA based nanoparticles Transmission electron microscopy of optimized nanoparticles was performed by placing one drop of diluted nanosuspension on copper grid with subsequent staining with 0.1% phosphotungetic acid operating at 90.0 kv. Magnified image was taken using AMT camera system. 3.8 Fourier Transform Infrared Spectroscopy (FT-IR) Translucent KBr (potassium bromide) pellets were prepared by mixing and triturating PLGA based nanoparticles with KBr and pressing in a mechanical press and analyzed with pure KBr background. The FT-IR spectra were recorded within 400 cm-1 to 4000 cm-1 having resolution of 4 cm-1. 3.9 Differential Scanning Calorimetry Approximately 3-5 mg of sample was weighed and analyzed by DSC using DSC-60 (Shimadzu) with TW-60 collection software. The measurements were performed under inert nitrogen atmospheres with a flow rate of 100mL/min. The samples were heated at 10 0C/min from 300C to 3000C. An empty aluminum pan was employed as a reference standard. 4. Results 4.1 Assessment of risk using Fishbone diagram A fishbone diagram was constructed for identifying most possible risk factors associated with formulation as well as process variables on the critical quality characteristics of Capecitabine loaded PLGA based nanoparticles i.e. average particle size, polydispersity index and percentage entrapment efficiency as portrayed in Fig. 2. Seven most possible risk factors were identified and subjected to further evaluation using Taguchi design. 4.2 Analysis of risk and Optimization Taguchi design with seven factors at two levels was applied to select most important process and formulation factors by taking into account only the main effects. The formulations in Taguchi Design with their limits were portrayed in Table 8 and the pareto charts for screening factors as portrayed in Fig. 3.The final formulation was optimized by implementing Box.Behnken Design (BBD). The leading and dealings effect of tri-independent variants (CMAs and CPPs) on CQAs were evaluated. The effect of independent variables on responses was computed employing polynomial equation from ANOVA analysis as well as three dimentional response surface plot produced by the Design Expert as presented in Fig. 4 The polynomial equations for Particle size (R1), EE (R2) and PDI (R3) were presented as follows. PS (R1) = +221.76 + 12.03 × A + 0.23 × B1.41 × C0.89 × A × B2.65 × A × C0.028 × B × C9.68 × A23.79 × B2 + 0.32 × C2 (1) 8
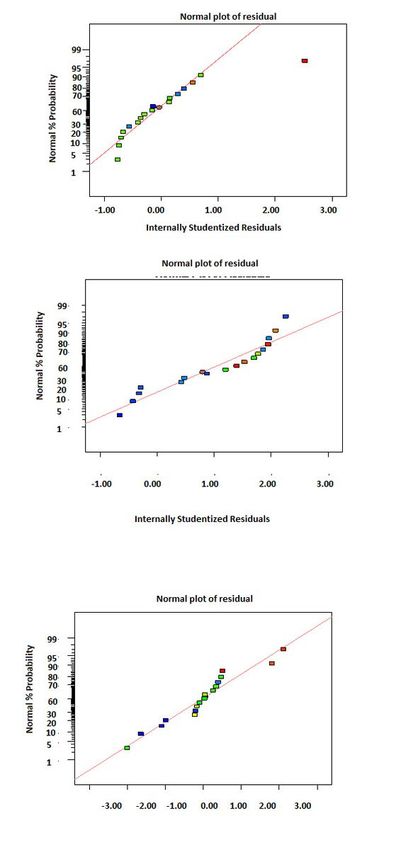
EE(R2) = +62.62118 + 6.25250 × A1.97375 × B0.11125 × C (2) PDI(R3) = +0.530.26 × A0.047 × B + 0.077 × C (3) Where A, B and C are concentration of PLGA, concentration of poloxamer188 and amplitude of sonication respectively. 4.3 Selection of model for particle size The quadratic model for particle size was found to be significant having F value 6.07 and p value 0.0134. The coefficient of regression with a p value < 0.05 implies that the model terms are significant whereas the values greater than 0.1 are insignificant. The predicted R2 value of 0.06942 is very close with the adjusted R2 value of 0.7403 which again indicates the the model is significant. 4.4 Selection of model for Entrapment efficiency(EE) The Linear model for EE was found to be significant having F value 9.21 and p value 0.0016. The coefficient of regression with a p value < 0.05 implies that the model terms are significant whereas the values greater than 0.1 are insignificant. The predicted R2 value of 0.5232 is very close with the adjusted R 2 value of 0.6061 which again indicates the the model is significant. 4.5 Selection of model for polydispersity index(PDI) The quadratic model for particle size was found to be significant having F value 6.11 and p value 0.0080. The coefficient of regression with a p value < 0.05 implies that the model terms are significant whereas the values greater than 0.1 are insignificant. The predicted R2 value of 0.2328 is not close with the adjusted R2 value of 0.4895 which may be attributed due to large block effect. 4.6 Optimization of Critical Material Attributes(CMAs) along with Critical Process Parameters (CPPs) with respect to Critical Quality Attributes (CQAs) The software was fed with the targeted criteria to accomplish the software suggested architechture. One of the software suggested solutions was selected based on the desirability value as a design space and was practically applied for its authentication as portrayed in Fig. 5 and the linear correlation plots between (actual versus predicted) and normal virsus residuals were presented in Fig. 6 and Fig. 7 respectively. The software predicted desirability 9
value was found to be 0.98 which assures 98% predictability to work out the destination with revamped CMAs and CPPs. The more is the value of desirability the more is the chance to obtain the goal. A formulation was fabricated by taking optimized quantities of CMAs and CPPs and its CQAs were scrutinized. The particle size(Z-average), % EE and PDI value of optimized formulation was found to be 195 nm, 75% and 0.214 respectively. As the particle size is under 200nm, the celluar uptake will be enhanced because the cellular uptake depends on the particle size. The entrapment efficiemcy is less which may be attributed due to hydrophobic nature of PLGA.The PDI value < 0.25 signifies that the particles are of uniform size. 4.7 Measurement of zeta potential The zeta potential of the optimized formulation was found to be -6.65 as portrayed in Fig. 8. As the Zeta potential value was found to be very less, the formulation may be less stable and may not in favour of biological uptake but it is forecasted to be secure as negatively charged particles decline the likelihood of cytotoxicity.Due to the presence of negative charge on the surface of the nanoparticles they may undergo nonspecific adsorption to the cellular membrane. 4.8 Estimation of entrapment efficiency The %EE of the optimized formulation was observed to be 72%. From the equation EE(R2) = +62.62118 + 6.25250 × A1.97375 × B0.11125 × C , it indicates that as the coefficients of B and C are negative, increasing the concentration of poloxamer and amplitude of sonication decreases the value of EE whereas as the coefficient of A is positive, increasing the conc. of PLGA increases the value of EE which is also quite in agreement with contour plots and 3D surface plots as portrayed in Figure 4. 4.9 Estimation of dimensional analysis of nanoparticles and PDI The average particle size and PDI value of the optimized nanoparticles were found to be 195nm and 0.214 respectively as portrayed in Figure 8. From the equation no (1) PS (R1) = +221.76 + 12.03 × A + 0.23 × B1.41 × C0.89 × A × B − 2.65 × A × C0.028 × B × C9.68 × A23.79 × B2 + 0.32 × C2 (1) it was observed that the conc. of PLGA has positive impact on particle size but conc. of poloxamer 188 as well as amplitude of sonication have negative impact on it whereas from equation number (3) PDI(R3) = +0.53 0.26 × A0.047 × B + 0.077 × C (3) 10
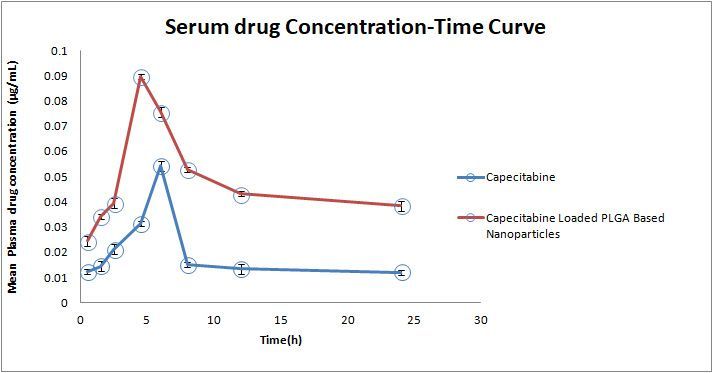
it was observed that both the conc. of PLGA and poloxamer 188 have negative impact and amplitude of sonication

has positive impact on PDI.

4.10 In Vitro drug diffusion study

USP Type II dissolution apparatus was used to carry out in vitro drug release studies. In order to maintain the

desired temperature and simulate biological conditions throughout the experiment this apparatus was preferred

which is not possible in case of drug diffusion studies. It was observed that initially up to 2h in 0.1N HCl negligible

quantity of drug released due to presence of Eudragit S100 as pH sensitive polymer followed by very slow rate of

drug release up to 4h in phosphate buffer solution pH 7.4 which may be attributed due to slow diffusion of drug

from the stagnant layer formed by the outermost layer PLGA. This observation revealed that drug was entrapped

completely in the core nanoparticles. After 10h the rate of drug release was little bit faster and within 24h up to 90%

drug released which may be due to lack of combination of polymers.

4.11 In vitro cytotoxicity studies

The main reason of selection of HT29 cell lines to perform cytotoxicity studies was to simulate the colorectal cancer

cells. From the cytotoxicity studies it was found that the optimized formulation of Capecitabine loaded PLGA

nanoparticles were more cytotoxic than the pure drug of Capecitabine as portrayed in Fig. 9 and Table 9 which

indicates that the optimized nanoparticles has more potential to kill the colorectal tumor cells.

4.12 Pharmacokinetic studies

The Fig. 10 illustrated the serum pharmacokinetic profile of Capecitabine and the optimized nanoformulation of

Capecitabine. The pharmacokinetic parameters were computed by employing Microsoft excel sheet. The

comparative pharmacokinetic study was carried out between the Capecitabine dispersion (Pure drug) and the

optimized nanoformulation loaded with Capecitabine. The Cmax, Tmax, AUC, Cl, MRTof Capecitabine

nanoformulation was found to be increased as compared to the pure drug of Capecitabine, which pointed out quick

onset of action as well as long absorption phase of Capecitabine from nanoformulation as compared to the pure drug

whereas the values of t1/2, Vd, Ke and Cl and MRT found to be decreased with Capecitabine nanoformulation. The

decrease in Vd reveals the enhancement of solubility of the drug after fabrication into nanoformulation. The increase

 11
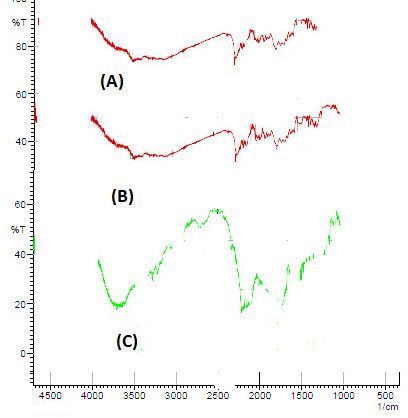
in Cmax and AUC in case of nanoformulation suggests that the dose of Capecitabine can be reduced in the form of

nanoformulation.

4.13 Transmission Electron Microscopy

The TEM study of the optimized nanoformulation revealed that all most all nanoparticles were of spherical in shape

as presented in Fig. 11. Neither irregular shaped nor rod shaped particles were observed from TEM images which

may be accounted for removing un-entrapped or surface bound drug particles from nanoparticles by efficient

washing.

4.14 FT-IR Studies

The drug-excipients compatibility studies as well as identification of drug were performed by means of FT-IR

spectroscopy. The FTIR spectra of Capecitabine, PLGA, Physical mixture of Capecitabine and PLGA(1:1) and

Capecitabine loaded nanoparticles were portrayed in Figure. The Capecitabine exhibited characteristics bands of

different functional groups. The peaks at 3520 cm-1and 3254cm-1 Corresponding to O-H and N-H vibrations, 1647

cm-1, 1713 cm-1,1043.3 and 1248.6 cm-1 indicate pyrimidine carbonyl stretching vibrations and urethane carbonyl

stretching vibrations, C-F stretching vibrations and the presence of tetrahydrofuran ring, respectively. The major

peaks found above confirms the structure of Capecitabine which provides its identity. The FTIR spectra of

Capecitabine loaded nanoparticles(Optimized) revealed absence of major peaks of drug which confirms the better

encapsulation of drug inside the nanoparticles but it retains maximum peaks of PLGA and Poloxamer 188.

Moreover the presence of all major peaks of the components confirmed the drug and excipients compatibility as

portrayed in Fig.12.

4.15 Differential scanning calorimetry (DSC)

The thermo grams of Capecitabine exhibited an endothermic peak at 128 0C corresponding to its melting

point(1210C) and the thermo grams of Optimized nanoformulations exhibited peak at 127.95 0 C. In the themo grams

of optimized lyophilized nanoformulation, there was no peak was observed at 128 0C which indicates there was no

crystalline drug material in it which may be attributed due to complete entrapment of drug in the core of the

nanoparticles. As the sharp endothermic peaks were observed in the pure drug as well as in the physical mixture of

 12
drug, PLGA and poloxamer188 at 128 0C which indicates drug and excipients are quite compatible with each other

as presented in Fig. 13.

Discussion:

The PLGA was selected in our research as a sustained release polymer due to its biodegradability and

biocompatibility nature[35]. Solvent shifting method is based on the interfacial deposition of a polymer following

shifting of a semi-polar solvent (Acetone in our research) miscible with water from a lipophilic solution. The solvent

shifting method was adopted as it is simple, involves single step and reproducible in nature. Fish bone diagram

followed by Taguchi screening design was used to minimize variables and to screen potentially influencing QTPP

factors. Box-Behnken Design was adopted for Optimization of PLGA based nanoparticulate formulations. From the

FTIR studies, it was found that there is no significant shift of peaks or additional peaks found in case of optimized

formulation from that of pure drug. From the DSC studies, the endothermic peak of both the drug as well as the

optimized formulation was found to be approximately same. Hence from the FTIR studies as well as from DSC

studies, it was confirmed that no interaction between drug and other excipients. The TEM study of the optimized

nanoformulation revealed spherical shape of all most all nanoparticles. Neither irregular shaped nor rod shaped

particles were observed from TEM images which may be accounted for removing un-entrapped or surface bound

drug particles from nanoparticles by efficient washing. The free Capecitabine as well as Capecitabine loaded PLGA

nanoparticles at different concentrations significantly reduced HT 29 cell lines in a dose-dependent manner but the

drug loaded nanoparticles killed HT 29 cell lines more significantly as compared to free drug. The drug solution

reached 80% of the cumulative release in about 5 h, while cumulative release of Capecitabine loaded PLGA

nanoparticles within 24 h was 50%, indicating that, Capecitabine loaded PLGA nanoparticles had a sustained release

effect.

5. Conclusion

The investigation made by us successfully testify the application of logical QbD approach in the systematized

improvement of optimized nanoformulations by solvent shifting method exploiting elementary, adequate and cost

effective PLGA based nanoparticles for promising delivery of Capecitabine for effective treatment of colorectal

cancer. Exertion of QbD assisted approach guided in screening relevant formulation and process parameters for

fabrication of nanoparticles and consequently attaining optimum drug delivery with required amount of drug at

colonic site. To such a degree the in vitro drug release study, the in vitro cytotoxicity studies using HT 29 cell lines

 13
as well as in vivo pharmacokinetic studies endorse the controlled release and cytotoxic potential to tumor cells for

once a day administration bringing about efficient, secure and patient centric and patient compliant outcomes. The

future in vivo cytotoxicity studies using suitable animal model will be undertaken in order to investigate the anti

tumor potential of the optimized Capecitabine loaded PLGA based nanoparticles.

ETHICAL STATEMENT:

o Ethics approval and consent to participate: Not applicable

o Consent for publication: Not applicable

o Availability of data and materials: Not applicable

o Competing interests: The authors seldom have any conflict of interest to be declared.

o Funding: This research did not receive any specific grant from funding agencies in the public, commercial, or

not-for-profit sectors.

o Authors' contributions: All authors contributed to conduct the experiment, testing and the writing of this

manuscript.

o Acknowledgements: The authors are very much indebted to RA Chem Pharma Ltd, Hyderabad for generously

gifting sample of Capecitabine and PLGA, SAIF, Punjab University for TEM analysis and Despandey Laboratories

Pvt Ltd, Bhopal for carrying out cytotoxicity assay and Roland Institute of Pharmaceutical Sciences, Berhampur,

Odisha for providing FTIR, DSC, Lyophilizer, probe sonicator as well as Lab facility to carry out this research.

References

1. Lim WM, Rajinikanth PS, Mallikarjun C, Kang YB. Formulation and delivery of itraconazole to the brain using a

nanolipid carrier system. Int J Nanomedicine. DOVE Medical Press Ltd.; 2014;9:2117–26.

2. Patel N, Desai J, Kumar P, Thakkar HP. Development and in vitro characterization of capecitabine-loaded

alginate-pectinate-chitosan beads for colon targeting. J Macromol Sci Part B Phys. Taylor and Francis Inc.;

2016;55:33–54.

3. Hepokur C, Kariper İA, Mısır S, Ay E, Tunoğlu S, Ersez MS, et al. Silver nanoparticle/capecitabine for breast

cancer cell treatment. Toxicol Vitr. Elsevier Ltd; 2019;61:104600.

4. Rajasree PH, Paul W, Sharma CP, Osmani RAM, Hani U, Srivastava A. Eudragit encapsulated cationic poly

(lactic-co-glycolic acid) nanoparticles in targeted delivery of capecitabine for augmented colon carcinoma therapy. J

Drug Deliv Sci Technol. Editions de Sante; 2018;46:302–11.

 14
5. Dudhipala N, Puchchakayala G. Capecitabine lipid nanoparticles for anti-colon cancer activity in 1,2-

dimethylhydrazine-induced colon cancer: preparation, cytotoxic, pharmacokinetic, and pathological evaluation.

Drug Dev Ind Pharm. Taylor and Francis Ltd.; 2018;44:1572–82.

6. Bahadori F, Eskandari Z, Ebrahimi N, Bostan MS, Eroğlu MS, Oner ET. Development and optimization of a

novel PLGA-Levan based drug delivery system for curcumin, using a quality-by-design approach. Eur J Pharm Sci.

Elsevier B.V.; 2019;138.

7. Mehrotra A, Kumar Pandit J. Preparation and Characterization and Biodistribution Studies of Lomustine Loaded

PLGA Nanoparticles by Interfacial Deposition Method. J Nanomedine Biotherapeutic Discov. 2015;05.

8. Wang Y, Jiang G, Qiu T, Ding F. Preparation and evaluation of paclitaxel-loaded nanoparticle incorporated with

galactose-carrying polymer for hepatocyte targeted delivery. Drug Dev Ind Pharm. Drug Dev Ind Pharm;

2012;38:1039–46.

9. Jain S, Mittal A, K. Jain A, R. Mahajan R, Singh D. Cyclosporin A Loaded PLGA Nanoparticle: Preparation,

Optimization, In-Vitro Characterization and Stability Studies. Curr Nanosci. 2010;6:422–31.

10. Sahin A, Esendagli G, Yerlikaya F, Caban-Toktas S, Yoyen-Ermis D, Horzum U, et al. A small variation in

average particle size of PLGA nanoparticles prepared by nanoprecipitation leads to considerable change in

nanoparticles’ characteristics and efficacy of intracellular delivery. Artif Cells, Nanomedicine Biotechnol. Taylor

and Francis Ltd.; 2017;45:1657–64.

11. Barichello JM, Morishita M, Takayama K, Nagai T. Encapsulation of hydrophilic and lipophilic drugs in PLGA

nanoparticles by the nanoprecipitation method. Drug Dev Ind Pharm. Marcel Dekker Inc.; 1999;25:471–6.

12. Girotra P, Singh SK, Kumar G. Development of zolmitriptan loaded PLGA/poloxamer nanoparticles for

migraine using quality by design approach. Int J Biol Macromol. Elsevier B.V.; 2016;85:92–101.

13. Yadav DK, Pawar H, Wankhade S, Suresh S. Development of Novel Docetaxel Phospholipid Nanoparticles for

Intravenous Administration: Quality by Design Approach. AAPS PharmSciTech. 2015;16:855–64.

14. Park SY, Kang Z, Thapa P, Jin YS, Park JW, Lim HJ, et al. Development of sorafenib loaded nanoparticles to

improve oral bioavailability using a quality by design approach. Int J Pharm [Internet]. Elsevier B.V.;

2019;566:229–38. Available from: https://doi.org/10.1016/j.ijpharm.2019.05.064

15. Mishra SM, Rohera BD. An integrated, quality by design (QbD) approach for design, development and

optimization of orally disintegrating tablet formulation of carbamazepine. Pharm Dev Technol. 2017;22:889–903.

 15
16. Pandey AP, More MP, Karande KP, Chitalkar R V., Patil PO, Deshmukh PK. Optimization of desolvation

process for fabrication of lactoferrin nanoparticles using quality by design approach. Artif Cells, Nanomedicine

Biotechnol. 2017;45:1101–14.

17. Bansal S, Beg S, Asthana A, Garg B, Asthana GS, Kapil R, et al. QbD-enabled systematic development of

gastroretentive multiple-unit microballoons of itopride hydrochloride. Drug Deliv. 2016;23:437–51.

18. Barreras-Urbina CG, Ramírez-Wong B, López-Ahumada GA, Burruel-Ibarra SE, Martínez-Cruz O, Tapia-

Hernández JA, et al. Nano- and Micro-Particles by Nanoprecipitation: Possible Application in the Food and

Agricultural Industries. Int J Food Prop. Taylor and Francis Inc.; 2016;19:1912–23.

19. Alshamsan A. Nanoprecipitation is more efficient than emulsion solvent evaporation method to encapsulate

cucurbitacin I in PLGA nanoparticles. Saudi Pharm J. Elsevier; 2014;22:219–22.

20. Morales-Cruz M, Flores-Fernández GM, Morales-Cruz M, Orellano EA, Rodriguez-Martinez JA, Ruiz M, et al.

Two-step nanoprecipitation for the production of protein-loaded PLGA nanospheres. Results Pharma Sci.

2012;2:79–85.

21. Srinivas NSK, Verma R, Kulyadi GP, Kumar L. A quality by design approach on polymeric nanocarrier delivery

of gefitinib: Formulation, in vitro, and in vivo characterization. Int J Nanomedicine. 2017;12.

22. Park SJ, Choo GH, Hwang SJ, Kim MS. Quality by design: Screening of critical variables and formulation

optimization of Eudragit e nanoparticles containing dutasteride. Arch Pharm Res. 2013;36:593–601.

23. Yerlikaya F, Ozgen A, Vural I, Guven O, Karaagaoglu E, Khan MA, et al. Development and evaluation of

paclitaxel nanoparticles using a quality-by-design approach. J Pharm Sci. John Wiley and Sons Inc.;

2013;102:3748–61.

24. Bonde GV, Ajmal G, Yadav SK, Mittal P, Singh J, Bakde B V., et al. Assessing the viability of Soluplus® self-

assembled nanocolloids for sustained delivery of highly hydrophobic lapatinib (anticancer agent): Optimisation and

in-vitro characterisation. Colloids Surfaces B Biointerfaces. Elsevier B.V.; 2020;185.

25. Garg NK, Tyagi RK, Singh B, Sharma G, Nirbhavane P, Kushwah V, et al. Nanostructured lipid carrier mediates

effective delivery of methotrexate to induce apoptosis of rheumatoid arthritis via NF-κB and FOXO1. Int J Pharm.

Elsevier B.V.; 2016;499:301–20.

26. Panigrahi KC, Patra CN, Rao MEB. Quality by Design Enabled Development of Oral Self-Nanoemulsifying

Drug Delivery System of a Novel Calcimimetic Cinacalcet HCl Using a Porous Carrier: In Vitro and In Vivo

 16
Characterisation. AAPS PharmSciTech. Springer New York LLC; 2019;20.

27. Hou J, Guo C, Shi Y, Liu E, Dong W, Yu B, et al. A novel high drug loading mussel-inspired polydopamine

hybrid nanoparticle as a pH-sensitive vehicle for drug delivery. Int J Pharm. Elsevier B.V.; 2017;533:73–83.

28. Kaur A, Bhoop BS, Chhibber S, Sharma G, Gondil VS, Katare OP. Supramolecular nano-engineered lipidic

carriers based on diflunisal-phospholipid complex for transdermal delivery: QbD based optimization,

characterization and preclinical investigations for management of rheumatoid arthritis. Int J Pharm. Elsevier B.V.;

2017;533:206–24.

29. Panigrahi KC, Jena J, Jena GK, Patra CN, Rao MEB. QBD-based systematic development of

BosentanSNEDDS: Formulation, characterization and pharmacokinetic assessment. J Drug Deliv Sci Technol.

Editions de Sante; 2018;47:31–42.

30. Djuris J, Ibric S, Djuric Z. Quality-by-design in pharmaceutical development. Comput. Appl. Pharm. Technol.

Woodhead Publishing Limited; 2013.

31. Amasya G, Badilli U, Aksu B, Tarimci N. Quality by design case study 1: Design of 5-fluorouracil loaded lipid

nanoparticles by the W/O/W double emulsion - Solvent evaporation method. Eur J Pharm Sci [Internet]. Elsevier

B.V.; 2016;84:92–102. Available from: http://dx.doi.org/10.1016/j.ejps.2016.01.003

32. Jena GK, Sahoo SK, Patra CN, Panigrahi KC, Sahu S, Dixit PK. Design, optimization, and evaluation of

capecitabine-loaded chitosan microspheres for colon targeting. Asian J Pharm. 2017;11.

33. Hu H, Liu D, Zhao X, Qiao M, Chen D. Preparation, characterization, cellular uptake and evaluation in vivo of

solid lipid nanoparticles loaded with cucurbitacin B. Drug Dev Ind Pharm. 2013;39:770–9.

34. Kumar Jena G, Niranjan Patra C, Kumar Dixit P. Cytotoxicity and Pharmacokinetic Studies of PLGA Based

Capecitabine Loaded Nanoparticles. Indian J Pharm Educ Res |. 54.

35. Guo B, Xu D, Liu X, Liao C, Li S, Huang Z, et al. Characterization and cytotoxicity of PLGA nanoparticles

loaded with formononetin cyclodextrin complex. J Drug Deliv Sci Technol [Internet]. Elsevier B.V.; 2017;41:375–

83. Available from: http://dx.doi.org/10.1016/j.jddst.2017.08.010

Figure Legends

Figure 1: Outline for stepwise elements of QbD for fabrication of PLGA based nanoparticles

Figure 2: Ishikawa Fishbone blueprint exhibiting cause-effect relationships among the process and formulation

variables for the fabrication of PLGA based Nanoparticles

 17
Figure 3: Pareto charts for screening factors having major impact on CQAs [(R1) = Particle size, (R2) = Entrapment

efficiency (R3) = PDI] as predicted by Taguchi Design.

Figure 4: Contour and 3D Response Surface Plots exhibiting the impact of CMAs and CPPs, i.e. (A) amount of

PLGA, (B) Conc. of Poloxamer and (C) amplitude of sonication on CQAs i.e. R1= Particle size, R2= % EE and R3=

PDI of PLGA based nanoparticles respectively

Figure 5: Overlay plot for the impact of various autonomous variables on the dependent variables i.e. (R1) average

particle size, (R3) polydispersity index, and (R2) entrapment efficiency.

Figure 6: Linear correlation plots between the actual and predicted values of various CQAs, (R1) Particle size, (R2)

% Entrapment efficiency, (R3) Polydispersity index (PDI)

Figure 7: Linear correlation plots between the normal and residual values of various CQAs, (R1) Particle size, (R2)

% Entrapment efficiency, (R3) Polydispersity index (PDI)

Figure 8: Average particle size, PDI and Zeta potential of optimized PLGA based nanoparticles

Figure 9: Cytotoxicity studies of pure drug and optimized PLGA based nanoparticles

Figure 10: Mean serum concentration vs. time profiles obtained after oral administration of Capecitabine and

Optimized PLGA based nanosuspension to rabbit respectively.

Figure 11: TEM image of optimized batch

Figure 12: FTIR spectra of (A) pure drug, (B) physical mixture and (C) PLGA

Figure 13: DSC Thermograms of (A) pure drug, (B) physical mixture and (C) PLGA

 18
Figures

Figure 1

Outline for stepwise elements of QbD for fabrication of PLGA based nanoparticles

Figure 2
Ishikawa Fishbone blueprint exhibiting cause-effect relationships among the process and formulation
variables for the fabrication of PLGA based Nanoparticles

Figure 3

Pareto charts for screening factors having major impact on CQAs [(R1) = Particle size, (R2) = Entrapment
e ciency (R3) = PDI] as predicted by Taguchi Design.
Figure 4

Contour and 3D Response Surface Plots exhibiting the impact of CMAs and CPPs, i.e. (A) amount of
PLGA, (B) Conc. of Poloxamer and (C) amplitude of sonication on CQAs i.e. R1= Particle size, R2= % EE
and R3= PDI of PLGA based nanoparticles respectively
Figure 5

Overlay plot for the impact of various autonomous variables on the dependent variables i.e. (R1) average
particle size, (R3) polydispersity index, and (R2) entrapment e ciency.
Figure 6

Linear correlation plots between the actual and predicted values of various CQAs, (R1) Particle size, (R2)
% Entrapment e ciency, (R3) Polydispersity index (PDI)
Figure 7

Linear correlation plots between the normal and residual values of various CQAs, (R1) Particle size, (R2)
% Entrapment e ciency, (R3) Polydispersity index (PDI)
Figure 8

Average particle size, PDI and Zeta potential of optimized PLGA based nanoparticles
Figure 9

Cytotoxicity studies of pure drug and optimized PLGA based nanoparticles

Figure 10

Mean serum concentration vs. time pro les obtained after oral administration of Capecitabine and
Optimized PLGA based nanosuspension to rabbit respectively.
Figure 11

TEM image of optimized batch
Figure 12

FTIR spectra of (A) pure drug, (B) physical mixture and (C) PLGA
Figure 13

DSC Thermograms of (A) pure drug, (B) physical mixture and (C) PLGA
You can also read