The novelty 'sweet spot' of invention - Cambridge University ...
←
→
Page content transcription
If your browser does not render page correctly, please read the page content below
The novelty ‘sweet spot’ of invention

                                           Yuejun He1 and Jianxi Luo1
                                         1 Singapore University of Technology and Design, Engineering Product Development Pillar,
                                           Singapore, 487372, Singapore

                                           Abstract
                                           Invention arises from novel combinations of prior technologies. However, prior studies
                                           of creativity have suggested that overly novel combinations may be harmful to invention.
                                           Apart from the factors of expertise, market, etc., there may be such a thing as ‘too much’
                                           or ‘too little’ novelty that will determine an invention’s future value, but little empirical
                                           evidence exists in the literature. Using technical patents as the proxy of inventions, our
                                           analysis of 3.9 million patents identifies a clear ‘sweet spot’ in which the mix of novel
                                           combinations of prior technologies favors an invention’s eventual success. Specifically,
                                           we found that the invention categories with the highest mean values and hit rates have
                                           moderate novelty in the center of their combination space and high novelty in the
                                           extreme of their combination space. Too much or too little central novelty suppresses the
                                           positive contribution of extreme novelty in the invention. Furthermore, the combination of
                                           scientific and broader knowledge beyond patentable technologies creates additional value
                                           for invention and enlarges the advantage of the novelty sweet spot. These findings may
                                           further enable data-driven methods both for assessing invention novelty and for profiling
                                           inventors, and may inspire a new strand of data-driven design research and practice.
                                           Key words: novelty, invention, technology combination

                                           1. Introduction
                                           Novelty is an essential element of invention (Lubart 1994; Sternberg & Lubart
                                           1996; Luo 2015). High novelty implies an increase in the variability which
                                           can result in both breakthrough and failure (Fleming 2001). Empirical studies
      Received 2 April 2017                on the impact of novel versus conventional design stimuli on creative output
      Revised 23 September 2017
      Accepted 2 October 2017
                                           have reported mixed results (Chan & Schunn 2015a). Despite its clear value to
                                           invention, excessive novelty may also harm invention by introducing challenges
      Published by Cambridge               to its embodiment, product development, manufacture, and user adoption (Luo
      University Press
       c The Author(s) 2017                2015). In the pursuit of invention, inventors are faced with a ‘novelty dilemma’.
      Distributed as Open Access under     Prior engineering design research has speculated that a novelty ‘sweet spot’ may
      a CC-BY 4.0 license
      (http://creativecommons.org/         exist which delivers the best invention outcome (Fu et al. 2013); there may be such
      licenses/by/4.0/)                    a thing as ‘too much’ or ‘too little’ novelty that will determine an invention’s future
      Des. Sci., vol. 3, e21               value.
      journals.cambridge.org/dsj               If the novelty sweet spot does exist, the next question is where it is – how
      DOI: 10.1017/dsj.2017.23
                                           much novelty is needed for inventions in the sweet spot? In this research, we
                                           aim to answer this question empirically by drawing on the combination theory of
                                           invention to analyze novelty. Prior studies of creativity considered an invention
                                           as the recombination of prior technologies or knowledge, and suggested that
                                                                                                                                                      1/22

Downloaded from https://www.cambridge.org/core. IP address: 46.4.80.155, on 20 Nov 2021 at 10:38:43, subject to the Cambridge Core terms of use, available at
https://www.cambridge.org/core/terms. https://doi.org/10.1017/dsj.2017.23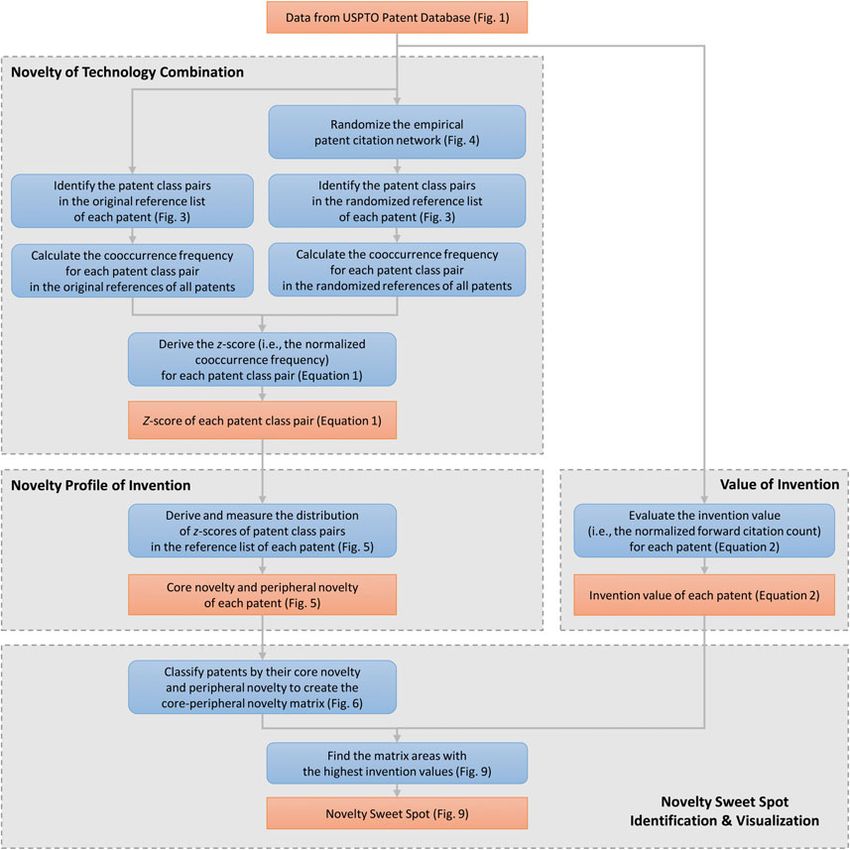
uncommon combinations give rise to novelty (Simonton 1999; Fleming 2001;
                                           Ward 2001; Arthur 2007; Basnet & Magee 2016). Thus, an invention’s novelty can
                                           be measured as the frequency with which the prior technologies the invention
                                           recombines had previously been combined (Uzzi et al. 2013; Chan & Schunn
                                           2015a). Several recent studies have utilized the massive data of patents as the proxy
                                           of inventions to analyze technology combinations (Youn et al. 2015; Kim et al.
                                           2016). We follow these prior works to analyze 3.9 million technical patents from
                                           the United States Patent and Trademark Office (USPTO) to explore the novelty
                                           sweet spot in the combination space of invention.
                                                Our empirical results show a clear novelty ‘sweet spot’ at which the suitable
                                           level of novelty of prior technology combinations favors an invention’s eventual
                                           success. We also found that combination of scientific and broader knowledge
                                           beyond patentable technologies creates additional value for the patented invention
                                           and increases the advantage of the novelty sweet spot. The identification and
                                           nuanced understanding of the novelty sweet spot contributes to the design
                                           creativity literature and can guide inventors to pursue more valuable inventions in
                                           practice. Our methodology may also contribute to the growing literature on the
                                           data-driven evaluation of design creativity. Below, we will first review the related
                                           literature and introduce our methodology and then report our empirical findings.

                                           2. Literature review
                                           To explore the novelty sweet spot for invention, this research primarily draws on
                                           the literature of combination theory and novelty measurement.

                                           2.1. Design combination, novelty and outcome
                                           The prior literature has suggested that novelty arises from uncommon
                                           combinations. Simonton (1999) argued that an invention is the recombination
                                           of existing technologies and that the novelty of the invention is the result of
                                           unconventional combinations of prior technologies. Arthur (2007) proposed
                                           that invention results from recursive problem solving by combining existing
                                           technologies. Youn et al. (2015) used patent classification codes as a proxy of
                                           technologies to analyze the multi-classification of US patents and found that
                                           the major driver of modern invention has indeed been the combination of
                                           existing technologies rather than the introduction of new technologies. Luo &
                                           Wood (2017) found a trend that patented inventions have been combining the
                                           knowledge of broader domains over the past three decades. Synthesizing the
                                           anecdotal accounts of creative writing and laboratory investigations, Ward (2001)
                                           noted that new properties can arise out of conceptual combination. Basnet &
                                           Magee (2016) focused on the combination of analogical transfers in the cognitive
                                           process and argued that new inventive ideas are created by using the combinatorial
                                           analogical transfer of existing ideas. Nickerson (2015) stressed that creative work
                                           can be performed by thousands of people through collective design, i.e., designers
                                           modify and combine each other’s work in a process called remixing.
                                               Combinations can involve different sources and lead to different outcomes.
                                           With empirical studies and a psychoanalytic interpretation of poem-creation
                                           activities, Rothenberg (1980) proposed two combinatory thinking processes that
                                           foster creativity, i.e., Janusian thinking which conceives two or more opposite or
                                           antithetical entities simultaneously and homospatial thinking which conceives
                                                                                                                                                    2/22

Downloaded from https://www.cambridge.org/core. IP address: 46.4.80.155, on 20 Nov 2021 at 10:38:43, subject to the Cambridge Core terms of use, available at
https://www.cambridge.org/core/terms. https://doi.org/10.1017/dsj.2017.23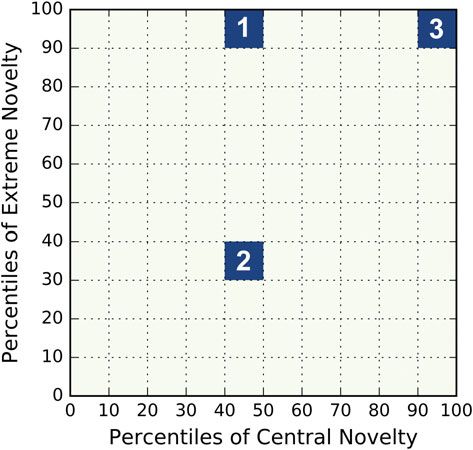
two or more discrete entities occupying the same space. Analyzing scientific
                                           publications, Uzzi et al. (2013) found that the scientific papers that have the
                                           greatest impact (with an outstanding number of future citations) are grounded
                                           in a mass of exceptionally conventional combinations of prior work and a minor
                                           insertion of highly novel combinations. Kim et al. (2016) found that patents that
                                           add novel combinations of their co-classifications to conventional combinations
                                           are most likely to become ‘hits’. Based on US patent citation data, Fleming (2001,
                                           2007) found that although novel combinations based on rareness in historical
                                           occurrences lead to less useful inventions on average, they also give rise to the
                                           variability that can result in both breakthrough and failure.
                                                Despite a robust link between distant combinations and the increased novelty
                                           of concepts, prior laboratory experiments or empirical studies have reported
                                           mixed results on the impact of distant combinations on design outcome (Chan
                                           & Schunn 2015a). It is naturally difficult for scientists and inventors to retrieve,
                                           absorb, and integrate technologies across unfamiliar domains. For instance, Chan
                                           & Schunn (2015a) found that the direct effects of far combinations have a
                                           mean zero effect on creative concept generation, and iterations are important for
                                           converting distant combinations into creative concepts. Kaufman & Baer (2004)
                                           found that creativity is more domain-specific than general, and it is naturally
                                           difficult for people to effectively combine technologies across distant domains.
                                           Forbus et al. (1995) found that during knowledge retrieval, superficial reminding
                                           is much more frequent than structural reminding, which makes it difficult to
                                           achieve design novelty from a distant enough combination. Based on an analysis
                                           of 2.8 million inventors’ 3.9 million patents, Alstott et al. (2017a) found that
                                           inventors are far more likely to obtain new patents in new domains that are more
                                           related to their previous patents than in more distant domains.
                                                Similarly, studies of design-by-analogy have suggested that novelty may arise
                                           when design is conceived by analogy across distant domains (Gick & Holyoak
                                           1980; Gentner & Markman 1997; Ward 2001; Chan et al. 2011), but Gick &
                                           Holyoak (1980) found that human subjects often fail to notice the relevance of an
                                           analogy because of the cognitive distance between the potential solution and the
                                           target problem. Chan & Schunn (2015b) conducted an in vivo study and found that
                                           distant analogies do not lead directly to creative concepts via large leaps but instead
                                           increase the concept generation rate. Chan, Dow and Schunn (2015) found that
                                           conceptually closer rather than more distant stimuli appear to be more beneficial
                                           to design because of their easier perception and more obvious connection to the
                                           design problem. Fu et al. (2013) found that if stimuli are too distant from the
                                           design problem, they can become harmful to the design process and outcome.
                                           Accordingly, they argued that there might be such a thing as too ‘near’ and too
                                           ‘far’ in design analogies and that the stimuli from the ‘middle ground’ may be
                                           desirable for developing creative solutions.
                                                Taken together, the literature has suggested that novel combinations are
                                           fundamental for invention and particularly crucial for breakthroughs, but
                                           excessively novel combinations may be ineffective and lead to poor results.
                                           Meanwhile, conventional combinations, compared with novel ones, are relatively
                                           easy and effective. The most desirable design outcome may arise in the middle
                                           ground, suggesting a hypothesis that there is a novelty ‘sweet spot’ of prior
                                           technology combinations. Our research aims to empirically test this hypothesis
                                           and to identify the novelty sweet spot. To do so, the evaluation of novelty is
                                           required.
                                                                                                                                                    3/22

Downloaded from https://www.cambridge.org/core. IP address: 46.4.80.155, on 20 Nov 2021 at 10:38:43, subject to the Cambridge Core terms of use, available at
https://www.cambridge.org/core/terms. https://doi.org/10.1017/dsj.2017.23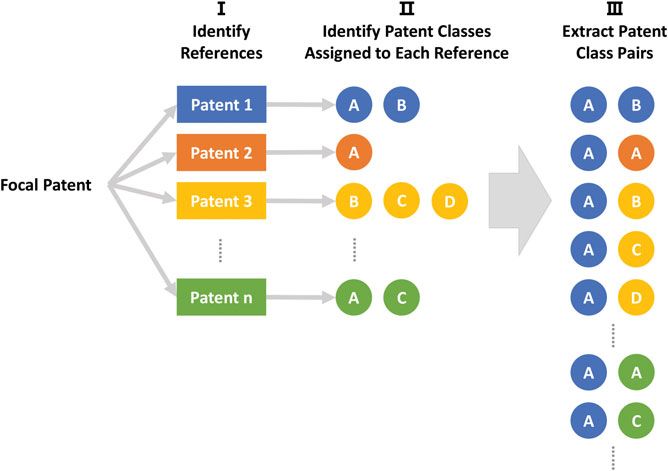
2.2. Evaluation of design novelty
                                           To evaluate novelty, design researchers have proposed various definitions, metrics,
                                           and methods. In general, novelty indicates that an invention is new, original,
                                           unexpected, and surprising (e.g., Sternberg & Lubart 1999; Simonton 2000;
                                           Kaufman & Baer 2004). Weisberg (2006) suggested that novelty is subjective to
                                           the experience of the evaluator. Therefore, novelty can be defined with reference
                                           to the previous ideas of the individuals concerned or relative to the entirety of
                                           human history (Boden 1996). For instance, Oman et al. (2013) measured the
                                           ‘novelty’ of a new concept as its uniqueness across all functional dimensions
                                           relative to a group of comparable ideas. Simonton (1999) associated the novelty
                                           of the invention with the commonality of its combinations of prior technologies.
                                           Some researchers have suggested that novelty can be measured by comparing the
                                           observed situation with the random one. For example, Uzzi et al. (2013) proposed
                                           calculation of the novelty of a combination of scientific fields by comparing
                                           the observed frequency of the combination with the random frequency of the
                                           combination in the randomized samples. Kim et al. (2016) calculated a relative
                                           likelihood that each pair of classification codes is put together at random and a
                                           deviation from the empirical observation to assess a patent’s overall novelty.
                                                Traditionally, invention evaluation has been carried out using an expert group
                                           approach and based on experts’ subjective opinions, intuitions, or experiences
                                           (Amabile 1996). Various procedures and techniques have been proposed to
                                           facilitate expert groups and analyze their opinions. Sarkar & Chakrabarti (2007)
                                           introduced the function–behavior–structure (FBS) model and the SAPPhIRE
                                           model using product characteristics to measure product novelty. Brown (2015)
                                           presented a simple framework for computational design creativity evaluation,
                                           which contains agent judging, the set of aspects, knowledge about the designer,
                                           etc. Grace et al. (2015) developed a typology of expectations that, when violated,
                                           produce surprise and contribute to creativity.
                                                Evaluation relying on expert opinions is naturally subjective and limited in
                                           terms of the data sample size. As a result, it is difficult either to apply rigorous
                                           mathematics for evaluation or to test theoretical hypotheses with statistical
                                           significance. Meanwhile, there is an increasing call for a computational and
                                           data-driven evaluation of design novelty (Brown 2015; He & Luo 2017). Recent
                                           studies have developed methods to analyze patent documents to evaluate patented
                                           inventions. Patent documents contain rich details, and there are also millions
                                           of patents in the public patent databases, which enable a more rigorous and
                                           systematical data-driven evaluation of the novelty of patented inventions. For
                                           instance, Fleming (2001) analyzed how frequently the co-classes of a patent were
                                           assigned to other patents in the history to indicate the novelty of this patent from
                                           a recombination perspective. He & Luo (2017) analyzed how frequently a pair of
                                           patent classes had appeared together in the references of previous patents to assess
                                           its conventionality or novelty.
                                                In this paper, we introduce a data-driven method to measure the novelty
                                           of patented inventions, using the extensive data existing in the USPTO patent
                                           database, and we then test the hypothesis on the existence of the novelty sweet
                                           spot of invention.

                                                                                                                                                    4/22

Downloaded from https://www.cambridge.org/core. IP address: 46.4.80.155, on 20 Nov 2021 at 10:38:43, subject to the Cambridge Core terms of use, available at
https://www.cambridge.org/core/terms. https://doi.org/10.1017/dsj.2017.23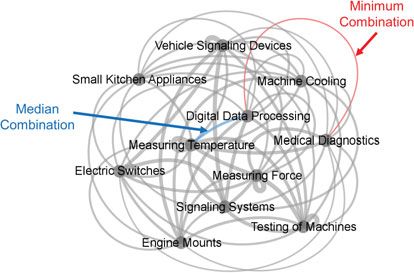
3. Data and method
3.1. Data
In this study, we used patents as the proxy of inventions, with awareness of
patents’ limitations (e.g., not all inventions are patented). Our analysis involved
approximately 3.9 million utility patents granted from 1976 to 2016 contained
in the USPTO (United States Patent and Trademark Office) patent database1 ,
including the 601,715 patents that were granted in the 1990s with five or more
references to prior patents, along with the patents that they cite (i.e., backward
references) and the patents that cite them (i.e., forward citations). Our focus on
patents in the 1990s ensures that their backward references and forward citations
are sufficiently covered, because most citations fall within a time lag of 10 years
(Trajtenberg 1990; Hall, Jaffe & Trajtenberg 2001). The data on patent documents
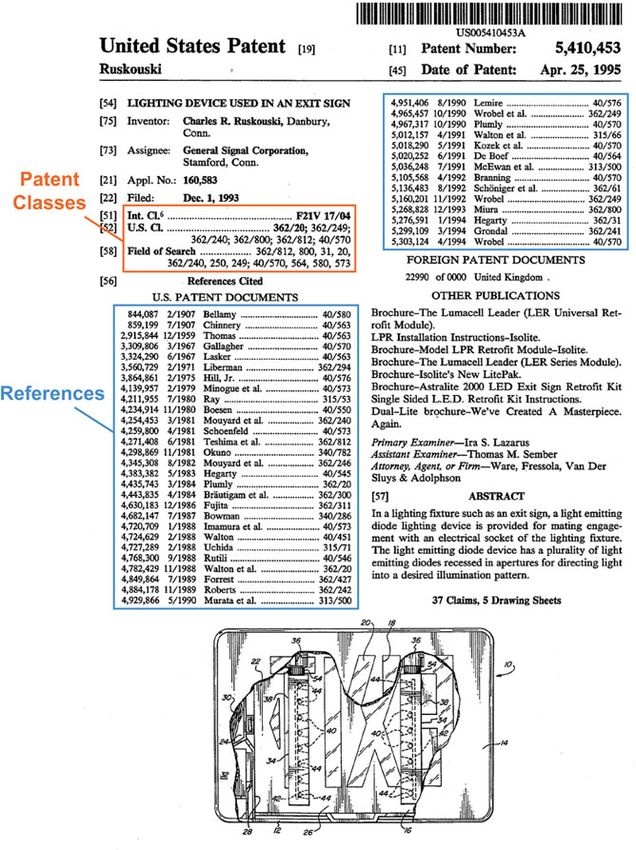
that we used in our analysis are the patent classifications and references (Figure 1).
Each patent is assigned to one or more patent classes by the USPTO examiners,
indicating which types of technology it embodies. In this study, we used IPC4
(four-digit International Patent Classification) marking 631 patent classes as the
proxy of technology fields, as commonly carried out in the innovation literature
(Breschi, Lissoni & Malerba 2003; Boschma, Heimeriks & Balland 2014; Kay et al.
2014; Rigby 2015; Alstott et al. 2017b; Yan & Luo 2017).
3.2. Method
Figure 2 depicts the structure of our overall research method to statistically
compute the novelty profile and the value of a patented invention to identify the
novelty sweet spot. The details of each step of the method are described in the
following subsections.
3.2.1. Novelty of technology combination
A pair of patent classes assigned to a patent’s references approximates
a recombination of existing technology fields in an invention. With this
information, one can calculate the frequency at which a combination of
technology fields has occurred in historical inventions’ references to indicate
the combination’s novelty. Figure 3 illustrates the procedure to extract all pairs
of patent classes assigned to a patent’s references. The first step is to identify the
referenced patents of a focal patent (column I). The second step is to identify the
classes of these referenced patents (column II). On this basis, the list of all class
pairs in the patent’s references is extracted (column III). For example, class A that
is assigned to patent 1 (one of the patent references of the focal patent) forms a
class pair with class B that is also assigned to patent 1, with class A that is assigned
to patent 2, and with classes B, C, and D that are assigned to patent 3, and so on.
Following the frequency-based approach to evaluate novelty (Uzzi et al. 2013),
we first computed the frequency of a pair of patent classes co-occurring in the
references of individual patents in history. Because it is difficult to perceive how
large or small a frequency value is, benchmarking is needed. We normalized
the empirically observed frequency value by comparing it with the same metric
for the comparable randomized citation networks to indicate the novelty of the
combination. Such a normalized value relative to comparable random situations
1 The dataset was downloaded from PatentsView, available at http://www.patentsview.org/.
5/22
Downloaded from https://www.cambridge.org/core. IP address: 46.4.80.155, on 20 Nov 2021 at 10:38:43, subject to the Cambridge Core terms of use, available at
https://www.cambridge.org/core/terms. https://doi.org/10.1017/dsj.2017.23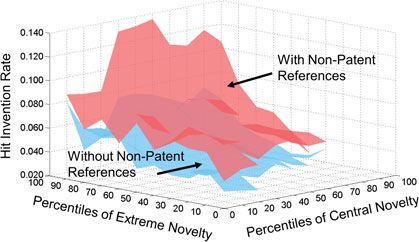
Figure 1. Example of a patent document (US Patent 5410453).

                                           is called the ‘z-score’ in the network science literature, indicating the extent to
                                           which the empirical observation deviates from expectations in comparable but
                                           randomized settings. The formula for the z-score is
                                                                                      x −µ
                                                                               zi j =      ,                               (1)
                                                                                        σ
                                           where z i j is the relative co-occurrence frequency of the pair of classes i and j,
                                           x is the empirically observed co-occurrence frequency of classes i and j, µ is
                                           the average expected co-occurrence frequency of classes i and j in comparable
                                           randomized citation networks, and σ is its standard deviation. The average
                                           expected value and the standard deviation were calculated based on an ensemble
                                                                                                                                                    6/22

Downloaded from https://www.cambridge.org/core. IP address: 46.4.80.155, on 20 Nov 2021 at 10:38:43, subject to the Cambridge Core terms of use, available at
https://www.cambridge.org/core/terms. https://doi.org/10.1017/dsj.2017.23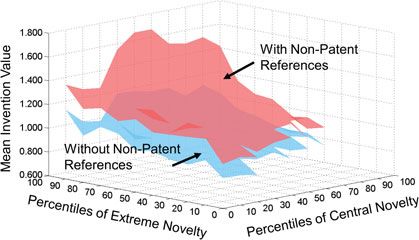
Figure 2. Flow diagram of the research method.

                                           of 10 randomized reference lists of the same patents in the randomized citation
                                           networks.
                                               Figure 4 illustrates an example of how the empirical citation network was
                                           randomized. In the citation network, the nodes are patents and the links are
                                           backward references, i.e., an arrow goes from a citing patent to a cited patent.
                                           Specifically, we randomly selected a pair of citing-to-cited links with the same
                                           citing and cited years (i.e., the years in which the citing and cited patents were
                                           granted) and swapped the cited patents. For example, in Figure 4, link a and link
                                           b can be switched by swapping the cited patents, but link a and link c cannot
                                           be switched. As a result, the random swapping procedure preserved all of the
                                           numbers of forward and backward citations of each patent and the year lags of the

                                                                                                                                                    7/22

Downloaded from https://www.cambridge.org/core. IP address: 46.4.80.155, on 20 Nov 2021 at 10:38:43, subject to the Cambridge Core terms of use, available at
https://www.cambridge.org/core/terms. https://doi.org/10.1017/dsj.2017.23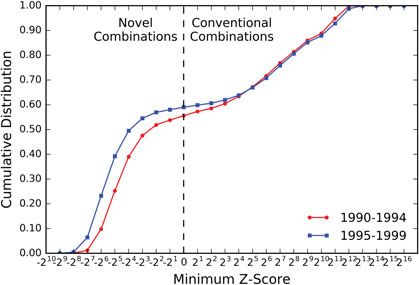
Figure 3. Illustrative procedure of extracting the class pairs in the reference list of a
                                           patent.

                                           Figure 4. How the empirical citation network was randomized by swapping the cited
                                           patents of randomly selected citing-to-cited links with the same citing and cited years.

                                           citations, which makes the randomized networks comparable with the empirical
                                           network.
                                               We calculated the z-score of any pair of the 631 IPC4 classes that were assigned
                                           to the patents appearing as references of all US patents granted from 1990 to 1999.
                                           A lower z-score, indicating less frequent historical occurrences, suggests higher
                                           novelty. Thereafter, we used the additive inverse of the z-score to measure the
                                           novelty of the combination represented by the patent class pair. For example, if
                                           the z-score of a class pair is −100, its novelty score is 100. If the z-score of another
                                           class pair is 5, its novelty score is −5. The first pair has a higher novelty score than
                                           the latter pair.

                                           3.2.2. Novelty profile of a patented invention
                                           It should be noted that each invention is often composed of multiple combinations
                                           of technology fields (i.e., each patent has a set of pairs of classes in the list of its
                                                                                                                                                    8/22

Downloaded from https://www.cambridge.org/core. IP address: 46.4.80.155, on 20 Nov 2021 at 10:38:43, subject to the Cambridge Core terms of use, available at
https://www.cambridge.org/core/terms. https://doi.org/10.1017/dsj.2017.23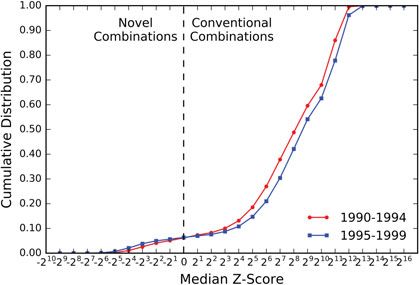
(a)                                                                           (b)
           Figure 5. The technology combination space of US patent 5473937 entitled ‘Temperature sensing apparatus’.
           (a) Network of classes assigned to the references of the patent, connected according to the z-scores (red link,
           minimum z-score; blue link, median z-score). (b) Cumulative distribution of the class pairs by their z-scores.

                                           references) and each of the combinations has a different degree of novelty (i.e.,
                                           each of the class pairs has a z-score). Thus, the combination space of a patented
                                           invention can be viewed as a network of patent classes whose pairings are denoted
                                           as weighted links according to the z-scores of the pairs (see Figure 5(a) for an
                                           example). In other words, each invention can be characterized by a spectrum of
                                           novelty values given by its combinations, i.e., each patent can be profiled by a
                                           spectrum of z-scores given by the patent class pairs in its references. This spectrum
                                           of novelty values can be summarized in a cumulative distribution of the z-scores
                                           (see Figure 5(b) for an example).
                                               To investigate the spectrum of novelty values, we first considered the median
                                           value of the above distribution, which is located at the center of the distribution,
                                           thus indicating the novelty in the central area of an invention’s combinations.
                                           In the world of invention, the extreme or outlier is as meaningful as the
                                           average (Fleming 2007; Girotra, Terwiesch & Ulrich 2010). Therefore, we are
                                           also concerned with the novelty of the most novel combination in the extreme
                                           of the spectrum. In brief, to profile the novelty of an invention, we analyzed
                                           both the novelty of the center and the novelty of the extreme in the space of
                                           its combinations. Specifically, we defined and quantified the central novelty of a
                                           patented invention as the additive inverse of the median z-score in the distribution
                                           and its extreme novelty as the additive inverse of the minimum z-score in the
                                           distribution.
                                               It should be noted that the z-scores in the distribution for a patent were
                                           calculated based on the historical data on the co-occurrence of patent class pairs
                                           until the granting year of the focal patent, because extreme novelty and central
                                           novelty are relative to the past and present artifacts and should change temporarily
                                           as newer technologies are developed over time (Weisberg 2006). As a robustness
                                           check (see the Supplementary Appendix available at https://doi.org/10.1017/dsj.2
                                           017.23), we also generated the analysis results with the z-scores calculated based
                                           on the co-occurrences of patent class pairs in the granting year of the focal patent.
                                           The qualitative patterns in the main text hold.
                                               Figure 6 shows the distributions of all patents in the 1990s according to their
                                           median z-scores and minimum z-scores. The median z-score distribution patterns

                                                                                                                                                    9/22

Downloaded from https://www.cambridge.org/core. IP address: 46.4.80.155, on 20 Nov 2021 at 10:38:43, subject to the Cambridge Core terms of use, available at
https://www.cambridge.org/core/terms. https://doi.org/10.1017/dsj.2017.23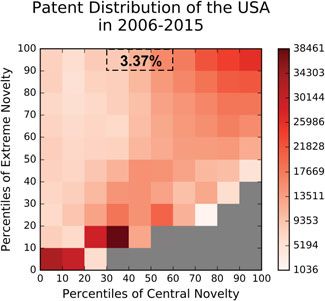
(a)                                                                      (b)
           Figure 6. Patent distribution according to z-scores. (a) Cumulative distribution according to median z-scores
           (i.e., additive inverse of central novelty). (b) Cumulative distribution according to minimum z-scores (i.e.,
           additive inverse of extreme novelty).

                                           Figure 7. The central–extreme novelty space and the locations of the three patents in
                                           Table 1.

                                           changed little over the two five-year periods in the 1990s. From 1990 to 1994,
                                           6.18% of the patents had a median z-score below 0, whereas 6.36% of the patents
                                           had a negative median z-score from 1995 to 1999. Moreover, there was no obvious
                                           change in the minimum z-score distribution over time. From 1990 to 1994, 55.58%
                                           of the patents had a minimum z-score below 0, whereas from 1995 to 1999, 59.01%
                                           of the patents did so.
                                               With the definition of and the method to compute both the central novelty
                                           and the extreme novelty of an invention, we can now assess and position an
                                           invention in a two-dimensional space defined by central novelty and extreme

                                                                                                                                                   10/22

Downloaded from https://www.cambridge.org/core. IP address: 46.4.80.155, on 20 Nov 2021 at 10:38:43, subject to the Cambridge Core terms of use, available at
https://www.cambridge.org/core/terms. https://doi.org/10.1017/dsj.2017.23
Table 1. Example patents of different central novelty, extreme novelty, and invention value
Example #1 #2 #3
Patent ID 5385635 5390262 5391970
Title Process for fabricating Method for splitting and Motion controller with
silicon channel structures configuring a remote linking and time
with variable multi-channel image disturbance correction
cross-sectional areas processing system
Invention 2.0219 (top 12%) 0.6223 (top 49%) 1.0266 (top 31%)
Value
Referred B41J Mechanical G06F Digital Data B23F Cutting Gears
Patent Classes Typography Processing B32B Layered Products
B44C Ornamental Work G06K Data Recording D01G Fiber Treatment
C03C Composition of Glass G08C Measured Value D01H Winding Fibers
C23F Desurfacing Transmission G01D Metering by Other
G01D Metering by Other H04H Broadcast Means
Means Communication G02B Optical Systems
H01L Semiconductor H04M Telephonic G03B Photography
Devices Communication G05B Regulation Systems
H04N Visual G06F Digital Data
Communication Processing
H01P Waveguides
H02P Electric Motor
Control
Patent Class C23F Desurfacing H04H Broadcast D01G Fiber Treatment
Pair of H01L Semiconductor Communication G01D Metering by Other
Central Devices H04N Visual Means
Novelty Communication
Patent Class B41J Mechanical G08C Measured Value B32B Layered Products
Pair of Typography Transmission G06F Digital Data
Extreme H01L Semiconductor H04H Broadcast Processing
Novelty Devices Communication
novelty (Figure 7). Because the values of central novelty and extreme novelty
are highly dispersed, we divided them into 10 (equally sized) categories. A few
example patents (Table 1) are located in the respective categories in the 10-by-10
matrix according to their central and extreme novelty values. These patents were
all granted in 1995 but differ in their central novelty, extreme novelty, and realized
invention values (to be defined below).
3.2.3. Value of a patented invention
The value of an invention is realized when it is endowed with utility and
economic and social significance. Prior empirical studies have shown strong
evidence that the number of a patent’s forward citations (i.e., the citations it
receives after being granted) is highly correlated with the value it has achieved,
as indicated by expert opinions, awards, and market value (Harhoff et al.
1999; Hall, Jaffe & Trajtenberg 2000). For example, the patent for crystalline
silicoaluminophosphates held by Union Carbide Corporation (patent #4310440)
describes an important compound. With its widespread uses as a catalyst in other
inventions, the patent created great economic value for its holder and received
11/22
Downloaded from https://www.cambridge.org/core. IP address: 46.4.80.155, on 20 Nov 2021 at 10:38:43, subject to the Cambridge Core terms of use, available at
https://www.cambridge.org/core/terms. https://doi.org/10.1017/dsj.2017.23Table 2. Descriptive statistics of the key variables
Variable Mean S.D. Min Max
Invention Value 1 1.396 0 58.284
Hit Invention 0.050 0.218 0 1
Central Novelty −972.713 1217.711 −19299.11 261.100
Extreme Novelty −299.085 848.858 −19299.11 424.734
Reference Count 11.109 11.023 5 678
Inventor Count 2.223 1.580 1 34
229 citations through 1995 as the most cited patent since 1976 granted by USPTO
(Hall, Jaffe & Trajtenberg 2000). Thus, we followed the literature to approximate
the value of a patented invention by the count of its forward citations, normalized
by the average forward citation count of all of the patents granted in the same
patent class and the same year. The normalization allows a comparative analysis
across fields and years. The formula for the value (vi ) of a patented invention i is
ai
vi = , (2)
ā
where ai denotes the total count of forward citations received by patent i and
ā denotes the average count of forward citations received by all of the patents
granted in the same year and in the same IPC4 class as patent i.
We were also interested in the subset of inventions that achieved outstanding
value and are considered to be breakthrough inventions. In this paper, we defined
the top 5% of patents in terms of the normalized forward citation count (i.e., the
invention value) as ‘hit inventions’. In our analysis, the variable ‘‘hit invention’ of a
patent is 1 if the patent is of a top 5% normalized forward citation and 0 otherwise.
We also ran robustness tests using top 1%, 3%, and 10% as alternatives to define a
hit invention (see the Supplementary Appendix).
3.2.4. Descriptive statistics
Table 2 reports the descriptive statistics for the variables based on our data set
of 601,715 utility patents in the USPTO patent database that were granted in the
1990s and have five or more references to prior patents.
4. Results and discussion
We primarily analyzed the patents in our total data set to associate central and
extreme novelty with invention value.
4.1. Novelty sweet spot
The association between central novelty and mean invention value follows a
parabola or inverted-U curve (Figure 8a). Invention value increases initially until
the 60th percentile of central novelty and declines from the 60th percentile
onward. The highest mean invention value appears at a ‘sweet spot’ of the
40th–60th percentiles of central novelty, i.e., a medium level of novelty in the
center of their combinations. The association between extreme novelty and
mean invention values follows a cubic curve moving upward (Figure 8b). The
12/22
Downloaded from https://www.cambridge.org/core. IP address: 46.4.80.155, on 20 Nov 2021 at 10:38:43, subject to the Cambridge Core terms of use, available at
https://www.cambridge.org/core/terms. https://doi.org/10.1017/dsj.2017.23(a) (b)
(c) (d)
Figure 8. Mean invention values and hit invention rates of patents of different central and extreme novelty
percentiles. (a) Mean invention values with confidence intervals (±1.96 standard errors of the mean) of
patents equally distributed over 10 central novelty levels. (b) Mean invention values with confidence intervals
(±1.96 standard errors of the mean) of patents equally distributed over 10 extreme novelty levels. (c) Hit
invention rates of patents equally distributed over 10 central novelty levels. (d) Hit invention rates of patents
equally distributed over 10 extreme novelty levels.
highest mean invention value appears at the highest level of extreme novelty. The
associations between central or extreme novelty and hit invention rates (Figures 8c
and d) follow the same patterns. These patterns are further confirmed by
multivariable regression analyses (see Table S1 in the Supplementary Appendix).
Figure 9(a) shows the distribution of patents in cells of a 10-by-10 matrix
by their central and extreme novelty. More patents lie along the diagonal of the
central–extreme novelty matrix, implying that, to some extent, the central novelty
and extreme novelty of patents are correlated. In the central–extreme novelty
matrix, patents are concentrated in the regions in which the central novelty and
extreme novelty are simultaneously low or high, i.e., the bottom left and upper
right corners. The matrix further enables a two-dimensional comparison of the
realized invention values of patents in different regions of the central–extreme
novelty space.
Figure 9(b) reports the average invention value of each category of patents in
the central–extreme novelty matrix. For interest in the most significant inventions,
we also report the probability of achieving the top 5% invention value for patents
in each category of the central–extreme novelty matrix (Figure 9c). Figures 9(b)
13/22
Downloaded from https://www.cambridge.org/core. IP address: 46.4.80.155, on 20 Nov 2021 at 10:38:43, subject to the Cambridge Core terms of use, available at
https://www.cambridge.org/core/terms. https://doi.org/10.1017/dsj.2017.23(a) (b) (c)
Figure 9. Central–extreme novelty matrix. Each cell represents a category of patents according to their
percentiles of central and extreme novelty. Gray indicates a lack of data. (a) Patent distribution across the
space. The number in the dashed box is the sweet spot’s share of total patents. (b) Mean invention value, i.e.,
average normalized forward citation. (c) Hit invention rate, i.e., probability of top 5% invention value.
and (c) both exhibit a similar sweet spot, i.e., the regions of medium central novelty
(the 30th–60th percentiles) and high extreme novelty (the 90th–100th percentiles)
in the central–extreme novelty space, where the highest mean invention values and
hit invention rates are located. Notably, the value sweet spot in Figures 9(b) and (c)
is away from the popular spots in Figure 9(a) that have the highest concentrations
of inventions. Only 2.17% of the patents are located in the sweet spot, despite its
high mean value and high rates of hit inventions.
The realization of a high-value invention requires sufficiently but not
excessively novel or conventional combinations in the center. Therefore, in the
interest of maximizing invention value, there is such a thing as ‘too novel’ or ‘too
conventional’, but only for the combination center of an invention. Meanwhile,
a higher extreme novelty monotonically increases the value of an invention
regardless of its central novelty. However, for patents with medium central novelty,
an increase in extreme novelty increases the invention value more significantly
than an increase at the low or high central novelty levels.
4.2. Novelty sweet spot with/without non-patent references
Many patents also cite non-patent references (NPRs) such as scientific papers,
technical reports, and books, which may imply a broader scope of the combined
knowledge embodied in the inventions. Prior study has shown that patents citing
NPRs present a higher average value measured by forward citation counts than
those citing only patents, particularly when the patented invention combines
technologies from a wider scope of fields (Fleming & Sorenson 2004). Our results
(Figure 10) show that patents with NPRs present generally higher invention values
than patents without NPRs in every cell of the central–extreme novelty space.
More specifically, the value added by NPRs, indicated by the gap between the
two surfaces in each panel of Figure 10, is maximized in the sweet spot of the
central–extreme novelty matrix, i.e., medium central novelty and high extreme
novelty. In brief, the combination of scientific and broader knowledge beyond
patentable technologies may create more valuable inventions and enlarge the value
advantage of the novelty sweet spot.
14/22
Downloaded from https://www.cambridge.org/core. IP address: 46.4.80.155, on 20 Nov 2021 at 10:38:43, subject to the Cambridge Core terms of use, available at
https://www.cambridge.org/core/terms. https://doi.org/10.1017/dsj.2017.23(a) (b)
Figure 10. Novelty sweet spot with/without non-patent references (e.g., scientific papers, technical reports,
books, etc.) by central and extreme novelty percentiles. Each cell in the base matrix represents a category
of patents. (a) Mean invention value, i.e., average normalized forward citation. (b) Hit invention rate, i.e.,
probability of top 5% invention value.
The foregoing findings hold true when the data sample includes the patents
with no fewer than 20, 30, and 50 reference IPC4 pairs (Figures S2–S5 in
the Supplementary Appendix), when z-scores are calculated using the data
of co-occurrences of class pairs only in the granting year of the focal patent
(Figures S6–S9 in the Supplementary Appendix) rather than the historical data
until the granting year, when extreme novelty is alternatively defined as the
z-score of the 3rd, 5th, 8th, or 10th percentile of the z-score distribution of a
patent (Figures S2–S4 in the Supplementary Appendix), and when we change the
definition of a hit invention to one that is among the top 10%, 3%, and 1% in
terms of normalized forward citation counts (Figure S5 in the Supplementary
Appendix). The detailed robustness tests are reported in the Supplementary
Appendix.
In brief, we have identified a clear ‘sweet spot’ of invention in the
central–extreme novelty space, with a statistical analysis of approximately 600,000
patents in the USPTO database. This finding supports the prior conjecture from
engineering design research (Fu et al. 2013). Knowledge of the specified sweet
spot may further enable data-driven methods for assessing novelty and profiling
inventors. It may also provide some guidance for engineering designers to enhance
the value of their potential inventions. Below, we discuss several applications to
make sense of this new understanding.
4.3. Potential applications
First, the central–extreme novelty matrix can be used as a data-driven tool to
computationally assess the novelty of a new invention. For instance, one can
assess the central novelty and extreme novelty of a new invention and locate it
in the core–peripheral novelty matrix. Figure 7 has presented a few examples of
individual patents positioned in the matrix. For a patented invention, the desirable
situation is to lie in the sweet spot. In particular, such data-driven assessment of
the novelty of a new patent application may aid in the patent validity examination.
Furthermore, the central–extreme novelty matrix can also be used to profile
individual inventors, companies, states, and countries by visualizing the novelty
structures of their invention portfolios. The desirable portfolio would have most
15/22
Downloaded from https://www.cambridge.org/core. IP address: 46.4.80.155, on 20 Nov 2021 at 10:38:43, subject to the Cambridge Core terms of use, available at
https://www.cambridge.org/core/terms. https://doi.org/10.1017/dsj.2017.23(a) (b)
(c) (d)
Figure 11. Patent distributions of the USA and China by central and extreme novelty
percentiles. Each cell represents a category of patents. Gray indicates a lack of data.
(a) Patent distribution of the USA from 1996 to 2005 and (b) from 2006 to 2015;
(c) patent distribution of China from 1996 to 2005 and (d) from 2006 to 2015. The
numbers in the dashed boxes are the shares of the patents in the sweet spot, i.e.,
the region with the 30th–60th percentiles of central novelty and the 90th–100th
percentiles of extreme novelty.
patents concentrated in the sweet spot of the central–extreme novelty space;
in reality, this concentration is gradual. For instance, Figure 11 presents an
example that visualizes the patent portfolios of two countries, the USA and China,
within the central–extreme novelty space, revealing their differences. To ensure
consistency for comparison, only USPTO patents from the USA and China are
analyzed here.
The USPTO patents of the USA are concentrated around both the high (i.e.,
upper right) and the low (i.e., bottom left) novelty corners of the matrix and are
distributed over the sweet spot. Despite an increase in total patents, this patent
distribution profile has changed little over the past two decades (Figures 11a
and b), and the percentage of patents within the sweet spot has increased from
2.93% to 3.37%. In contrast, the USPTO patents of China were concentrated at
the low novelty corner at first but have exhibited a shift toward the upper right
16/22
Downloaded from https://www.cambridge.org/core. IP address: 46.4.80.155, on 20 Nov 2021 at 10:38:43, subject to the Cambridge Core terms of use, available at
https://www.cambridge.org/core/terms. https://doi.org/10.1017/dsj.2017.23(a) (b)
(c) (d)
Figure 12. Patent distributions of different technology domains by central and
extreme novelty percentiles. Each cell represents a category of patents. Gray indicates
a lack of data. (a) Distribution of nanotechnology patents from 1996 to 2005 and
(b) from 2006 to 2015; (c) distribution of hybrid electric vehicle patents from 1996
to 2005 and (d) from 2006 to 2015. The patents for the corresponding domains are
extracted from the special patent categories ‘903 – Hybrid Electric Vehicles’ and ‘977
– Nanotechnology’ created by the USPTO, among nine art-collection classes whose
three-digit IDs start with the number 9. The numbers in the dashed boxes are the
shares of the patents in the sweet spot, i.e., the region with the 30th–60th percentiles
of central novelty and the 90th–100th percentiles of extreme novelty.
corner over the past two decades (Figures 11c and d), which represents both high
central novelty and high extreme novelty. However, the share of the patents in
the sweet spot dropped from 2.10% to 1.00%. Such a visual comparison suggests
that the USA has a generally more valuable patent portfolio, with an increasing
portion of patents in the sweet spot; conversely, China has been producing more
novel patents over time, but is losing sight of the potential value of its patented
inventions. For interested readers, the novelty profiles of additional countries can
be found in the Supplementary Appendix.
Likewise, the same visual assessment can be applied to technical design
domains for comparative and trend analyses. For example, Figure 12 visualizes
the distributions of nanotechnology patents and hybrid electrical vehicle patents
in the USPTO patent database over two decades. The nanotechnology patents
are concentrated at the upper right corner of both high central and extreme
17/22
Downloaded from https://www.cambridge.org/core. IP address: 46.4.80.155, on 20 Nov 2021 at 10:38:43, subject to the Cambridge Core terms of use, available at
https://www.cambridge.org/core/terms. https://doi.org/10.1017/dsj.2017.23novelty, with a tendency to disperse toward a lower periphery novelty over time
(Figures 12a and b). The percentage of nanotechnology patents within the sweet
spot dropped significantly, from 3.92% to 2.07%. In contrast, the concentration of
hybrid electrical vehicle patents shifted obviously from the center of the novelty
matrix to the upper right corner over time, suggesting a general increase in the
portion of more novel inventions in this domain (Figures 12c and d). However,
such an increase in proportion did not take place in the favorable sweet spot
for value; the percentage of patents in the sweet spot was almost unchanged
(from 1.50% to 1.48%). Nanotechnology inventions were generally more novel
and were more present in the valuable sweet spot, whereas hybrid electrical vehicle
inventions increased in the more novel categories but not in the sweet spot. Such
differences in the visualized novelty profiles of domains may result from or reflect
their different technical natures and development stages.
In brief, the central–extreme novelty matrix, together with the knowledge
of the sweet spot in the matrix space, may enable more systematic, consistent,
and efficient data-driven evaluation (of novelty and value) of inventions or new
technologies than traditional approaches using subjective opinions of experts
(Hennessey & Amabile 2010). Thus, it will have a broad impact on general
inventive practices as well as innovation management and policy.
5. Concluding remarks
Our findings contribute to both creativity theories and inventive practices. The
most important finding is a specific ‘sweet spot’ in the central–extreme novelty
space. Too much or too little novelty in the center may limit the future value
realization of the invention and suppress the positive value contribution of
extreme novelty to an invention. To pursue hit inventions or breakthroughs,
inventors should be aware of the sweet spot at the beginning of the design
process. One can use sufficient but not excessive domain-specific technologies to
form a moderately novel center and infuse a small number of technologies from
distant domains to form a highly novel extreme in the combination space. This
finding about the novelty ‘sweet spot’ is aligned with those of Fu et al. (2013)
and Chan et al. (2015), despite different definitions of novelty, different types
of experiments, and different correlation factors. Another important finding is
that the combination of scientific and broader knowledge apart from patentable
technologies generally creates value for an invention, and it reinforces the
added value of the sweet spot over other regions in the central–extreme novelty
space. This finding suggests that inventors searching broadly for scientific and
non-patentable knowledge in the invention process may find more valuable
inventive opportunities.
Our findings favor T-shaped inventors, who are equipped with basic scientific
knowledge in various domains and deep design expertise in a specific domain.
Such inventors with the T-shaped knowledge structure are less likely to be
trapped by the conventional wisdoms of their domains of specialization, and
can consistently explore, leverage, and engage technologies from distant domains
for invention. This type of domain-crossing exploration is more effective if the
inventors engage scientific and broader knowledge to comprehend and integrate
technologies across domains. Our results support the movements of engineering
education to cultivate holistic inventors with such a T-shaped knowledge structure
18/22
Downloaded from https://www.cambridge.org/core. IP address: 46.4.80.155, on 20 Nov 2021 at 10:38:43, subject to the Cambridge Core terms of use, available at
https://www.cambridge.org/core/terms. https://doi.org/10.1017/dsj.2017.23to promote innovation, and deal with the growing complexity in technological
inventions and the invention process (Luo & Wood 2017).
Furthermore, we demonstrate the use of the ‘central–extreme novelty matrix’
to profile the novelty structures of the patent portfolios of different countries and
of different technology domains. The visual analysis reveals that the USA had
a generally more valuable patent portfolio and an increasing concentration of
patents in the sweet spot, while China was losing sight of the value of inventions
(i.e., it had a decreasing portion of patents in the sweet spot), despite producing
more novel patents over time. We also visually found that nanotechnology
inventions were highly novel but had a decreasing portion in the valuable sweet
spot, whereas hybrid electrical vehicle inventions shifted their concentration to
the more novel categories but not in the sweet spot over the past two decades.
The novelty matrix and the knowledge of the sweet spot can be further applied to
assess and compare the invention portfolios of individual inventors, companies,
states, countries, and industries.
In summary, this paper contributes a scientific understanding of what novelty
structure is most likely to give inventions greater value. Such an understanding
is valuable for inventive practices in all fields. This paper also contributes a
promising novelty evaluation tool, i.e., the central–extreme novelty matrix. It
can characterize the two-dimensional novelty structures of inventions and the
patent portfolios of inventors at different aggregation levels, including persons,
organizations, regions, etc. This new understanding and our methodological
contributions are expected to inspire and enhance creativity in design practices,
engineering education, innovation management and policy, etc., across fields.
The study has limitations. For example, our method relies on a statistical
analysis of the data on patent references; thus, we focused on patents with at
least five references. As a result, we may have neglected highly novel patents with
few references. In addition, we only analyzed direct references, although indirect
references may also have implications for the combination space of invention.
For co-occurrences, pair is the simplest and most generic unit of analysis. Other
forms of co-occurrences, such as triples or specific topological structures, can be
considered for further study to explore additional insights into novelty structures.
In addition, the USPTO patent database is just one of many patent databases
worldwide. It would be interesting to conduct a similar analysis using other patent
databases, such as the patents filed in European, Chinese, and Japanese patent
offices, to explore whether our findings in this paper will hold or vary.
This study can move forward in a few directions for future research.
First, alternative measures of the novelty spectra can be explored to assess
inventions based on patent data. Second, we plan to work with industrial
companies and government organizations to apply our work and findings (e.g.,
the central–extreme novelty matrix and the ‘sweet spot’) for impact on innovation
practices. Third, new studies may bring new insights into invention by using
the novelty matrix to assess and compare the novelty profiles across different
ranges of patents, e.g., system patents versus device patents, singular patents
versus grandparent–parent–child families of patents, etc. Fourth, a data-driven
invention evaluation tool can be developed to automate the novelty assessment
and the visualization functions, as we preliminarily presented in this paper. Thus,
laymen (e.g., engineers, managers, patent lawyers, policy makers) can use the tool
to quantitatively and visually evaluate inventions and patent portfolios at different
scales. Furthermore, we hope that a systematic model to predict the value of new
19/22
Downloaded from https://www.cambridge.org/core. IP address: 46.4.80.155, on 20 Nov 2021 at 10:38:43, subject to the Cambridge Core terms of use, available at
https://www.cambridge.org/core/terms. https://doi.org/10.1017/dsj.2017.23inventions can be developed in future research by incorporating additional factors
that affect invention value with central and extreme novelty.
Acknowledgments
This research is funded by SUTD-MIT International Design Centre
(IDG31600105) and Singapore Ministry of Education Tier 2 Academic Research
Grant (MOE2013-T2-2-167).
Supplementary data
Supplementary data is available at https://doi.org/10.1017/dsj.2017.23.
References
Alstott, J., Triulzi, G., Yan, B. & Luo, J. 2017a Inventors’ movements and performance
across technology domains. Design Science; in press.
Alstott, J., Triulzi, G., Yan, B. & Luo, J. 2017b Mapping technology space by normalizing
technology relatedness networks. Scientometrics 110, 443–479.
Amabile, T. M. 1996 Creativity in Context: Update to ‘The Social Psychology of Creativity’.
Westview Press.
Arthur, W. B. 2007 The structure of invention. Research Policy 36, 274–287.
Basnet, S. & Magee, C. L. 2016 Modeling of technological performance trends using
design theory. Design Science 2, e8.
Boden, M. A. 1996 Dimensions of Creativity. MIT Press.
Boschma, R., Heimeriks, G. & Balland, P.-A. 2014 Scientific knowledge dynamics and
relatedness in biotech cities. Research Policy 43, 107–114.
Breschi, S., Lissoni, F. & Malerba, F. 2003 Knowledge-relatedness in firm technological
diversification. Research Policy 32, 69–87.
Brown, D. C. 2015 Computational design creativity evaluation. Design Computing and
Cognition’14. Springer.
Chan, J., Dow, S. P. & Schunn, C. D. 2015 Do the best design ideas (really) come from
conceptually distant sources of inspiration? Design Studies 36, 31–58.
Chan, J., Fu, K., Schunn, C., Cagan, J., Wood, K. & Kotovsky, K. 2011 On the benefits
and pitfalls of analogies for innovative design: ideation performance based on
analogical distance, commonness, and modality of examples. Journal of Mechanical
Design 133, 081004.
Chan, J. & Schunn, C. 2015a The importance of iteration in creative conceptual
combination. Cognition 145, 104–115.
Chan, J. & Schunn, C. D. 2015b The impact of analogies on creative concept generation:
lessons from an in vivo study in engineering design. Cognitive Science 39, 126–155.
Fleming, L. 2001 Recombinant uncertainty in technological search. Management Science
47, 117–132.
Fleming, L. 2007 Breakthroughs and the ‘long tail’ of innovation. MIT Sloan Management
Review 49, 69.
Fleming, L. & Sorenson, O. 2004 Science as a map in technological search. Strategic
Management Journal 25, 909–928.
Forbus, K. D., Gentner, D. & Law, K. 1995 MAC/FAC: a model of similarity-based
retrieval. Cognitive Science 19, 141–205.
20/22
Downloaded from https://www.cambridge.org/core. IP address: 46.4.80.155, on 20 Nov 2021 at 10:38:43, subject to the Cambridge Core terms of use, available at
https://www.cambridge.org/core/terms. https://doi.org/10.1017/dsj.2017.23Fu, K., Chan, J., Cagan, J., Kotovsky, K., Schunn, C. & Wood, K. 2013 The meaning of
‘near’ and ‘far’: the impact of structuring design databases and the effect of distance of
analogy on design output. Journal of Mechanical Design 135, 021007.
Gentner, D. & Markman, A. B. 1997 Structure mapping in analogy and similarity.
American Psychologist 52, 45.
Gick, M. L. & Holyoak, K. J. 1980 Analogical problem solving. Cognitive Psychology 12,
306–355.
Girotra, K., Terwiesch, C. & Ulrich, K. T. 2010 Idea generation and the quality of the
best idea. Management Science 56, 591–605.
Grace, K., Maher, M. L., Fisher, D. & Brady, K. 2015 Modeling expectation for
evaluating surprise in design creativity. Design Computing and Cognition’14. Springer.
Hall, B. H., Jaffe, A. B. & Trajtenberg, M. 2000 Market Value and Patent Citations: A
First Look. National Bureau of Economic Research.
Hall, B. H., Jaffe, A. B. & Trajtenberg, M. 2001 The NBER Patent Citation Data File:
Lessons, Insights and Methodological Tools. National Bureau of Economic Research.
Harhoff, D., Narin, F., Scherer, F. M. & Vopel, K. 1999 Citation frequency and the value
of patented inventions. Review of Economics and Statistics 81, 511–515.
He, Y. & Luo, J. 2017 Novelty, conventionality, and value of invention. Design Computing
and Cognition’16. Springer.
Hennessey, B. A. & Amabile, T. M. 2010 Creativity. Annual Review of Psychology 61,
569–598.
Kaufman, J. C. & Baer, J. 2004 Hawking’s Haiku, Madonna’s math: why it is hard to be
creative in every room of the house. In Creativity: From Potential to Realization (ed. R.
J. Sternberg, E. L. Grigorenko & J. L. Singer), pp. 3–19.
Kay, L., Newman, N., Youtie, J., Porter, A. L. & Rafols, I. 2014 Patent overlay mapping:
visualizing technological distance. Journal of the Association for Information Science
and Technology 65, 2432–2443.
Kim, D., Cerigo, D. B., Jeong, H. & Youn, H. 2016 Technological novelty profile and
invention’s future impact. EPJ Data Science 5, 8.
Lubart, T. 1994. Product-centered self-evaluation and the creative process. Unpublished
doctoral dissertation, Yale University, New Haven, CT.
Luo, J. 2015 The united innovation process: integrating science, design, and
entrepreneurship as sub-processes. Design Science 1, e2.
Luo, J. & Wood, K. L. 2017 The growing complexity in invention process. Research in
Engineering Design 1–15.
Nickerson, J. V. 2015 Collective design: remixing and visibility. Design Computing and
Cognition’14. Springer.
Oman, S. K., Tumer, I. Y., Wood, K. & Seepersad, C. 2013 A comparison of creativity
and innovation metrics and sample validation through in-class design projects.
Research in Engineering Design 24, 65–92.
Rigby, D. L. 2015 Technological relatedness and knowledge space: entry and exit of US
cities from patent classes. Regional Studies 49, 1922–1937.
Rothenberg, A. 1980 The emerging goddess: the creative process in art, science, and
other fields. Journal of Aesthetics and Art Criticism 39 (2), 206–209.
Sarkar, P. & Chakrabarti, A. 2007. Development of a method for assessing design
creativity. Guidelines for a Decision Support Method Adapted to NPD Processes.
Simonton, D. K. 1999 Creativity as blind variation and selective retention: Is the creative
process Darwinian? Psychological Inquiry 10, 309–328.
21/22
Downloaded from https://www.cambridge.org/core. IP address: 46.4.80.155, on 20 Nov 2021 at 10:38:43, subject to the Cambridge Core terms of use, available at
https://www.cambridge.org/core/terms. https://doi.org/10.1017/dsj.2017.23You can also read