DETERMINANTS OF PROFITABILITY: A CASE OF COMMERCIAL BANKS IN PAKISTAN - GIAP Journals
←
→
Page content transcription
If your browser does not render page correctly, please read the page content below
Humanities & Social Sciences Reviews
                                                                            eISSN: 2395-6518, Vol 9, No 2, 2021, pp 01-13
                                                                                  https://doi.org/10.18510/hssr.2021.921

DETERMINANTS OF PROFITABILITY: A CASE OF COMMERCIAL BANKS
                       IN PAKISTAN
 Mohammad Farooq1, Shiraz Khan2*, Atif Atique Siddiqui3, Muhammad Tariq Khan4, Muhammad Kamran Khan5
                  1, 2*,3,4,5
                              Department of Management Sciences, the University of Haripur, Pakistan.
   Email: farooqkhanhs79@gmail.com, 2*shirazkhan@uoh.edu.pk, 3atif.atique@uoh.edu.pk, 4tariq_phd@yahoo.com,
         1
                                               5
                                                 mkamran.khan@uoh.edu.pk
                                         th                            st                             th
           Article History: Received on 18 February 2021, Revised on 1 March 2021, Published on 06 March 2021
                                                           Abstract
Purpose of the study: This study aims to investigate the impact of bank-specific and macro-economic factors on
commercial banks profitability in Pakistan.
Methodology: This study uses both internal and external factors as independent variables. Internal factors are inclusive of
capital adequacy, operational efficiency, deposit ratio, liquidity, leverage, number of branches, and bank size, while external
indicators are pertaining to GDP, rate of inflation, interest rate, and rate of foreign exchange. Return on assets, return on
equity, and net interest margin is employed as proxies for measuring profitability. Balanced panel data of 25 commercial
banks over a period ranging from 2009 to 2018 is analyzed through descriptive statistics and fixed effects regression model.
Main Findings: The empirical findings revealed that among internal factors, capital adequacy ratio, deposit ratio, leverage
ratio, liquidity ratio, and bank size significantly affect the return on asset, while in the case of macro-economic factors,
inflation rate, exchange rate, and GDP have a significant impact on return on asset. On the other hand, return on equity is
significantly affected by deposit ratio, leverage ratio, and operational efficiency, whereas among macro-economic factors,
only the inflation rate had a significant effect on return on equity. Furthermore, in the case of net interest margin, among
internal factors, capital adequacy ratio, deposit ratio, bank size, and the number of branches have a significant impact on net
interest margin, whereas, among macro-economic factors, interest rate, inflation rate, and exchange rate significantly
affected net interest margin.
Applications of this study: This study has greater importance for government, bank managers, investors, academicians, and
scholars.
Originality/Novelty: In this study, the number of branches is taken as a novel factor in Pakistan's case and bridges the gap in
the banking literature of Pakistan.
Keywords: Commercial Bank Profitability, Macro-economics, Capital Adequacy, Operational Efficiency, Deposit Ratio,
Liquidity.
INTRODUCTION
Banks are considered the lifeblood of an economy. The banking industry plays the role of locomotive for an economy which
ultimately boosts financial development and strengthens overall economic growth (Levine, 1997). An advanced and lucrative
banking industry facilitates access to finance at competitive rates and, therefore, provides the momentum for economic
growth in an economy (Petria et al., 2015; Peng, 2019). The banking sector assumes a critical function in developing the
financial sector and contributing a major portion to the financial development of a nation; therefore, it is important to
observe the performance of the banks.
The banking industry of Pakistan plays a greater role in its financial and economic growth. Several reformations had taken
place in the Pakistani banking sector to boost financial performance. To ensure growth and sustainability in banking
performance, in 1990, the government announced the decentralization of banks (Shair et al., 2019). In the post-privatization
period, the banking sector experienced massive development. Banking reforms attracted private and foreign banks to
enhance the quality of banking products and services. It prompted competition in the banking industry which further brought
about internal improvement, effectiveness and lessened the cost of lending to safeguard the accessibility of finance to the
middle class. This progressiveness of the financial institution sector requires improved performance to maintain and contend
in the business (ABBAS, 2019).
This paper attempts to identify the profitability of commercial banks operating in Pakistan by utilizing inner components
such as "bank size, capital adequacy, deposit, operational efficiency, number of branches, leverage and liquidity" and
macroeconomic variables such as GDP, interest rate, inflation rate and exchange rate on various performance measures like
Return on Assets (ROA), Return on Equity (ROE) and Net Interest Margin (NIM). The internal and external determinants
both affect the financial institution's performance in terms of profitability (Abdur Rahman, 2020; Gul et al., 2011).

1|https://giapjournals.com/hssr/index                                                                       © Farooq et al.
Humanities & Social Sciences Reviews
eISSN: 2395-6518, Vol 9, No 2, 2021, pp 01-13
https://doi.org/10.18510/hssr.2021.921
Recognizing the primary indicators of the banking sector permit to figure various procedures to expand the bank's financial
health (Dietrich & Wanzenried, 2011).
Around the globe, economies are struggling for their survival. Pakistan is the 44th largest economy facing great challenges of
circular debt and heavyweight of external loans. On the other hand, the economy is suffering from a heavy burden of
enhanced prices. The upper-middle class is moving towards the middle, and middle class to the lower middle, and in the
same way, all upper classes are slowly moving to step down. CPEC, also being a hope to change the current economic crisis,
currently started its contribution to the power and road transport sector. Macroeconomic indicators are slowly showing an
upward movement. The study of bank performance has become even more important during continuing financial and
economic crises, which significantly affects the banking sector in Pakistan and in other countries around the globe.
Recognizing the main components and indicators of commercial banks lays the basis for making strategies on how to
improve and enhance the profitability of banks. In this manner, the indicators of banking profitability have dragged in the
attention of bank management, financial markets, investors, as well as researchers (ABBAS, 2019; Fadahunsi & Barake,
2018). Accordingly, the current study aims to identify the effect of internal and macroeconomic indicators on the
profitability of commercial banks.
This study assists the financial institutions' management to cautiously plan and predict by understanding the fluctuations
which occur within the bank-specific and macroeconomic indicators and, as a result, affect profitability indicators. The
studies done on the indicators of profitability of banks have special importance for management, government authority,
policymakers, donors, as they can break down the proficiency of banks and hold the investor's decisions, coordinating
government plans and the executive's strategies to acquire the objectives of future (Mamatzakis & Remoundos, 2003;
Altantsetseg, Chen, & Chang, 2017). This paper is structured in the following manner: Section 2 provides a review of the
literature. Section 3 represents data and methodology. Section 4 gives results and analysis. Section 5 puts a conclusion and
gives recommendations.
This paper bridges a gap in Pakistan's banking literature. Moreover, this investigation outspreads, contributes, and stands on
the work of Almaqtari et al. (2019), who disregarded a most important measure of banking performance viz. Net Interest
Margin (NIM). In addition, in this study, a number of branches is taken as a novel factor in the case of Pakistan and bridges
the gap in the banking literature of Pakistan. Following are the research questions of the current research work:
1. What is the impact of bank-specific factors on commercial banks' profitability?
2. How macro-economic factors influence commercial banks' profitability?
LITERATURE REVIEW
Bank profitability is of utmost importance within the current context, and its determinants have been, hence, evaluated and
represented in the empirical papers of numerous scholars. Most of the researchers employed both internal and external
indicators to determine bank profitability (Abdelaziz et al., 2020; Al-Homaidi et al., 2020; Almaqtari et al., 2019; Jadah et
al., 2020; Le et al., 2020; Tabash et al., 2017; Yusgiantoro et al., 2019; Zampara et al., 2017). Ensuing the previous works
done in this paper, profitability is taken as an explained variable, whereas internal/bank-specific and external/macro-
economic indicators are employed as explanatory variables. Three proxies (ROA, ROE, and NIM) are used to measure the
profitability of commercial banks.
Bank Specific Factors
The larger the size, the more efficient the bank is in regarding operating costs. Or in other words, if a bank grows in its size,
it gives additional strength and capability to a bank in managing its operating costs efficiently, which in turn leads to
economies of scale and scope (Ayano & Ponnala, 2016; Dasig et al., 2017).). The profitability of banks is positively affected
by the size of banks (Almaqtari et al., 2019; De Silva et al., 2019). Furthermore, it is substantiated that increase in firm size
can be translated to cost reduction, which comes as the result of economies of scale. It is also concluded that larger banks
have better opportunities in raising capital and financing their operations with a reasonable capital cost. On the contrary, it is
concluded that the profitability of banks is negatively influenced by size (Rahman et al., 2020; Batten & Vo, 2019). It is
observed that banks having a large size are facing difficulties in controlling and managing efficiently. When larger banks
grow as compared to smaller banks, their costs increase and ultimately result in lower profits (ur Rehman et al., 2018).
There is consistency in empirical works done regarding operating efficiency, and it is concluded that operational efficiency
hurts banking performance (Al-Homaidi et al., 2020; Supriyono & Herdhayinta, 2019). It is clarified, if bank management
can efficiently manage its operating costs, this will increase banking performance.
The capital ratio can work as a safeguard for financial distress and represents funds that are retained and owned by a bank. It
will be realized throughout the financial crises that how bank profits are affected by the poor quality of capital ratio and
unpredicted losses. Lardic and Terraza (2019) and Abdelaziz et al. (2020) found a negative association between profitability
2|https://giapjournals.com/hssr/index © Farooq et al.Humanities & Social Sciences Reviews
eISSN: 2395-6518, Vol 9, No 2, 2021, pp 01-13
https://doi.org/10.18510/hssr.2021.921
and ratio of capital adequacy. Contrary to the above arguments, it is observed that capital adequacy enhances banking
performance and exerts a positive effect on profitability (Le & Nguyen, 2020; Shair et al., 2019). Berger (1995) clarified that
banks with higher amounts of capital are in a less risky stance than those with lesser amounts of capital. However, the greater
extent of riskiness will be translated into higher profitability. Having a large amount of capital enables a bank to reduce the
effect of unpredicted losses, make a bank to use its internal financial resources and does not rely on further borrowings,
brings down borrowing cost, and there will be sufficient resources that could be used for advances to increase interest
income and can be utilized in other profitable investment opportunities (Gul et al., 2011; Tan & Floros, 2012; Chang, 2016.)
Performance of banks decreases when leveraging ratio increases, and it may be due to the reality that equity is less expensive
compared to that of debts; as a result, using a higher LEV ratio tends to decline bank performance (Yadollahzadeh et al.,
2013). Al-Homaidi et al. (2018) and Ali (2015) concluded that leverage ratio exerts a negative effect on bank profitability.
In present global scenarios, it is essential for businesses to have a sufficient amount of liquid assets to guarantee the stability
of the firm in the long term (Ayele, 2012). There will arise a risk of insolvency if the firms are not in a position to fulfill a
reasonable benchmark of working capital. So, it does have positive consequences on the profitability of the firm and its
stability when a firm can set up its liquidity to an optimal level (Karakuza, 2017; Osra, 2017). Organizations having enough
cash can easily grab profitable investment opportunities (Arnold, 2008). On the contrary, it is stated that firms having higher
liquidity are facing many financial problems. This is the likely elucidation that the firms with higher amounts of circulating
assets that need conservation or maintenance costs ultimately considerably reduce the profitability (Neto, 2003).
The economic theory describes, that the association between profitability and risk is positive. Hence, if the liquidity level
tends to increase, the risk exposure will decrease, and it sparks a negative impact on firm profitability. In such conditions, the
working capital strategy remains less risky in context. Conversely, if a firm has less working capital, it significantly increases
the risk of being insolvent. However, the firm shall have increased profitability (Abebe, 2014). The liquidity ratio negatively
affects banking performance.
Deposit considers one of the vital sources of funds for banks which significantly affects banking performance (Hays et al.,
2009). The easiest and cheapest source of funds that are available for banks is the deposits from the customers. It is generally
accepted that deposits have a positive effect on banking profitability as long as there is a demand for loans from the
borrowers (Al-Homaidi et al., 2018; Elekdag et al., 2020; ur Rehman et al., 2018).
A number of branches portray the market power and share of a bank, and furthermore, it demonstrates the geographical
distribution of banks (Al-Homaidi et al., 2018; Almaqtari et al., 2019). Almaqtari et al. (2019) revealed a positive association
between profitability (NIM) and the number of branches (NoB).
Macroeconomic Factors
If banks can accurately anticipate the rate of inflation, their profitability will increase because they will have the ability to
bring such changes in interest rate which help to boost bank's turnover; on the other hand, if inflation is not accurately
expected, it will increase the cost. After all, banks will not be in a position to adjust the interest rate in a way that could
enhance revenue. When banks' income increases more swiftly compared to their costs, in such a case, the inflation rate is
likely to positively impact banks' profits and vice versa (Ayele, 2012). The rate of inflation negatively affects banking
performance. On the contrary, it is concluded that the rate of inflation negatively affects banking profitability (Almaqtari et
al., 2019; Jadah et al., 2020).
Investing and consumption activities are at their peak in the time of higher and enhanced economic growth, which increases
loaning and credit facilities and ultimately brings about an increase in profitability. De Leon (2020) and Almaqtari et al.
(2019) in their works they put forward that GDP and profitability have a negative relationship. On the contrary, it is pointed
out that GDP and bank profitability have a positive relationship (Le & Ngo, 2020; Shair et al., 2019; Uralov, 2020).
The critical point to concentrate on is banks' ability to set interest rates that easily cover funding costs, operational costs, and
the required rate of return. It is anticipated that the rate of interest positively affects banking performance in lending long and
borrowing short slogans (Vong & Chan, 2009). On the contrary, interest rate and bank profitability have a negative
relationship because it causes a real burden on borrowers to increase and deteriorate the quality of assets, diminishing
banking profitability. Rate of interest rate and profitability negatively associated (Al-Harbi, 2019; Topak & Tırmandıoğlu
Talu, 2017; Vera-Gilces et al., 2020). On the contrary, Almaqtari et al. (2019) and Yüksel et al. (2018) in their studies,
revealed that the rate of interest is negatively associated with profitability.
Banks with assets or liabilities in foreign currencies face foreign exchange rate risk, affecting bank capital and profitability
due to fluctuating movements in exchange rates. Exchange can be moved in either upstream or downstream irrespective of
considering predictions and estimates. These ambiguous movements posing a risk to the capital and turnover of a bank, when
these movements are in contradiction to the desired goals. Exchange rate depreciation positively and significantly affects
3|https://giapjournals.com/hssr/index © Farooq et al.Humanities & Social Sciences Reviews
eISSN: 2395-6518, Vol 9, No 2, 2021, pp 01-13
https://doi.org/10.18510/hssr.2021.921
profitability when management is good enough to accurately predict fluctuations taking place in exchange rates and
ultimately results in achieving profits on foreign currency transactions (Davydenko, 2010). The rate of exchange negatively
affects banking performance (Hasan et al., 2020; Almaqtari et al., 2019). On the contrary, a positive association between the
rate of exchange and performance of the bank is reported by (Caliskana & Lecunab, 2020; Shuremo, 2016).
The aim of the study conducted by ur Rehman et al. (2018) conducted a study in Pakistan, covering a time span from 2007 to
2015. For analysis, the fixed effect regression model was adopted to investigate micro and macro-economic indicators on
bank performance. Bank-specific factors include capital adequacy ratio, asset composition, funding source, quality of the
asset, size, cost ratio, tax ratio, fee-based services, and market volume. Macro-economic indicators include GDP, real interest
rate, and Herfindahl-Hirschman Index (HHI). The profitability of the bank is proxied by ROA. The study's empirical results
demonstrate that only asset composition and size, out of micro indicators, are substantial elements that contribute to banking
performance. Concerning external factors, GDP and real interest rate are significantly affecting profitability.
In Pakistan, from the period 2007 to 2017, an investigation was executed by Shair et al. (2019) to evaluate the bank
profitability by using the generalized method of moment and taking 26 banks. It is concluded that liquidity, capital adequacy,
size, taxation, and GDP positively affected banks' profitability, whereas competition and credit risk demonstrate an inverse
association with bank performance. Furthermore, it is reported that operating cost has a positive link with NIM, but negative
relation with ROA. In Pakistan, banks are needed to be involved in traditional loaning activities to utilize their liquid assets
because having an increased amount of liquid assets reduces profitability.
Rahman et al. (2020) scrutinized the effect of internal and external indicators on banking productivity by covering a period
from 2003 to 2017 with 20 commercial banks working in the realm of Pakistan. It is reported that size does not contribute to
Pakistani banks' profitability, and it harms profitability and could be due to diseconomies of scale. Furthermore, it is reported
that the capital adequacy ratio plays a significant role in accelerating a bank's profitability, and it positively impacts
profitability.
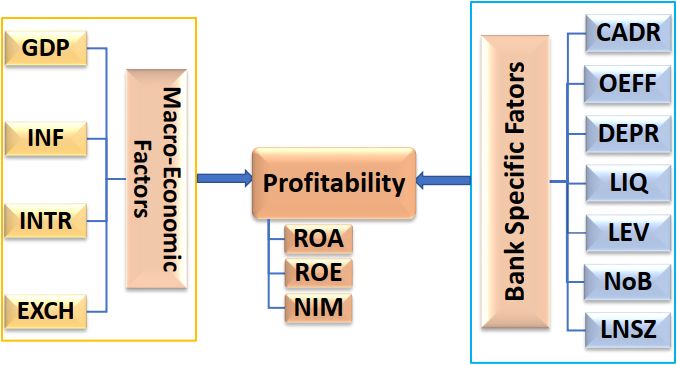
Conceptual Framework
In order to accomplish the aim of the present work, it is considered essential to include both internal and external indicators.
Accordingly, it is inspected in the following schematic diagram.
Independent Factors Dependent Factor Independent Factors
Figure 1: Conceptual Framework
Source: Author Analysis
RESEARCH DESIGN AND METHODOLOGY
Currently, in Pakistan, 33 banks are working, consisting of 20 private business banks, 4 foreign-owned banks, 5 state-owned
business banks, and 4 specialized banks, and these specialized banks also work under government possession. The target
population for the present work is 29 commercial banks working in the country. From the 29 commercial banks, a sample of
4|https://giapjournals.com/hssr/index © Farooq et al.Humanities & Social Sciences Reviews
eISSN: 2395-6518, Vol 9, No 2, 2021, pp 01-13
https://doi.org/10.18510/hssr.2021.921
25 banks is selected for this study based on purposive sampling technique for some time from 2009 to 2018. A balanced
panel data is utilized because of the study's objectives and the advantages that it has over cross-sectional or time series. Panel
data gives more information, lessens co-linearity among the variables, more variability, higher degrees of freedom, and
higher efficacy (Baltagi, 2005; Gujarati, 2012). Bank-level data is taken from each bank's financial statement and Pakistan's
state bank (sbp.org.pk). Macro-economic level data is retrieved from the World Bank database.
Variable Operationalization
Table 1: Variable Operationalization
Category Variable Proxy/Measurement Notation
Return on Assets: Ratio of Net Profit to Total Assets ROA
Dependent
Return on Equity: Ratio of Net Profit to Total Equity ROE
Variables
Profitability
Net Interest Margin: Ratio of Net Interest Income to Total
NIM
Assets
Capital
Ratio of Total Equity to Total Assets CADR
Bank-Specific Factors
Adequacy
Operational
Ratio of Operating Expenses to Total Income OEFF
Efficiency
Deposits Ratio of Total Deposits to Total Assets DEPR
Liquidity Ratio of Liquid Assets to Total Assets LIQ
Leverage Ratio of Total Liabilities to Total Assets LEV
Size Natural Logarithm of Total Assets LNSZ
Independent Variables
Branches Number of Branches NoB
GDP The Real GDP Growth GDP
Inflation Rate Annual Inflation Rate INF
economic
Factors
Macro-
Interest Rate Lending Interest Rate INTR
Exchange Rate Yearly Average Exchange Rate EXCH
Model Estimation and Selection
In order to identify the indicators that affect the profitability of banks, it is better considered to employ panel data analysis.
Panel data models which evaluate the effect of internal and external indicators on commercial bank profitability are given
below:
Fixed effect model (FEM) and random effect model (REM) are the most pronounced models which are used for panel data
analysis (Brooks, 2019). To eliminate the specification bias and select whether FEM is good or REM, Hausman test statistics
shall be utilized. Hausman test chooses the more efficient model against the less efficient model but the consistent one. With
the help of Hausman test statistics, for the current paper, the FEM is the suitable one. In view of Gujarati (2012) when the
Hausman test statistics probability value comes less than 5%, then it is reasonable to employ FEM instead of REM.
Hausman test statistics for ROA model
Table 2: Hausman test statistics for ROA model
H = 42.8927 with p-value = prob (chi-square (10) > 42.8927) = 0.0000
(A low p-value counts against the null hypothesis that the random effects
5|https://giapjournals.com/hssr/index © Farooq et al.Humanities & Social Sciences Reviews
eISSN: 2395-6518, Vol 9, No 2, 2021, pp 01-13
https://doi.org/10.18510/hssr.2021.921
model is consistent, in favor of the fixed effects model.)
Hausman test statistics for ROE model
Table 3: Hausman test statistics for ROE model
H = 25.2996 with p-value = prob (chi-square (10) > 25.2996) = 0.0048
(A low p-value counts against the null hypothesis that the random effects
model is consistent, in favor of the fixed effects model.)
Hausman test statistics for NIM model
Table 4: Hausman test statistics for NIM model
H = 25.3287 with p-value = prob (chi-square (10) > 25.3287) = 0.0048
(A low p-value counts against the null hypothesis that the random effects
model is consistent, in favor of the fixed effects model.)
The above tables 2, 3, and 4 indicate that the probability values for return on assets, return on equity and net interest margin
are 0.0000, 0.0048, and 0.0048, respectively. All the above values are under 5% significance level. Hence, on the basis of the
aforementioned values, it is concluded that FEM is more suitable for this study than REM.
For the regression analysis accuracy, it is important to relax some of the basic OLS assumptions. Thus, before running
regression analysis, it is considered essential to address the issues of multicollinearity, heteroscedasticity, and
autocorrelation. Multicollinearity issue is checked through the variance inflation factor (VIF) portrayed in table 6, which
clarifies the absence of multicollinearity. Gujarati (2012) suggested that multicollinearity is not problematic when the (VIF)
value comes lesser than 10. Another assumption of the regression model is heteroscedasticity. When error terms have
constant variances, it is called homoscedasticity; otherwise, it is called heteroscedasticity (Brooks, 2019). To deal with the
problem concerning heteroscedasticity, it is suitable to employ a white cross test. In this paper, a white cross-section test is
utilized, and the model is assessed through estimated Generalized Least Squares (EGLS) weights (cross-sectional) of the
balanced panel in which a single observation for each bank created a cross-section (ur Rehman et al., 2018; Vong & Chan,
2009). To deal with the autocorrelation problem the Durbin Watson test is utilized. If Durban Watson values lie between the
range of (1 to 3), it demonstrates the absence of autocorrelation (Bhatt & Verghese, 2018; Vong & Chan, 2009). The DW
values of 1.119, 1.396, and 1.179 shown in table 8 for ROA, ROE, and NIM models respectively, lie between the range of (1
to 3), show the absence of serial correlation problem in this study.
Table 5: Variance Inflation Factor
Variable VIF
CADR 1.66
OEFF 1.54
DEPR 1.33
LIQ 1.38
LEV 1.46
NoB 3.23
LnSize 4.43
GDP 3.25
INF 3.28
INTR 4.31
EXCH 3.45
DATA ANALYSIS AND PRESENTATION
Descriptive Statistics
It has been observed from table 6 that the number of branches (NoB) has the most extreme mean estimation of 423.91 while
another autonomous variable, GDP, has the least estimation of the mean of 1.35. Concerning standard deviation, LEV has
6|https://giapjournals.com/hssr/index © Farooq et al.Humanities & Social Sciences Reviews
eISSN: 2395-6518, Vol 9, No 2, 2021, pp 01-13
https://doi.org/10.18510/hssr.2021.921
the least standard deviation value of 0.04, while the number of branches (NoB) got the highest deviation value of 475.24.
This figure is high as a contrast with the factors that are in the table that implies that the information focuses on the number
of branches (NoB) that has widely spread around its mean.
Table 6: Descriptive Statistics
Variable Mean Median Minimum Maximum Std. Dev.
ROA 0.18 0.15 0.00 0.74 0.16
ROE 1.04 1.14 0.00 1.76 0.37
NIM 1.10 1.11 -0.12 1.94 0.37
CADR 2.12 2.07 -0.17 3.92 0.62
OEFF 3.45 3.44 2.59 4.39 0.32
DEPR 4.31 4.33 3.85 4.51 0.13
LIQ 2.15 2.07 1.22 3.47 0.41
LEV 4.52 4.52 4.40 4.58 0.04
NoB 423.91 226.00 2.00 1716.00 475.24
LNSZ 19.22 19.33 16.03 21.89 1.36
GDP 1.35 1.54 0.40 1.76 0.40
INF 1.97 2.01 0.82 2.65 0.55
INTR 2.42 2.47 2.05 2.63 0.19
EXCH 4.56 4.62 4.27 4.70 0.13
Correlation Matrix
Based on correlation coefficients shown in table 7, the relationship of operational efficiency, deposit ratio, leverage, bank
size, GDP, and the exchange rate is negative with ROA. at the same time, the capital adequacy, liquidity, number of
branches, inflation, and rate of interest have a positive association with ROA. Regarding ROE, the relationship of operational
efficiency, capital adequacy, liquidity, inflation, and interest rate is negative with ROE, while the number of branches,
deposit ratio, leverage, bank size, GDP, and the exchange rate is in line with the direction of profitability (ROE). Concerning
NIM, the relationship of operational efficiency, deposit ratio, leverage, bank size, GDP, and the exchange rate is negative
with NIM, while the capital adequacy, liquidity, number of branches, inflation, and interest rate move in the same direction
with the NIM.
Table 7: Correlation Matrix
ROA ROE NIM CADR OEFF DEPR LIQ LEV NOB LNSIZE GDP INF INTR
ROA 1
ROE 0.63 1
NIM 0.23 0.01 1
CADR 0.21 -0.25 0.37 1
OEFF -0.26 -0.49 -0.01 0.3 1
DEPR -0.18 0.16 -0.05 -0.32 -0.11 1
LIQ 0.16 -0.05 0.27 0.22 0.16 0.05 1
LEV -0.3 0.08 -0.46 -0.51 -0.08 0.22 -0.15 1
NOB 0.15 0.36 0.19 -0.11 -0.26 0.22 0.13 -0.05 1
LNSIZE -0.04 0.43 -0.01 -0.34 -0.4 0.29 -0.21 0.2 0.75 1
GDP -0.16 0.07 -0.18 -0.13 0.12 -0.07 -0.24 0.1 0.14 0.32 1
INF 0.14 -0.05 0.16 0.08 -0.1 0.1 0.25 -0.08 -0.11 -0.28 -0.74 1
INTR 0.21 -0.04 0.27 0.11 -0.18 0.14 0.27 -0.12 -0.14 -0.33 -0.77 0.79 1
7|https://giapjournals.com/hssr/index © Farooq et al.Humanities & Social Sciences Reviews
eISSN: 2395-6518, Vol 9, No 2, 2021, pp 01-13
https://doi.org/10.18510/hssr.2021.921
EXCH -0.24 0.04 -0.21 -0.09 0.12 -0.03 -0.25 0.12 0.12 0.33 0.78 -0.75 -0.78
Regression Analysis
Based on the given results in table 8, as profitability is measured through ROA, it seems that among internal indicators
CADR, DEPR, LEV, LIQ, and LNSZ have a statistically significant association with ROA. Furthermore, CADR, DEPR, and
NoB have positive while the remaining bank-specific indicators have a negative association with ROA. The positive
connection between ROA and CADR is in line with the results of Le and Nguyen (2020) and Shair et al. (2019) that a bank
with sound capital health could grab business opportunities all the more effectively and has excess time and flexibility to
deal with difficulties developing from unpredicted losses, along these lines accomplishing increased profitability. DEPR and
ROA have a positive link, and it aligns with the findings of Owoputi et al. (2014) and Almaqtari et al. (2019) that increased
DEPR provides credit and investment opportunities which ultimately boosts financial health. LEV ratio, contrary to the
researcher's anticipation, not merely has an adverse association with ROA, but also the connection is statistically substantial.
The negative association among LEV and ROA complies with the results of Khan (2012) and Al-Homaidi et al. (2018) that
external financings are generally more costly than internal equity financing due to interest and solid covenant connect to the
utilization of it, hence utilizing greater extents of them could prompt lower benefit. The negative relationship between LIQ
and ROA supports the findings of (Al-Homaidi et al., 2018; Vera-Gilces et al., 2020). Furthermore, the result is predictable
with the financial hypothesis, which expresses that the risk and productivity have a positive affiliation. Along these lines, if
the degree of liquidity rises, the degree of dangers will decrease and eventually brings about lower benefits. The negative
association of LNSZ with ROA is not in agreement with the researcher's anticipation; however, it is statistically significant.
The outcome is in consent with the results of ur Rehman et al. (2018) and Rahman et al. (2020) that potentially, larger banks
develop as in contrast to smaller business banks, their costs ascend, diseconomies of scale happens and eventually brings
about lower benefits.
Table 8: Model Estimation Results
ROA ROE NIM
Std. t- Std. Std.
Variable Coeff. Prob. Coeff. t-Stat. Prob. Coeff. t-Stat. Prob.
Er. Stat. Er. Er.
C 4.054 1.203 3.37 0.001 5.2 1.592 3.266 0.001 3.317 2.13 1.557 0.121
-
CADR 0.01 0.005 2 0.047 -0.021 0.023 0.372 0.078 0.024 3.223 0.002
0.895
DEPR 0.166 0.052 3.18 0.002 0.299 0.1 3 0.003 0.32 0.121 2.64 0.009
- -
LEV -0.576 0.231 0.013 -0.721 0.296 0.016 -0.542 0.477 -1.137 0.257
2.498 2.438
- -
LIQ -0.064 0.022 0.005 -0.079 0.059 0.183 -0.03 0.03 -0.992 0.322
2.862 1.336
- -
LNSZ -0.069 0.029 0.018 -0.044 0.048 0.366 -0.08 0.024 -3.362 0.001
2.388 0.905
-
NoB 0 0 -0.54 0.59 0 0 0.51 0 0 2.469 0.014
0.661
- -
OEFF -0.024 0.058 0.674 -0.23 0.062 0 -0.034 0.052 -0.653 0.514
0.421 3.723
- -
EXCH -0.108 0.049 0.029 -0.018 0.105 0.867 -0.246 0.12 -2.057 0.041
2.198 0.168
GDP 0.026 0.007 3.925 0 0.028 0.015 1.896 0.059 -0.02 0.029 -0.686 0.494
- - -
INF -0.036 0.005 0 -0.042 0.009 0 -0.124 0.011 0
7.346 4.824 10.905
-
INTR 0.038 0.04 0.958 0.339 -0.078 0.075 0.299 0.664 0.064 10.385 0
1.042
R-
0.776 0.696 0.823
squared
F-stat 21.23 13.992 28.481
Prob(F-
0 0 0
stat)
D- 1.119 1.396 1.179
8|https://giapjournals.com/hssr/index © Farooq et al.Humanities & Social Sciences Reviews
eISSN: 2395-6518, Vol 9, No 2, 2021, pp 01-13
https://doi.org/10.18510/hssr.2021.921
Watson
Among macro-economic indicators EXCH, GDP, and INF are statistically significant. GDP and INTR have a positive link
with ROA, while the rest are negative. EXCH rate, contrary to the researcher's expectation, is not only negative but also has
a significant impact on ROA. The negative connection between EXCH and ROA is in line with the results of Ayano and
Ponnala (2016) and Hasan et al. (2020) that during the valuation of foreign currency, banks having more liabilities in foreign
money as compare to equity interact with greater losses, it implies that the net gain of the bank is diminished, yet the
resources of the bank have stayed unaltered. The positive connection among GDP and ROA is supported by the results of ur
Rehman et al. (2018) and Uralov (2020) that during increasing economic growth, business opportunities go up, which make
spaces for better venture openings and investments through the bank's excess resources and fund, and furthermore, the
demand for credit and fund may also be increased. The negative relationship between INF and ROA is in line with the results
of Abebe (2014) and Jadah et al. (2020) that banks cannot precisely anticipate INF levels and adjust interest rates
accordingly, ultimately deteriorates bank profitability.
Concerning ROE regression results in table 8, it seems that DEPR, LEV, and OEFF have a statistically significant link with
ROE among internal indicators. Furthermore, DEPR and NoB have positive, while the remaining bank-specific indicators
have a negative association with ROE. The positive association between DEPR and ROE supports the results of Elekdag et
al. (2020) and Owoputi et al. (2014) that a bank with higher deposits is more capable of embracing loaning opportunities
and other favorable business and investing opportunities which ultimately bring about the performance to boost. LEV ratio,
contrary to the researcher's expectation, not only has a negative association but also it is significant. This outcome is in
alignment with the results of (Al-Homaidi et al., 2018; Khan, 2012). The negative relationship between OEFF and ROE
confirms the efficiency of management and stands by the results of (Al-Homaidi et al., 2020; Ercegovac et al., 2020).
Among macro-economic indicators, GDP and INF are statistically significant. Moreover, only GDP has a positive
relationship with ROE; the rest are negative. Economically enhanced conditions in the country generally boost business and
financial activities and provide credit and investment opportunities which ultimately bring an upturn in the performance of
organizations (Dietrich & Wanzenried, 2011; Shair et al., 2019). The inverse relationship between INF and ROE may be due
to the weaknesses of banks that can't predict inflation levels accurately and support the results (Abebe, 2014; Yao et al.,
2018).
Concerning NIM results shown in table 8, it seems that among internal indicators CADR, DEPR, LNSZ, and NoB have a
statistically significant association with NIM. Furthermore, CADR, DEPR, and NoB have positive results, while the
remaining bank-specific indicators have a negative association with NIM. The positive association between CADR and NIM
supports the results of (Rani & Zergaw, 2017; Shair et al., 2019). DEPR and NIM have a positive relationship and support
the outcome of (Al-Homaidi et al., 2018; Owoputi et al., 2014). LNSZ, contrary to the researcher's expectation, not only has
a negative association but also statistically significant. This finding is in consent with the outcome of (Naeem et al., 2017).
NoB positively impacts NIM, and this result is in line with the findings of (Al-Homaidi et al., 2018).
Among macro-economic indicators EXCH, INF and INTR are statistically significant. Furthermore, only INTR has a
positive relationship with NIM, and the rest are negative. EXCH rate, contrary to the researcher's expectation, has a negative
association and is statistically significant, and this result is in line with the findings of (Al-Homaidi et al., 2018). INF has a
negative and significant relationship with NIM, and it is in agreement with the results of (Yao et al., 2018). The positive
relation between INTR and NIM does not conform with the anticipation of the researcher. However, the value of probability
indicates that INTR has a substantial impact on NIM. The positive relationship recommending that when banks advancing
loans to their clients, they charge a higher rate in contrast when they pay on deposit or on other liabilities or shortly it can be
concluded that saving rate is lesser than that of lending rate, ultimately the positive spread helps the bottom-line to increase.
This finding is steady with the result of (Al-Harbi, 2019).
CONCLUSION
The present work's primary purpose was to identify the indicators of profitability of the commercial banking industry of
Pakistan. Based on the past work done in an attempt to determine the indicators which affect profitability, and including this
study, it is clarified that profitability can be influenced by either indicator (micro and macro-economic). By using internal
factors inclusive of capital adequacy, operational efficiency, deposit ratio, liquidity, leverage, number of branches, and bank
size with the macro-economic indicators pertaining to GDP, rate of inflation, interest rate, and rate of foreign exchange, this
paper seeks to identify the indicators of profitability concerning commercial banking industry working in Pakistan covering a
time span from 2009 to 2018 and taking 25 commercial banks. Data analysis is carried out with descriptive statistics,
correlation analysis, and a fixed-effect model.
On the basis of the results of the study, it is to conclude that CADR, DEPR, and GDP have a positive and substantial
relationship with ROA; contrary to the above, LIQ, LEV, LNSZ, EXCH and INF have a significant and negative impact on
9|https://giapjournals.com/hssr/index © Farooq et al.Humanities & Social Sciences Reviews
eISSN: 2395-6518, Vol 9, No 2, 2021, pp 01-13
https://doi.org/10.18510/hssr.2021.921
ROA. Regarding commercial bank profitability as proxied by ROE, the outcomes showed that DEPR and GDP have a
significant positive association with ROE; on the other hand, LEV, OEFF, and INF have a negative and substantial
association with ROE. Concerning banking profitability as proxied by NIM, the findings revealed that CADR, DEPR, NoB,
and INTR are positively and significantly related to NIM, while LNSZ, EXCH, and INF are significantly and negatively
affecting NIM.
In view of the study's outcome, the explanatory factors explained 77%, 69%, and 82% variations in ROA, ROE, and NIM,
respectively. It is perceived that there are some other outer and interior factors (bank class, market fixation, charge rate,
industry development, bank proprietorship, bank age, government guideline, innovation, and so on) that could impact the
benefit of business banks in Pakistan. Thus, for future studies, it could be suitable to include the above factors. Furthermore,
it could be possible to conduct comparative studies between the countries or between the banking industries like private vs
public banks.
LIMITATIONS AND FUTURE RESEARCH DIRECTIONS
The limitations of the research include the fact that it was restricted to listed commercial banks. Also, only such
determinations were tested in Pakistan. Future research should include all commercial banks, including non-listed ones.
Besides, considerations can also be made to analyze the variations in profitability determinants between small and big or
high and low profitability banks.
POLICY IMPLICATIONS
Implications for Government: Based on the empirical results reported in this investigation, among macro-economic
indicators, inflation has a substantial and negative impact on ROA, ROE, and NIM. The government is needed to put in
action such as macroeconomic approaches and systems that are fit for controlling dramatic changes in inflation rates.
The government may consider those approaches and systems which help and facilitate the financial exercises in the
country.
Implications for Bank Managers: As inflation is a critical indicator, bank supervisors are needed to foresee
inflationary ups and downs precisely. As reported in the results, DPER has a substantial and positive effect on ROA,
ROE, and NIM. Banks may increase their deposits because it is the economical funding source for banking businesses,
and this is argued that increased deposit liabilities provide credit opportunities and other profitable investments. During
rising economic growth rates, banks may boost their profitable investment opportunities by utilizing their surplus funds.
Implications for Investors: The results also assist people or investing class in perceiving productivity indicators and
making the pertinent investigation of fiscal summaries to settle on educated and valued equity investing choices.
Implications for Researchers and Academicians: This study acts as a guide for more research works regarding the
interior and macro-economic indicators influencing the financial performance of the institutions.
ACKNOWLEDGEMENT
We would like to thank all the independent reviewers of HSSR who conducted a feasibility study of our research work.
AUTHORS CONTRIBUTION
Mohammad Farooq and Shiraz Khan wrote the research paper and design the organization of this paper; Atif Atique
Siddiqui, Muhammad Tariq Khan, and Muhammad Kamran Khan perform the statistical analysis, interpretations, and
technical parts. Thus, all authors contributed significantly to this research.
REFERENCES
1. Abbas, S. A. (2019). The determinants influencing liquidity of Pakistan's commercial and Islamic banks
(Unpublished master's thesis). Newports Institute of Communication & Economics.
2. Abdelaziz, H., Rim, B., & Helmi, H. (2020). The interactional relationships between credit risk, liquidity risk and
bank profitability in MENA region. Global Business Review, 0972150919879304.
https://doi.org/10.1177/0972150919879304
3. Abebe, T. (2014). Determinants of financial performance: An empirical study on Ethiopian commercial banks.
http://10.140.5.162//handle/123456789/2522
4. Al-Harbi, A. (2019). The determinants of conventional banks profitability in developing and underdeveloped OIC
countries. Journal of Economics, Finance and Administrative Science. 24(47), 4-28. https://doi.org/10.1108/jefas-
05-2018-0043
10|https://giapjournals.com/hssr/index © Farooq et al.Humanities & Social Sciences Reviews
eISSN: 2395-6518, Vol 9, No 2, 2021, pp 01-13
https://doi.org/10.18510/hssr.2021.921
5. Al-Homaidi, E. A., Almaqtari, F. A., Yahya, A. T., & Khaled, A. S. (2020). Internal and external determinants of
listed commercial banks' profitability in India: Dynamic GMM approach. International Journal of Monetary
Economics and Finance, 13(1), 34-67. https://doi.org/10.1504/ijmef.2020.105333
6. Al-Homaidi, E. A., Tabash, M. I., Farhan, N. H., & Almaqtari, F. A. (2018). Bank-specific and macro-economic
determinants of profitability of Indian commercial banks: A panel data approach. Cogent Economics & Finance,
6(1), 1548072. https://doi.org/10.1080/23322039.2018.1548072
7. Ali, M. (2015). Bank profitability and its determinants in Pakistan: A panel data analysis after financial crisis.
https://mpra.ub.uni-muenchen.de/id/eprint/67987
8. Almaqtari, F. A., Al‐Homaidi, E. A., Tabash, M. I., & Farhan, N. H. (2019). The determinants of profitability of
Indian commercial banks: A panel data approach. International Journal of Finance & Economics, 24(1), 168-185.
https://doi.org/10.1002/ijfe.1655
9. Arnold, G. (2008). Corporate financial management. Pearson Education.
10. Aspal, P. K., Dhawan, S., & Nazneen, A. (2019). Significance of bank specific and macroeconomic determinants on
performance of Indian private sector banks. International Journal of Economics and Financial Issues, 9(2), 168-
172. https://doi.org/10.32479/ijefi.7727
11. Ayano, D. F., & Ponnala, V. (2016). Determinants of commercial banks financial performance in Ethiopia.
(Unpublished master's thesis). Adis Ababa University.
12. Ayele, H. N. (2012). Determinants of bank profitability: An empirical study on Ethiopian private commercial banks
(Unpublished MBA project). Addis Ababa University.
13. Baltagi, B. H. (2005). Econometric analysis of panel data. John Wiley & Sons Ltd.
14. Batten, J., & Vo, X. V. (2019). Determinants of bank profitability—Evidence from Vietnam. Emerging Markets
Finance and Trade, 55(6), 1417-1428. https://doi.org/10.1080/1540496x.2018.1524326
15. Berger, A. N. (1995). Problem loans and cost efficiency in commercial banks (Vol. 95). Office of the Comptroller
of the Currency.
16. Bhatt, S., & Verghese, N. (2018). Influence of liquidity on profitability: Evidence from Nepalese banks.
International Journal of Multidisciplinary and Current research, 6. 1085-1090. https://doi.org/10.
14741/ijmcr/v.6.5.13
17. Brooks, C. (2019). Introductory econometrics for finance: Cambridge University Press.
18. Caliskana, M. T., & Lecunab, H. K. S. (2020). The determinants of banking sector profitability in Turkey1, 2.
Business and Economics Research Journal, 11(1), 161-167.
19. Davydenko, A. (2010). Determinants of bank profitability in Ukraine. Undergraduate Economic Review, 7(1), 2.
20. De Leon, M. (2020). The impact of credit risk and macroeconomic factors on profitability: The case of the ASEAN
banks. Banks and Bank Systems, 15(1), 21-29. https://doi.org/10.21511/bbs.15(1).2020.03
21. De Silva, D. N., Chinna, K., & Azam, S. F. (2019). Major determinants on the profitability of Sri Lankan local
commercial banks. European Journal of Economic and Financial Research, 3(5), 1-10.
https://doi.org/10.5281/zenodo.3533416
22. Dietrich, A., & Wanzenried, G. (2011). Determinants of bank profitability before and during the crisis: Evidence
from Switzerland. Journal of international financial Markets, Institutions and Money, 21(3), 307-327.
https://doi.org/10.1016/j.intfin.2010.11.002
23. Elekdag, S., Malik, S., & Mitra, S. (2020). Breaking the bank? A probabilistic assessment of Euro area bank
profitability. Journal of Banking & Finance, 120, 105949. https://doi.org/10.1016/j.jbankfin.2020.105949
24. Ercegovac, R., Klinac, I., & Zdrilić, I. (2020). Bank specific determinants of EU banks profitability after 2007
financial crisis. Management: Journal of Contemporary Management Issues, 25(1), 89-102.
https://doi.org/10.30924/mjcmi.25.1.5
25. Gujarati, D. (2012). Econometrics by example: Macmillan.
26. Gul, S., Irshad, F., & Zaman, K. (2011). Factors affecting bank profitability in Pakistan. Romanian Economic
Journal, 14(39), 61-87. https://econpapers.repec.org/RePEc:rej:journl:v:14:y:2011:i:39:p:61-87
27. Hasan, M. S. A., Manurung, A. H., & Usman, B. (2020). determinants of bank profitability with size as moderating
variable. Journal of Applied Finance and Banking, 10(3), 153-166.
https://econpapers.repec.org/RePEc:spt:apfiba:v:10:y:2020:i:3:f:10_3_7
28. Hays, F. H., De Lurgio, S. A., & Gilbert, A. H. (2009). Efficiency ratios and community bank performance. Journal
of Finance and Accountancy, 1(1), 1-15.
29. Jadah, H. M., Alghanimi, M. H. A., Al-Dahaan, N. S. H., & Al-Husainy, N. H. M. (2020). Internal and external
determinants of Iraqi bank profitability. Banks and Bank Systems, 15(2), 79-93.
https://doi.org/10.21511/bbs.15(2).2020.08
30. Karakuza, A. (2017). Bank specific determinants of profitability in Turkish banks.
https://scholars.fhsu.edu/cgi/viewcontent.cgi?article=1005&context=theses
11|https://giapjournals.com/hssr/index © Farooq et al.Humanities & Social Sciences Reviews
eISSN: 2395-6518, Vol 9, No 2, 2021, pp 01-13
https://doi.org/10.18510/hssr.2021.921
31. Khan, A. G. (2012). The relationship of capital structure decisions with firm performance: A study of the
engineering sector of Pakistan. International Journal of Accounting and Financial Reporting, 2(1), 245-262.
https://doi.org/10.5296/ijafr.v2i1.1825
32. Lardic, S., & Terraza, V. (2019). Financial ratios analysis in determination of bank performance in the German
banking sector. International Journal of Economics and Financial Issues. 9(3), 22-47.
https://doi.org/10.32479/ijefi.7888
33. Le, T. D., & Ngo, T. (2020). The determinants of bank profitability: A cross-country analysis. Central Bank
Review. https://doi.org/10.1016/j.cbrev.2020.04.001
34. Le, T. D., & Nguyen, D. T. (2020). Capital structure and bank profitability in Vietnam: A quantile regression
approach. Journal of Risk and Financial Management, 13(8), 168-172. https://doi.org/10.3390/jrfm13080168
35. Lemi, B. A., Rafera, M. K., & Gezaw, M. (2020). Macroeconomic and bank specific determinants of commercial
bank profitability in Ethiopia. International Journal of Commerce and Finance, 6(2), 198-206.
36. Levine, R. (1997). Desarrollo financiero y crecimiento económico: puntos de vista y agenda. The Economic
Journal, 35(2), 688-726.
37. Mamatzakis, E., & Remoundos, P. (2003). Determinants of Greek commercial banks, 1989-2000. Spoudai, 53(1),
84-94.
38. Munyambonera, E. F. (2012). Determinants of commercial bank performance in Sub-Saharan Africa.
http://hdl.handle.net/10570/2032
39. Naeem, M., Baloch, Q., & Khan, A. (2017). Factors affecting banks' profitability in Pakistan. International Journal
of Business Studies Review, 2(2), 33-49.
40. Nassreddine, G., Fatma, S., & Anis, J. (2013). Determinants of banks performance: Viewing Test by Cognitive
Mapping Technique: A case of biat. International Review of Management and Business Research, 2(1), 20-26.
http://www.ijceas.com/index.php/ijceas/article/view/71
41. Neto, A. A. (2003). Finanças corporativas e valor. Atlas.
42. Owoputi, J. A., Olawale, F. K., & Adeyefa, F. A. (2014). Bank specific, industry specific and macroeconomic
determinants of bank profitability in Nigeria. European Scientific Journal, 10(25), 1-10.
43. Petria, N., Capraru, B., & Ihnatov, I. (2015). Determinants of banks' profitability: evidence from EU 27 banking
systems. Procedia Economics and Finance, 20(15), 518-524. https://doi.org/10.1016/s2212-5671(15)00104-5
44. Rahman, H.-U., Yousaf, M. W., & Tabassum, N. (2020). Bank-Specific and Macroeconomic Determinants of
Profitability: A Revisit of Pakistani Banking Sector under Dynamic Panel Data Approach. International Journal of
Financial Studies, 8(3), 42. https://doi.org/10.3390/ijfs8030042
45. Rani, D., & Zergaw, L. N. (2017). Bank specific, industry specific and macroeconomic determinants of bank
profitability in Ethiopia. International Journal of Advanced Research in Management and Social Sciences, 6(3), 74-
96.
46. Saif-Alyousfi, A. Y. (2020). Determinants of bank profitability: Evidence from 47 Asian countries. Journal of
Economic Studies. https://doi.org/10.1108/jes-05-2020-0215
47. Shair, F., Sun, N., Shaorong, S., Atta, F., & Hussain, M. (2019). Impacts of risk and competition on the profitability
of banks: Empirical evidence from Pakistan. PloS one, 14(11), e0224378.
https://doi.org/10.1371/journal.pone.0224378
48. Shuremo, G. A. (2016). Determinants of banks'profitability: Evidence from banking industry in ethiopia.
International Journal of Economics, Commerce and Management, 4(2), 442-463.
49. Supiyadi, D., Arief, M., & Nugraha, N. (2019). The Determinants of Bank Profitability: Empirical evidence from
Indonesian Sharia Banking Sector. 1st International Conference on Economics, Business, Entrepreneurship, and
Finance (ICEBEF 2018). https://doi.org/10.2991/icebef-18.2019.6
50. Supriyono, R., & Herdhayinta, H. (2019). Determinants of Bank Profitability: The case of the regional development
bank (BPD Bank) in Indonesia. Journal of Indonesian Economy and Business, 34(1), 1-17.
https://doi.org/10.22146/jieb.17331
51. Tabash, M. I., Yahya, A. T., & Akhtar, A. (2017). Financial Performance Comparison of Islamic and conventional
banks in the United Arab Emirates (UAE). International Conference on Advances in Business, Management and
Law (ICABML). https://doi.org/10.30585/icabml-cp.v1i1.39
52. Tan, Y., & Floros, C. (2012). Bank profitability and GDP growth in China: a note. Journal of Chinese Economic
and Business Studies, 10(3), 267-273. https://doi.org/10.1080/14765284.2012.703541
53. Topak, M. S., & Tırmandıoğlu Talu, N. H. (2017). Bank specific and macroeconomic determinants of bank
profitability: Evidence from Turkey. https://econpapers.repec.org/RePEc:eco:journ1:2017-02-77
54. ur Rehman, Z., Khan, S. A., Khan, A., & Rahman, A. (2018). Internal factors, external factors and bank
profitability. Sarhad Journal of Management Sciences, 4(2), 246-259. https://doi.org/10.31529/sjms.2018.4.2.9
12|https://giapjournals.com/hssr/index © Farooq et al.Humanities & Social Sciences Reviews
eISSN: 2395-6518, Vol 9, No 2, 2021, pp 01-13
https://doi.org/10.18510/hssr.2021.921
55. Uralov, S. (2020). The Determinants of Bank Profitability: A Case of Central European Countries. Management,
8(3), 08-16.
56. Vera-Gilces, P., Camino-Mogro, S., Ordeñana-Rodríguez, X., & Cornejo-Marcos, G. (2020). A look inside banking
profitability: Evidence from a dollarized emerging country. The Quarterly Review of Economics and Finance, 75,
147-166. https://doi.org/10.1016/j.qref.2019.05.002
57. Vong, P. I., & Chan, H. S. (2009). Determinants of bank profitability in Macao. Macau Monetary Research
Bulletin, 12(6), 93-113.
58. Yadollahzadeh, N., Ahmadi, M., & Soltan, M. (2013). The effective factors on profitability of commercial banks in
Iran. World of Sciences Journal, 1(9).
59. Yao, H., Haris, M., & Tariq, G. (2018). Profitability determinants of financial institutions: Evidence from banks in
Pakistan. International Journal of Financial Studies, 6(2), 53. https://doi.org/10.3390/ijfs6020053
60. Yüksel, S., Mukhtarov, S., Mammadov, E., & Özsarı, M. (2018). Determinants of profitability in the banking
sector: an analysis of post-soviet countries. Economies, 6(3), 41-46. https://doi.org/10.3390/economies6030041
61. Yusgiantoro, I., Soedarmono, W., & Tarazi, A. (2019). Bank consolidation and financial stability in Indonesia.
International Economics, 159, 94-104. https://doi.org/10.1016/j.inteco.2019.06.002
62. Zampara, K., Giannopoulos, M., & Koufopoulos, D. N. (2017). Macroeconomic and industry-specific determinants
of Greek bank profitability. International Journal of Business and Economic Sciences Applied Research, 10(1), 3-
22. https://doi.org/10.25103/ijbesar.101.02
63. Peng, H. P. (2019). An exploratory study of advancing interdisciplinary research trends in digital new media.
Journal of Advanced Research in Social Sciences and Humanities, 4(5), 156-165.
https://dx.doi.org/10.26500/jarssh-04-2019-0502
64. Abdur Rahman, U. Y. (2020). Utilization of Indonesia's digital economy to invest in human capital and provide
socio-economic support to stimulate economic growth. International Journal of Business and Administrative
Studies, 6(6), 312-322 doi: https://dx.doi.org/10.20469/ijbas.6.10003-6
65. Fadahunsi, A., & Barake, L. (2018). Gender and microϐinance in the United Arab Emirates: An exploratory review
of concepts and policy issues. Journal of Management Practices, Humanities and Social Sciences. 2(2), 49-53. doi:
https://doi.org/10.33152/jmphss-2.2.4
66. Altantsetseg, P., Chen, K. C., & Chang, M. L. (2017). Male and female leaders' entrepreneurial leadership: A
comparative study of Mongolia, Taiwan and Thailand on leader-member exchange. Journal of Administrative and
Business Studies, 3(3), 144-152. doi: https://doi.org/10.20474/jabs-3.3.4
67. Dasig, Jr. D.D., Benosa, M. C., Pahayahay, A. B., Asejo, N. R., Tadeo, C., Cervantes, M. E., Mansueto, M.,
Arcalas, L., & Sabado, D. C. (2017). Glocalization of technology capability in these technological constellations.
International Journal of Business and Economic Affairs, 2(2), 106-115.
68. Chang, J. (2016). Globalization and curriculum: Inferring from Bernstein's code theory. International Journal of
Humanities, Arts and Social Sciences, 2(2), 52-57.
69. Osra, O. A. (2017). Urban transformation and sociocultural changes in King Abdullah Economic City (KAEC)
2005-2020: Key research challenges. Journal of Advances in Humanities and Social Sciences, 3(3), 135-151.
13|https://giapjournals.com/hssr/index © Farooq et al.You can also read