U.S. Bank Outlook 2021: Picking Up The Pieces And Moving On - Stuart Plesser Brendan Browne Devi Aurora - S&P Global

Page created by Isaac Perkins
 
CONTINUE READING
U.S. Bank Outlook 2021: Picking Up The Pieces And Moving On - Stuart Plesser Brendan Browne Devi Aurora - S&P Global
U.S. Bank Outlook 2021:               Stuart Plesser
                                      Brendan Browne

Picking Up The Pieces And Moving On
                                      Devi Aurora
                                      January 13, 2020
U.S. Bank Outlook 2021: Picking Up The Pieces And Moving On - Stuart Plesser Brendan Browne Devi Aurora - S&P Global
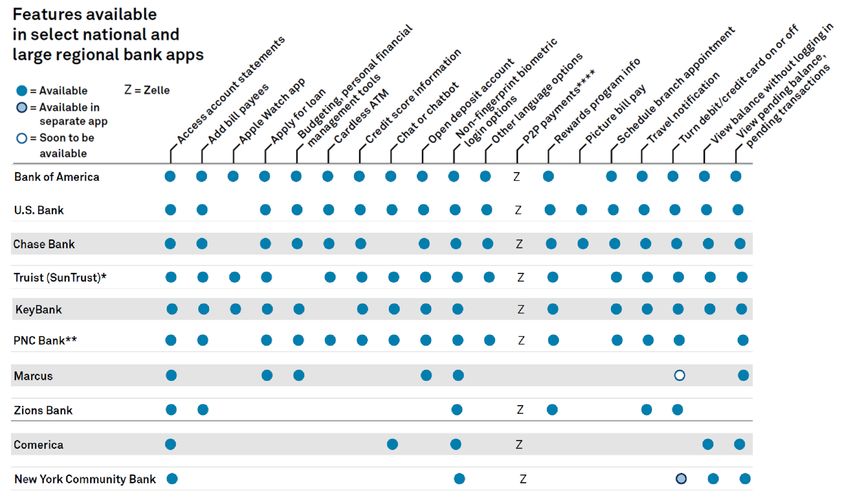
U.S. Bank Outlook 2021 | Contents
Key Takeaways                                   3

Key Risks                                       4

Credit Conditions                               5

U.S. Elections Impact                           6

Ratings Distribution                            7

2021 Forecast                                   9

Profitability                                   10

Allowances and Asset Quality                    13

Commercial Real Estate, Energy, And Consumers   18

Capital Ratios                                  24

Deposits                                        27

LIBOR                                           28

Mergers and Acquisitions                        29

Digitization                                    30

Subgroups and Related Research                  31
U.S. Bank Outlook 2021: Picking Up The Pieces And Moving On - Stuart Plesser Brendan Browne Devi Aurora - S&P Global
Key Takeaways
Key Expectations
– Bank earnings will improve on lower credit loss provisions, although pandemic-related asset quality challenges and decades-low net
  interest margins will keep profitability ratios below 2019 levels.
– The recently passed $900 billion stimulus bill, continued economic growth, and vaccine distribution will keep credit losses from rising
  as high as we had anticipated earlier in the pandemic.
– Loan charge-offs triggered by the pandemic will move toward our updated estimate for the U.S. banking system of 2.2% rather than
  our prior 3% estimate.
– With provisions, which equated to about 1.2% of loans in the first three quarters of 2020, falling to 1% or less of loans in 2021,
  allowances for credit losses will shrink.
– The Biden Administration and a Democrat-controlled Congress could push for more stimulus--which may benefit the economy and
  bank asset quality--but also higher corporate taxes and tougher regulatory and legal enforcement, which could pose risks for banks.
– Capital and liquidity will remain in good shape. However, regulatory capital ratios, which rose in 2020 in part due to restrictions on
  shareholder payouts, will likely decline with the easing of those restrictions.

Key Assumptions
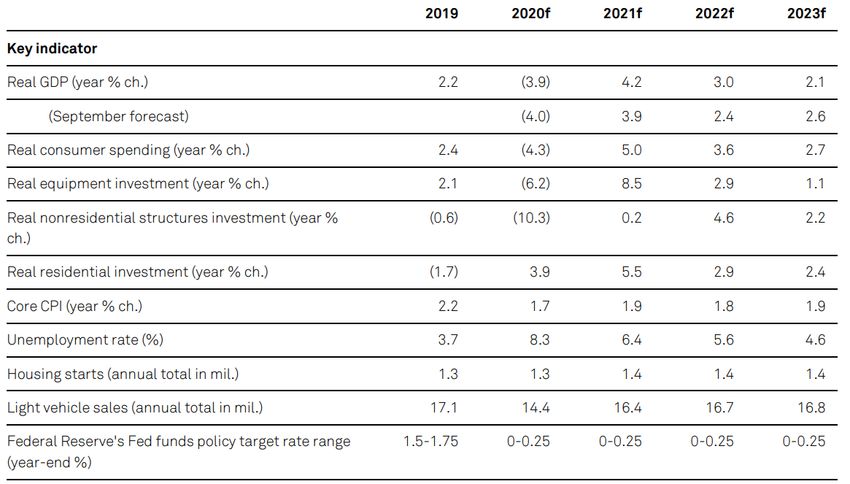
– U.S. real GDP will rebound at a modest 4.2% in 2021 after an estimated 3.9% contraction in 2020.
– GDP will reach its pre-pandemic level sometime in 2021, but unemployment will remain above pre-pandemic levels until after 2023.

                                                                                                                                            3
Key Risks

                                                                                            A further decline in net
A stalling of the economic                                    A downturn in commercial      interest income due to
                                 A slower-than-expected
rebound amid a sharp rise                                      real estate (CRE) due to    additional pressure from
                                distribution of the vaccine
   in coronavirus cases                                           secular changes         low rates or lackluster loan
                                                                                                    growth

 A sharper-than-expected
decline in capital related to                                  A failure to adequately      Unexpected changes in
                                An inability of many banks
an easing of restrictions on                                   prepare for the end of     regulation, enforcement, or
                                 to keep up with fintech
  payouts, mergers, asset                                       LIBOR in June 2023                 tax policy
  growth or other factors
Credit Conditions | North America
S&P Global U.S. Economic Forecast Overview

                                                                                                                                       – We expect the U.S. economy to have
                                                                                                                                         contracted 3.9% in 2020 with downside risk
                                                                                                                                         to our forecasted 4.2% recovery in 2021.
                                                                                                                                       – We expect real GDP to return to precrisis
                                                                                                                                         levels around third-quarter 2021, assuming
                                                                                                                                         no further stimulus beyond the recent $900
                                                                                                                                         billion bill.
                                                                                                                                       – The unemployment rate won't reach
                                                                                                                                         precrisis levels until 2024.
                                                                                                                                       – We expect the benchmark federal funds rate
                                                                                                                                         to remain at 0% until 2023.

 Note: All percentages are annual averages, unless otherwise noted. Core CPI is consumer price index excluding energy and food
 components. f--forecast. Data as of Dec 2, 2020. Sources: BEA, BLS, The Federal Reserve, Oxford Economics, and S&P Global Economics
 Forecasts.

                                                                                                                                                                                      5
What The 2020 U.S. Elections Could Mean For Banks
– Democrat control of the Presidency and both houses of Congress likely increases the odds of more fiscal stimulus,
  a higher corporate tax rate, and tougher regulatory and legal enforcement.

    Direction of change
    (somewhat worse versus
    somewhat better for banks)

    Tax policy

    Fiscal stimulus / PPP

    Prudential regulation

    Regulatory / legal enforcement

    Fintechs

   Source: S&P Global Ratings
Current U.S. Bank Ratings Distribution

Holding Company Rating Distribution                                                                       Operating Bank Rating Distribution

                                12/31/2020               12/31/2019                                                                    12/31/2020            12/31/2019
30%                                                                                                       25%

25%                                                                                                       20%

20%
                                                                                                          15%
15%
                                                                                                          10%
10%

 5%                                                                                                        5%

 0%                                                                                                        0%
                          AA-

                                                                                              B-
         AAA
               AA+

                                           A-

                                                                               BB-
                                                                                     B+
                                                                                          B
                     AA

                                A+

                                                                                                   CCC+
                                     A

                                                             BBB-
                                                                    BB+
                                                                          BB
                                                BBB+
                                                       BBB

                                                                                                                                                                                                   B-
                                                                                                                                                                                    BB-
                                                                                                                                                                                          B+
                                                                                                                                                                                               B
                                                                                                                                 AA-
                                                                                                                AAA
                                                                                                                      AA+

                                                                                                                                                A-

                                                                                                                                                                  BBB-
                                                                                                                                                                         BB+
                                                                                                                                                                               BB

                                                                                                                                                                                                        CCC+
                                                                                                                            AA

                                                                                                                                       A+

                                                                                                                                                     BBB+
                                                                                                                                                            BBB
                                                                                                                                            A
 Note: Includes Puerto Rican banks. Data as of Dec 31, 2020. Source: S&P Global Ratings.

                                                                                                                                                                                                               7
Current U.S. Bank Outlooks Distribution
Holding Company Outlook Distribution                                                                             Operating Bank Outlook Distribution

                                               Positive          Stable           Negative                                                                       Positive          Stable          Negative

                                 0%          20%         40%          60%         80%         100%                                                0%          20%          40%          60%         80%        100%

Money Center Banks                                                4                                               Money Center Banks                                                4

        Regional Banks               3                23                           20                                     Regional Banks              3               27                            24

              Trust Banks                                         3                                                            Trust Banks                                          3

         Broker Dealers                                           2                                                        Broker Dealers                                           2

Total HoldCo Ratings                3                  31                            21                             Total OpCo Ratings               3                  36                            24

The three entities on positive have ratings on CreditWatch with positive implications. Money Center Banks--Wells Fargo, Bank of America, Citigroup, JPMorgan. Broker Dealers--Morgan Stanley, Goldman Sachs.
Trust Banks--Bank of New York Mellon, Northern Trust, State Street. Note: Includes Puerto Rican banks. Data as of Dec 31, 2020. Source: S&P Global Ratings.

                                                                                                                                                                                                                  8
2021 Forecast | Hinging On Pandemic Control
     Worsening                                                        Neutral                                                          Improving

                      Ultralow interest rates will continue to hurt spread income with margins near multidecade lows with some offset from the recent
                      yield curve steepening. Loan growth has recently been tepid—with consumers lowering leverage and commercial borrowers turning
    Revenues
                      to the capital markets—and may only partially offset the pressure of low rates. A drop from 2020’s elevated revenues from capital
                      markets and mortgage activity could lead to an overall drop in fees.

                      Expenses will remain in sharp focus. Banks will manage costs by redeploying personnel, consolidating branches, containing head
    Expenses          count, and growing digitization, but rising servicing expenses will somewhat offset this. We expect positive operating leverage will
                      remain a challenge for many banks.

                      While banks are likely to report mediocre profitability, they should see somewhat better earnings than in 2020. We expect provisions
   Profitability      to decline but remain higher than in 2019. Allowances, which surged in the first half of 2020, should begin to abate. However, revenue
                      pressure will limit returns on equity to the single digits.

                      Although banks have seen drops in loans on forbearance, certain loan classes remain under asset quality pressure and we expect
  Credit quality      pandemic-related charge-offs to rise toward 2% (taken cumulatively in 2020 and 2021). The strength of the economy and the
                      effectiveness of government stimulus will greatly influence that ratio.

                      Banks have maintained or improved upon the good regulatory capital ratios they entered the pandemic with due in part to
     Capital          restrictions on payouts and a delay of the impact of CECL (current expected credit losses) regulation. However, ratios should decline
                      somewhat due to the Fed’s easing of payout restrictions beginning in 2021.

                      Extraordinary expansion of the Fed’s balance sheet after the onset of the pandemic has once again lowered deposit costs, which will
Funding & liquidity   likely persist. Liquidity for most banks is likely to remain robust, aided by significant deposit inflows on the heels of the Fed's
                      massive quantitative easing measures.

                                                                                                                                                               9
Bank Profitability To Improve But Remain Weaker Than In 2019
– Bank profits are likely to rise meaningfully on a drop in provisions. However, provisions should remain higher than in 2019.
– Low rates will also continue to weigh on net interest margins and limit any rebound in preprovision net revenue (PPNR).
– We expect banks to earn a return on average equity of around 9% and 10% in 2021 and 2022.

All FDIC-Insured Banks: Historical and Forecasted Performance
                                                   PPNR                Provisions for Loan Losses    Net Income    ROAE (right axis)

            400                                                                                                                                12%
            350
                                                                                                                                               10%
            300
                                                                                                                                               8%
  ($ bil)

            250
            200                                                                                                                                6%
            150
                                                                                                                                               4%
            100
                                                                                                                                               2%
             50
              0                                                                                                                                0%
                            2016                       2017                          2018     2019         2020E         2021E         2022E
Source: FDIC data.
Copyright © 2018 by Standard & Poor’s Financial Services LLC. All rights reserved.

                                                                                                                                                     10
The Lowest NIM In Decades Will Weigh On PPNR And Profitability
Effective Federal Funds, 3-Month LIBOR, And 10- year Treasury
                                                                                                                Median NIM Of Rated Banks
Rates
               Effective Federal Funds Rate, Percent, Monthly, Not Seasonally Adjusted                                                               Regionals          Money Center
               10-Year Treasury Minus 2-Year Treasury, Constant Maturity
               3-Month LIBOR based on U.S. Dollar
3.0%                                                                                                               4.0%
                                                                                                                            3.48%     3.41%       3.40%      3.37%
                                                                                                                   3.5%                                                  3.27%      3.23%
2.0%                                                                                                                                                                                             3.02%    2.91%
                                                                                                                   3.0%
                                                                                                                            2.50%     2.46%       2.43%                  2.40%
                                                                                                                                                             2.37%                  2.27%
1.0%                                                                                                               2.5%                                                                          2.08%    1.97%
                                                                                                                   2.0%
0.0%
                                                                                                                   1.5%

                                                                                                                             4Q18

                                                                                                                                        1Q19

                                                                                                                                                     2Q19

                                                                                                                                                                 3Q19

                                                                                                                                                                           4Q19

                                                                                                                                                                                       1Q20

                                                                                                                                                                                                   2Q20

                                                                                                                                                                                                           3Q20
Yields and Costs: All Commercial Banks
                                                                             3Q19             4Q19          1Q20            2Q20           3Q20
   6.0        5.42 5.26
                        5.05
                                 4.40 4.32             4.25 4.07
                                                                 3.81
   4.0                                                                   3.06 2.84                                                                                        3.25 3.20 3.09
                                                                                                                                                                                              2.68 2.57

   2.0                                                                                         1.19 1.03                            1.37 1.19
                                                                                                         0.83                                 0.98
                                                                                                                0.43 0.32                             0.53 0.40
   0.0
               Average Loans & Leases                   Average Earning Assets             Average Interest-Bearing Deposits Average Interest-Bearing Liabilities             Net Interest Margin
Source: S&P Global Ratings; Company filings; FDIC; Regulatory filings; St. Louis Fed Economic Database.

                                                                                                                                                                                                                  11
Modest Loan Growth May Also Limit Earnings Improvement
– Consumers may continue to pay down or limit credit card debt, and commercial borrowers may avoid drawing more on bank lines until the
  pandemic abates and the economy shows more signs of strength.
– Banks may again increase PPP lending following the passage of the December stimulus bill, but those loans will not materially drive
  earnings or remain outstanding for more than a year.
Index of Bank Loan Growth

 4Q19 = 100                          Commercial                   CRE             Total             Res real estate                      Consumer               Commercial ex-PPP
        115
                                                                         112                                                        115
                                                                                                                                                                                                 Commercial, 111
        110
                                                                         104                                                      105
        105                                                                                                                                                                                      CRE, 104
                                                                         102                                                                                                                    Total, 104
                100                                                                                                                 103
                                                                                                                              101
        100                                                                                                                                                                                     Res real estate, 100
                                                                           100                                                    100
                                                                                                                                                                                                Commercial ex-PPP, 97
          95                                                             96                                                         93
                                                                                                                                                                                                Consumer, 93
          90

Source: S&P Global Ratings; S&P Market Intelligence; Call report data. Note: Commercial loans includes C&I, owner-occupied CRE loans, loans to banks and nondepository financial institutions, leases, and agriculture
production loans on schedule RC-C Part I of the call report. Assumes banks include PPP loans in those commercial loans. CRE includes non-owner-occupied CRE, construction, and multifamily loans.

                                                                                                                                                                                                                         12
Allowances Should Fall As The Odds Of Severe Losses Have Dropped

The Path Of The Allowance For Loan Losses (ALL) for FDIC-Insured Banks: S&P Global
Ratings Base Case
                                  350                                                                                                       2.5%                                         – We now expect pandemic-related loan
                                                                                                                                                                                           charge-offs, absorbed mostly in 2020 and
                                  300                                                                                                                                                      2021, for all Federal Deposit Insurance Corp.
                                                                                             2.24%                                          2.0%

                                                                                                                                                   (Allowance for loan losses / loans)
                                                                                  43                                                                                                       (FDIC)-insured banks of slightly more than
(ALL, provisions, NCOs, $ bil.)

                                  250
                                                                                                                                                                                           2%, or about one-third of the level the Fed’s
                                                                     129                                                                                                                   forecasts in its severely adverse scenario.
                                                                                                                                            1.5%
                                  200
                                                       1.51%                                                                     1.51%                                                   – We lowered that estimate from about 3%
                                  150                                                                    184                                                                               because most asset quality metrics have
                                          1.18%         34                                                                                  1.0%
                                                                                             244
                                                                                                                                                                                           held relatively stable, loans on forbearance
                                                                                                                     104                                                                   have dropped sharply, and vaccine
                                  100
                                                                                                                                  164
                                                                                                                                            0.5%
                                                                                                                                                                                           distribution has begun. However, we have
                                          124          124
                                  50                                                                                                                                                       maintained a higher loss estimate for CRE.
                                                                                                                                                                                         – At a roughly 2% loss rate, we believe banks
                                   0                                                                                                        0.0%                                           would be more than halfway done with
                                        ALL: 4Q19   ALL + day 1   Provisions,   NCOs, 3Q   ALL: 3Q20   Estimated   Additional   ALL, post
                                                       CECL         3Q YTD        YTD                  pandemic     required    pandemic                                                   pandemic provisions and likely to reduce
                                                    adjustment                                         remaining   provisions
                                                                                                         NCOs
                                                                                                                                                                                           their allowances for loan losses (ALL).

Based on estimated pandemic net charge-offs (NCOs) and provisions.
                                                                                                                                                                                         – Still, provisions should remain higher than
Light blue = ALL; Dark Blue = Increase to ALL; Yellow = decrease to ALL; Pink= ALL/loans                                                                                                   they were in 2019.
Source: S&P Global Ratings.

                                                                                                                                                                                                                                           13
A Drop In Deferrals Has Supported A Less Pessimistic Outlook
– A drop in the median deferral rate on loans of rated banks in third-quarter 2020 to about 2.5% from about 8% in the second quarter likely
  means consumer loan losses will not rise as sharply as feared earlier in the pandemic.
– The December stimulus bill should also limit consumer losses.
– Still, if the economy performs poorly, borrowers who have exited forbearance may face new stress.

2020 Q2 Deferral Rate Distribution                                                    2020 Q3 Deferral Rate Distribution

                                                                                                                                                                         Box-and-whisker plot:
                                                                                                                                                                         Upper point of whisker: Highest value,
                                                                                                                                                                         exclusive of outliers
                                                                                                                                                                         Upper edge of box: 3rd Quartile value
                                                                                                                                                                          Mark in box: Median
                                                                                                                                                                          Lower edge of box: 1st Quartile value
                                                                                                                                                                          Lower point of whisker: Lowest value,
                                                                                                                                                                         exclusive of outliers
Source: Earnings releases or 10-Qs. Dataset includes S&P rated US bank universe, excluding monolines, broker dealers, trust banks; not every bank discloses each item,
and disclosure may not be in exact classification; Consumer includes Residential Mortgage; Wholesale/Commercial includes CRE and C&I.)

                                                                                                                                                                                                                  14
Most Asset Quality Measures Stable, But Criticized Loans Rising
– Government support measures, good third-quarter economic growth, and deferrals have mitigated deterioration in many asset quality
  metrics.
– Still, commercial and industrial (C&I) and CRE loans are showing signs of stress as reflected in increased criticized loans. We expect
  commercial loans to account for many of 2021’s net charge-offs (NCOs).

Asset Quality Of U.S. Commercial Banks

                                      Nonperfoming Loans                           Net Chargeoffs                       Delinquencies (30-90+)                           Criticized Loans
        4.0
        3.5                                                                                                                                                                                                         3.58
        3.0
        2.5
 (%)

        2.0
        1.5
        1.0                                                                                                                                                                                                        0.84
        0.5                                                                                                                                                                                                         0.64
                                                                                                                                                                                                                   0.45
        0.0
                        Q4 '18                    Q1 '19                    Q2 '19                    Q3 '19                    Q4 '19                    Q1 '20                    Q2 '20                    Q3 '20
All U.S. Commercial Banks results estimated by aggregating Call Report data. Criticized loans are for 40 rated banks that have consistently reported such data for all reporting periods in the chart. Source: S&P Global
Ratings; S&P Global Market Intelligence; Regulatory filings

                                                                                                                                                                                                                            15
A Lens On Possible Loss Rates
 -    At our roughly 2% pandemic projection, loan losses would be material but far lower than in the global financial crisis and what the Fed
      projects in the severely adverse scenario of its annual stress test.

Provisions To Loans: Current Period Versus The Financial Crisis                        How Allowances And Provisions Compare To DFAST Loan Losses
And Fed’s Severely Adverse Scenario                                                    And Provisions
                                                                                       3Q Allowance / DFAST Loan Losses
                                                                                            C
         3Q20 YTD - All Banks               1.2%                                          DFS
                                                                                         JPM
                                                                                         PNC
                                                                                        HBAN
                                                                                         USB
     S&P Base Case for                                                                     RF
                                                    2.2%                                 ALLY
 Pandemic Period - all Banks
                                                                                          BAC
                                                                                         WFC
                                                                                          AXP
                                                                                          COF
         2008-2009 All Banks                                                              TFC
                                                                         5.6%
                                                                                          CFG
                                                                                           GS
                                                                                         MTB
                                                                                         FITB
                                                                                          KEY
  Fed's Severely Adverse - 33
                                                                                7.1%       BK
    Banks in June DFAST                                                                    MS
                                                                                        NTRS
                                                                                          STT
                                0%             2%             4%         6%       8%            0        10          20   30    40    50      60
                                                                                                                          (%)
Source: Federal Reserve Board, S&P Global Ratings, and Company filings

                                                                                                                                                    16
Banks’ Allowances For Credit Losses Should Decrease In 2021
-     Banks held their allowances relatively flat in third-quarter 2020 amid the ongoing economic rebound and after sharp increases in the
      first half of 2020.
-     We expect further reductions in 2021 as banks charge off more loans that have come under pandemic stress that they have already
      allocated reserves for.

      Monoline Banks                  Diversified Banks
                                                     4Q19 ACL ex. CECL/Loans   2Q20 ACL/Loans   3Q20 ACL/Loans

14%                                  4.5%

                                     4.0%
12%
                                     3.5%
10%
                                     3.0%

 8%                                  2.5%

 6%                                  2.0%

                                     1.5%
 4%
                                     1.0%
 2%                                  0.5%

 0%                                  0.0%
                                              OFG

                                            HBAN
                                              WFC

                                             WBS

                                            UMPQ
                                             ZION

                                             STBA

                                            CBSH

                                               VLY

                                               STT
                                            NYCB
                                                CIT
                                            BPOP

                                              SNV

                                            UMBF

                                             ISBC
                                               TCF
                                                  C
                                              FBP

                                                GS

                                              FITB

                                             HWC
                                              CFG

                                              MTB

                                               KEY

                                              CFR

                                              TCBI

                                             PBCT
                                              CMA
                                               TFC
                                            BOKF

                                             FMBI
                                             SIVB

                                              ASB

                                               FCF

                                                BK
                                              FNB

                                            TRMK

                                            NTRS

                                               MS
                                              FRC
                                              JPM

                                            CADE
                                             ALLY

                                                RF
                                              USB

                                              PNC

                                              BAC

                                            EWBC

                                              FHN

                                              BXS

                                              FHB
       SYF

                   SLM
                         COF
                               AXP
             DFS

Source: S&P Global Ratings, Company filings

                                                                                                                                             17
Commercial Real Estate Will Be A Longer-term Challenge For Some Banks
– Highly granular sector with various segments of CRE expected to respond differently to cyclical and structural pressures

   Source: S&P Global Ratings.

                                                                                                                             18
Our Base Case CRE Losses Of 3% Will Be Manageable For Banks In Total
– Losses would only erode 4% of industry capital

Sensitivity Chart: Bank CRE Losses To Tier 1 Capital

                                        Bank CRE Loans outstanding          Tier 1 Capital    Losses           % capital (right scale)

            $2,500                                                                                                                             25%
                                                                                                                                         24%
                                  $2,100                       $2,100                        $2,100                          $2,100
            $2,000                           $1,786                     $1,786                        $1,786                          $1,786   20%

            $1,500                                                                                                                             15%
 ($ bil.)

                                                                                                12%

            $1,000                                                                                                                             10%
                                                                     7%

                                           4%                                                                                     $420
             $500                                                                                                                              5%
                                                                                                $210
                                                                     $126
                                         $63
               $-                                                                                                                              0%
                                          3%                         6%                         10%                               20%
Source: FDIC; S&P Global Ratings. Data as of Q2 2020.

                                                                                                                                                    19
Energy Unlikely To Threaten Most Banks After Reductions
 – Still, meaningful energy exposure has contributed to negative outlooks on some banks

                                                                                                                                                        Energy And Related Outstanding Exposure Greater Than $900
Energy And Related Exposure, Quarterly Change (%)
                                                                                                                                                        Million At Select US Banks, Q32020
                                                                                                           18.0                                            Texas Capital Bancshares Inc.
                                                                                                                                                                            CIT Group Inc.
                                                                                                           16.0                                                   East West Bancorp Inc.
                                                                                         BOKF                                                                           Cadence Bancorp.
                                                                                                           14.0                                                 Cullen/Frost Bankers Inc.

                                                                                                                        Proportion of gross loans (%)
                                                                                                                                                                             Comerica Inc.
                                                                                                           12.0                                                   Regions Financial Corp.
                                                                                                                                                                                  KeyCorp
                                                                                  CADE                     10.0                                                        Zions Bancorp. NA
                                                                                                                                                            Citizens Financial Group Inc.
                                                                                                            8.0                                                              U.S. Bancorp
                                                                                                   CFR                                                                Fifth Third Bancorp
                                                               CMA (1)                                      6.0                                         PNC Financial Services Group Inc.
                                                                                                                                                                     BOK Financial Corp.
                                                                      C (1)                      CIT (4)
                                                                            ZION                            4.0                                                     Truist Financial Corp.
                                                  TCBI
                                                                  FITB KEY     EWBC                                                                                      Wells Fargo & Co.
                                                     RF (3)                BAC (2)                   CFG 2.0                                                      JPMorgan Chase & Co.
                                  USB                                            JPM                                                                               Bank of America Corp.
                                                   WFC              TCF                                     0.0                                                              Citigroup Inc.
                                                                          PNC
 -25.0                 -20.0                 -15.0                 -10.0           -5.0                           0.0                                                                         0.0   5.0             10.0              15.0             20.0
                                                  QoQ change (%)                                                                                                                                                   ($ bil.)

 Data compiled Oct. 30, 2020. Analysis limited to select U.S. public banks that reported energy and related outstanding exposure of greater than $900 million at Sept, 30, 2020., Outstanding exposure data, except for gross loans, is collected on an as-
reported basis from GAAP filings. If disclosed, Paycheck Protection Program loans are excluded from outstanding exposure. 1 Proportion of gross loans computed using gross loans held for investment instead of total gross loans., 2 Exposure balance
may not be limited to loans and leases., 3. Disclosure limited to direct exposure. 4. Announced a merger of equals with First Citizens BancShares Inc. on Oct. 16. Source: S&P Global Market Intelligence,

                                                                                                                                                                                                                                                              20
Consumers Have Saved More And Reduced Debt Compared To Income
Household Debt Over Disposable Personal Income

 120%

 115%

 110%

 105%

 100%

  95%

  90%

  85%

  80%

  75%

  70%
                2008           2009           2010           2011           2012   2013   2014   2015   2016   2017   2018   2019   2020Q3
Source: S&P Global Ratings; FRED; New York Fed Consumer Credit Panel/Equifax.

                                                                                                                                             21
Consumer Debt Has Grown More Slowly And Its Mix Has Changed
– Credit card debt has fallen notably even as mortgages and auto loans have ticked up

Total Consumer Debt Balance And Composition

                                        Mortgage         HE Revolving          Auto Loan          Credit Card       Student Loan       Other
                                                                                                                                                              14.1    14.4
                                                                                                                                                      13.5
            14                                                 12.7
                                                                                                                                               13.1           3.1%    2.9%
                                                       12.4                                                                          12.6             3.0%            10.8%
                                                                        12.2                                         11.8    12.1            3.0%             10.7%
                                                               3.2%              11.7      11.5             11.5                     3.0%             10.8%
            12                                  11.3   3.4%    5.0%    3.1%                          11.3                    2.9%            10.5%                    5.6%
                                                       4.4%            5.9%      2.9%                                2.8%            10.4%                    6.6%
                                               3.6%            6.8%                      2.9%       2.8%    2.8%             10.2%                    6.4%
                                     10.0      4.3%    6.8%            6.5%      6.9%    7.6%               9.4%     9.8%                      6.3%                   9.5%
                                                               6.2%                                 8.5%                             6.2%                     9.4%
            10             9.0      4.2%       6.8%    6.6%
                                                               5.6%    5.9%      6.2%    6.1%       6.0%    5.9%     5.9%    6.0%
                                                                                                                                     9.2%
                                                                                                                                               9.3%   9.4%
                                                                                                                                                              2.8%    2.5%
                                    3.9%       7.3%    5.2%            5.8%      6.1%    6.4%                        8.1%    8.8%                     3.0%
                  8.1     4.7%      7.4%                                         5.7%               6.9%    7.5%                               3.4%
                          3.8%                 5.3%                                      5.4%                        4.3%    4.0%    3.8%
                                                                                                    5.0%    4.6%
             8                      7.9%
($ tril.)

                 5.6%     7.9%
                 3.1%     8.1%      5.6%
                 8.7%
                 8.7%     5.2%
             6   3.7%
                                                               73.1%                                                                                          67.6%   68.7%
                                                       73.6%           72.7%     72.2%                                               67.4%   67.6%    67.4%
             4                      71.0%
                                               72.8%                                     71.7%      70.8%   69.9%    69.1%   68.1%
                         70.3%
                 70.2%
             2

             0

                                                                                                                                                                       3Q2020
                  2003

                          2004

                                     2005

                                                2006

                                                        2007

                                                                2008

                                                                        2009

                                                                                  2010

                                                                                           2011

                                                                                                     2012

                                                                                                             2013

                                                                                                                      2014

                                                                                                                              2015

                                                                                                                                      2016

                                                                                                                                               2017

                                                                                                                                                       2018

                                                                                                                                                               2019
Source: New York Fed Consumer Credit Panel/Equifax.

                                                                                                                                                                                22
Credit Card Debt Has Fallen Meaningfully
– Consumers have heavily used their debt cards but reduced borrowings on credit cards
                   Recession              Systemwide Credit Card Loans (Right)                                 Unemployment Rate (Left)                 Systemwide Net charge-off rate (Left)

 14%                                                                                                                                                                             903
                                                                                                                                                                                       942                     1000
                                                                                                                                                                           865               873
                                                                                                                                                                                                               900
 12%                                                                                                                                                                 800                           808 796
                                                                                                                                         702 688 696 691 718
                                                                                                                                                               756                                             800
 10%                                                                                                                                                                                                           700

                                                                                                                                                                                                                      $ billions
   8%                                                                                                                                                                                                          600
                                                                                                               399 396 385 422
                                                                                                                               445 421                                                                         500
   6%                                                                                                    339                                                                                                   400
                                                                                    266 250        292
   4%                                                     198
                                                                227 246 246 242 227                                                                                                                            300
                                   147 146 165                                                                                                                                                                 200
               100 115 126 139 142
   2%       84
                                                                                                                                                                                                               100
   0%                                                                                                                                                                                                          0

            2020Q1
            2020Q2
            2020Q3
              2019
              1985
              1986
              1987
              1988
              1989
              1990
              1991
              1992
              1993
              1994
              1995
              1996
              1997
              1998
              1999
              2000
              2001
              2002
              2003
              2004
              2005
              2006
              2007
              2008
              2009
              2010
              2011
              2012
              2013
              2014
              2015
              2016
              2017
              2018
Top 10 Largest Credit Card Lenders As Of Q3 2020 ($ Billions): Sample Is 91% Of Total Card Loans
                                                                         Bank of                                                         American                                        U.S.
      Citigroup:            JPMorgan:               Capital                                    Synchrony:             Discover:                             Wells                                            Barclays US
                                                                         America:                                                        Express:                                      Bancorp:
         $140                 $126                 One: $98                                       $75                    $69                              Fargo: $36                                          LLC: $21
                                                                           $80                                                             $60                                           $22
Source: S&P Global Ratings, FDIC Quarterly Banking Profile, Regulatory filings, BLS, Federal Reserve.

                                                                                                                                                                                                                                   23
Bank Capital Ratios, Up In 2020, Should Decline Somewhat In 2021
– Profitability and restrictions on shareholder payouts in 2020 helped boost capital ratios. An opening of the door of share buybacks by the
  Fed should lead to at least a modest decline in capital in 2021

Median CET1 Of Rated Banks

                                            Money Center                    Broker Dealers                   Trust Banks                 Regional Banks               All Banks
16%

15%

14%

13%

12%

11%

10%
              Q4 '15

                        Q1 '16

                                   Q2 '16

                                             Q3 '16

                                                        Q4 '16

                                                                   Q1 '17

                                                                             Q2 '17

                                                                                        Q3 '17

                                                                                                  Q4 '17

                                                                                                             Q1 '18

                                                                                                                       Q2 '18

                                                                                                                                Q3 '18

                                                                                                                                          Q4 '18

                                                                                                                                                   Q1 '19

                                                                                                                                                            Q2 '19

                                                                                                                                                                     Q3 '19

                                                                                                                                                                              Q4 '19

                                                                                                                                                                                       Q1 '20

                                                                                                                                                                                                Q2 '20

                                                                                                                                                                                                         Q3 '20
Note: Transitional calculations. Source: S&P Global Ratings, Bank Regulatory filings, S&P Global Market Intelligence

                                                                                                                                                                                                                  24
The Fed Has Eased, But Not Eliminated, Payout Restrictions
– The Fed left in place restrictions on dividend increases but eased its prohibition of share repurchases starting in the first quarter of 2021.
– It will allow payouts in the first quarter no greater than average quarterly net income in 2020.

Common Dividend Payout Ratio And Permissible Share Repurchases
                                                                            Estimated quarterly average 2020 net                                                                   Permissible Q1 2021 share repurchase/NI             Permissible Q1 2021 share repurchase (mil.
Bank Holding Company                                                                                                             Common dividend payout ratio/NI (%)
                                                                                       income (mil. $)                                                                                               (%)                                                   $)
Huntington Bancshares Inc.                                                                                              200                                                   78                                                  22                                                      44
Regions Financial Corp.                                                                                                 219                                                   68                                                  32                                                      70
Citizens Financial Group Inc.                                                                                           251                                                   67                                                  33                                                      83
KeyCorp                                                                                                                 293                                                   62                                                  38                                                     112
Fifth Third Bancorp                                                                                                     330                                                   59                                                  41                                                     135
Wells Fargo & Co.                                                                                                       705                                                   59                                                  41                                                     292
Truist Financial Corp.                                                                                                1078                                                    56                                                  44                                                     471
Discover Financial Services                                                                                             247                                                   55                                                  45                                                     111
U.S. Bancorp                                                                                                          1213                                                    52                                                  48                                                     577
American Express Co.                                                                                                    693                                                   50                                                  50                                                     345
Northern Trust Corp.                                                                                                    319                                                   46                                                  54                                                     171
JPMorgan Chase & Co.                                                                                                  6166                                                    45                                                  55                                                3388
M&T Bank Corp.                                                                                                          316                                                   45                                                  55                                                     174
Citigroup Inc.                                                                                                        2415                                                    44                                                  56                                                1341
Ally Financial Inc.                                                                                                     190                                                   38                                                  62                                                     117
Bank of America Corp.                                                                                                 4176                                                    38                                                  62                                                2605
Bank of New York Mellon Corp.                                                                                           915                                                   30                                                  70                                                     636
State Street Corp.                                                                                                      609                                                   30                                                  70                                                     426
PNC Financial Services Group Inc.                                                                                     1789                                                    28                                                  72                                                1295
Goldman Sachs Group Inc.                                                                                              1878                                                    24                                                  76                                                1430
Morgan Stanley                                                                                                        2405                                                    23                                                  77                                                1854
Capital One Financial Corp.                                                                                             332                                                   14                                                  86                                                     286

 *Notes: 1) Common dividends are sourced from the third-quarter regulatory Y-9C reports, schedule HI-A item 11. 2) The estimated quarterly average 2020 net income (NI) equals the average of Bloomberg consensus estimate of net income for fourth-quarter plus the actual net income
from the Y-9C reports for the first three quarters. 3) Permissible Q1 2021 share repurchase/NI (%) equals 100 minus common dividend payout ratio/NI (%). 4) Sorted by the highest common dividend payout ratio/NI (%) to the lowest.

                                                                                                                                                                                                                                                                                         25
The Stress Capital Buffer, Now Effective, Will Govern Capital Actions
– All banks are already above their new minimum required capital ratios.
– The Fed will notify banks in March whether their SCBs changed based on the December 2020 stress test.
– Until then, the June 2021 stress test will be the next event that could alter SCBs

Common Equity Tier 1 Ratio--Basel III Fully Phased-In--
                                                                                                            Quarter-over-quarter change
                                            Q3 2020                               Q2 2020
                                                                                                                       (bps)                            Advanced/                                  Current CET1
                                                                                                                                                     standardized                                surplus (deficit)
                                                                                                                                                      (lower of the                     Proposed    over (under)
                                                                                                                                                              two) Stressed capital Standardized       proposed
 (%)                              Standardized           Advanced       Standardized         Advanced         Standardized            Advanced            Q3 2020          buffer* CET1 minimum        minimum

Bank of America Corp.                       11.9               12.7                11.6             11.4                   30                130                   S                  2.5     9.5             2.4

Citigroup Inc.                              12.1               11.8                11.8             11.6                   30                 20                   A                  2.5    10.0             2.1

JPMorgan Chase & Co.                        13.1               13.8                12.4             13.2                   70                 60                   S                  3.3    11.3             1.8

Wells Fargo & Co.                           11.4               11.5                11.0             11.1                   40                 40                   S                  2.5     9.0             2.4

Morgan Stanley                              17.4               16.9                16.5             16.1                   90                 80                   A                  5.7    13.2             4.2

Goldman Sachs Group Inc.                    14.5               12.9                13.3             11.9                  120                100                   A                  6.6    13.6             0.9

Bank of New York Mellon                     13.5               13.0                12.7             12.6                   80                 40                   A                  2.5     8.5             5.0

State Street Corp.                          12.4               12.8                12.3             12.7                   10                 10                   S                  2.5     8.0             4.4

Northern Trust Corp.                        13.4               13.9                13.4             13.9                    0                   0                  S                  2.5     7.0             6.4

*Stressed capital buffers (SCB) from 2020 DFAST results. SCB effective Oct. 1, 2020. Source: Company reports, S&P Global Ratings, the Federal Reserve Board, and regulatory filings

                                                                                                                                                                                                               26
Deposit Growth Should Slow, But Funding Will Remain Strong
– Growth in the Fed’s balance sheet has been a boon to bank deposits.
– Loan-to-deposit ratios improved significantly in 2020.
– The need for wholesale funding has declined.

                                  Loans to Deposits (right axis)                  YoY % Change in Deposits               YoY % Change in Borrowings

 25%                                                                                                                                                                      78%
 20%                                                                                                                                                                      76%
 15%                                                                                                                                                                      74%
 10%                                                                                                                                                                      72%
   5%                                                                                                                                                                     70%
   0%                                                                                                                                                                     68%
 -5%                                                                                                                                                                      66%
-10%                                                                                                                                                                      64%
-15%                                                                                                                                                                      62%
-20%                                                                                                                                                                      60%
         1/1

                  1/15

                           1/29

                                    2/12

                                             2/26

                                                       3/11

                                                              3/25

                                                                     4/8

                                                                           4/22

                                                                                  5/6

                                                                                        5/20

                                                                                               6/3

                                                                                                     6/17

                                                                                                            7/1

                                                                                                                  7/15

                                                                                                                         7/29

                                                                                                                                8/12

                                                                                                                                       8/26

                                                                                                                                              9/9

                                                                                                                                                    9/23

                                                                                                                                                           10/7

                                                                                                                                                                  10/21
Source: Federal Reserve H8 Data; Seasonally Adjusted

                                                                                                                                                                           27
The Full Transition From LIBOR Delayed Until 2023
– Banks will need to continue preparing for the end of LIBOR.
– However, regulators have given banks a reprieve by extending the phase-out date of most U.S. dollar benchmarks by 18 months to June
  2023.

Volume And Share Of LIBOR-Tied Products                                                                         Fallback Language By Type Of Instrument
                                                                                        Share maturing by                                              Fallback Rate
                                                                 Volume (tril. U.S.$)
                                                                                          end of 2021 (%)
Over-the-counter derivatives   Interest-rate swaps                                81                  66
                                                                                                                                                          - Obtain bank quotes; then an alternative rate -
                               Forward rate agreements                            34                 100                         Business loans
                                                                                                                                                           typically prime + spread over effective funds rate
                               Interest-rate options                              12                  65
                               Cross -currency swaps                              18                  88
Exchange-traded derivatives    Interest-rate options                              34                  99
                               Interest-rate futures                              11                  99                                                  - Poll banks for rate; if not received, fix rate at last
                                                                                                                                 Bonds (FRNs)
Business loans                 Syndicated loans                                   1.5                 83                                                   published LIBOR
                               Nonsyndicated business loans                       0.8                 86
                               Nonsyndicated CRE/commercial
                                                                                  1.1                 83
                               mortgages                                                                                                                  - Agency MBS and CMO: Issuer sets successor rate
Consumer loans                 Retail mortgages                                   1.2                 57                                                  - Non Agency: Poll banks then fix rate at last
                                                                                                                            Securitized Products (1)       published LIBOR
                               Other consumer loans                               0.1                  0
Bonds                          Floating/variable-rate notes                       1.8                 84                                                  - CLO: Fixed rate at last LIBOR
Securitization                 Mortgage-backed securities                          1                  57
                               Collateralized loan obligations                    0.4                 26
                               Asset-backed securities                            0.2                 55                                                  - Replacement rate + or – a spread; spread
                                                                                                                          Mortgages/consumer loans
                                                                                                                                                           component undefined
                               Collateralized debt obligations                    0.2                 48
Total U.S.$ LIBOR exposure                                                     198.3                  82
Source: Second report Alternative Reference Rate Committee, March 2018; Data are gross notional exposures as of year-end 2016.

                                                                                                                                                                                                                     28
Bank M&A Will Likely Remain Robust In 2021 And Beyond
– While 2020 saw a drop in the number of announced bank acquisitions, it also brought some relatively large deals (e.g., PNC-BBVA USA and
  Huntington-TCF).
– We expect further deals as banks look for economies of scale, resources to keep up with advances in fintech, and ways to cope with
  pressures from low rates and other factors.
Merger Activity Of U.S. Banks

                        Assets acquired ($ bil) (left axis)                            Median price / tangible book (%) (right axis)        # of deals (right axis)
450                                                                                                                                                                   300
400
                                                                                                                                                                      250
350
300                                                                                                                                                                   200
250
                                                                                                                                                                      150
200
150                                                                                                                                                                   100
100
                                                                                                                                                                      50
 50
  0                                                                                                                                                                   0
                         2016                                    2017                                    2018                        2019              2020
Based on announced data. Source: SNL Financial. Copyright © 2018 by Standard & Poor’s Financial Services LLC. All rights reserved.

                                                                                                                                                                           29
The Pandemic Has Only Accelerated Digitization

                                                                                                                                                       – COVID-19 has accelerated banks’ push
                                                                                                                                                         into technology.
                                                                                                                                                       – The pandemic has also accelerated
                                                                                                                                                         branch closures (down 2% year over
                                                                                                                                                         year).
                                                                                                                                                       – Large banks have an advantage over
                                                                                                                                                         smaller banks in terms of tech
                                                                                                                                                         spending.
                                                                                                                                                      Excludes features common to all or nearly all of the bank apps
                                                                                                                                                     reviewed above: check balance, manage account alerts (available in
                                                                                                                                                     separate app for Ally Bank), review transactions, pay bills, photo
                                                                                                                                                     check deposit, transfer money between accounts, fingerprint login,
                                                                                                                                                     access to nondeposit account information, branch/ATM locator, and
                                                                                                                                                     tap to call customer service.
                                                                                                                                                     *BB&T and SunTrust merged in December 2019, but the bank
                                                                                                                                                     brands had not changed names at the time of the publication.
                                                                                                                                                     **PNC Bank agreed to buy BBVA USA Bancshares Inc., the U.S.
                                                                                                                                                     operations of Banco Bilbao Vizcaya Argentaria SA, on Nov. 16, 2020.

Source: S&P Global Market Intelligence research conducted using product descriptions on bank websites and in app stores, as well as company-provided information when available. Data compiled in summer 2020 and
updated based on publicly available information in mid-November 2020. Some companies may have subsequently updated their apps. Analysis does not necessarily reflect functionality or services available through text
banking, mobile browsers, or secure messaging.

                                                                                                                                                                                                                        30
Subgroups Of Rated Banks
         Money Center Banks                              Large Regional Banks                                     Regional Banks
  Bank of America Corp.                                                                  Associated Banc-Corp                 People's United Financial Inc.
                                                     Ally Financial Inc.
  Citigroup Inc.                                                                         BancorpSouth Bank                    Popular Inc.
                                                     BMO Financial Corp.
  JPMorgan Chase & Co.                                                                   Bank of North Dakota                 S&T Bank
                                                     Citizens Financial Group Inc.
  Wells Fargo & Co.                                                                      Bank of the West                     SLM Corp.
                                                     Fifth Third Bancorp
                                                     HSBC USA Inc.                       BBVA USA Bancshares Inc.             SVB Financial Group
                                                     Huntington Bancshares Inc.          BOK Financial Corp.                  Synovus Financial Corp.
                Trust Banks                          KeyCorp                             Cadence Bancorporation               TCF Financial Corp.
 Northern Trust Corp.                                M&T Bank Corp.                      CIT Group Inc.                       Texas Capital Bancshares Inc.
 State Street Corp.                                  MUFG Americas Holdings Corp.        Comerica Inc.                        Trustmark Corp.
 The Bank of New York Mellon                         PNC Financial Services Group Inc.   Commerce Bancshares Inc.             UMB Financial Corp.
                                                     Regions Financial Corp.             Cullen/Frost Bankers Inc.            Umpqua Holdings Corp.
                                                     Santander Holdings USA Inc.         East West Bancorp Inc.               Valley National Bancorp
             Broker Dealers                          Truist Financial Corp.              First Commonwealth Financial Corp.   Webster Financial Corp.
                                                     U.S. Bancorp                        First Hawaiian Bank Inc.             Zions Bancorporation N.A
 Morgan Stanley
                                                                                         First Midwest Bancorp Inc.
 The Goldman Sachs Group Inc.
                                                                                         First Republic Bank
                                                           Credit Card Banks             FirstBank Puerto Rico
                                                     American Express Co.                Hancock Whitney Corp.
Note: “Large Regional” and “Credit Card” banks may
                                                     Capital One Financial Corp.         Investors Bancorp
be included with “Regional Banks” throughout
presentation. Data in presentation may exclude       Discover Financial Services         New York Community Bancorp Inc.
certain domestic subsidiaries of foreign banks and                                       OFG Bancorp
certain other banks that do not file Y-9Cs.          Synchrony Financial

                                                                                                                                                               31
COVID-19 Research
Click to see the following research articles, or find more at www.SPRatings.com/nabanking

- Rating Component Scores For U.S., Canadian, And Bermudian Banks (December 2020)
- The Fed’s Stress Test Results Open The Door For U.S. Banks To Increase Capital Returns In 2020 (12/22/2020)
- SOFR Emerging As Alternative To LIBOR In U.S. Debt Markets (12/04/2020)
- Despite Declining Loss Provisions, U.S. Banks Still Face Asset Quality Risks And Low Interest Rates (11/19/2020)
- Earnings Among Large U.S. Banks Rebounded In Third Quarter, But Uncertainty Remains High (11/17/2020)
- Global Banks Country-By-Country 2021 Outlook: Toughest Test For Banks Since 2009 (11/17/2020)
- Global Banks 2021 Outlook: Banks Will Face The Next Test Once Support Wanes (11/17/2020)
- U.S. Banks Face Long-Term Risks To Their Commercial Real Estate Asset Quality (11/16/2020)
- North American Financial Institutions Monitor 4Q 2020: Finding Some Respite In The COVID-19 Storm (10/22/2020)

                                                                                                                     32
COVID-19 Research Continued
Click to see the following research articles, or find more at www.SPRatings.com/nabanking

- Comparative Stats on All Rated US Banks (10/12/2020)
- Industry Report Card: For Large U.S. Banks, Substantial Credit Provisions Weighed On Earnings (8/13/2020)
- What Lies Ahead For U.S. Bank Provisions For Loan Losses (8/12/2020)
- The Fed's Latest Stress Test Points To Limited Bank Capital Returns (6/30/2020)
- Capital Markets Revenue Should Be A Bright Spot For Banks In A Tough 2020 (Global) (6/23/20)
- Bank Regulatory Buffers Face Their First Usability Test (Global) (6/11/20)
- How U.S. Bank Dividend Cuts Could Affect Ratings (6/3/20)
- For Large U.S. Banks, Loan Loss Expectations Will Be Key To Ratings (5/5/2020)
- Outlooks On 13 U.S. Banks Revised To Negative Due to Economic Downturn From COVID-19 (5/4/2020)
- Who The U.S. Government Plans Help, Who They Don't, And What That Means For Financial Institutions (4/16/20)
- U.S. Financial Institutions Face A Rocky Road Despite A Boost From Government Measures (4/8/20)

                                                                                                                 33
Analytical Contacts

Devi Aurora                              Stuart Plesser                Brendan Browne, CFA
Senior Director and Analytical Manager   Senior Director               Senior Director
Financial Institutions                   Financial Institutions        Financial Institutions
devi.aurora@spglobal.com                 stuart.plesser@spglobal.com   brendan.browne@spglobal.com

                                                                                                     34
Copyright © 2021 by Standard & Poor’s Financial Services LLC. All rights reserved.

No content (including ratings, credit-related analyses and data, valuations, model, software or other application or output therefrom) or any part thereof (Content) may be modified, reverse engineered, reproduced or distributed in any form by any
means, or stored in a database or retrieval system, without the prior written permission of Standard & Poor's Financial Services LLC or its affiliates (collectively, S&P). The Content shall not be used for any unlawful or unauthorized purposes. S&P
and any third-party providers, as well as their directors, officers, shareholders, employees or agents (collectively S&P Parties) do not guarantee the accuracy, completeness, timeliness or availability of the Content. S&P Parties are not responsible
for any errors or omissions (negligent or otherwise), regardless of the cause, for the results obtained from the use of the Content, or for the security or maintenance of any data input by the user. The Content is provided on an "as is" basis. S&P
PARTIES DISCLAIM ANY AND ALL EXPRESS OR IMPLIED WARRANTIES, INCLUDING, BUT NOT LIMITED TO, ANY WARRANTIES OF MERCHANTABILITY OR FITNESS FOR A PARTICULAR PURPOSE OR USE, FREEDOM FROM BUGS, SOFTWARE ERRORS
OR DEFECTS, THAT THE CONTENT'S FUNCTIONING WILL BE UNINTERRUPTED, OR THAT THE CONTENT WILL OPERATE WITH ANY SOFTWARE OR HARDWARE CONFIGURATION. In no event shall S&P Parties be liable to any party for any direct,
indirect, incidental, exemplary, compensatory, punitive, special or consequential damages, costs, expenses, legal fees, or losses (including, without limitation, lost income or lost profits and opportunity costs or losses caused by negligence) in
connection with any use of the Content even if advised of the possibility of such damages.

Credit-related and other analyses, including ratings, and statements in the Content are statements of opinion as of the date they are expressed and not statements of fact. S&P's opinions, analyses, and rating acknowledgment decisions
(described below) are not recommendations to purchase, hold, or sell any securities or to make any investment decisions, and do not address the suitability of any security. S&P assumes no obligation to update the Content following publication in
any form or format. The Content should not be relied on and is not a substitute for the skill, judgment and experience of the user, its management, employees, advisors and/or clients when making investment and other business decisions. S&P
does not act as a fiduciary or an investment advisor except where registered as such. While S&P has obtained information from sources it believes to be reliable, S&P does not perform an audit and undertakes no duty of due diligence or
independent verification of any information it receives. Rating-related publications may be published for a variety of reasons that are not necessarily dependent on action by rating committees, including, but not limited to, the publication of a
periodic update on a credit rating and related analyses.

To the extent that regulatory authorities allow a rating agency to acknowledge in one jurisdiction a rating issued in another jurisdiction for certain regulatory purposes, S&P reserves the right to assign, withdraw, or suspend such acknowledgement
at any time and in its sole discretion. S&P Parties disclaim any duty whatsoever arising out of the assignment, withdrawal, or suspension of an acknowledgment as well as any liability for any damage alleged to have been suffered on account
thereof.

S&P keeps certain activities of its business units separate from each other in order to preserve the independence and objectivity of their respective activities. As a result, certain business units of S&P may have information that is not available to
other S&P business units. S&P has established policies and procedures to maintain the confidentiality of certain nonpublic information received in connection with each analytical process.

S&P may receive compensation for its ratings and certain analyses, normally from issuers or underwriters of securities or from obligors. S&P reserves the right to disseminate its opinions and analyses. S&P's public ratings and analyses are made
available on its Web sites, www.standardandpoors.com (free of charge), and www.spcapitaliq.com (subscription) and may be distributed through other means, including via S&P publications and third-party redistributors. Additional information
about our ratings fees is available at www.standardandpoors.com/usratingsfees.

Australia: S&P Global Ratings Australia Pty Ltd holds Australian financial services license number 337565 under the Corporations Act 2001. S&P Global Ratings' credit ratings and related research are not intended for and must not be distributed to
any person in Australia other than a wholesale client (as defined in Chapter 7 of the Corporations Act).

STANDARD & POOR'S, S&P and RATINGSDIRECT are registered trademarks of Standard & Poor's Financial Services LLC.

spglobal.com/ratings

                                                                                                                                                                                                                                                             35
You can also read