Investor Presentation - 9M / Q3FY21 Digital-Led I Retail Focused I Customer Centric I Well Capitalized I Inclusive - AU Small Finance Bank
←
→
Page content transcription
If your browser does not render page correctly, please read the page content below
Digital-Led I Retail Focused I Customer Centric I Well Capitalized I Inclusive

                                     Investor Presentation

                                             9M / Q3FY21

January 2021                                                                                    1
Table of Contents
    1.   9M / Q3FY21 Performance Highlights
    2.   Key focus : Asset Quality

    3.   Building a Digital Bank

    4.   Branch Banking Overview

    5.   Assets Overview

    6.   Other Key Updates

                                              2
1. 9M / Q3FY21 Performance Highlights

                                        3
9M/Q3FY21 Key Highlights
 Operating Environment
 ➢ Overall sentiment continues to improve with high recovery rates, declining number of new cases, and commencement of vaccination
 ➢ Demand has normalized in most segments in Q3FY21 ; Q4FY21 is expected to be significantly better
 ➢ Disproportionately impacted segments still lagging – Bus and Taxi segment in Wheels; Schools, Retail Garments and Rentals in SBL; Demand reviving with
   the improving operating environment
 ➢ Pending clarity on NPL recognition should help accelerate recovery process as it would ease security enforcement
 ➢ Bank is actively engaging with customers facing genuine stress due to COVID; continues to exercise caution in restructuring

 Business Outlook
 ➢ Reasonable clarity now on our asset quality outlook and expect pro-forma GNPLs to have broadly peaked now
 ➢ Used part of Aavas sale proceeds to make additional provisions which we believe sufficiently cover potential losses that could arise due to COVID; we expect
   credit costs to normalize from here onwards
 ➢ We are now even more confident of our ability to build the AU Bank platform basis the performance of branch banking and resilience in our asset quality
   amid several challenges in the past year
 ➢ Journey towards becoming a Digital-led and Tech-enabled Bank, Sustainable granular deposits franchise, and Retail loans remain in focus
 ➢ Expect our disbursement growth momentum to sustain as overall growth outlook continues to improve
 ➢ Diversifying Fee income avenues by expanding payments ecosystem, Bancassurance partnerships and introduction of credit cards

                                                                                                                                                4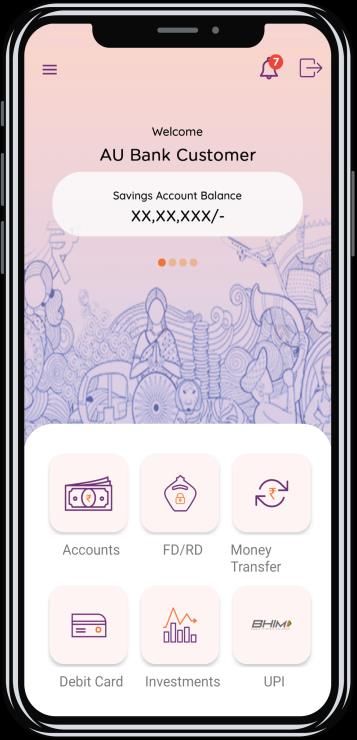
9M/Q3FY21 Key Highlights
 Q3FY21 performance Highlights
 ➢ Strengthened Digital Banking channels – new age Super App for MB/IB, traction across payment channels, launched credit cards internally for employees
 ➢ Disbursements growth at 34% YoY in Q3FY21 driven by growth in demand across most key segments
 ➢ AUM at ₹ 33,222 Cr with growth of 11% YoY, ~9% QoQ ; Retail AUM# remains dominant at ~91%
 ➢ Gross NPA at 1.0% and Net NPA at 0.2%; PCR at 76%
 ➢ PAT ₹ 1,002 Cr for 9MFY21 and ₹ 479 Cr Q3FY21
 ➢ ROA for 9MFY21 was 3.0% and for Q3FY21 it was 4.2%; ROE was at 27.3% for 9MFY21 and 37.1% for Q3FY21
 ➢ Excluding gains from Aavas (after taxes and additional provisions), PAT was at ₹ 554 Cr for 9MFY21 and ₹ 180 Cr for Q3FY21
 ➢ CRAR and Tier 1 capital ratio at 18.8%, and 16.3%*; Including 9M interim profits, CRAR at 22.9% and Tier 1 at 20.3%
 ➢ Basis the normalized environment and re-emergence of growth, the Bank is moving ahead with annual performance appraisal (increments) for FY20 for all
   employees in this quarter; the bonus has already been paid out in Q3FY21
 Assets – Promising outlook
 ➢ Demand has been consistently improving and becoming more broad-based with pick-up in activity levels
 ➢ AUM spreads remained stable at 7.6%; Incremental spreads improved to 8.1% in Q3FY21 vs 8.0% in Q3FY20
 ➢ Collection efficiencies and activation rates have achieved normalcy across most segments
 ➢ The Bank has been prudent in approving restructuring proposals basis our internal risk models and business viability; most of the restructuring has been for
   deferment of principal by 3/6 months while servicing of interest continues
 ➢ In Q3FY21, the Bank restructured ₹ 251Cr (0.8% of gross advances), mainly in the bus, taxi (within wheels) and schools, apparels (within SBL); Overall
   restructured advances should stabilize at ~1.5% of gross advances including fresh restructuring that the Bank may undertake in Q4FY21
 #As per the latest RBI definition on regulatory retail assets;*regulatory requirement is 15% for CRAR and 7.5% for Tier 1
                                                                                                                                                 5
9M/Q3FY21 Key Highlights
 Digital Banking – Moving towards a Digital-led Bank
 ➢ Remain actively engaged in mutually beneficial partnerships with major e-commerce players via offer campaigns;
 ➢ Best of E-Com players are more open to engage with us given our tech capabilities in API banking and our diverse customer base.
 ➢ New platforms launched
        ➢ New Internet and Mobile Banking platform launched for retail customers – 100+ features incl. ASBA, UPI, Investments, Bill Payments and various
          lifestyle related services like Taxi booking, Flight tickets, Hotels etc.
        ➢ Credit card on our own platform with best-in-class partners; live for employees; customer launch in next few months
 ➢ Digital payment Ecosystem – all channels live (UPI, FASTag, BBPS, AePS etc.);
        ➢ Over 1.6Cr txns worth ~₹ 6,000 Crores executed in Q3FY21 on UPI platform
        ➢ 172 Crores worth of payments executed in Q3FY21 using AePS platform
 ➢ QR ecosystem continues to expand - ~28K new merchant QR Codes deployed in Q3FY21 – to boost CA acquisition, analytics-based lending
 ➢ Digital on-boarding – Video Banking solution live for KYC, SA and FD A/c opening modules live
        ➢ ~1,000+ SA and FD a/c opened in Q3FY21 using Video Banking
        ➢ ~4,400 SA a/c opened via AU ABHI (end-to-end self-onboarding application of the Bank)
        ➢ ~87% of all SA a/c and 60% of all CA a/c opened during the quarter were opened using digital solution via TAB banking
 ➢ High emphasis on internal digitisation and automation of processes across verticals – optimise productivity and TAT
 ➢ Investment in NPCI – to further augment our digital banking journey, AU Bank also participated in the equity raising process of NPCI to the maximum
   permissible limit

                                                                                                                                             6
9M/Q3FY21 Key Highlights
 Branch Banking – Building a sustainable granular franchise

  ➢ Continued traction in retailization of deposits and deepening of customers – Individual Driven Banking* contributes ~60% of branch deposits as on
    Q3FY21 vs. 36% in Q3FY20
  ➢ 28% YoY growth in branch banking deposits led by SA growth of 85% and CA growth of 35%
  ➢ Retail deposits (CASA + Retail TD) now at 55% of deposits vs 43% in Q3FY20; CASA ratio at 22% vs. 16% in Q3FY20
  ➢ Gaining Market Share** 41 branches now above 5% market share in deposits; 8 branches >10% market share
  ➢ Added Branch footprint in 16 new locations including Bhubaneshwar, Hyderabad, Kolkata and Lucknow
  ➢ Attractive Merchant Offers with larger partners like Amazon, Flipkart, Myntra, Swiggy, Zomato, Dominos, etc. leading to higher customer engagement
    and balances build up
  ➢ Enhanced our 3rd party product range – Entered into partnerships with Care Health Insurance, ICICI Prudential Life Insurance#
  ➢ CRISIL awarded “FAA+/Stable” rating to AU Bank’s Fixed Deposits in Q3FY21

 Treasury Update

  ➢ Overall cost of funds for 9MFY21 was at 6.95% - reduced by 74bps over FY20; Incremental cost for 9MFY21 was at 5.97% - down by 136 bps over FY20
  ➢ Basis overall market environment, we have focused on maintaining optimum liquidity - LCR has been brought down in a calibrated manner from 150% as
    on 30th June’20 to 111% as on 31st Dec’20 (against regulatory requirement of 90%)
  ➢ CD ratio as on 31st Dec 2020 was 102% vs 111% as on 31st Dec 2019; Average CD ratio for 9MFY21 at 101%

 *Individual Driven Banking includes Individuals, HUF, Sole proprietorships and Partnerships
 **As per the last available RBI Data; #Effected in Jan’21                                                                                   7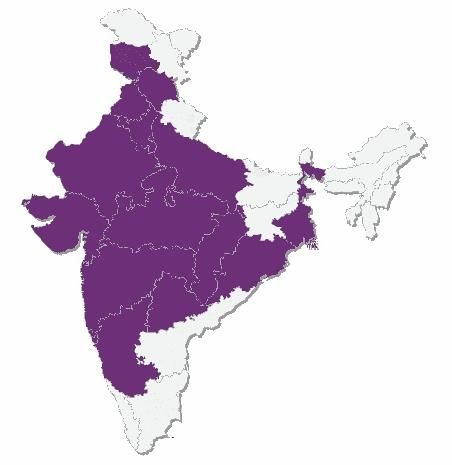
Spreads improved through efficient cost management

                             Incremental Spreads                                                                  AUM Spreads

          15.3%                                                                                 14.7%               14.4%             14.3%
                                                       13.9%
                                    13.2%

          8.0%                                         8.1%                                                         7.4%               7.6%
                                     7.1%                                                        7.6%

          7.3%                                                                                   7.1%               7.0%               6.7%
                                     6.1%              5.8%

         Q3FY20                     Q2FY21            Q3FY21                                   Q3FY20              Q2FY21             Q3FY21
                  Incremental COF       Disb Yield   Spread                                             AUM COF      AUM Yield      Spread

  ➢ Pick up in demand led to disbursement yields improving in Q3FY21 though it continues to trail on YoY basis given low interest rate environment

  ➢ At the same time, incremental and AUM Spreads have been stable with commensurate fall in cost of funds

                                                                                                                                               8
Geographic split of business

                            Liabilities Break up                                                               Assets Break up

                                 27%
                                                                                                                                     35%           Garnering Deposits from
                                                                                                                                                   urban markets and
                                                                 Urban Markets     Core Markets                                                    disbursing in core markets
                                             73%                                                                65%

                                       1%                                                                                 1% 2%
                                                                         RAJASTHAN
                                      3%                                                                                  2%
                                 4%                                      MAHARASHTRA
                            5%
                                                 27%                     DELHI NCR                             16%
                       6%
                                                                         PUNJAB
                                                                                                                                           42%
                    9%                                                   GUJARAT
                                                                         MADHYA PRADESH                  10%

                                                                         HARYANA
                                                                                                            5%
                         17%                                             HIMACHAL PRADESH
                                              27%
                                                                                                                     8%
                                                                         CHHATTISGARH                                          13%

  Core Markets are smaller centers in rural/semi-urban which typically have a local economy built around agriculture and small businesses, and where we
                                                                                                                                                              9
  typically lend in. Larger centers which have more advanced infrastructure such as airports, malls etc. are defined as Urban Markets.
9M / Q3FY21 Key Financial Highlights

                      15 States and 2 UTs                                                        Touchpoints                                                 Customers                           Employees

                                                                                                      728                                                   18.8 lakh                            18,992
                                                                                                          Vs.                                                    Vs.                                  Vs.
                                                                                                        624                                                 15.9 lakh                             15,308
                                                                                                    (31-Dec-19)                                              (31-Dec-19)                          (31-Dec-19)

                                                                                                                             Loan Assets Under
                  Total B/S Assets                                       Disbursements1                                                                                     Deposits3              CASA Ratio#
                                                                                                                               Management2
            ₹ Crore                                               ₹ Crore                                                 ₹ Crore                                 ₹ Crore

                                     46,605
                                                                                              6,519
                                                                                                                                                  33,222                                29,708
                                                                                                                                                                                                     22%
              38,394                                                                                                       29,867                                      23,865                           Vs.
                                                                     4,870
                                                                                                                                                                                                      16%
                                                                                                                                                                                                   (31-Dec-19)
            31-Dec-19             31-Dec-20                        Q3FY20                   Q3FY21                       31-Dec-19              31-Dec-20          31-Dec-19        31-Dec-20

 1Disbursements   for Q3FY21 include Non-Fund based credit facilities sanctioned
 2Money   Market Term Lending by Treasury of ₹ 575 Cr as on 31st Dec 2019 and ₹ 100 Cr as on 31st Dec 2020 is also added in Loan Assets Under Management.
 3 Deposit Base of ₹ 29,708 Cr includes Certificate of Deposit of ₹ 1,505 Cr, Deposit Base of ₹ 23,865 Cr includes Certificate of Deposit of ₹ 1,813 Cr                                                     10
 # Calculation for CASA Ratio includes CDs in total deposits
9M / Q3FY21 Key Financial Highlights
Total Income Net Interest Income PAT Net Worth
₹ Crore ₹ Crore ₹ Crore ₹ Crore
4,833 Income (pre-
651 tax) from Sale 1,002
3,625 of part stake Profit (after 5,403
77 4,181 in Aavas 1,710 448
tax & net of
3,548 Financiers add’l 4,237
Ltd. 1354 552 provisions)
71
from Aavas
554 proceeds
482
9MFY20 9MFY21 9MFY20 9MFY21 9MFY20 9MFY21 31-Dec-19 31-Dec-20
Yield1 on AUM Cost of Funds Net Interest Margin2 ROA3 / incl Aavas Profit ROE3 / incl Aavas Profit
Vs. Vs. Vs. Vs. Vs.
14.7% 7.8% 5.4% 1.8% / 2.1% 17.4% / 19.9%
(31-Dec-19) (9MFY20) (9MFY20) (9MFY20) (9MFY20)
GNPA NNPA Provision Coverage Ratio CRAR4 Tier-I CRAR4
Vs. Vs. Vs. Vs. Vs.
1.9% 1.0% 46.8% 19.3% 16.5%
(31-Dec-19) (31-Dec-19) (31-Dec-19) (31-Dec-19) (31-Dec-19)
1Total Loan Assets AUM Yield is calculated excluding the Money Market Lending by Treasury;
2Net Interest Margin represents Net Interest Income as % of Average Interest Earning Assets; Annualized.
3ROA represents PAT as % of Average Total Assets; Annualized; ROE represents PAT as % Net worth; Annualized. 11
4 CRAR and Tier 1 CRAR exclude profit for 9MProfitability Trends
*Including Profit from Sale of part stake in Aavas Financiers Ltd.
RoE2 (%)
RoA1 (%)
37.1%*
4.2%* 27.1%* 27.3%*
2.9%* 3.0%* 19.9%*
2.1%*
2.1% 1.8% 1.6% 1.8% 1.7% 19.6% 16.5% 14.0% 17.4% 15.1%
Q3FY20 Q2FY21 Q3FY21 9MFY20 9MFY21 Q3FY20 Q2FY21 Q3FY21 9MFY20 9MFY21
ROA / ROE – Components
NII1 (%) Other Income1 (%) Opex1 (%)
3.8% 3.7% 3.7%
5.5% 5.6% 5.9%*
5.1% 3.4%
5.1% 5.1% 2.6%* 3.5%* 3.3%
2.0%*
1.7% 1.3% 1.6% 1.7% 1.6%
Q3FY20 Q2FY21 Q3FY21 9MFY20 9MFY21 Q3FY20 Q2FY21 Q3FY21 9MFY20 9MFY21 Q3FY20 Q2FY21 Q3FY21 9MFY20 9MFY21
Cost to Income Ratio4 (%) Provisions & Contingencies1 (%)
53.2% 54.1% 55.3% # Including
51.9% 49.2% COVID-19
1.6%# related
53.0%* Provisions
44.9%* 38.1%* 2.5%
32.7%*
1.1%
0.4% 0.5% 0.5%
Q3FY20 Q2FY21 Q3FY21 9MFY20 9MFY21 Q3FY20 Q2FY21 Q3FY21 9MFY20 9MFY21
1 ROA, NII,Opex, Provisions & Contingencies is represented as % of Avg. Total Asset; ROA excludes Profit from Sale of Investments in Aavas Financiers Ltd.; Annualized for quarterly figures
2 ROE represents PAT as % of Avg. Net worth; ROE excludes Profit from Sale of Investments in Aavas Financiers Ltd.; Annualized for quarterly figures
3 As % of sum of Avg. Total Assets; Other Income excludes Profit from Sale of Investments in Aavas Financiers Ltd.; Annualized for quarterly figures 12
4 Cost to Income Ratio represents Operating Cost to sum of NII and Other Income; Cost to Income ratio excludes Profit from Sale of Investments in Aavas Financiers Ltd.Profit & Loss Statement
(All Figures in ₹ Crore) 9M FY21 9M FY20 Y-o-Y Q3FY21 Q3FY20 Y-o-Y Q2FY21 Q-o-Q
Unaudited Unaudited Unaudited Unaudited Unaudited
Income
Interest Earned 3,658 3,102 18% 1,261 1,112 13% 1,212 4%
Interest Expended 1,948 1,748 11% 628 605 4% 652 -4%
Net Interest Income 1,710 1,354 26% 633 507 25% 561 13%
Other Income 523 446 17% 184 161 14% 141 30%
Income from sale of Equity Shares of Aavas Financiers
651 77 746% 480 - - 144 -
Ltd.
Total Net Income 2,885 1,877 54% 1,297 668 94% 846 53%
Expenses
Employee Cost 643 555 16% 240 187 28% 224 7%
Other Operating Expenses 456 440 4% 184 168 9% 156 18%
Total Operating Expenses 1,100 996 10% 424 355 19% 380 11%
Operating Profit before Provisions and
1,785 881 102% 873 313 179% 466 87%
Contingencies
Provisions (other than tax) and Contingencies 382 133 188% 284 40 607% 57 394%
Covid-19 Provisions 140 - - - - - - -
Exceptional Items - - - - - - - -
Profit Before Tax 1,262 749 69% 589 273 116% 409 44%
Tax expenses 261 196 33% 110 83 34% 87 27%
Profit After Tax 1,002 552 81% 479 190 152% 322 49%
13Balance Sheet – Total Assets grew 21% YoY
(All Figures in ₹ Crore) Dec 31, 2020 Dec 31 , 2019 Y-o-Y Sep 30 , 2020 Q-o-Q
Unaudited Unaudited Unaudited
Liabilities
Capital 307 304 1% 307 -
Money received against Share Warrants - - - - -
Employees stock options outstanding 49 57 -14% 52 -6%
Reserves and Surplus 5,047 3,876 30% 4,558 11%
Deposits 29,708 23,865 24% 26,980 10%
Borrowings 9,171 8,668 6% 10,123 -9%
Other Liabilities and Provisions 2,324 1,623 43% 1,995 16%
Total Liabilities 46,605 38,394 21% 44,014 6%
Assets
Cash and Balances with R B I 1,116 1,019 10% 1,110 1%
Balances with banks and Money at Call and Short Notice 2,223 1,110 100% 3,216 -31%
Investments 11,562 8,588 35% 11,241 3%
Advances 30,293 26,572 14% 27,233 11%
Fixed Assets 469 449 4% 452 4%
Other Assets 942 656 44% 762 23%
Total Assets 46,605 38,394 21% 44,014 6%
14Breakup of Other Income
(All Figures in ₹ Crore) Q3FY20 Q2FY21 Q3FY21
Unaudited Unaudited Unaudited
Loan Assets Processing & Other fees 87 54 101
General Banking & Deposits related fees 18 23 28
Cross Sell, Distribution related fees & others 10 6 7
PSLC Premium / Fees 25 8 8
Income from Treasury Operations 16 46 36
Income from sale of Equity Shares of Aavas Financiers Ltd. - 144 480
Bad Debt recovery 5 4 5
Other Income Total 161 286 663
152. Key focus : Asset Quality
16Collection Efficiency - Normalcy achieved in almost all segments
Product Dec-20 Q3FY21 Q2FY21 Q3FY20
SBL 113% 108% 106% 99%
Wheels 98% 92% 89% 99%
NBFC 99% 99% 105% 100%
Business Banking 97% 100% 105% 96%
REG 105% 102% 110% 91%
Agri 146% 113% 119% 94%
Home Loan 124% 126% 112% 100%
SME 149% 126% 106% 88%
Personal Loans 99% 92% 88% 95%
Gold Loan 104% 162% 116% 100%
Consumer Durable 108% 97% 85% 97%
Others 200% 90% 100% 100%
Grand Total 103% 97% 96% 98%
➢ Collection efficiencies for Q3FY21 is in line with Q3FY20 with normalization across most segments
Collection efficiency is calculated with all money received during the month from borrowers (excluding foreclosure) as % of current demand for the month;
For moratorium months 100% billing was assumed 17Customer Activation – Normalcy achieved in almost all segments
December-2020
% of Gross Advances
Product Total Gross
Advances Full Part
(₹ Cr)
SBL 12,343 84% 8%
Wheels 11,262 81% 6%
NBFC 1,399 99% 0%
Business Banking 1,348 96% 2%
REG 634 86% 12%
Agri 869 93% 4%
Home Loan 987 93% 3%
SME 497 75% 14%
Gold Loan 160 75% 6%
Personal Loan 76 82% 8%
Others 780 100% 0%
Total 30,355 84% 7%
➢ Customer Activation denotes % of customers paying in the same month as the month of billing;
➢ Full and Part EMI clearance from April’19 to Feb’20 has been around 80% and 5% respectively
➢ Excluding NPA Pool
18Break up of Credit Cost
Credit Cost - Net Impact on P/L Q3FY20 Q2FY21 Q3FY21
(All Figures in ₹ Crore) Unaudited Unaudited Unaudited
Repossession Loss 11 5 7 *During the
POS Loss 4 3 4 quarter, the bank
Write off 2 0 86* sold ₹ 93.6 Cr
Less: Bad Debt Recovery -5 -2 2 pool to an ARC
Net Credit Loss 12 6 95 having provision
Net Credit Loss (as % of Avg. Total Assets) 0.13% 0.06% 0.83% of 85.6 Cr
Provision on NPA 15 16 -70
Credit Cost – Net Impact on P/L 27 22 24
Credit Cost – Net Impact on P/L (as % of Avg. Total Assets) 0.3% 0.2% 0.2%
Movement of Gross NPA Q3FY20 Q2FY21 Q3FY21
(All Figures in ₹ Crore) Unaudited Unaudited Unaudited
Opening Gross NPA 504 447 423
Additions during the period 130 23 6
Reductions during the period 130 47 126
Gross NPA (closing) 504 423 303
Gross NPA Net NPA Provision Coverage Ratio
1.9% 1.0% 76.0%
1.5% 71.0%
1.0% 0.5% 0.2% 46.8%
31-Dec-19 30-Sep-20 31-Dec-20 31-Dec-19 30-Sep-20 31-Dec-20 31-Dec-19 30-Sep-20 31-Dec-20
GNPA and NNPA would have been 3.3% and 1.3% respectively in the absence of the Hon’ble Supreme Court’s interim order. The
bank has created additional provisions for these accounts.
19Details on Provisions
Amount Provisioning Coverage
Particulars (in Cr) (in Cr) (%)
Total Proforma GNPA (A) 1,017 625 61%
Gross NPA 303 230 76%
Proforma Slippages 714 395 55%
Additional Contingency Provisions (B) 143
Contingency Buffer 108
Add’l for restructured assets (Excl. std prov) 251 35
Standard Provisioning (C) 146
On Standard Assets 133
On Restructured assets 13
Total Provisioning at Bank (A+B+C) 914*
➢ Our stressed assets are small ticket, secured and are used for income generation; We expect resolutions to pick up pace going ahead
➢ We are now carrying Contingency + COVID related provisions on all identified potential sources of stress which is well above our historical costs
➢ Our average credit cost of last 3 years has been ~50bps for Wheels and ~30bps for SBL and ~40bps at portfolio level
➢ We are currently carrying ₹ 733 crores (72% coverage) on Proforma GNPA and ₹ 48 Crores on Restructured Assets (19% coverage)
➢ Overall, we think that current provisioning levels are more than adequate to address losses from current identified stress portfolio including any
future COVID related slippages and/or any stress from restructured assets; Credit costs will normalize from Q4FY21 onwards
*Total provision is 3% of Gross Advances
20Segmental break up of NPAs
₹ Crore
Segmental break-up of NPA and restructured Assets
Proforma Total % of Proforma Restructured
Product Reported NPA %
NPA Proforma NPA NPA Cases
Wheels 99 386 485 48% 105 42%
SBL 122 248 370 36% 98 39%
Agri-SME 50 30 80 8% 38 15%
Others 31 50 81 8% 10 4%
Grand Total 303 714 1,017 100% 251 100%
➢ 84% of our Proforma NPAs are coming from our two vintage businesses - Wheels and SBL
➢ Both segments are fully secured having strong security cover and consistent track record in recovery rates
Details of Proforma NPA pool Wheels SBL
Average Ticket Size (₹ lacs) 3.5 9.2
Avg. LTV* ~80% 60% portfolio has LTV3. Building a Digital Bank
22Focus on Customer Experience and Increasing Digital Product Offering
▪ Upgraded Mobile Banking and Internet Banking platform; launched in Q3FY21 with 130+ new functionalities
▪ 10+ new end-to-end banking service & product journeys for both NTB and ETB customers scheduled for launch in Q1FY22
Deposits Cards Loans Insurance Investment Payments Lifestyle Offers
AU SFB Bank 1 Bank 2 Bank 3 AU SFB Bank 1 Bank 2 Bank 3
General General
Deposits Funds Transfer Deposits Funds Transfer
DEMAT Account DEMAT Account
Forex Tax Centre Forex Tax Centre
Loans Services Loans Services
Insurance Products Insurance Products
Mutual Funds Mutual Funds
Nov ‘20 April‘21
* Functionality comparison based on internal analysis. Bank 1 – large public sector bank in India , Bank 2 and Bank 3 - top 5 private sector banks in India 23Serving Customers across Digital Channels
Video Tele Banking
ATM Banking (IVR)
~1K deposits’ customers onboarded. Resolved 3.5+ lakh customer service
~50 lakh transactions worth ~2,450
Channel being extended to other requests raised by 2+ lakh
Cr. executed in Q3FY21
products and services customers
Chatbot- WhatsApp Missed Call
Auro Banking Banking
10+ lakh hits for 10+ services on 70K+ interactions on WhatsApp 3+ lakh balance checks &
Chatbot in Q3FY21 Banking in Q3FY21 statements generation in Q3FY21
24Increasing Customer Transactions across MB / IB and Payments
Mobile and Internet Banking - Monthly and Daily Active Users
Mobile and Internet Banking 150 25
Thousands
(DAU) Thousands
▪ Steady increase in DAU and MAU over 120 20
90 15
last 6 months driven by digital 60 10
migration, organic growth, engagement 30 5
on debit cards and upgraded platform. 0 0
Jan 20 Feb 20 Mar 20 Apr 20 May 20 Jun 20 Jul 20 Aug 20 Sep 20 Oct 20 Nov 20 Dec 20
▪ Q3FY21 Avg. MAU – DAU ratio ~6.3
Monthy Active Users (MAU) Daily Active Users (DAU)
UPI UPI QR AEPS
2.8 3.1 32.9 151 173
2.6 2.8 29.5
2.3 2.4
82
13.4
51 59
49 2.9 2.8
33 37 42 0.2 0.8 1.1 2.2 2.9 1.9 2.4
Jul-20 Aug-20 Sep-20 Oct-20 Nov-20 Dec-20 Jul 20 Aug 20 Sep 20 Oct 20 Nov 20 Dec 20 Q1FY21 Q2FY21 Q3FY21
Transaction Count (Lac) Unique Customer (Lac) Transaction Count (Lac) Transaction Amount (Cr) Transaction Count (Lac) Transaction Amount (Cr)
▪ Increasing unique customers; 3+ lakh ▪ 34K+ merchants onboarded as on
▪ 2.5 Lac transactions executed worth
as on Q3FY21 Q3FY21
~₹ 172 Cr in Q3FY21
▪ 1.6+ Cr. transactions worth ~₹ 6K Cr. ▪ ~11 Lac transactions worth ~₹ 132 Cr.
▪ Very strong traction in core areas
executed in Q3FY21 executed in Q3FY21
25Building Capabilities to Enhance Productivity
Tab Banking
Tab based journeys for lending products - SBL (live); Home Loan and Wheels to be launched in FY22
Leveraging Tab Banking across products customer onboarding to enhance experience, reduce TAT and optimize workforce productivity
90%+ deposits accounts being opened via digital platforms
6000+ CRM Mobile Users Data and Analytics
Mobile App based end-to-end sales management tool for Risk based score cards for credit underwriting to reduce TAT
employees to increase customer engagement, lead and quantify risk
management and cross sell 4+ lakh pre-approved offers generated, increasing over all PPC
Building Strong Technology and Product Team
Technology and Product inhouse full time employee at 350 in Q4FY21, to increase at ~500 by Q1FY22
Sourcing right mix of talent and experience from premium institutes and leading organizations
26Building API Stack to Partner with the Ecosystem
Current / Upcoming Engagements
Offers `
Unsecured Lending
API Banking
Secured Lending
Deposits
Payments
Investments
274. Branch Banking Overview
28Deposits Journey – Moving to a sustainable granular franchise
Key turning points Core Principles of our Deposit Strategy
Our Performance
Deposit as Retail
Key events a % of Deposits as
external a % of total
liabilities deposit
April’17 (Bank Launch) N/A N/A
Sept’18 (NBFC Crisis +
21% 35%
Branch vintage >1 yr)
Mar’20 (COVID-19 gave
72% 43%
room to execute) Customer
Customer &
& Market
Market
Segmentation
Segmentation
Dec’20 76% 55% Core
Core && Urban
Urban Markets
Markets
UYC –– Profiles
UYC Profiles Based
Based Acq
Acq
Key markers being tracked are CD Ratio, CASA ratio and Retail to Total Deposit Ratio
29Building blocks in place for a strong deposit franchise
• Won APY • 16 New • New Partners-
Premier League Branches ICICI Prudential
of PFRDA Oct • Lucknow, Life Insurance,
2020 Hyderabad, Care Health
• Granular Bhubaneshwar Insurance
distribution of & Kolkata • Digital
Social Security Onboarding
Schemes • Wealth – MF,
• Profile-based ASBA, IPO, 3-in-1
Banking
Digital Ready
Video
Merchant Banking
Insurance & Ready
Branch Investment
Fin. Inclusion Expansion
& Individual • ~34,000 QRs • Accounts • New AU
Banking Deployed • Loans Mobile & NB
• ~60% • Customer • Bill Payment
Activation Service • Fastag
• Relationship • Scan & Pay
Management
30Offers and Engagement aiding Activation and Deepening
Offers across major brands Shopping Festival and Pre-Approved Offers on Maruti Suzuki NEXA
78% Debit Card users on Amazon were new activations
Hyperlocal Debit Card Offers across cities Events for Customer Engagement
Key Metrics (scaled) Mar’20 Sep’20 Dec’20
Focus during FY21 on deepening AMB/non-zero-bal-Customer 100 154 192
engagement and cross sell resulting in TD/non-zero-bal-Customer 100 116 120
Zero Bal Customers 100 95 95
steady improvement across several key % transacting Customers 100 101 109
underlying metrics Avg. transaction/transacting customer 100 151 169
31Branch Banking - Snapshot
Growing Deposit Franchise Average Monthly Balance
in ₹ Crore in ₹ Crore
33% of the Term
28,203 Deposits are non- 27,201
25,346 callable [Bulk TD – 24,300
22,052 61% non-callable] 21,123
21,758 Growth 21,103
20,008 19,376
18,309
Y-o-Y Q-o-Q
17,786
Total Deposits* 28% 11%
Savings Account 85% 21%
4,296 5,191 5,087
2,811 2,758 3,997
932 1,041 1,254 579 927 1,011
Dec-19 Sep-20 Dec-20 Dec-19 Sep-20 Dec-20
Current Account Saving Account Term Deposits* Current Account Saving Account Term Deposits*
Retail deposits (CASA + Retail TD) now at 55% of deposits vs 54% in Q2FY21 and 43% in Q2FY20 with improving granularity across CA/SA/TDs
5,191
21,758
4,296 10% 20,008
18,309
9%
52%
2,811 52%
63%
19% 90%
91%
81% 48% 48%
37%
Dec-19 Sep-20 Dec-20 Dec-19 Sep-20 Dec-20
Retail SA Bulk SA Retail TD Bulk TD
*Deposits excludes Certificate of Deposits of ₹ 1,813 Cr as on 31st Dec 2019, ₹ 1,635 Cr as on 30th Sep 2020 and ₹ 1,505 Cr as on 31st Dec 2020
1 Retail SA refers to all SA of Individuals (including Salaried), HUF and SA of Government & TASC having balance of less than ₹ 5 Crore while Bulk SA refers to SA of Government & TASC with balances of ₹ 5 Crore & above
2 Retail TD refers to all TD of Individuals (including Salaried), HUF and TD of Corporates, Government & TASC having balance of less than ₹ 1 Crore till 31stDec 18 and less than ₹ 2 Crore from 31stMar 19 while Bulk TD refers to all TD of 32
Banks and TD of Corporates, Government & TASC with balances of ₹ 1 Crore & above Crore till 31st Dec 18 and ₹ 2 Crore & above from 31st Mar 19Branch Banking – Deposit profile
Profile of Deposits1 spread across segments – Individual base increased its share from 36% to 59% in the past year
4% 4% 4% 5% 6% TASC
Contribution of Banks and
10% 8% 8% 7% 8%
corporates has come down
7% from 49% to 28% over the
14% Govt.
19% 21% 21% year
21%
25%
26% 26% Banks
30%
TASC and NRI verticals
59% Corporate gaining traction; have
48% reached ~7%
36% 41% 41%
Individuals+HUF+Sole
Proprietor+Partnership
Dec-19 Mar-20 Jun-20 Sep-20 Dec-20
Area-wise Deposit Distribution CASA Ratio#
22%
20%
CA SA TD 16%
Urban Market Banking 68% 58% 77%
Core Market Banking 32% 42% 23%
Dec-19 Sep-20 Dec-20
As on 31st Dec 2020
1 Deposits excludes Certificate of Deposits of ₹ 1,813 Cr as on 31st Dec 2019, ₹ 1,635 Cr as on 30th Sep 2020 and ₹ 1,505 Cr as on 31st Dec 2020
# Calculation for CASA Ratio includes CDs in total deposits 335. Assets Overview
34Disbursements and AUM Trends
in ₹ Crore
Disbursements AUM
YoY Growth
YoY Growth 11%
34%
33,222
6,519
30,590
29,867
4,870
3,409
Q3FY20 Q2FY21* Q3FY21** Q3FY20 Q2FY21 Q3FY21
*Includes ₹ 53 Cr disbursed under TLTRO and ₹ 354 Cr disbursed under ECLGS Scheme
**Includes ₹ 150 Cr disbursed under ECLGS Scheme 35AUM mix – Retail AUM constitutes 91%
Retail Assets Corporate Assets AUM as on 31st % of
Category (Amount in ₹ Cr) Amount % of category Amount % of category Dec 2020 total
Wheels* 13,473 99% 76 1% 13,549 41%
New 8,487 99% 76 1% 8,563
Used & CoW 4,986 100% - 0% 4,986
SBL-MSME 12,858 100% 10 0% 12,868 39%
Home Loan 987 100% - 0% 987 3%
GL+CD+PL 239 100% - 0% 239 1%
OD against FD 587 87% 86 13% 673 2%
REG 101 16% 543 84% 645 2%
Business Banking 964 69% 429 31% 1,393 4%
Agri SME 1,168 85% 212 15% 1,380 4%
NBFC - 0% 1,386 100% 1,386 4%
Others 3 3% 100 97% 103 0%
Total Assets 30,380 91% 2,842 9% 33,222 100%
• The above classification is as per the latest RBI definition of regulatory retail and corporate assets
• Retail AUM contribution as per our earlier disclosure format (used till Q2FY21) would have been 85% in Q3FY21 vs. 84% in Q2FY21
*Note – Total Wheels AUM includes AUM of Two-Wheeler and Vehicle Pool buyout. 366. Other Key Updates
37Well entrenched contiguous distribution franchise
15 States and
728 Touchpoints 341 ATMs
No. of Touch points
2 UTs Urban Market Core Market
Total
Presence# Presence#
714 Branches1, 14 BCs 166 562 728
Break up of branches
States & UT Total Branches
Rajasthan 311
Madhya Pradesh 104
Jammu & Kashmir
Punjab Himachal Pradesh
Gujarat 102 Metropolitan
Haryana Delhi Maharashtra 68 15%
Uttar Pradesh Punjab 40 32%
Rajasthan
Haryana 31 Urban
Delhi / NCR 18
Gujarat Madhya
Pradesh
West Bengal
Chhattisgarh 13 22%
Chhattisgarh Himachal Pradesh 11
Odisha
Uttar Pradesh 7 Semi Urban
Maharashtra
Telangana Karnataka 2 31%
Goa
Goa 2
Karnataka
Chandigarh 1 Rural
Jammu & Kashmir 1
West Bengal 1
Telangana 1
Odisha 1
Total 714
❑ Distribution Network spread across 15 states and 2 Union Territories; 63% of our branches are in Rural & Semi Urban Areas (Tier 2
to Tier 6)
1 550 Bank Branches and 164 Business Correspondent Banking Outlets.
#The definition of Core Market Banking and Urban Market Banking is AU Bank’s internal terminology 38Inclusive Banking
Financial Inclusion – driving key government initiatives
During the quarter, the Bank
➢ Disbursed 21,252 MUDRA Loans
➢ Opened 12,269 Basic Savings Bank Deposit Account (BSBDA) accounts\
➢ Enrolled 1,368 customers in Pradhan Mantri Jeevan Jyoti Bima Yojana (PMJJBY)
➢ Enrolled 3,978 customers in Pradhan Mantri Suraksha Bima Yojana (PMSBY)
➢ Enrolled 3,737 customers in Atal Pension Yojana (APY)
➢ 854 Physical Financial Literacy Camps conducted in Q3 FY21 (with social distancing measures)
Corporate Social Responsibility
➢ Bank has spent over ₹ 2.6 Cr in Q3FY21 through awareness programs, medical equipment donation, masks and sanitizer donations, food assistance
and transportation projects
➢ Provided support to educational institutions for providing scholarships to meritorious students
Awards
➢ The bank was awarded ET BFSI Excellence award 2020 for Best Financial Premier League Best Financial Inclusion
Inclusion Initiatives Par Excellence Initiatives of the Year
Makers of Excellence
➢ The bank also won PFRDA’s Winner’s Award in APY Premier League for
opening maximum accounts in October 2020 in the SFB category
39Experienced Board of Directors
Mr. Raj Vikash Verma Mr. V G Kannan Mr. Krishan Kant Rathi
Chairman and Independent Director Independent Director Independent Director
40+ years of experience 38+ years of experience in Banking 34+ years of experience
Industry
Masters in Economics, MBA (FMS), CAIIB MBA FCA, CS
Ex MD - State Bank of India
Ex-Chairman at NHB Ex-CEO, Future Consumer Limited
Ex Chief Executive – Indian Bank Association
Leadership positions at IMGC, CERSAI, PFRDA, etc. Ex-CFO, Future Group
Member of Governing Council - IIBF
Ms. Jyoti Narang Prof. M S Sriram Mr. Pushpinder Singh
Independent Director Independent Director Independent Director
35+ years of experience (including 35+ years of experience in IT and
40+ years of experience 22 years as an academic) Payment Systems
MBA MBA, Fellow, IIMB (equivalent to PhD) BSc, CAIIB
Visiting Faculty at IIM - B, Distinguished Fellow-
Ex-CIO, Bank of India
Ex-COO, Taj Group of Hotels IDRBT, Chairperson-Centre for public policy-IIMB
Ex Advisor, NPCI (FI & new business)
On Board of IDMC and NDDB dairy Services etc.
Mr. Sanjay Agarwal Mr. Uttam Tibrewal
MD & CEO Whole-Time Director
25+ years of experience 23+ years of experience
FCA (All India Rank holder) B. Com
EY Entrepreneur of the Year Award 2018; Business
Associated with the Bank for more than 16 years
Leader of the Year, ICAI Awards, 2017
40Marquee Shareholders Base – As on 20th Jan 2021
Shareholding Break –up Key Shareholders (Holding 1%+) Holding on 20-Jan-21
Promoter & Promoter Group 29.0%
Foreign
Institutions (FC, Promoter & AU Employees incl. Exec. Director 3.3%
FPI, FII) & NRI Promoter Group -
Domestic, 29.0% Wasatch 4.9%
(Non-repatriable),
35.4% Temasek Holdings 4.7%
Capital Group 4.0%
WestBridge Capital 3.9%
Kotak Mahindra MF & AIF 3.8%
Nomura 3.5%
Motilal Oswal MF 2.7%
UTI MF (Various MF & Offshore funds) 2.4%
JP Morgan Funds 2.1%
HDFC Life Insurance Co. Ltd. 1.9%
VANGUARD (through its various funds) 1.7%
Amansa Holdings 1.6%
Domestic
SBI Life Insurance 1.2%
Others - Domestic, Institutions (MF, Nippon MF 1.2%
4.7% INS, FI, AFI), 20.5%
Kotak’s Offshore Funds (through its various funds) 1.1%
Individuals -
Domestic, 10.4% Motilal Oswal Financial Services Ltd 1.1%
William Blair 1.1%
Total no. of shareholders 1,11,776
Motilal Oswal Private Equity 1.0%
Domestic : Foreign 65 : 35
41THANK YOU
TOPIC
For Investor queries contact (details in QR Code):
Prince Tiwari | Aseem Pant | Ayush Rungta
42
Email: investorrelations@aubank.inAbbreviations
ADC Alternate Delivery Channels NPA Non Performing Assets
AFS Available for Sale NSE National Stock Exchange
ALM Asset Liability Management OPEX Operating Expenses
AUM Asset Under Management P/L Profit & Loss Statement
BSBDA Basic Savings Bank Deposit A/C PAT Profit After Tax
BSE Bombay Stock Exchange PPOP Pre-Provisioning Operating Profit
Current Account Deposits and Savings Account
CASA QoQ Quarter on Quarter
Deposit
CBS Core Banking Solution ROA Return on Average Assets
CRAR Capital Adequacy Ratio ROE Return on Average Shareholder's Fund
CRR Cash Reserve Ratio RTGS Real Time Gross Settlement
DPD Days Past Due SFB Small Finance Bank
EPS Earning Price Per Share SLR Statutory Liquidity Ratio
HTM Held Till Maturity SMC Small and Mid-Corporate
IPO Initial Public Offer STP Straight Through Processing
LCR Liquidity Coverage Ratio TAB Tablet Mobile Device
NBFC Non-Banking Finance Company YoY Year on Year
NII Net Interest Income
43Disclaimer
This presentation has been prepared by AU SMALL FINANCE BANK LIMITED (the “Bank”) solely for information purposes, without regard to any specific objectives, financial situations or informational
needs of any particular person. All information contained has been prepared solely by the Bank. No information contained herein has been independently verified by anyone else. This presentation may
not be copied, distributed, redistributed or disseminated, directly or indirectly, in any manner.
This presentation does not constitute an offer or invitation, directly or indirectly, to purchase or subscribe for any securities of the Bank by any person in any jurisdiction, including India and the United
States. No part of it should form the basis of or be relied upon in connection with any investment decision or any contract or commitment to purchase or subscribe for any securities. Any person placing
reliance on the information contained in this presentation or any other communication by the Bank does so at his or her own risk and the Bank shall not be liable for any loss or damage caused pursuant
to any act or omission based on or in reliance upon the information contained herein. No representation or warranty, express or implied, is made as to, and no reliance should be placed on, the fairness,
accuracy, completeness or correctness of the information or opinions contained in this presentation. Such information and opinions are in all events not current after the date of this presentation. Further,
past performance is not necessarily indicative of future results.
This presentation is not a complete description of the Bank. This presentation may contain statements that constitute forward-looking statements. All forward looking statements are subject to risks,
uncertainties and assumptions that could cause actual results to differ materially from those contemplated by the relevant forward-looking statement. Important factors that could cause actual results to
differ materially include, among others, future changes or developments in the Bank’s business, its competitive environment and political, economic, legal and social conditions. Given these risks,
uncertainties and other factors, viewers of this presentation are cautioned not to place undue reliance on these forward-looking statements. The Bank disclaims any obligation to update these forward-
looking statements to reflect future events or developments.
Except as otherwise noted, all of the information contained herein is indicative and is based on management information, current plans and estimates in the form as it has been disclosed in this
presentation. Any opinion, estimate or projection herein constitutes a judgment as of the date of this presentation and there can be no assurance that future results or events will be consistent with any
such opinion, estimate or projection. The Bank may alter, modify or otherwise change in any manner the content of this presentation, without obligation to notify any person of such change or changes.
The accuracy of this presentation is not guaranteed, it may be incomplete or condensed and it may not contain all material information concerning the Bank.
This presentation is not intended to be an offer document or a prospectus under the Companies Act, 2013 and Rules made thereafter , as amended, the Securities and Exchange Board of India (Issue of
Capital and Disclosure Requirements) Regulations, 2009, as amended or any other applicable law.
Figures for the previous period / year have been regrouped wherever necessary to conform to the current period’s / year’s presentation. Total in some columns / rows may not agree due to rounding off.
Note: All financial numbers in the presentation are from Audited Financials or Limited Reviewed financials or based on Management estimates.
44You can also read


