Neoen Capital Markets Day - 11 March 2021

Page created by Derek Marsh
 
CONTINUE READING
Neoen Capital Markets Day - 11 March 2021
Neoen Capital Markets Day
        11 March 2021
Neoen Capital Markets Day - 11 March 2021
Disclaimer

This presentation contains forward-looking statements regarding the prospects and growth strategies of Neoen and its subsidiaries (the
“Group”). These statements include statements relating to the Group’s intentions, strategies, growth prospects, and trends in its results of
operations, financial situation and liquidity. Although such statements are based on data, assumptions and estimates that the Company
considers reasonable, they are subject to numerous risks and uncertainties and actual results could differ from those anticipated in such
statements due to a variety of factors, including those discussed in the Group’s filings with the French Autorité des Marchés Financiers
(AMF) which are available on the website of Neoen (www.neoen.com). Prospective information contained in this presentation is given only
as of the date hereof. Other than as required by law, the Group expressly disclaims any obligation to update its forward-looking statements
in light of new information or future developments.

                                                                                                                                               2
Neoen Capital Markets Day - 11 March 2021
Agenda for today
Time (CET)              Section                                                         Speaker

09:00 – 09:10           Introduction                                                    Xavier Barbaro

09:10 – 10:00           FY 2020 results - Q&A                                           Louis-Mathieu Perrin

10:00 – 10:50           Our differentiated and integrated strategy - Q&A                Romain Desrousseaux / Jean-Christophe Cheylus

10:50 – 10:55           Break

10:55 – 11:05           Sustainability - Taking the next step                           Xavier Barbaro

11:05 – 12:00           2025 Roadmap - Q&A                                              Xavier Barbaro / Louis-Mathieu Perrin

    Xavier Barbaro                 Romain Desrousseaux                     Louis-Mathieu Perrin            Jean-Christophe Cheylus
  Chief Executive Officer         Deputy Chief Executive Officer            Chief Financial Officer            Head of Energy management

                                                                                                                                           3
Neoen Capital Markets Day - 11 March 2021
Full-year 2020 results
Neoen Capital Markets Day - 11 March 2021
1. FY 2020 highlights

2. FY 2020 results

3. Outlook

4. Appendices

                        5
Neoen Capital Markets Day - 11 March 2021
2020 highlights

                                         4.1 GW                         +1 GW                       5.2 GW
                         In operation and under construction       Newly awarded projects             Secured(1)

                                         299 M€                       270 M€(2)                       222 M€
                                            Revenue                       EBITDA            Cash-flow from operating activities

                                   up 18% y-o-y                     up 25% y-o-y                   up 20% y-o-y

(1) Assets in operation, under construction and projects awarded
(2) 274.8 M€ at constant exchange rates                                                                                           6
Neoen Capital Markets Day - 11 March 2021
Strong performance in 2020 end EBITDA target reached

                            Revenue (M€)                                                                      EBITDA (M€)                              Secured capacity(1) (in GW)

                             +18%                  298.8                                                          +25%                                            +1.0 GW
                                                                                                                                      (1)
                                                                                                                                                                               5.2
                                                                                                                              270.4
              253.2

                                                                                                     216.1
                                                                                                                                                         4.1

                                                                                                      85%                      90%
                                                                                                  EBITDA margin            EBITDA margin

               2019                                2020                                               2019                     2020                  31.12.2019             31.12.2020

   • FY 2020 revenue up 18% year-on-year                                                • 2020 EBITDA target achieved: 275 M€ at                 • More than 1 GW in newly awarded projects
                                                                                          constant exchange rate                                   in 2020
                                                                                        • 2020 EBITDA margin of 90%, up 5 bp y-o-y
                                                                                            – Liquidated damages(2) covering, up to a cap, the
                                                                                              revenue losses related to the delayed
                                                                                              commissioning of certain projects
                                                                                            – One-off positive impact in storage in Q1 2020

(1) Liquidated damages recognized in other current operating income, partly offsetting losses of revenue,
    thereby automatically improving the EBITDA margin                                                                                                                                         7
Neoen Capital Markets Day - 11 March 2021
1. FY 2020 highlights

2. FY 2020 results

3. Outlook

4. Appendices

                        8
Neoen Capital Markets Day - 11 March 2021
2020 revenue up 18% year-on-year
                                                            Revenue (in M€)
                                                                                                                             • Significant contribution from assets commissioned in 2019
                                                                                                                               and 2020 as well as early generation revenue recorded in
                                    +40.3
                                                                                                                               2020
                                                                              +12.3                             298.8
                                                                                          -2.0
                    +17.3
                                                     -10.8             -6.9
                                                                                                  -4.6                       • Lower average price at a wind farm in Australia due to the
   253.2                                                                                                                       transition from early generation revenue(2) to PPA in the
                                                                                                                               first 9M 2020 and year-on-year decrease in market prices
                                                                                                                               in the last three quarters of 2020, especially in Australia

                                                                                                                             • Negative volume effect due to less favorable irradiation
                                                                                                                               conditions in Australia throughout 2020 and to reduced
                                                                                                                               availability of certain Australian assets in H1 2020

                                                                                                                             • Strong one-off increase in HPR battery revenue in Australia
                                                                                                                               in Q1 2020 partly offset by unfavorable market conditions
                                                                                                                               for the sale of network services over the rest of the year

                                                                                                                             • Negative FX impact mainly due to the weakening in the
                                                                                                                               average level of the Australian Dollar against the Euro;
                                                                                                        (1)
2019 revenue     Impact 2019 New capacity in          Prices         Volume   Storage     Other    FX         2020 revenue
                commissioning    2020                                         Australia
                                                                                                                               revenue up 20% at constant FX rates

(1) Based on average FX rate over 2019
(2) Short-term energy revenues prior to the start of a long-term contract                                                                                                                 9
Neoen Capital Markets Day - 11 March 2021
Solid growth in 2020 EBITDA
                                                            EBITDA (M€)

                                                                                                                        (1)
                                                           +12.9         -18.0
                +54.9          +1.0           -6.6                                                   +13.6       -4.1
                                                                                                                                 270.4
                                                                                                                                              • EBITDA up 25% year-on-year mainly driven by the
                                                                                       +0.5
                                                                                                                                                revenue growth in Solar in Americas, in Wind in Europe-
                                                                                                                                                Africa and in storage in Australia

   216.1

                                                                                                                                              • EBITDA margin of 90%, up 5 bp year-on-year due to
                                                                                                                                                liquidated damages(2) covering, up to a cap, the revenue
    85%                                                                                                                           90%
EBITDA margin                                                                                                                 EBITDA margin     losses caused by delayed commissioning of certain
                                                                                                                                                projects and a one-off positive impact in Storage in Q1
                                                                                                                                                2020

    2019        Americas    Europe-Africa    Australia   Europe-Africa   Australia   Europe-Africa   Australia   Other            2020

 (1) Development - Investment and Eliminations
 (2) Liquidated damages recognized in other current operating income, partly offsetting loss of revenue,
     thereby automatically improving the EBITDA margin                                                                                                                                               10
2020 EBITDA by segment: solar
                                                                  2020             2019          % chg.

 Solar                                                           161.2             111.8          +44%
 % margin                                                        112%              94%           +18bp
 Wind                                                             97.2            102.2            -5%
 % margin                                                         80%              92%            -12bp
 Storage                                                          31.4             17.4           +80%
 % margin                                                         96%              85%           +11 bp
 Other(1)                                                        (19.4)           (15.3)          -27%
 Group EBITDA                                                    270.4            216.1           +25%
 Group EBITDA margin                                              90%              85%            +5bp

   • Solar EBITDA up 44% year-on-year
       + Strong contribution from new capacity added in 2020, notably in El Salvador and in Mexico, and, to a lesser extent, full-year
         impact from assets commissioned in 2019 in Australia, Zambia, Jamaica and France
       + Significant increase in liquidated damages in 2020 compared to 2019, directly linked to delayed commissioning, especially in
         Americas
           Lower irradiation conditions in Australia throughout the year and reduced availability of an Australian asset in H1 2020 due to
           upgrade works on the grid
           In the last three quarters of 2020, lower market prices notably in Australia compared to 2019

(1) Development - Investment and Eliminations                                                                                                11
2020 EBITDA by segment: wind
                                                                  2020             2019          % chg.

 Solar                                                            161.2            111.8          +44%
 % margin                                                         112%             94%            +18bp
 Wind                                                             97.2             102.2           -5%
 % margin                                                         80%              92%            -12bp
 Storage                                                          31.4             17.4           +80%
 % margin                                                         96%              85%            +11 bp
 Other(1)                                                         (19.4)           (15.3)         -27%
 Group EBITDA                                                     270.4            216.1          +25%
 Group EBITDA margin                                              90%              85%            +5bp

   • Wind EBITDA down 5% year-on-year
       + Contribution of capacity added in Ireland and in France in 2019 as well as in Finland and France in 2020
       + Ramp-up of Bulgana in Australia, which gradually injected electricity into the grid in H2 2020
           Lower average price earned by the Hornsdale 3 wind farm in Australia in the first 9M 2020 following the entry into force of its long
           term PPA in October 2019
           Decrease in liquidated damages in 2020 compared to 2019, essentially in Australia
           Higher network service costs at certain wind farms in South Australia in Q1 2020 due to specific market conditions

(1) Development - Investment and Eliminations                                                                                                     12
2020 EBITDA by segment: storage
                                                                 2020             2019          % chg.

 Solar                                                           161.2            111.8          +44%
 % margin                                                        112%             94%            +18bp
 Wind                                                            97.2             102.2           -5%
 % margin                                                        80%              92%            -12bp
 Storage                                                         31.4             17.4           +80%
 % margin                                                        96%              85%           +11 bp
 Other(1)                                                        (19.4)           (15.3)         -27%
 Group EBITDA                                                    270.4            216.1          +25%
 Group EBITDA margin                                             90%              85%            +5bp

   • Storage EBITDA up 80% year-on-year
       + Strong one-off positive impact in Q1 2020 in Australia due to specific market conditions (power interconnection line down for 18 days)
           Storage revenue in the last three quarters of 2020 declined year-on-year as weaker demand for electricity in Australia during the
           period reduced strain on the grid, creating less favorable market conditions for sale of network services

(1) Development - Investment and Eliminations                                                                                                     13
Profit & Loss: from revenue to operating income

                                                    2020     2019     Change

Revenue                                            298.8     253.2    +18%

EBITDA                                             270.4     216.1    +25%
Current operating depreciation, amortization and                               Increase in depreciation and amortization resulting from the growth in
                                                   (109.8)   (80.2)   +37%
provisions                                                                     the number of assets in operation related to new commissionings in 2019
                                                                               and 2020
Current operating income                           160.5     135.9    +18%

Other non-current operating income and expenses     (4.0)    (5.5)     -27%
                                                                               Impairment loss related to the Altiplano project in 2020 (-15.3 MUSD)
Impairment of non-current assets                   (14.1)     1.5      n/a
                                                                                – Slow recovery of VAT credits denominated in Argentine peso pending
Operating income                                   142.4     131.9     +8%        reimbursement in a context of declining ARS against USD
                                                                                – Impact of currency control measures currently in place

                                                                                                                                                         14
Profit & Loss: from operating income to net income

                                                                           2020            2019        Change   Cost of debt reflecting
                                                                                                                 – Growth in assets in operation (-10.7M€) and impact of hedging
Operating income                                                           142.4           131.9        +8%        derivatives (-9.7M€)
                                                                                                                 – Interest expense related to the issue of two convertible bonds(1)(2)
Cost of debt                                                              (101.8)         (79.0)       +29%        (-10.7 M€)
Other financial income and expenses                                        (15.9)          (8.0)         x2      – Positive impact on interest expense of the refinancing of the Hornsdale
                                                                                                                   wind farms in Australia in 2020 (+3.3 M€) and a portfolio of French
Net financial result                                                      (117.7)         (87.0)        -35%       projects in H2 2019 (+5.5 M€)

Income tax                                                                 (21.4)         (23.7)        -10%    Other financial income and expenses
                                                                                                                 – Costs associated with the early repayment of the historical debt related
Net income from continuing operations                                       3.3             21.2        -84%       to the refinancing of the Hornsdale wind farms in 2020 (-4.9 M€)
Net income from discontinued operations                                       -            15.8         n/a      – Foreign exchange losses in 2020 reflecting the decreasing value of
                                                                                                                   current assets in Argentina (-8.5 M€)
Net income of the consolidated group                                         3.3           37.0         -91%     – In 2019, one-off penalties related to the refinancing of French assets
                                                                                                                   and discounting effects partly mitigated by positive impact of the
Net income Group share                                                       3.9           36.0         -89%
                                                                                                                   refinancing of a portfolio of Australian solar projects
o/w net income attributable to non-controlling interests                    (0.5)           1.0         n/a
                                                                                                                Effective tax rate of 86.6% vs 52.8% in FY 2019

(1) The effective interest rate of the debt component of these convertible bonds stands at 4.27% and
    5.80% respectively
(2) Issued respectively in October 2019 and in June 2020                                                                                                                                 15
Current and deferred tax expenses

                                  2020     2019     Change
                                                             Current tax expenses, down 5% year-on-year
 Profit before tax                24.8     44.9     -45%      – Corporate tax expenses: -2.8 M€ year-on-year
 Income tax                       (21.4)   (23.7)    -10%     – Withholding tax expenses: +1.7 M€ year-on-year
                                                              – CVAE(1) tax expenses: +0.4 M€ year-on-year
 Current tax expenses             (14.5)   (15.3)    -5%

 Deferred tax expenses            (6.9)    (8.4)    -18%
                                                             Deferred tax, down 18% year-on-year
 Effective tax rate               86.6%    52.8%    +34 bp

(1)   France’s value added levy                                                                                  16
From theoritical tax rate to effective tax rate in 2020

                                                                                                                                                +2.8%       86.6%
                                                                                                                              +12.0%

                                                                                                         +18.8%

                                                                                        +6.9%

                                                                       +2.7%
                                                        +10.5%

                                   +4.9%
           28.0%

                                              Current tax                Permanent differences                     Deferred tax

                                              (1)
      Theoretical tax rate         CVAE tax          Withholding tax   IFRS 2     Non-deductible share   Non recognition of    Hyperinflation   Other   Effective tax rate
                                                                                      of interest of      losses carried        Argentina
                                                                                   convertible bonds          forward

(1)    France’s value added levy                                                                                                                                             17
Cash position at Group level at year-end 2020
                                         Change in total cash balance (M€)

                                                                                                                                    • Net cash flows from operating activities amounted to 222 M€ up 38M€ y-o-y
                                                                                                                                      reflecting notably
                     +222                                                                                                             – Increase in EBITDA (+54 M€ y-o-y)
                                                                                                                                      – Negative change in WCR (-11 M€ y-o-y) mainly due to receivable pending payments
                                                                                                                                      – Increase in tax paid (-8 M€ y-o-y)

      460                                               +267                                                                        • Net cash flows from investing activities reached -502 M€, driven by
                                                                                                     (1)
                                                                                             +12                        375           investments in new projects mainly
                                                                                                                                      – In Australia: HPRX (53 M€), Western Downs (37 M€), VBB (25 M€), Bulgana (17 M€)
                                                                            -75                                 -9
                                                                                                                                      – In Americas: Altiplano (61 M€), El Llano (48 M€) and Capella (23 M€)
                                                                                                                                      – In Europe: Mutkalampi (36 M€), Yllikkäla (13 M€), Hedet (11 M€), wind farms (73 M€)
                                                                                                                                        & solar projects (45 M€) in France
                                       -502
                                                           Net cash from financing activities                                       • Net cash flows from financing activities reached 204 M€ mainly reflecting net
                                                                       = 204 M€                                                       Increase in borrowings related to
Opening cash      Net cash from Net cash used in Net increase in       Interests paid        Other              FX   Closing cash     – Project financing raised with the construction of new assets
  balance           operating       investing     borrowings                                                           balance
 31.12.2019         activities      activities                                                                        31.12.2020
                                                                                                                                      – Issuance of a 170 M€ green convertible bond in June 2020 (143 M€ recognized as
                                                                                                                                        debt component)
                                                                                                                                      – Net impact of the refinancing of a portfolio of wind assets in Australia
                                375 M€(2) of cash available at 31 December 2020
                                       plus a 200 M€ undrawn syndicated loan

(1)   The other items mainly include the equity portion of the green convertible bond, net acquisition of treasury
      shares and dividends paid to minority shareholders
(2)   Cash and cash equivalents stood at 60.4 M€ at Neoen SA (vs 185.4 M€ in 2019)                                                                                                                                   18
Gross debt increasing with the construction of new assets
                                              Change in gross debt (M€)
                                                                                                                            • Net Increase in borrowings of 267 M€
                     +794           -528                                                                                      – Additional project financing raised with the construction of new assets
                                    +178                                                                                      – Issuance of a 170 M€ green convertible bond in June 2020 (143 M€
                    +433                                                                                                        recognized as debt component)
                                    -350            +58            +9            +30             +10     -39    2 749         – 11 M€ net impact of the refinancing of Hornsdale wind assets in Australia

                     +361          +11 M€ net impact
                                                                                                                            • Change in fair value of derivatives derived from decrease in market
     2 415                        from the refinancing                                                                        interest rates in FY 2020
                                  of a portfolio of wind
                                   assets in Australia
                                                                                                                            • Average cost of project finance debt: 3.4% (vs 3.7% at end-2019)
                                                                                                                              due to low interest-rates environment until year end and one refinancing
                                                                                                                              transaction

                                                                                                                            • Average Group cost of debt: 3.7% (vs 4.2% at-end 2019) due to
                                                                                                                              lower cost of project finance debt and the issue of a green convertible
                                                                                                                              bond in June 2020 at a nominal interest rate of 2.0%(1)

   31.12.2019        New         Repayment Change in fair        Accrued       IFRS 16           Other   FX    31.12.2020
                  borrowings                 value of            interest
                                            derivatives

                                 >80% non-recourse debt, with long tenor

(1) The effective interest rate of the debt component of this convertible bond stands at 5,80%                                                                                                       19
Financial discipline maintained
                                         Net debt (in M€)                               Average residual tenor of project finance debt(1) (in years)

                                                                                                                        18.0
                                                                             2 267                    15.1                                15.4
                                              +456 M€
                        1 811

                                                                                                      EUR               AUD               USD

                                                                                                                   16.3 years
                                                                                                     Weighted average residual tenor(2)
                                                                                                             (15.8 years at 31.12.2019)

                                                                                                        Gross debt by currency(3)
                      31.12.2019                                           31.12.2020

                                                                                                               USD
                                      Stable leverage                                                          19%
                        8.4x net debt / EBITDA at 31.12.2020
                                       (8.4x at 31.12.2019)                                                                               EUR
                                                                                                                                          50%

                                                                                                             AUD
                                                                                                             31%
                                                                                                                         Other
(1) Senior debt (excluding junior debt)                                                                                  0.3%
(2) For all the Group’s projects in operation as of December 31, 2020
(3) Excluding lease liabilities and minority interests. As of December 31, 2020                                                                        20
1. H1 2020 highlights

2. H1 2020 results

3. Outlook

4. Appendices

                        21
1.4 GW under construction across our three geographies

                                                                                                                                              EUROPE - AFRICA

                                                                                                                                         254 MW under construction

                                                                                                                        France
                                                                                                                    Solar(1) - 132 MWp
                                                                                                                    Wind(2) - 80 MW
                                                                                                                    CODs expected between
                                                                                                                    2021 and H1 2022
               AMERICAS                                                                                                                                                                         AUSTRALIA

 208 MWp under construction                                                                                                                                                          974 MW under construction

                                                                                                                                     Mozambique
                                                                                                                                Metoro - 41 MWp
       Argentina                                                                                                                                                                        Australia
                                                                                                                                COD expected in H2 2021
  Altiplano - 208 MWp                                                                                                                                                              Western Downs – 460 MWp
  COD expected in Q3 2021                                                                                                                                                          COD expected in Q4 2022

                                                                                                                                 Australia                                  Australia
                                                                                                                            Victorian Big Battery – 300 MW / 450 MWh   Bulgana - 214 MW
                                                                                                                            COD expected in Q4 2021                    (incl. 20 MW / 34 MWh of storage)
                                                                                                                                                                       COD expected in H2 2021
                                                                                                                                                                       100 MW already injecting into the grid
                                                                                                                                                                       (corresponding to 70% of the expected production)

 Notes: Capacity under construction at December 31st, 2020. Current best estimate of the timing for commissioning
 of assets under construction given the Covid-19 outbreak
(1) Arue 1,2, 3 (40 MWp), Mer (15 MWp), Réaup-Lisse (15 MWp), Bioule (13 MWp), Paulmy (12 MWp), Levroux (10 MWp),
    Morhange (9 MWp), CapVert (5 MWp), Sernhac (5 MWp), Badonviller (4 MWp), Savernat (4 MWp)
(2) Le Mont de Malan (29 MW), Saint-Sauvant (21 MW), Courcome (15 MW), Les Avaloirs (9 MW), Chemin Vert (7 MW)                                                                                                             22
2020 confirming Group’s sustainable growth profile

                                                                                                       • 769 MW of additional assets in operation in 2020
 • Significant progress on the delivery of projects
                                                                                                       • Launch of construction of close to 1 GW
   despite some localized delays
                                                                                                       • More than 1 GW in newly awarded projects

                                                                                                       • The 300 MW Victorian Big Battery, one of the world’s largest
 • Distinctive and innovative projects                                                                   batteries
                                                                                                       • A cross-border PPA for the Mutkalampi wind farm (126 MW)(1)
                                                                                                         in Finland with a consortium of four major Dutch groups

                                                                                                       • FY 2020 revenue: up 18 % year-on-year
 • Solid financial performance and
                                                                                                       • FY 2020 EBITDA: up 25% year-on-year
   2020 EBITDA target reached
                                                                                                       • Cash-flow from operations: up 20% year-on-year

 • At the forefront of sustainable finance with                                                        • A syndicated loan indexed to ESG criteria - 200 M€
   two successful green issues                                                                         • The first ever European green convertible bond - 170 M€

(1) Total capacity of 404 MW, of which 251 MW accounted in the awarded projects at end-December 2020                                                                    23
Our differentiated and integrated strategy
1. Batteries – A cornerstone of our competitive offer

2. Corporate PPAs – Innovating in a growing practice

3. Energy Management – Our key differentiator
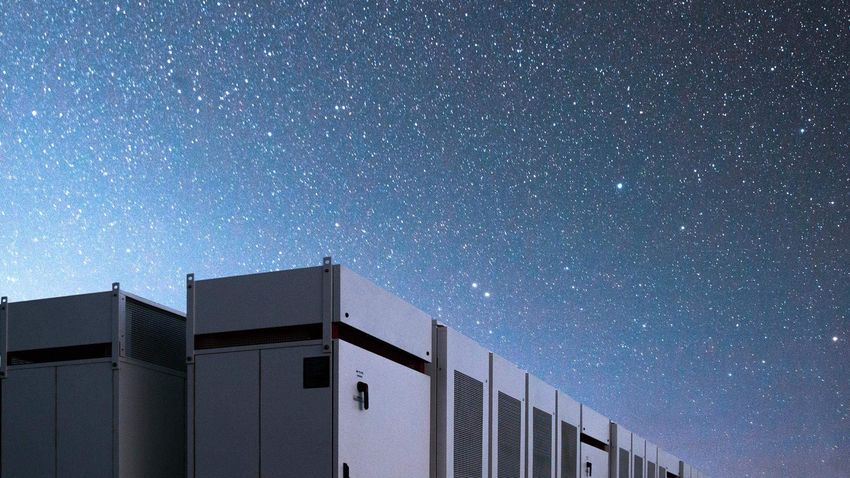
                                                        25
Batteries:
A cornerstone of our competitive offer
Neoen has chosen lithium-ion as its preferred technology

            Competitive advantages                           Key suppliers

1   Reliable           5   Benefitting from         An open architecture with a number
                           quickest cost                  of different suppliers
2   Easy to roll-out       reductions

3   Scalable           6   Available from several
                           different suppliers

4   Fast-response      7   Bankable

                                                                                         27
Two different models to connect storage assets

         Behind the meter                                                     Stand alone

• Integration within a solar or wind farm   • Direct connection to the grid
  as a single profit unit                   • Dedicated legal entity with its own P&L
• Electricity output sold on a blended      • Option to co-locate the battery with another Neoen project to share infrastructure
  basis                                       and benefit from cost synergies

Albireo Power Reserve within Capella        Yllikkälä Power Reserve in Finland           Hornsdale Power Reserve in Australia
solar farm in El Salvador                   (independent site)                           (co-located site)

                                                                                                                                   28
A successful global track record since 2015
EUROPE                                                             AUSTRALIA
 Yllikkälä Power Reserve     Azur Stockage                           Victorian Big Battery     Hornsdale Expansion (HPRx)

        Finland      2020       France       2018                          Victoria     2021          South Australia    2019

                                                                      Bulgana Storage           Hornsdale Power Reserve

AMERICAS
 Albireo Power Reserve
                                                                           Victoria     2017          South Australia    2017

                                                                                                       De Grussa

       El Salvador   2020

                                                                                                     Western Australia   2015

                     Neoen is a leading player in storage with 515 MW / 717 MWh capacity

                                                                                                                                29
Neoen fully owns landmark storage assets - 1
DeGrussa (2015)                                                  Hornsdale Power Reserve (2017)
Largest off-grid solar & storage project                         Largest lithium-ion battery worldwide

Behind the meter                                6 MW / 1.4 MWh   Stand alone (co-located)                100 MW / 129 MWh

Bulgana Storage (2017)                                           HPRx (2019)
Hybrid wind & storage project                                    Extension of the largest Australian battery project

Behind the meter                                20 MW / 34 MWh   Stand alone (co-located)                  50 MW / 65 MWh

Note: Statistics at the time of commissioning                                                                               30
Neoen fully owns landmark storage assets - 2
Azur Stockage (2018)                                           Yllikälä Power Reserve (2020)
Largest battery in France                                      Largest battery in the Nordics

Stand alone (co-located)                        6 MW / 6 MWh   Stand alone                          30 MW / 30 MWh

Albireo Power Reserve (2020)                                   Victorian Big Battery (2021)
First and largest battery in Central America                   Largest battery in Southern Hemisphere

Behind the meter                                3 MW / 2 MWh   Stand alone                  300 MW / 450 MWh

Note: Statistics at the time of commissioning                                                                        31
Dynamic combination of 3 economic models to increase
competitiveness

               Frequency                         Network                                Firming renewables
               support         +                 reliability               +            and arbitrage

          Stabilise the grid            Support the network through                 Smoothen the intermittency
             everyday                      exceptional events                            of renewables

Daily service fee auctioned        Long-term capacity contracts with the       Better prices obtained from off-takers
by the grid operator               network operator                            to reward more adequate power
                                                                               production profiles
    Albireo Power Reserve               Hornsdale Power Reserve
    Azur Stockage                       HPRx                                       Bulgana
    Yllikkälä Power Reserve             Victorian Big Battery                      De Grussa
    Hornsdale Power Reserve
    (merchant part)
    Victorian Big Battery
    (merchant part)

                                                                                                                        32
Neoen has been building valuable know-how in storage
    Competitiveness increased by significant operational expertise accumulated over the last 5 years

    Operations Control Centre since 2017

    Providing 24/7 asset monitoring

    Real time optimization of Neoen’s assets
    in Australia

    Unique experience in dispatching batteries on
    the Australian grid: more than 4,600 bids per day

                                                                                                       33
Neoen is building one of the world’s largest batteries
                                       Victorian Big Battery

Large project with combined model:
• Nov-20: Neoen won a Victorian Government tender for 250 MW capacity contracted for
  11 years with the Victorian state grid, allowing to optimize the interconnector between
  Victoria and New South Wales
• Additional 50 MW will be dedicated to frequency support and firming

Bankable:
• Feb-21: attractive financing secured from the Clean Energy Finance Corporation (CEFC)
  for 160 MAUD senior debt facility

Fast to roll out:
• Short lead time of 2 years from beginning of development
  (Q4 2019) to COD (Q4 2021)
Long-term business model:
• Expected lifetime of 20 years with supplier performance guarantees

       300 MW / 450 MWh                  Q4 2021
                Total capacity           Expected COD                   Partners

                                                                                            34
Storage is an essential pillar of Neoen’s growth story

                     Future developments                                              … as well as in Europe
                     in Australia…                                                    and in the Americas

• Reinforce Neoen’s leading position in Australia with the       • Leverage Australian experience in Europe and the
  ambition to operate at least one large battery in each state     Americas
• Add value to our solar and wind projects                       • Offer innovative solutions for grid operators and off-takers
• Offer diversified services to counterparties                   • Be among the leaders in storage in the countries where we
                                                                   operate

                            Storage represents 10% of Neoen’s total capacity today
                            and this proportion is expected to remain in the future

                                                                                                                                  35
Corporate PPAs:
Innovating in a growing practice
The corporate PPA market is attractive and fast growing
 Global market of corporate PPAs (in GW)              Market growth is driven by the broadening profile of off-takers

                                                                                                   Examples    Required capacity

                                                                  • Retailers                                     >100 MW
                                                  Utilities
                                       22.9 GW

                              x9                                  • Power intensive companies
                                                 Very large       • Looking for cheaper power                     >100 MW
                                                   power            sources
           2.5 GW                                consumers

                                                                  • Multi-sector players for
                                                                    whom energy is a non-core
              2014                      2020                        activity

                                                  Medium          • Looking to reduce carbon
                 CAGR 2014-2020: +45%                               footprint and procure                        10-50 MW
                                                   power
                                                                    clean energy
                                                 consumers
                                                                  • Untapped opportunity for a
                                                                    sophisticated IPP like Neoen

Source: Bloomberg New Energy Finance                                                                                               37
1.3 GW of corporate PPAs contracted since 2015

    15
off-takers
   in 4
countries

             2015      2016   2017       2018            2019   2020

             Solar

Neoen’s
             Wind
 offer
             Storage

                                     Energy management

                                                                       38
Combining 5 PPAs to develop the largest wind farm in Finland
     Mutkalampi 404 MW wind project in Finland

 Optionality to further contract post COD

 Signed Dec-2020

 Signed Sept-2019

        125 MW                       126 MW   153 MW

    The ability to gradually aggregate several corporate PPAs enabled us to secure a large project
     and achieve economies of scale in a country that does not offer single contracts of that size

                                                                                                     39
The ability to sign cross-border contract is a game-changer
                    Mutkalampi                                               Finnish grid

                                                 €/kWh                                             Sophisticated arrangement to offer PPA access to
                                                                                                   companies seeking lower unitary volumes
                                                  2

      1                              5                                                             Innovative solutions, through volume transfer
     PPA                        GOO
                                                                                                   between off-takers

                   3
           Settlement
              transfer                                                                             Flexibility to adapt to each off-taker’s risk
              (€/kWh)                                                                              requirements within a unique contractual framework
                                                             4
                                                  Utility supplier                                                consortium

                                                                                                                                             Advised by
                                                         0   1   1   1   1

                         Off-taker       €/kWh                                        Local grid

Source: EPA                                                                                                                                               40
Our corporate PPA strategy is driving our competitiveness

       Trigger demand for green corporate                       Aggregate PPAs from several
   1                                                                     mid-sized off-takers
                                                                                                2
       PPAs (including cross-border)
                                                1

                                                        2

       Offer competitive
   5   electricity prices
                                            5

                                                                  Develop a larger project to
                                                            3           serve the off-takers
                                                                          from a single site,   3
       Secure attractive financing
                                                    4
                                                                            hence achieving
   4   terms (leveraging higher
                                                                        economies of scale
       contracted volumes and diversified
       counterparty risk)

                                                                                                    41
Neoen’s strong competitive advantages for corporate PPAs

   Competitiveness             Long-term               Sophistication                Excellence
                            reliable partner                                          in C.S.R.

• Exploit highest       • Develop-to-own strategy   • Expertise in storage,   • Close relationships
  wind/solar resource                                 customised contracts      with communities
  potential             • Extensive experience
                                                      and energy management
                          reducing execution risk                             • Global excellence in
• Develop large scale                                                           Corporate Social
  projects                                                                      Responsibility

                         Ideal combination to address off-takers’ needs

                                                                                                       42
Energy Management:
Our key differentiator
More capabilities are now required to grow in today’s
increasingly complex markets

         Larger, more cost-                   An evolving demand                     Power networks
         efficient projects                   from corporates                        under stress

Combination of several PPAs and     Increasing pool of clients requiring   Less stable grids requesting
some merchant exposure in one       more tailored solutions                multiple services to integrate more
single project                                                             renewable energy

                    This will play to the strength of a sophisticated IPP like Neoen

                                                                                                                 44
Competitive leadership thanks to energy management
                  Energy management team fulfills 3 interdependent missions to create value

                                       1   Asset optimisation with real time decision-making on electricity markets

    Neoen’s
    growing
     energy                            2   Risk management and hedging of merchant position
   management
    platform
                                           Tailored solutions to grid operators and off-takers, integrating wind, solar,
                                       3
                                           storage and trading in innovative offers

Neoen’s ambition is to become the best-in-class IPP thanks to its differentiated and integrated strategy

                                                                                                                           45
Sustainability - Taking the next step
Neoen is dedicated to the energy transition…

  4,396 GWh                4,1 GW        +745 MW               15 Countries      ≥ 5 GW
Clean competitive energy    Installed   Installed capacities     International     Target
   produced in 2020         capacity           in 2020               player       for 2021

                                                                                             47
… and is advancing global development goals

    Delivering clean energy to reduce emissions           Promoting access to affordable energy
    Neoen develops, owns and operates large-scale         Neoen’s wind and solar projects deliver
    wind, solar and battery storage projects around the   competitively priced energy, exerting downward
    world, helping to accelerate the pace of transition   pressure on electricity prices

                                                                                                           48
But sustainability is not new to us

                                                                                                                               200 M€
                                                                                                                         syndicated loan linked
                                                                                                                         to ESG criteria – 2020

                                                                                                                               170 M€
                                                                                                                        first ever European Green
                                                                                                                         Convertible Bond – 2020

Community fund                                             Agrisolar         Art & sponsorship   Gender index 92/100   Green finance

                                                                       ...as recognized by Vigeo Eiris

                                                                                  TOP 4%1

(1) Neoen has been ranked in the Top 4% among the companies assessed                                                                                49
Now we want to take it the next level

                          +

                                        50
Our framework is anchored by 3 foundational pillars

         Our people               Our projects            Our communities

 Working together to speed up   Driving excellence   Participating in the transition
        the transition           in sustainability               with us

                                                                                       51
Our people: working together to speed up the transition

Working Ethically                                                                                          Encouraging Diversity                           Reducing Emissions
Respect and protect our core value of                                                                      Respect for the principles of fairness,         Respect for the planet and the environment,
integrity at all levels of the company                                                                     inclusion and non-discrimination, encouraging   monitoring and mitigating our carbon footprint
                                                                                                           gender balance

                                        ACTIONS                                                                              ACTIONS                                          ACTIONS

• 100% of our employees formally commit to                                                                 • Exceed industry benchmark of 32% women        • Calculate our global carbon footprint
  Neoen’s Code of Conduct                                                                                    working at Neoen, in each of our regions        (including scope 1, 2, 3)

• 100% of our employees formally commit to                                                                 • Increase annually the percentage of           • Support roll-out of at least one additional
  Neoen's Anti Corruption code and are                                                                       management positions held by women              “Greener Neoen1” initiative each year: in
  trained in the fight against corruption                                                                                                                    2021, 100% offset of the company’s travel
                                                                                                                                                             emissions

(1) “Greener Neoen” is a spontaneous internal think tank which objective is to drive Neoen to go “above and beyond” on the
aspects of our business that relate to emissions reductions and the environment                                                                                                                             52
Our projects: driving excellence in sustainability

Prioritising Safety                              Protecting Biodiversity                            Integrating Recycling
Maintaining a robust health and safety culture   Monitoring, limiting and mitigating our            Planning for future decommissioning of plants
for our employees, contractors and               environmental and biodiversity impact across       and recycling of all materials
subcontractors                                   the project lifecycle

                   ACTIONS                                          ACTIONS                                             ACTIONS

• Collate & report frequency and severity of     • Conduct environmental impact assessment          • Identify recycling channels for all our
  accident and incident rates of our               by expert ecologists on 100% of sites during       activities
  contractors                                      development
                                                                                                    • Integrate a recycling commitment clause into
• Conduct HSE compliance audit on 100%           • Offset any unavoidable environmental               all new supply agreements, in countries with
  of construction sites, monthly on sites > 20     impact in accordance with local                    a mature recycling industry
  MW in size, every 2 months on smaller sites      requirements, with each project selecting
                                                   one 'above and beyond' biodiversity initiative
                                                                                                                                                     53
Our communities: participating in the transition with us

Consulting & Engaging                                                                                          Economic Development                           Benefit-Sharing
Developing genuine, open and ongoing                                                                           Delivering local and regional economic         Tailoring community benefit-sharing initiatives
relationships with local communities and                                                                       development through employment, supply         with and for the local community
stakeholders                                                                                                   chain outcomes and skills development

                                          ACTIONS                                                                                                  ACTIONS                       ACTIONS

• Conduct community consultation and                                                                           • Engage with local business and employment    • Develop a benefit-sharing initiative for each
  information-sharing on all projects during                                                                     networks, prioritising local suppliers and     new project over 50 MW
  development, even if not mandated                                                                              jobseekers where possible
                                                                                                                                                              • Create an artwork that celebrates the
• Develop a Community Engagement                                                      Plan1                    • Local Participation                Plan2
                                                                                                                                         developed for          encounter between renewable energy
  for 100% of our new projects over 50 MW                                                                        projects over 100 MW in scale                  and local culture for each new project over
  in scale                                                                                                                                                      50 MW in size
(1) Community Engagement Plan is a comprehensive internal tool which guides and maps our consultation and engagement across a
project’s lifecycle from early stages of assessing feasibility through until decommissioning | (2) Local Participation Plan is a sister document
to the Community Engagement Plan which identifies and maps potential local and regional economic outcomes such as job creation, supply
chain opportunities, apprenticeships and training.                                                                                                                                                              54
Sustainability is in our DNA !

          Our               Our         Our
         People           Projects   Communities

                                                   55
2025 Roadmap
1. Growth journey since IPO

2. Neoen today

3. Renewable energy market outlook

4. 2025 targets and strategy

5. Investment envelope and criteria

6. Approach to leverage

7. Source of funds

8. Short-term and medium-term outlook

                                        57
We have a very strong track record of growth
     Assets in operation and under construction(1) (in GW)                                     Revenue(1) (in M€)

                                                   CAGR 2016-2020                                     CAGR 2016-2020
                                                           + 46%                                         + 44%
                                                                                 4.1                                      299
                                                                                                                   253
                                                                          3.0                              207
                                                                   2.2
                                             1.5                                               132
                         0.9                                                             70

                        2016                2017                   2018   2019   2020   2016   2017        2018    2019   2020

                                Secured portfolio(1) (2) (in GW)                                EBITDA(1) (in M€)

                                                   CAGR 2016-2020                                     CAGR 2016-2020
                                                           + 36%                  5.2                    + 51%
                                                                                                                          270
                                                                           4.1
                                                                                                                   216
                                                                    3.1
                                              2.8                                                          167

                          1.4                                                                  102
                                                                                        52

                         2016                2017                  2018   2019   2020   2016   2017        2018    2019   2020

(1) Restated for the biomass business sold in September 2019
(2) Assets in operation, under construction and projects awarded                                                                 58
We have a balanced, high-quality portfolio
                Technology breakdown                                                                   Geographic breakdown                       Contracted vs merchant breakdown(4)

                                                                                                                      8%                                         4%
  At IPO

                  45%              1.8 GW (1)(2)              55%                                      39%           1.8 GW (1)(2)    53%                    1.8 GW (1)(2)        96%

                                13%                                                                                                                       12%
                                                                                                         22%
  2020

           24%                     4.1 GW(3)                         63%                                             4.1 GW(3)              47%                 4.1 GW(3)           88%

                                                                                                    31%

                           Solar       Wind       Storage                                             Australia      Europe-Africa   Americas             Under PPA    Merchant

(1) Capacity in operation or under construction as of June 30, 2018 | (2) Restated for biomass business sold in
September 2019 | (3) Capacity in operation or under construction as of December 31, 2020 | (4) Weighted average by
MW for assets in operation or projects under construction as of December 31, 2020                                                                                                         59
Strong value creation for shareholders
                          Share price performance since IPO                                                        Strong increase in liquidity

                                                                                                                          2018      2019      2020    2021(1)

                                                                                47.8€
                                                                            at 09.03.2021   Daily volume Euronext        €1,6m      €0,8m     €4,5m   €12,6m

                                                                                            Market capitalization(2)     €1.6bn    €1.8bn    €3.3bn   €4.9bn
         IPO price: 16,5€

                                                                                            Floating capitalization(2)   €430m     €623m     €1,225m €1,805m

Source : Factset
                                 Neoen     SBF 120 (rebased)   Running average (3m)

                                                     Share price performance : x2.9                     since IPO

(1) At 9 March 2021 | (2) Yearly average                                                                                                                        60
Neoen today
We are a global, pure player in renewable energy
                                                                                                                                   EUROPE-AFRICA
                                                                                                                                   163 employees
    AMERICAS                                                                                                                       1 268 MW
                                                                                                                                   (in operation or under construction)
    37 employees
    878 MW                                                                                                                                Finland
    (in operation or under construction)

                                                                                                                                         Sweden
                               USA
                                                                                                                                         Ireland
                                  Mexico

                        El Salvador
                                                                                                                                          Croatia                                AUSTRALIA
                                                                                                                                          France                                 55 employees
                                Jamaica
                                                                                                                                                                                 1 905 MW
                                                                                                                                          Portugal                               (in operation or under construction)
                               Ecuador

                                                                                                                                          Zambia                                        Australia
                               Argentina
                                                                                                                                          Mozambique

     Countries with assets in operation and under construction

     Additional countries with projects in advanced development

                     15 countries                                         4.1 GW                             110 power plants(1)           255 employees                  12 GW total portfolio(2)
                                                            in operation or under construction
                                                                     >80% OCDE
(1) In operation or under construction
(2) Assets in operation, under construction and projects awarded, tender-ready and in advanced development                                                                                                              62
We have long-term, predictable and de-risked cash flows
                      Long-term visibility                                                                            Strong currencies                   Contracted revenues

                    c. 13.4 years                                                                                        USD                                  €6.2bn
              average remaining PPA duration(1)                                                                          17%                                 Contracted revenues(5)

                          3.1 years                                                                                                                                    vs
                                                                                                          AUD                             EUR
                          average asset age(2)                                                            43%                             40%
                                                                                                                                                                    €2.3bn
                                                                                                                                                                   Net debt(6)
          c. 50
          Years                                           25%
         land control(3)                               land owned(4)                                                                            • More than 80% of Neoen’s clients have
                                                                                                                    FY 2020 revenues              investment grade ratings(7)

(1) Weighted average residual PPA duration by MW in operation as of December 31, 2020 | (2) Weighted average age of
assets in operation as of December 31, 2020 | (3) Weighted average lease duration (by MW) for assets in operation and
projects under construction; residual duration of 45 years (4) Capacity installed on owned land (for projects in operation and
under construction as a % of total MW) | (5) Revenue contracted for the coming years, as of December 31, 2020 | (6) as of
December 31, 2020 | (7) Weighted average investment grade off-takers for projects in operation, under construction and
awarded                                                                                                                                                                                   63
Neoen ideally positioned in the sector

                                   1                              2                         3
                         High-quality and young      Sizeable and growing pipeline   A highly efficient
                         fleet of secured assets         to fuel future business       organization

         4                         5                              6                         7
  A clear disciplined           Distinctive               Extensive in-house          Best-in class
investment approach     multi-technology expertise      know-how coupled with          ESG profile
                         supported by pioneering      seasoned management and
                           storage integration         committed shareholders

                                                                                                          64
Renewable energy market outlook
Key market drivers of renewables expansion

    Sustained commitment from governments
    and off-takers to containing global warming

    Increasing competitiveness
    of renewable electricity generation

    Growing global energy consumption

    Growing electricity demand related to
    transport electrification and hydrogen
    development

    Large stimulus plan in OECD countries with
    global decarbonisation policies and need
    for energy sovereignty

                                                  66
Buoyant long-term growth prospects for renewables
                                                                      Evolution of global installed capacity

                                 2019                                                   2025E                                                2040E

                                                    1.2 TW                                                    2.3 TW                                         5.6 TW
                                                    16%                                                       26%                                            42%
                                                                                                                                       20%
                                                                                      19%         15%                                                  27%
                                         8%
                              20%              8%

                                                                                 5%                     11%                       4%
                         6%
                                 7.5 TW                                                 8.8 TW                                               13.4 TW

                                                                                                                                                       14%
                                         58%
                                                                                            50%                                        35%

                                                             Solar      Wind       Fossil Fuels                 Nuclear   Other

                                                                     Solar and Wind CAGR 2019-2025E: +          11.0%      Solar and Wind CAGR 2019-2040E: +   7.5%

Source: World Energy Outlook 2020, IEA                                                                                                                                67
Strong market dynamics in our regions
                               Australia                                                           Europe                                  Central and South America
                  (installed capacity in GW)                                              (installed capacity in GW)                             (installed capacity in GW)

                                                                                                                                457
                                                                                                                          422
                                                                  33                                                                                                             95
                                                                                                           356 370
                                                                                                                                                                                      75
                                                                                                   299
                                                                                             281
                                                     20                                                                                                           60
                                                                                                                                                                       54
                                                             17                    204
                                                                                                                                                     40 42
                                                                             147
                                11            11
                                                                                                                                           23
            7              7
      4                                                                                                                               11

       2019                2025                    2030      2040             2019             2025         2030           2040        2019           2025         2030          2040

                               Solar        Wind                                                   Solar   Wind                                          Solar   Wind

                CAGR 2019-2040E: +                    7.7%                               CAGR 2019-2040E: +        5.2%                         CAGR 2019-2040E: +     10.8%
                CAGR 2019-2040E: +                    7.9%                               CAGR 2019-2040E: +        3.9%                         CAGR 2019-2040E: +        5.8%
                                                                       (2)

Source: World Energy Outlook 2020, IEA & Baringa                                                                                                                                           68
2025 targets and strategy
We will double the pace of new projects awarded
                                                        NEW AMBITION

                                ACHIEVED                > 2 GW
     ANNOUNCED
                            IN 2019 AND 2020
                                                        per year
      AT THE IPO
                                                        by 2025 and
                              1 GW                      ONWARDS
      0.7 GW                 per year
      per year

                            x2 vs. 2020
                   x3 vs. target announced at the IPO
                                                                       70
Our existing platform will act as a springboard
       At least 80% of new projects awarded
              in existing countries….                    …drawing on

1   Develop more, larger-scale projects       Large and robust advanced pipeline

                                              Market leadership in selected countries
2   Broaden technology mix in each country

                                              Differentiation through storage and energy
                                              management
3   Seek governmental contracts + corporate
    PPAs + merchant
                                              Experimented local teams and strong
                                              reputation

                                                                                           71
New geographies will bring additional growth
                           Up to 20% of new projects awarded to come from new countries

                 Selective approach                                       Same proven criteria

• Expand in our three regions                             • Concentrate on markets at or below grid parity
• Apply framework of at least 80% of installed capacity   • Seek countries offering potential for Neoen to develop a
  in OECD countries                                         top tier position
• Focus particularly on some new European countries       • Give priority to long-term off-take contracts with solid
                                                            counterparties
                                                          • Sign PPAs denominated in reliable currencies
                                                          • Finance mainly with non-recourse debt with local or
                                                            international lenders on same currency as project PPA
                                                            revenues

                                                                                                                       72
We have proven our ability to replenish our pipeline
                                                            12 GW

                                          +4.3                    5.4               6.9 GW
                        7.7 GW              GW                                      of advanced pipeline
                                                                                    at end-2020

                            3.3                                   1.5

                                                                  1.1
                            1.2
                                                                  1.4
                            0.9                                                     5.2 GW secured
                            0.8                                                     at end-2020
                                                                  2.6
                            1.5

                         31.12.2018                          31.12.2020

     In operation   Under construction   Awarded   Tender ready           Advanced development

                                                                                                           73
We have a diversified pipeline
                                    Advanced pipeline (tender-ready and advanced development)

                                                                                                       Storage
             AMERICAS                                         EUROPE                                     6%

                                                                                                Wind
1,308 MWp         150 MW    51 MW                 1,817 MWp     655 MW     67 MW                34%         6.9 GW      Solar
                                                                                                                        61%

                                                                              AUSTRALIA

                                                                                                 Americas
                                                                    1,060 MWp 1,506 MW 260 MW      22%

                                                                                                                      Australia
                                                                                                                       41%
                                                                                                             6.9 GW

  Countries with projects                                                                         Europe
  in advanced development                                                                          37%

                                                                                                                                  74
“Develop-to-own” is Neoen’s core business model

                          • Provide a strong competitive edge in tenders

                          • Guarantee the quality and performance of our
                            assets over the long term

                          • Deliver value throughout the project life
                            cycle

                          • Control risk-return

                          • Secure land beyond industrial lifetime with a
                            view to repowering

                                                                            75
We are in a position to seize potential external growth

As in the past, Neoen will seek potential
opportunistic and value-creating acquisitions,
targeting for example:

         Distressed         Old assets with
      industrial assets   repowering potential
        and platforms

                                                          76
Discretionary farm-down will also bring short-term value

                      WHY?

• Very high growth in new projects awarded enables
  us to implement a farm-down policy
• Farm-down is an opportunity to realize short-term
  value creation alongside long-term value creation
  coming from develop-to-own
• Farm-down will allow us to contribute to the
  financing of our growth

   For each GW of newly awarded capacity, Neoen could sell up to 200 MW of projects or assets

                                                                                                77
We will more than double in size by 2025
           Consolidated capacity in operation or under construction post farm-down

                                                              > 10 GW
                                                             by the end of 2025

                                    ~2.5x

             4.1 GW

               2020                                                2025

                                                                                     78
Investment envelope and criteria
We will keep strict investment criteria
                                                  Methodology                                   Bid equity IRR criteria(2) depending on geographies

• IRRs and depreciation for solar and wind projects(1)
  calculated over 30 years vs 25 years previously in order                                                                                           Other
  to be aligned with the                                                                        OECD                   Europe        Australia       OECD
                                                                                                countries               7.5%           8.5%         6 to 10%
    – Industrial lifetime of assets                                                                                   (+/- 150 bp)   (+/- 150 bp)
    – Widely recognized market practice

• Indexation and Opex in line with contractual framework                                        Non-OECD                             > 10%
  and lenders’ assumptions                                                                      countries                            > 10 %

• Merchant price assumptions based on a range
  of independent experts’ forecasts                                                          Tailored IRR approach on each project taking into account
• Production estimates at P50 using independent experts’                                     • Country risk profile
  assessments                                                                                • Off-taker profile
• No commercial terminal value                                                               • Merchant exposure

(1) Bid IRRs and depreciation for Storage remaining at 15/20 years depending on technology
(2) Not assuming any IRR uplift from potential subsequent farm-downs                                                                                           80
We have proven our ability to achieve growth and value creation

Loirecopark, France, February 2021                                 Goyder, Australia, September 2020

                   39 MWp           Q4 2022                                         100 MW                Q2 2022
                 PPA capacity     Expected COD                                    PPA capacity      Start of construction

• We have fully developed the project in a country where permits   • We optimized a gigawatt-scale project drawing on world class wind
  are scarce                                                         resources
• We bid with a large project by French standards, taking          • We went beyond the base requirements of the tender process by
  advantage of economies of scale in project financing               including a battery storage facility to meet the needs of the Australian
• We are rehabilitating former military land                         Capital Territory (ACT)
                                                                   • We benefit from a strong track record in terms of delivery that had a
                                                                     high value for the off-taker

                                                                                                                                        81
We have a disciplined procurement strategy

• Selection of the EPC on a project-by-project
  basis
• Focus on top-tier EPC contractors with strong
  guarantees and top-tier components
• General policy: full-turnkey contract with
  protective terms

• Strong HSE requirements

              Selected EPC contractors

                                                  82
Competitiveness of solar and wind will continue to improve
                   Capex by technology(1) (in k€ / MW)                                                                    It’s not just about capex….

                                                                ~ 1 000                    ~ 965
                                                                                                            • Cost of wind energy will continue to decrease driven
                                                                                                              by further technological improvements :
       ~ 500                                                                                                   – Larger-capacity turbines
                               ~ 425                                                                           – Increased hub heights and larger rotor diameters
                                                                                                               – Optimized power electronics (power inverters reliability
                                                                                                                 and dimensions)

        2021e                   2025e                              2021e                    2025e           • These advancements in technology would
                                                                                                               – Improve yields for the same location
                                                                                                               – Reduce installation as well as O&M costs per unit of
                                                                                                                 installed capacity
                      Solar                                                     Wind

(1) Average capex for new awarded projects including interconnection costs but excluding development fees                                                               83
Approach to leverage
Our leverage approach

                              Neoen SA

                                                                                        • 170 M€ first European green convertible bond – Maturity: 2025

                     Corporate financing                                                • 200 M€ syndicated loan linked to ESG criteria – Maturity: 2024
                                                                                        • 200 M€ convertible bond – Maturity: 2024

       Non-recourse debt at project level(1)                                              Project finance debt gearing at 31.12.20202          Cost of project finance debt at 31.12.2020

                                                                                                      80%               78%                                                    6.5%
                                                                                                                                    71%

   Project              Project              Project               Project                                                                                       3.9%
     1                    2                    3                      x                                                                              1.8%

                                                                                                      EUR               AUD         USD               EUR         AUD          USD

                                                                                                                   78% on average                           3.4% on average

                                                        Leverage (all debt(3) / invested capital): not less than 70% by 2025
                                                            Net debt / EBITDA ratio: between ~8x and ~10x in 2025

(1) Mezzanine could be complementary to project finance at project level | (2) Weighted average ratio of project
debt to investment expenditure for the project's development and construction, for all the Group's projects in
operation as of December 31, 2020 | (3) Whether corporate or associated with project financing                                                                                              85
Structuring project finance at competitive terms
             Strong relationships with financial institutions                                                                         Optimized financing structure

                                                                                                                                                                • Non-recourse repayment schedule –
                                                                                                                                                                  sized on cash flows over time
              OECD markets                                          Non-OECD markets                                                                            • PPA lifetime (with or without a tail) or
                                                                                                                                                                  negative tail (i.e. merchant
                                                                                                                                                                  exposure)
                                                                                                                                                    Debt
                                                                                                                                                                • Debt Coverage Service Ratio sizing
                                                                                                                                Potential
                                                                                                                                                  50% - 90%       criteria
                                                                                                                      Equity    increase of                     • Same currency as the PPA or
                                                                                                                                leverage                          indexed on same currency
                                                                                                                    10% - 50%   ratio through                   • Variable interest rates largely
                                                                                                                                refinancing                       swapped into fixed rates

• Competitive terms and accelerated processes thanks to                                                                            Long-term project finance debt(1)
   – Strong long-term alignment with lenders
                                                                                                                                                        18.0
   – Existing strong relationships                                                                                                       15.1                            15.4
   – Larger projects and portfolio effect
   – Neoen’s reputation, credibility and expertise

• Optimized due diligence and documentation process
  thanks to recurring business and repeat deals
                                                                                                                                        EUR             AUD              USD
                                                                                                                                                16.3 years on average

(1) Average remaining maturity of the financing for all the Group's projects in operation as of December 31, 2020                                                                                            86
Source of funds
Investments and source of funds

             c.€5.3bn

                                                     •    Project financing and refinancing

                                                     •    Refinancing of corporate debt

                                                     •    Cash flow from operations

                                                     •    Farm-downs

                                                                 Up to €1.2bn

     Total investments 2021-2025   Source of funds                 New equity
                                                            Highly flexible, as assumes
                                                         100% ownership of the next 5 GW

                                                                                              88
Short-term and medium-term outlook
2021 guidance and medium-term outlook
                                                                                  2021                                      2022                   2023-2024-2025

                                                               More than 5 GW of capacity                                                      More than 10 GW of capacity
                                                                                                                 5 GW of capacity (1) fully
                                                                  in operation or under                                                           in operation or under
              Capacity                                                                                           operational by the end of
                                                               construction(1) by the end of                                                          construction(1)
                                                                                                                           2022
                                                                           2021                                                                    by the end of 2025

                                                           Between 295 M€ and 325 M€(2)                         At least 20% annual growth
              EBITDA                                                                                                                           Double-digit annual growth
                                                             EBITDA margin around 80%                                     vs. 2021

             Dividend policy                                                                                       First dividend to be paid           Progressive
                                                                                                                                                      dividend policy

(1) Consolidated capacity post Farm-Downs | (2) Including capital gains from Farm Down (will not exceed 20%
of 2021 EBITDA) but excluding the impact of IFRS 2 according to new EBITDA definition. It takes into account
the best estimate to date of the timetable for the commissioning of power plants currently under construction                                                                90
91
Thank you for attention

ARGENTINA   AUSTRALIA   CROATIA   ECUADOR   EL SALVADOR   FINLAND   FRANCE   IRELAND   JAMAICA   MEXICO   MOZAMBIQUE   PORTUGAL   SWEDEN   USA   ZAMBIA
You can also read