Hot Spots for Renewable Heat - Decarbonizing Low- to Medium-Temperature Industrial Heat Across the G-20 - Bloomberg Professional ...
←
→
Page content transcription
If your browser does not render page correctly, please read the page content below

Hot Spots for
Renewable Heat
Decarbonizing Low- to Medium-Temperature
Industrial Heat Across the G-20

September 13, 2021

About this report About WBCSD The World Business Council on Sustainable Development (WBCSD) is a global, CEO-led organization of over 200 leading businesses working together to accelerate the transition to a sustainable world. Our member companies come from all business sectors and all major economies, representing a combined revenue of more than $8.5 trillion and 19 million employees. Together, we are the leading voice of business for sustainability: united by our vision of a world where more than 9 billion people are all living well, within planetary boundaries, by 2050. Our Climate & Energy program is designed to advance ambitious climate strategies and leverage the collective power of our members to accelerate climate recovery. We work to support and accelerate our members' plans to reduce and remove Greenhouse Gases (GHGs) and to develop resilient business models that can adapt to and maximize the opportunities from the low-carbon transition. We work across sectors and value chains, to integrate ambitious climate strategies, advance taxonomy and disclosure standards, advocate for policy intervention, and develop innovative solutions. About BloombergNEF BloombergNEF (BNEF) is a strategic research provider covering global commodity markets and the disruptive technologies driving the transition to a low- carbon economy. Our expert coverage assesses pathways for the power, transport, industry, buildings and agriculture sectors to adapt to the energy transition. BNEF's heating and cooling team focuses specifically on the challenges and opportunities faced by corporations, governments and households as they look to transition to low-carbon sources of heat. Our global coverage looks across all the different technologies, policies and costs. We put this research within the wider context of decarbonization to understand and identify impacts on other sectors. WBCSD and BloombergNEF Collaboration This report is intended to provide guidance on the markets that are particularly attractive for renewable heat solutions. It also explores the applicability of specific technology solutions. This report is co-produced with BloombergNEF, a WBCSD member whose proprietary data, insights and guidance have been instrumental in producing this analysis. 1

Executive Summary
The transition to low-carbon energy is well underway within the electricity Most favorable G-20 countries for low- to medium-
sector, yet little progress has been made in decarbonizing industrial heat. temperature industrial heat decarbonization
This will be the next challenge for corporations on their path to net-zero. G-20 ranking and size of low- to medium-temperature demand
This report seeks to point industrial end-users towards markets with the
best conditions to support the transition, as they begin to deploy
renewable heat.
● Heat is essential to most industrial processes. It is the energy input that
    triggers the chemical reactions to make medicine and cleaning products.
                                                                                                                                                          Tier 1
    It is needed to transform metal ore into steel and, eventually, consumer
                                                                                                                                                          Tier 2
    goods like cars. It is used to pasteurize milk, brew beer and dry paper.
    Most of this heat is generated using fossil fuels like coal, gas and oil.                                                                             Tier 3
                                                                                                                                                          Tier 4
● Several renewable heat technologies are commercially available today to
                                                                                                                                                          Size of low- to
    replace fossil fuels. These include industrial-scale heat pumps, electric                                                                             medium-
    boilers, solar thermal, geothermal and bioenergy. However, fossil fuel                                                                                temperature heat
    combustion is cost-competitive in most markets and has held back the                                                                                  demand (this size =
                                                                                                                                                          300TWh)
    uptake of renewable heat technologies.
● This report examines the ease of deploying renewable heat technologies
    in the Group of 20 (G-20) member countries, based on the presence of
    supportive policies, resource availability, and current economic                Proportion of low- to medium-temperature heat demand
    conditions. It specifically focuses on low- to medium-temperature heat                    Tier 4, 8%
    (
Decarbonizing low- to medium-temperature industrial heat: the opportunity   6

    Results of the G-20 ranking                                                 13

    Renewable heat technology profiles                                          19

    Methodology                                                                 25

3
Part 1
Decarbonizing low- to medium-temperature
industrial heat: the opportunity

4

Industrial heat accounts for 29% of global
energy demand
Process heat in industry accounts for a third of global final energy demand today and demand is expected to keep growing to 2050.
● Within total industrial energy use, process heat accounts for the vast majority in most industries (around 80%), while the remainder is used for electrical
    processes (such as cooling and powering motors) and non-process operations (including lighting).
● Process heat refers to energy input as part of thermal manufacturing processes, including material transformations and chemical processes. Process
    heat is used to manufacture many consumer products, such as paper, chemicals and food and beverages.
Industrial sites rely overwhelmingly on fossil fuels to generate process heat.
● Coal is the dominant fuel for industrial heat, making up over a third of all energy supplied for process heat in 2018. Coal, gas and oil account for 75% of
    total fuel supplied to process heat, but this share varies across different industrial sectors and countries.
● Less than 10% of global process heat is generated directly from renewable sources, primarily biomass and waste, which is concentrated in specific
    geographies and industries. This makes it difficult to scale production sustainably.
  Industrial heat use relative to global final energy                                                           Global industrial heat production by fuel source, 2018
  consumption, 2018                                                                                                                            Renewables,             Electricity,
                                          Other, 2%        Industry (non-process                                                                   9%                     10%
                                                                 heat), 6%                                                                                                          Other
       Transport,                                                                                                                                                                (purchased
          33%                                                                                                                                                                    steam), 6%

                                                                     Industry                                                             Gas, 23%
                                                                  (process heat),
                                                                       29%
                                                                                                                                          Oil, 11%
                               Residential and
                              commercial, 33%                                                                                                                 Coal, 41%

Source: IEA, BloombergNEF. Note: IEA balances include combustible fuels consumed by industrial end-users, which are almost entirely used to generate process heat. Electricity use for non-process heat was
assumed as 20% of total fuel use in low- to medium-temperature industries and was excluded. Coke ovens and blast furnaces are included in iron & steel, while fuels used as feedstock or in transformation
industries (eg, petrochemical refineries) are excluded.

5
Decarbonizing industrial heat is key to
achieving climate goals
Industrial process heating emitted 7.5 metric gigatons of carbon                           Status of net-zero emission targets
dioxide in 2016.                                                                           Share of global emissions
● This is equivalent to 15% of all greenhouse gas emissions, about the
                                                                                                              6%                                                  16%
    same as total emissions from the transportation sector.
                                                                                                                                                30%
Decarbonizing industrial heat will play a key role in achieving net-zero                                                 29%
targets.                                                                                     45%          Jan                                             Sept
● Some 70% of the G-20 countries have either set net-zero targets or                                     2021                                             2021
    they are under discussion.                                                                                                                                          32%

● More than 20% of the world’s 2,000 largest public companies,                                                     10%                             23%
                                                                                                           9%                                                   0.1%
    representing sales of nearly $14 trillion, have set net-zero targets as of
    March 2021.1
Introducing renewable solutions for industrial heat will be crucial.
● In many industries, heat represents a larger portion of demand than
    power. While many companies have deployed renewable electricity at                     G-20 countries net-zero emissions targets
    scale, most industrial heat is still provided by fossil fuels.
● Fuel switching from fossil fuels to renewable heat technologies is the
    focus of this report. But this is not the only pathway — energy
    efficiency and the circular economy will also play an important role in
    decarbonizing industrial heat.
G-20 countries are responsible for almost 80% of fuel use in industry.
● This report identifies the most attractive markets to decarbonize
    renewable heat across the G-20. The 19 individual country members
    of the G-20 represent the largest economies and emitters and as
    such, a significant opportunity to decarbonize.

                                                                                           Source: Governments, WRI CAIT, BloombergNEF. Note: Greenhouse-gas emissions including land use
1 According   to a report by The Energy & Climate Intelligence Unit and Oxford Net Zero.   and forestry covered by an EU national or state-level target.

6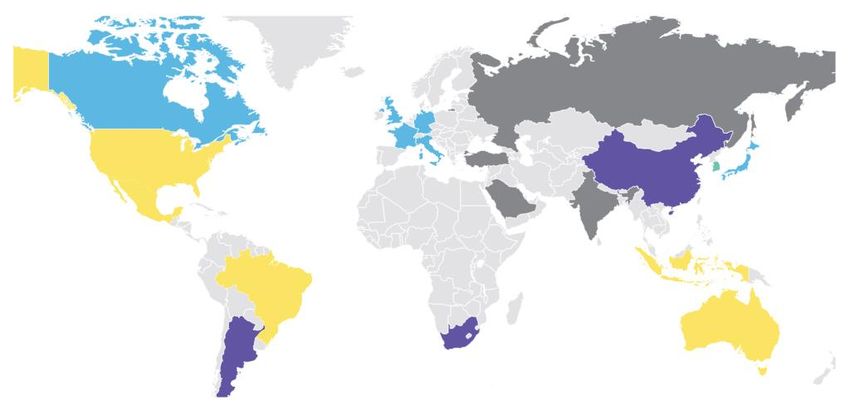
Significant investment will be needed to
transition industrial heat
 Decarbonizing industry comes with a significant price tag.
 ● Investment in low-carbon forms of industrial heat has lagged behind other sectors, such as the power sector. This leaves a large gap to fill. IRENA
     estimates around $3.7 trillion worth of investment will be needed to support the deployment of low-carbon fuel sources across all industrial
     processes by 2050. This would put industry on track to achieving their 1.5 degree scenario.
 ● Electrifying process heat has a significant role to play, with over half of all investment needed by 2050 focused on electrification.
 Supportive financial policies and regulation will be necessary.
 ● Renewable heat options often come with higher upfront cost and long payback periods. This has been a persistent barrier to uptake. Supportive
     policies and regulatory environments that lower investment hurdles, such as off-balance sheet financing mechanisms, will be key.

 Estimated cumulative investment needed in renewable                             Example net present cash flow for an unsubsidized industrial
 heat for industry by 2050                                                       heat pump in Germany
                                                                                                                  Euros
                                                                                                                  250,000                                         Gas boiler

                                                                                  Costs incurred Costs avoided
               Solar thermal,                                                                                     200,000                                         capex
                    23%                                                                                           150,000                                         Gas boiler
                                                                                                                  100,000                                         opex
                                                                                                                   50,000
        Geothermal,                                                                                                                                               Heat pump
                                                                                                                        0                                         opex
            2%                      $3.7 trillion                                                                 -50,000
                                                                                                                 -100,000                                         Heat pump
                                                                                                                 -150,000                                         capex
                                                          Electrification, 65%
          Biomass, 9%                                                                                            -200,000                                         Savings
                                                                                                                            0   2   4   6   8 10 12 14 16 18 20
                                                                                                                                             Years
                                                                                 Source: BloombergNEF, McKinsey&Company, Eurostat, IEA. Note: Illustrative only. Capacity of the
                                                                                 heat pump 217kW with a COP of 3.63. Natural gas boiler is assumed to be 85% efficient. The heat
Source: IRENA. Note: Estimated investment under IRENA’s Energy Transformation    pump and gas boiler are assumed to operate at 90% capacity annually. No discount rate has been
Scenario. Includes all industry.                                                 applied. Excludes costs related to unit maintenance.

7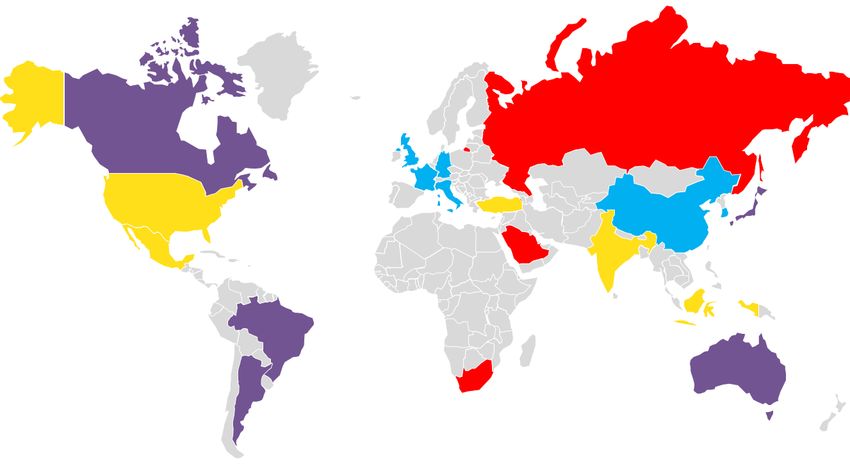
Not all heat is equal: temperature
 matters
 Industrial processes are diverse and temperature requirements vary significantly by industry and process.

 ● Industrial process temperatures range between 50°C to 2,000°C (120-3,600°F) and can be grouped into three bands: low (400°C). About half of global industrial heat is high-temperature and half is below 400°C (752 °F).
 ● Industries like steel and cement rely heavily on high-temperature heat. The industries that dominate low- and medium-temperature industrial heat
     demand include chemicals (including detergents and pharmaceuticals), food and beverage, pulp and paper and machinery.
 ● Even within these industries, the processes that rely on low-temperature heat are diverse. They range from drying processes (present in everything
     from chemicals to wood to paper), to baking and pasteurizing, to distilling, bleaching, dyeing and boiling.
 ● Low- to medium-temperature processes are often separate from the source of heat generation, meaning the technologies used to produce heat can
     more readily be swapped as they are not involved in the process directly. There are many commercially available low-carbon technologies, especially
     for temperatures below 400°C; for more see slide 9.

    Global industrial heat demand by temperature, 2018                            Demand for low- to medium-temperature heat in selected
                                                                                  industries globally, 2018
                                                                                   TWh
                                                                                             Chemical and petrochemical                                                          2,840
                                                  Low (400°C)
                                                                                                         Textile and leather                     693
                                  22%                                                                 Transport equipment                        610
                                                                                                Wood and wood products                     276
                                                                                  Source: IEA. Note: Demand for low- to medium-temperature heat in energy-intensive industry is
                                                                                  excluded since it represents a small portion of the total and is usually available as a by-product of
Source: IRENA, IEA                                                                high-temperature heat.

8
Low-carbon technology solutions do exist
It is possible to decarbonize low- to medium-temperature heat with technologies that are commercially available today.
● This report focuses on industrial-scale heat pumps, solar thermal, geothermal, various forms of bioenergy and direct electrification technologies. These
    technologies are commercially available to be deployed today but face specific barriers and opportunities. For more, see part three.
● There are fewer options available today to decarbonize high-temperature heat with renewable technologies. While green hydrogen and syngas could be
    used for low- to medium-temperature heat, we expect their initial deployment will primarily focus on high-temperature heat applications. They are
    therefore outside the scope of this report.

Heating technologies and fuels by maximum output temperature
                                                                                                                                          Temperature (Celsius)
                                                       0                  200                  400                  600                  800            1,000

                                       Heat pumps
                    Solar thermal: non-concentrated
                        Solar thermal: concentrated
                                  Deep geothermal
       Low-carbon

                                Shallow geothermal
                                           Biomass
                                             Biogas
                                       Biomethane                                                                                                                 These technologies are in
                                                                                                                                                                  various stages of
                                         Electricity
                                                                                                                                                                  development.
                                         Hydrogen
                                                                                                                                                                  Electric systems are the
                                            Syngas                                                                                                                most commercialized, but
                                        Natural gas                                                                                                               can replace combustion-
    Fossil-
    based

                                                                                                                                                                  based technologies only
                                                 Oil
                                                                                                                                                                  for specific products and
                                               Coal                                                                                                               specific processes.
                                                           Low                Medium                             High

Source: Oxford Energy Institute, BloombergNEF, EHPA, IEA-SHC. Note: Shaded technologies/fuels were not included in the scope of this analysis.

9
Low- to medium-temperature heat
processes are concentrated in G-20
Around 80% of global low- to medium- temperature industrial heat use is concentrated in the G-20.
● China has driven industrial heat use and continues to dominate global demand. In general, India and China have seen strong growth in process heating,
a trajectory that is expected to continue due to increased manufacturing output.
● Conversely, the U.S., EU and Japan have experienced a steady decline in process heat use. Despite this decline, their share of low- to medium-heat
use remains large because of existing manufacturing facilities.
Heat requirements in G-20 countries vary based on industry presence.
● Low- to medium-temperature heat makes up over half (58%) of total G-20 industrial heat demand on average. This is driven largely by the U.K., U.S.,
France, Mexico, Argentina, Canada and Brazil. In these markets, over 60% of industrial heat needs require temperatures below 400°C.
● While China has a lower portion of demand for low- to medium-temperature heat (40%), its high absolute demand means that it still represents the
largest opportunity for decarbonization.
Demand for low- to medium-temperature heat Industry heat needs across the G-20 by temperature range, 2018
by country, 2018 Percent
Percent 100%
80%
Rest of the China 60%
world 29%
21% 40%
20%
Rest of the G-20
0%
20% U.S.
U.K.
Mexico
Italy
Russia
Australia
France
Germany
Argentina
Brazil
Canada
U.S.
South Africa
South Korea
Saudi Arabia
Indonesia
India
Japan
Turkey
China
13%
Japan
3% Brazil India
Russia
3% 7% High (>400° C) Medium (150-400° C) Low (Part 2 Results of the G-20 ranking 11
Ranking methodology
This report ranks the G-20 countries on their ease for deploying renewable technologies for low- to medium-temperature industrial heat. The ranking is
based on three main areas of consideration: market conditions, policy and resource availability and climatic conditions.

 Methodology                                                       Coverage

  Market conditions
  Energy prices, fossil fuel industry
  presence and renewable technology
  deployment

     Policy
     Environmental standards, grants
     and incentives and carbon pricing
     schemes

                                                                          19 individual G-20
                                                                          member countries
     Resource availability & climatic
     conditions
     Technology potential and power
     grid coverage and reliability

To see all the variables we considered and the Methodology, visit the Appendix.

Note: The G-20 includes 19 individual countries and the EU. While we did not include every EU country in the analysis, the three individual countries in the EU (Italy, France, Germany) are
broadly representative of bloc-level policy.

12
Six countries claimed the top spot for renewable heat China, France, Germany, Italy, South Korea and the U.K. rank in the G-20 country scores top tier for deployment of renewable heat. ● The top performers represent the best markets for industrial players looking to transition to renewable heat. ● Countries that scored highly had favorable market conditions (such as low power-to-gas price ratios) and relatively mature markets for renewable heat solutions (indicating a ready presence of installers and maintenance providers). This cohort of countries is also set apart by the strong presence of favorable policies, including prices on carbon. The second tier includes Argentina, Australia, Brazil, Canada and Japan. ● Second tier markets offered favorable – but more challenging – environments for renewable thermal solutions. ● These countries tended to score well in one area, while lagging in others. For instance, they often had historical deployment of renewable heat solutions, but less robust policy and less Tier 1 Tier 2 Tier 3 Tier 4 competitive energy pricing for renewable heat. Source: BloombergNEF. The third tier includes India, Indonesia, Mexico, Turkey and the U.S. ● The third tier has limited or no favorable policies which was especially true for the U.S. and Indonesia. Without a clear direction of travel, industrials are less likely to adopt renewable heat technologies. ● Market conditions also tend to be worse in these countries compared to higher tiers. The bottom tier consists of Russia, South Africa and Saudi Arabia. ● Countries in the fourth tier scored poorly in all categories. ● They featured very challenging market conditions. These countries all have a significant fossil fuel presence as well as cheap natural gas, coal and oil. Low-scoring countries also tended to have less electricity grid access, or grids with low renewable power penetration. 13
The top tier markets make up almost half
 of G-20 heat demand
Large opportunities exist across all G-20 countries.
● Countries in tier one represent almost half (46%) of all low- to medium-temperature heat demand today, which is a promising sign for industrials
     looking to decarbonize.
● China is the leading force out of the top performers, with both high demand and a relatively attractive environment to deploy renewable heat
     solutions.
● Meanwhile, the U.S. and India, who represent the second and third largest portion of demand respectively, have room for improvement. Cheap
     fossil fuels and very limited policy and regulatory support at the national level are barriers to renewable deployment in both countries. Setting targets
     and implementing policies will help to create investor confidence.
● Demand from Russia and Saudi Arabia alone exceeds that of the three major economies in the EU. Both countries sit in the lowest performing group.

 Low- to medium-heat demand by tier
                                                                                 Tier 1     Tier 2      Tier 3     Tier 4

Source: BloombergNEF. Note: AG = Argentina, AU = Australia, CA = Canada, FR = France, ID = Indonesia, ZA = South Africa

14
Understanding the methodology
No country scored particularly highly on readiness for renewable heat.
Average ranking for each tier by indicator
● Even Tier 1 markets scored an average of 19 out of a maximum possible score
of 30.
Market conditions
● Market condition indicators are weighted highest in our ranking due to their
Tier one 19
impact on potential deployment. Country metrics focused on cost, including the
price of existing fossil fuel sources and carbon pricing (if present), as well as
past deployment of renewable heat technologies (marked by installed capacity
and market presence). Tier two 14
● Tier 1 and 2 countries tended to do well on market conditions.
Policy
● The policy indicator awarded points for the presence of existing policy
incentives and frameworks that would support renewable heat. Policies Tier three 10
included heat targets, mandatory emission standards for industry, or incentives
reducing capital needs and operating costs. Only national policies are covered –
state- and city-level policies are excluded.
● These policies will play an important role for deployment in the coming years Tier four 6
and therefore got the second strongest weight in the ranking. By and large, only
Tier 1 countries performed well on this metric.
Resource availability and climatic conditions 0% 20% 40% 60% 80% 100%
● Resource availability and climatic conditions indicate the potential to access
Market conditions
different natural renewable sources competitively. This indicator has the
smallest influence on the overall ranking. Renewable heat solutions, such as Policy
bioenergy or geothermal, are hyperlocal. This means the extent to which they Resource availability and climatic conditions
can be sourced competitively can vary significantly both between and within
countries.
Source: BloombergNEF
15Commercial viability of renewable heat
can be achieved in the near term
To enable industrials to deploy renewable heat solutions at scale and at pace, all markets need to improve. Countries that want to improve their
ranking and the deployment of renewable heat within their borders, should focus first on setting supportive policies.
● Putting a price on carbon helps industrials identify where fossil fuel combustion is likely to become less cost-competitive.
● Incentives can help increase deployment of innovative and early-stage technologies, such as industrial-scale heat pumps that can reach higher
temperatures.
● The International Renewable Energy Agency (IRENA) and REN21 are increasingly focused on promoting supportive policy environments for heat,
which raised awareness among member countries. Currently, countries are three times less likely to have specific renewable heat targets in place
compared to electricity, according to IRENA — but this gap should begin to narrow.
Several ongoing market developments will positively affect the competitive environment for renewable heat.
● Corporate net-zero goals mean that more companies are focused on renewable heat. Such targets cannot be met with power purchase agreements
for renewable electricity alone; firms must also address their industrial heating processes if Scope 1 and 2 emissions are to be reduced.
● Mass deployment of renewable heat technologies and market maturity will reduce capital costs. This will increase availability and make technology
solutions competitive across different markets.
● Electrification is expected to play a major part in decarbonizing the less energy-intensive industries. To source 100% of their renewable power from
the grid, corporates will need access to a reliable, smart grid.
● As power grid operators look to manage the deployment of more intermittent renewable generation, heat loads can be used to help balance supply
and demand, which will further help the business case for electrification.
Financial instruments are needed to support decarbonization.
● Improving regulatory frameworks that allow for off-balance sheet solutions will maximize corporate sourcing of renewable heat. These would allow
assets to be purchased without a corresponding balance sheet liability, which keeps debt-to-equity and leverage ratios low. As with electricity, third
party financing solutions with no balance sheet impact are expected to help facilitate the decarbonization of industry.
● Investor interest in carbon-intensive industry is dwindling across many institutional investors. This is likely to reduce the ability of the fossil fuel
industry to influence policy and makes financing new fossil fuel infrastructure more challenging. Meanwhile, investors are increasingly excited about
industrial decarbonization solutions.
16Part 3 Renewable heat technology profiles 17
Technology-specific insights
Some G-20 countries have already started to integrate renewable heat technologies, but a large opportunity remains.
● Energy use across the G-20 varies significantly. Countries such as the U.S., France and the U.K. rely heavily on natural gas to provide their low- to
     medium-temperature industrial heat. Meanwhile, China, India and Japan still use substantial amounts of coal and oil. Of the small amount of
     renewable heat technologies being used, bioenergy and electricity currently represent the largest share.
● The potential for different renewable heat technologies varies across the G-20 countries and was not captured in the technology-agnostic ranking.
     The following section will discuss the opportunity for each renewable heat technology and highlight attractive markets based on technology-specific
     considerations. It is worth noting that every technology will benefit from attractive energy prices and supportive policy.

Low- to medium-temperature fuel use across the G-20, 2018
100%

 80%

 60%                                                                                                                                                                                                      Other
                                                                                                                                                                                                          Electricity
 40%
                                                                                                                                                                                                          Biofuels and waste
                                                                                                                                                                                                          Natural gas
 20%
                                                                                                                                                                                                          Oil
     0%                                                                                                                                                                                                   Coal and coal products

                                                                                                                                                        Germany

                                                                                                                                                                  Russia
                                                                        Argentina

                                                                                                        U.K.
                            Indonesia

                                                                                                                                       India

                                                                                                                                               Canada
                                        Turkey

                                                 U.S

                                                                Japan

                                                                                    China

                                                                                                                                                                           Italy

                                                                                                                                                                                   South Korea

                                                                                                                                                                                                 Brazil
             Saudi Arabia

                                                                                            Australia

                                                                                                               France

                                                                                                                        South Africa
                                                       Mexico

Source: IEA. Note: ‘Other’ includes district heat, geothermal, solar, nuclear and wind. IEA balances include combustible fuels consumed by industrial end-users, which are almost entirely used to
generate process heat. Electricity use for non-process heat was assumed as 20% of total fuel use in low- to medium-temperature industries and was excluded. Coke ovens and blast furnaces are
included in iron & steel, while fuels used as feedstock or in transformation industries (eg, petrochemical refineries) are excluded.

18
Bioenergy
Bioenergy is one of the largest renewable heat sources consumed in
industry today. On average, it accounted for 13% of low- to medium-
temperature heat in the G-20 in 2018. However, its use is constrained by
resource availability and sustainability concerns.
Various forms of bioenergy exist:
● Direct combustion of biomass waste, residues or by-products collected
from another process, such as manure.
Source: Bloomberg LP
● Biogas formed from anaerobic digestion of organic matter, landfill gas
recovery systems, gasification or wastewater treatment plants. Temperature range of bioenergy for heat
● Biomethane, which has higher concentrations of methane, either from
Temperature (Celsius) 0 200 400 600 800 1,000
‘upgraded’ biogas or through the gasification of solid biomass.1
Biomass
Opportunities
Biogas
● The use of bioenergy is currently concentrated in the pulp and paper Biomethane
sector, where residues from the processing of wood products such as
black liquor are readily available. Source: BloombergNEF
● The food, beverage, and tobacco sector presents an opportunity for Factors to look for that support bioenergy adoption
greater use of waste agricultural products, including rice husks and ● Proximity to sustainable feedstock options, such as agricultural residues or
sugarcane fibers (bagasse). organic waste produced on-site or near the facility to reduce transport cost
Challenges and emissions.
● Feedstock availability can limit output, while anaerobic digestion also ● Combined heat and power opportunities, which bring in added revenue.
requires consistent feedstock quality. ● Mature markets, where corporates are willing to take on risks
● There is no clear definition of what constitutes sustainable bioenergy, or associated with feedstock and plant performance.
agreement on how to calculate associated emissions. Competing needs
for land and water resources favour use of waste feedstocks over
dedicated energy crops, which limits supply. Attractive markets
Brazil Indonesia South Africa China
1Biomethane is ‘pipeline quality’ biogas and can be interchangeable with natural gas. It is often
called ‘renewable natural gas’ in the Americas.
19Electrification
Electricity on average provided 15% of industrial low- to medium-
temperature heat use in the G-20. Electrification has significant potential
to scale its use and the corresponding emissions will improve as the grid
continues to decarbonize.
Various forms of electrification technologies exist:
● Industrial-scale heat pumps combine electricity with heat transferred
typically from a waste heat stream. Another option is mechanical Source: Bloomberg LP
vapor recompression. MVR operates like a heat pump, but instead of a
refrigerant it compresses water vapor to produce steam. Temperature range of electrification for heat
● Resistance heating, including electric boilers and furnaces, pass an
Temperature (Celsius) 0 200 400 600 800 1,000
electric current through a material to generate heat.
● Electromagnetic heating – such as microwaves, radiowaves or infrared – Heat pumps
uses wavelengths in the electromagnetic spectrum to generate heat Electricity
within a material.
Source: BloombergNEF
Opportunities
● Electrification is currently concentrated in the food, beverage, tobacco Factors to look for that support electrification
and machinery sectors.
● A higher portion of renewables in the grid, or availability of PPAs.
● The chemical, pharmaceuticals and textiles sector all present
● Favorable power-to-gas price ratio, either through high absolute costs
opportunities for electrification.
of natural gas or low-cost electricity.
Challenges
● Accessible, reliable and affordable waste heat for industrial-scale
● Some electric technologies are not yet commercially available. heat pumps.
● Price of electricity compared with fossil fuels makes direct electrification
cost-prohibitive in many markets.
● Industrial-scale heat pumps are limited to applications under 200°C. Attractive markets
● Some markets may have lower penetration of renewable electricity or France Germany South Korea Australia
barriers to signing power purchase agreements (PPAs).
20Geothermal
Geothermal refers to systems which extract heat from under the earth's
surface. Geothermal systems have been largely concentrated in countries
with significant amounts of natural geothermal resources.
There are three main types of geothermal energy systems:
● Deep geothermal systems use steam captured and transported
from below the earth’s surface for direct use.
● Shallow geothermal systems use the same premise as deep geothermal Source: Bloomberg LP
but at shallower depths and lower temperatures. Shallow geothermal is
seen as less intrusive and disruptive, but often requires a heat exchanger Temperature range of geothermal for heat
to boost the temperature for use in industry. 0 200 400 600 800 1,000
Temperature (Celsius)
● Enhanced geothermal systems pump water underground to take
advantage of the earth’s natural temperature gradient. These systems are Deep geothermal
still under development.
Shallow geothermal
Opportunities
Source: BloombergNEF
● Geothermal has primarily been used in energy-intensive industry and in
Factors to look for that support geothermal adoption
countries with access to geothermal resources.
● Strong existing geothermal markets in high-temperature industry.
● With increased availability of shallow geothermal technology, more
geographic opportunities will emerge. However, the opportunity will still ● Geothermal generation in the power mix indicates existing technological
be limited based on achievable output temperature. expertise and resource availability.
Challenges ● Experience with excavation and drilling, such as from natural gas or oil
exploration.
● Region-specific resource availability.
● Use and experience with industrial-scale heat pumps (applicable for
● High upfront costs to develop geothermal sites and drilling risks for deep
shallow geothermal applications).
geothermal sites.
● Shallow geothermal is not yet commercially available and deep enhanced
Attractive markets
geothermal is still under development.
U.S. China Indonesia Japan
21Solar thermal
Solar thermal refers to systems that make use of energy captured from the
sun. Solar thermal is currently a niche market, with limited deployment in
low- to medium-temperature industries to date.
Two different forms of solar thermal exist:
● Non-concentrating solar thermal includes flat-plate solar collectors to
generate hot water and evacuated tube solar collectors to generate
Source: Bloomberg LP
steam.
● Concentrating solar technologies include compound parabolic Temperature range of solar thermal for heat
concentrator technologies. These differ from non-concentrating
Temperature (Celsius) 0 200 400 600 800 1,000
applications in terms of size and the temperature they can generate.
Deployment usually occurs at a larger scale, typically over 50MWth. Solar thermal: non-
concentrated
Opportunities Solar thermal:
● Deployment has been concentrated in food and beverage, textile and concentrated
mining sectors.
Source: BloombergNEF, IEA-SHC
● Most processes that require low-temperature hot water and are currently
using steam could, in theory, use solar thermal. Factors to look for that support solar thermal adoption
● Higher solar irradiance will boost the utilization rates and economic
Challenges
performance of solar thermal facilities.
● Solar thermal plants are space-intensive. Space constraints at industrial
● Presence of manufacturing sites that only use low-temperature heat and
sites and competition from solar PV – which at present often provides
better economics – hamper deployment. do not cascade down waste heat from medium-temperature processes.
● For concentrated solar power, climates with limited cloud coverage are
● Awareness of and familiarity with the technology is low across the value
chain and makes development challenging for industrials. Sophisticated key.
commercial service offerings are limited in many markets due to low
market penetration. Attractive markets
● Lack of technological maturity has affected investor confidence in the China Mexico Germany Australia
technology.
22Appendix Methodology 23
Methodology
This ranking has involved collating new data from primary sources, utilizing
proprietary data sets from BloombergNEF, identifying proxies where data
was unavailable, quantifying all data and interpreting the relative
importance of each variable.
As such, the ranking is an indicator of a country’s environment for
renewable heat, not an exact determination.
The authors recognize that individual variables such as a particularly high
carbon tax, or an especially low gas-to-power price ratio can make a
renewable heat project viable in what is otherwise a non-noticeable
market. Additionally, resources such as biomass, geothermal and solar
thermal are hyperlocal, which leads to varying levels of competitiveness
within countries across the G-20.

                                                                               Source: Bloomberg LP

 24
Metrics used to inform the ranking
Category Indicator Explanation
Market conditions Natural gas prices relative to electricity prices Indicates the economics of switching from natural gas to electric technologies
Absolute price of natural gas Outlines the potential of fuel switching from natural gas
Presence of coal and oil in industry Markets with accessible and affordable coal and oil will be more challenging
Absolute carbon price The level of the carbon price impacts the economics of fossil-based technologies
Existing solar thermal market for process heating
All three indicators showcase the level of in-country availability and expertise in installing
Existing geothermal market in industry and power and using the technology for industrial end-users
Existing bioenergy market in industry and power
Policy For more on any of the policy indicators, see BNEF's G-20 Zero-Carbon Policy Scoreboard
Energy efficiency incentives on end-products
2021 (web).
Renewable heat target or emission target on industrial heat Targets set direction and clarity for industrial users
Operating cost subsidies on electrification or renewables
technologies Subsidies both upfront and ongoing help to support deployment and mature the supply
Upfront cost subsidies on electrification or renewables chain
technologies
CO2 pricing or fossil-fuel ban for industrial heat (or biggest
The presence of a carbon price signals a commitment towards decarbonization
subsectors)
Minimum standards or mandates can encourage adoption of renewable heat technologies
Obligatory standards or mandates on products or companies
for these standards to be met
Resource availability Percent of the country with electric grid access
For more on both indicators, BNEF clients can refer to Country Data Tool (web | terminal)
and climatic Renewable share of power generation
conditions Corporate PPA capacity Ability to procure renewables supports electrification
Direct horizontal irradiance Indicator for solar thermal potential
Potential for deep geothermal
Indicates the natural endowment of geothermal resources in a country
Potential for shallow geothermal
A proxy for potential access to agricultural residues that are used as a common feedstock
GDP from agriculture and forestry
for bioenergy
Source: various sources, BloombergNEF
25Market conditions: retail prices key to
enable renewable heat
Power and gas prices are among the key metrics to capture how favorable a market is for renewable heat deployment. The average gas price paid by an
industrial player, in absolute terms, reflects the economics for fuel switching. Cheaper gas prices would make it more difficult for renewable heating
sources to compete. Tier 4 markets have the lowest industrial gas prices on average, followed by Tier 3 markets.
For electrification, a key metric is the ratio between gas and power prices. This is because gas furnaces and electric units – especially heat pumps – have
very different efficiencies. Electric resistance heating, for instance, usually has a 100% efficiency of electricity consumption to heat production. For
industrial heat pumps, efficiency is captured by a co-efficient of performance. This reflects the amount of useful heat provided by one kilowatt-hour of
electricity consumed. A typical range of COPs for industrial heat pumps is 3.5 to 5.5.
A power-to-gas price ratio of at least 1 implies that electric furnaces would cost the same as gas furnaces to operate, while a ratio of between 3 to 5 is
enough for heat pumps to compete economically. This means electric solutions were more likely to be cost competitive in Tier 1 and 2 countries.
Some G-20 markets – including South Africa, India and China – do not have a lot of natural gas use in industry. In these instances, other indicators such as
the presence of coal or oil played a greater role.
Ratio of power to gas price for industrial players by tier Average gas price for industrial players by tier
Power to gas price ratio Average gas price ($/MWh)
Tier 1 3.6 Tier 1 37.5
Tier 2 4.1 Range Tier 2 38.6
Average
Tier 3 7.9 Tier 3 22.6
Tier 4 178.2 Tier 4 5.1
1 10 100 1,000
Source: BloombergNEF, WBCSD. Note: Logarithmic scale. Source: BloombergNEF, WBCSD
26Policy: upfront cost subsidies are an area
to focus for many countries
Policy remains a key driver for industrial heat decarbonization because of the poor market conditions in many G-20 markets and will likely play a significant
role for many years to come. Within this analysis, G-20 countries who had implemented policies driving decarbonization, such as a carbon price or upfront
subsidy scheme for renewables, were awarded points.
Renewable heat targets focused on industrial decarbonization are relatively rare in the G-20. Just four out of 19 markets (21%) have a clear policy in place.
These help to signal to market players and investors a government’s intended direction of travel and will be important as the sector moves forward.
Tier 1 countries had the most policies implemented, ticking on average four out of the six policies included in this analysis. European countries stood out
and make up half of the countries ranked in Tier 1.
A price on carbon or a ban on the use of fossil fuels should help incentivize renewable heat across all technologies. Some 12 of the 19 individual countries
(63%) have such a policy, making it the highest implemented across the G-20. Upfront cost subsidies were only implemented in just over a third of G-20
countries. Subsidies have a significant impact on deployment and should be a policy focus for countries without such a scheme.
Average number of implemented industrial heat policies by Percentage of G-20 countries with implemented industrial
tier heat policies by policy type
Average Percent
Carbon price or fossil fuel ban 63%
Tier 1 4.3
Energy efficiency incentives 58%
Tier 2 2.4
Obligatory standards or mandates 37%
Tier 3 0.8 Upront cost subsides 37%
Tier 4 0.7 Renewable heat target 21%
Operating cost subsides 16%
0 1 2 3 4 5 6
Source: BloombergNEF, WBCSD. Source: BloombergNEF, WBCSD.
27Resource availability and climatic conditions: part of it is luck, part is effort For some renewable heat technologies, deployment is linked to specific resources or climatic conditions. Deep geothermal, solar thermal and bioenergy all rely on conditions that may only exist in a certain area. As such, some countries will be better placed to exploit these resources, although there will be a huge variance of availability within countries. Resource availability and climatic conditions focused on identifying the key factors which enable and support deployment of specific technologies. While some of the metrics come down to the geography and resource, countries were also rewarded for creating an environment for deployment. For example, having a developed PPA market is beneficial as it can support greater electrification. Ultimately, the variety of use cases and technical solutions means each country or even region has a unique optimal path to decarbonize heat. Potential for solar thermal across the G-20 Potential for deep geothermal across the G-20 Source: BloombergNEF, WBCSD. Source: BloombergNEF, WBCSD. 28
Authors
WBCSD is a global, CEO-led organization of over 200 leading                  BloombergNEF (BNEF) is a strategic research provider covering
businesses working together to accelerate the transition to a                global commodity markets and the disruptive technologies
sustainable world. We help make our member companies more                    driving the transition to a low-carbon economy.
successful and sustainable by focusing on the maximum positive
                                                                             Our expert coverage assesses pathways for the power,
impact for shareholders, the environment and societies.
                                                                             transport, industry, buildings and agriculture sectors to adapt to
Our member companies come from all business sectors and all major            the energy transition.
economies, representing a combined revenue of more than USD $8.5
                                                                             We help commodity trading , corporate strategy, finance and
trillion and 19 million employees.
                                                                             policy professionals navigate change and generate
Together, we are the leading voice of business for sustainability: united    opportunities.
by our vision of a world where more than 9 billion people are all living
well and within planetary boundaries, by 2050.

Inquiries:                                                                  Inquiries:
Email: info@wbcsd.org                                                       Email: support.bnef@Bloomberg.net

Isabel Harrison                         Analyst, Energy                     Emma Coker             Associate, Heating and Cooling
Rutger van der Zanden                   Manager, Energy                     Meredith Annex         Head of Heating and Hydrogen

Learn more:                                                                 Learn more:
wbcsd.org | @WBCSD                                                          about.bnef.com | @BloombergNEF

Acknowledgements: The authors would like to thank the Yale Center for Business and the Environment (CBEY) and the Yale School of the Environment
Office of Career and Professional Development for their support, as well as members of the WBCSD Heating & Cooling Working Group, International
Renewable Energy Agency (IRENA), World Biomass Association and Solar Heat Europe for sharing expertise that informed our analysis.

29
Copyright and disclaimer
Copyright
© Bloomberg Finance L.P. 2021. This publication is the copyright of Bloomberg Finance L.P. in connection with BloombergNEF. No portion of this
document may be photocopied, reproduced, scanned into an electronic system or transmitted, forwarded or distributed in any way without prior
consent of BloombergNEF.
Disclaimer
The BloombergNEF ("BNEF"), service/information is derived from selected public sources. Bloomberg Finance L.P. and its affiliates, in providing the
service/information, believe that the information it uses comes from reliable sources, but do not guarantee the accuracy or completeness of this
information, which is subject to change without notice, and nothing in this document shall be construed as such a guarantee. The statements in this
service/document reflect the current judgment of the authors of the relevant articles or features, and do not necessarily reflect the opinion of
Bloomberg Finance L.P., Bloomberg L.P. or any of their affiliates (“Bloomberg”). Bloomberg disclaims any liability arising from use of this document, its
contents and/or this service. Nothing herein shall constitute or be construed as an offering of financial instruments or as investment advice or
recommendations by Bloomberg of an investment or other strategy (e.g., whether or not to “buy”, “sell”, or “hold” an investment). The information
available through this service is not based on consideration of a subscriber’s individual circumstances and should not be considered as information
sufficient upon which to base an investment decision. You should determine on your own whether you agree with the content. This service should not
be construed as tax or accounting advice or as a service designed to facilitate any subscriber’s compliance with its tax, accounting or other legal
obligations. Employees involved in this service may hold positions in the companies mentioned in the services/information.
The data included in these materials are for illustrative purposes only. The BLOOMBERG TERMINAL service and Bloomberg data products (the
“Services”) are owned and distributed by Bloomberg Finance L.P. (“BFLP”) except (i) in Argentina, Australia and certain jurisdictions in the Pacific islands,
Bermuda, China, India, Japan, Korea and New Zealand, where Bloomberg L.P. and its subsidiaries (“BLP”) distribute these products, and (ii) in Singapore
and the jurisdictions serviced by Bloomberg’s Singapore office, where a subsidiary of BFLP distributes these products. BLP provides BFLP and its
subsidiaries with global marketing and operational support and service. Certain features, functions, products and services are available only to
sophisticated investors and only where permitted. BFLP, BLP and their affiliates do not guarantee the accuracy of prices or other information in the
Services. Nothing in the Services shall constitute or be construed as an offering of financial instruments by BFLP, BLP or their affiliates, or as investment
advice or recommendations by BFLP, BLP or their affiliates of an investment strategy or whether or not to “buy”, “sell” or “hold” an investment.
Information available via the Services should not be considered as information sufficient upon which to base an investment decision. The following are
trademarks and service marks of BFLP, a Delaware limited partnership, or its subsidiaries: BLOOMBERG, BLOOMBERG ANYWHERE, BLOOMBERG
MARKETS, BLOOMBERG NEWS, BLOOMBERG PROFESSIONAL, BLOOMBERG TERMINAL and BLOOMBERG.COM. Absence of any trademark or service
mark from this list does not waive Bloomberg’s intellectual property rights in that name, mark or logo. All rights reserved. © 2021 Bloomberg.You can also read