The effect of vehicle-to-grid in France and Germany, in a context of market coupling by 2035
←
→
Page content transcription
If your browser does not render page correctly, please read the page content below
The effect of vehicle-to-grid in France and Germany, in a context of
                       market coupling by 2035

    Ange Blanchard, Pierre-Marie Manach, Maël Barillec, Romane Maréchaux, Frédéric Lantz, and Arash
                                               Farnoosh

                                          Ecole des Ponts Paris tech - IFPEN

       Abstract. For the next two decades, the European energy landscape will face structural challenges to
       reach its climate objectives. Almost every decarbonisation scenario rely on a high level of renewable
       energy sources, a strong connection of national electricity grids and the spread of electric vehicles (EVs).
       Are these trends complementary, leading to a reliable cost-effective electrical system across Europe?
       This article develop a simple theoretical model to shed light on this question, focusing on France and
       Germany systems. It introduces EVs into a 2035’s electric mix with vehicle-to-grid (V2G) capabilities
       and draw out the consequences of it, regarding the interconnection level between both grids. We find
       that a higher interconnection capacity between the two electric systems leads to a price convergence on
       the wholesale market and a better economic efficiency as a whole, as predicted by theory. In addition,
       the growth of EVs along with vehicle-to-grid possibilities have some ambiguous consequences. While
       it tends to increase the electricity prices when the interconnection is low, it has the opposite effect
       from a certain interconnection threshold. In a context of strengthening the several interconnection lines
       between countries, the exponential spread of electric vehicles can be an opportunity to help reducing
       the risk of black-out during peak loads.

Keywords Electricity Modelling, Market coupling, Renewable energy, Electric Vehicle integration

1    Introduction

Since the end of the 1990s, the issue of global warming has become an increasingly important part of the
various ambitions of the European Union. The energy sector was one of the first to integrate this constraint
into its production model. The climate objectives for 2030 include the reduction of GHG emissions (-40%
compared to 1990 levels) and the increase of renewable energies (to at least 32%) in order to decarbonize
European electricity and more broadly the energy supply. However, the challenge of this energy transition is
also based on its economic feasibility in the short and medium term and its acceptability by the citizen, who,
including through electricity, will have to contribute financially.
    The aim of this study is therefore to examine the impact of these structural changes in the electricity mix
in the context of an integrated European market. To this end, the study proposes to model the functioning of
the electricity market for two countries, France and Germany, and to study the physical impact of the energy
transition (via the integration of storage, renewable production, a carbon price, the evolution of electricity
demand, etc.) and the economic impact of a market coupling. Finally, the interest of the study lies in the
exposure of certain dynamics and complementarities between the two electrical systems as well as in the
evaluation of the relevance of the "Vehicle-to-Grid" (V2G) solution in the face of the explosion in the number
of electric vehicles.
    The France-Germany duo is particularly relevant since they are the two largest European electricity
producers (643 TWh and 582 TWh respectively in 2018). Similarly, the interconnection between France and
Germany is one of the most important on the continent and is currently being developed. The work is based
on the use of GAMS (General Algebraic Modeling System). The figures come from national sources and
reports of various origins (PNEC, TSOs, ENTSO-E).
2

1.1     The European electricity market

The end of the Second World War saw the creation of vast monopolies in the European electricity industry.
This was done with a view to economic efficiency and national planning of electricity production, a strategic
issue of sovereignty. Once the development costs of the main infrastructures had been depreciated, and with
the arrival of smaller and less expensive production technologies, this model was called into question and the
liberalization of energy markets was encouraged. In Europe, it was in the 1990s that the first liberalization
directives were adopted, with the aim of pooling resources on a continental scale and reducing the price of
electricity. The aim of these measures is to:

    – Promote the creation of a copper-plate like market across Europe, through the spread of cross-border trade

    – Enhance the flexibility of the grid to accommodate an increasing share of renewable energy production

    – Improve planning to anticipate and respond to electricity market crises, including through cross-border
      cooperation

    One of the European Union’s key ambitions is to give new impetus to European energy and climate policy.
Indeed, the European Commission’s roadmap to 2050 [1] proposes scenarios and guidelines for achieving the
European Union’s objective of reducing its greenhouse gas (GHG) emissions by 80 to 95% by 2050, compared
to their 1990 level, in order to make its contribution to limiting global warming to less than 2°C. This has
prompted member states to rethink their energy mix, in particular through the integration of renewable
energy.

1.2     French and German power mix

The historical choices made by France and Germany concerning the structure of electricity production have
led to contrasting electricity production mixes between the two countries:

    – While France chose to orient its electricity production towards nuclear technology in the 1970s, Germany
      has favored fossil fuels, in particular coal and lignite, of which it has an abundance. Gas, which is mostly
      imported, has more recently been added to this mix

    – We also note that the share of renewable energies in the electricity production mix is higher in Germany:
      47% in Germany compared to 22% in France. The weight of carbon-based energies is also significantly
      higher in Germany than in France, particularly following the German decision to close nuclear power
      plants in 2011.

    – More recently, since the end of the 2000s, Germany has chosen to massively develop renewable electricity
      production technologies: biomass, PV and wind power, which in 2019 accounted for 42% of its electricity
      production.

    Besides, coal, which is now very competitively priced, is regaining a significant place in the German
electricity generation mix. In addition, France has hydroelectric resources and production facilities, which
will account for 11% of the electricity production mix in 2019, whereas Germany is less well resourced.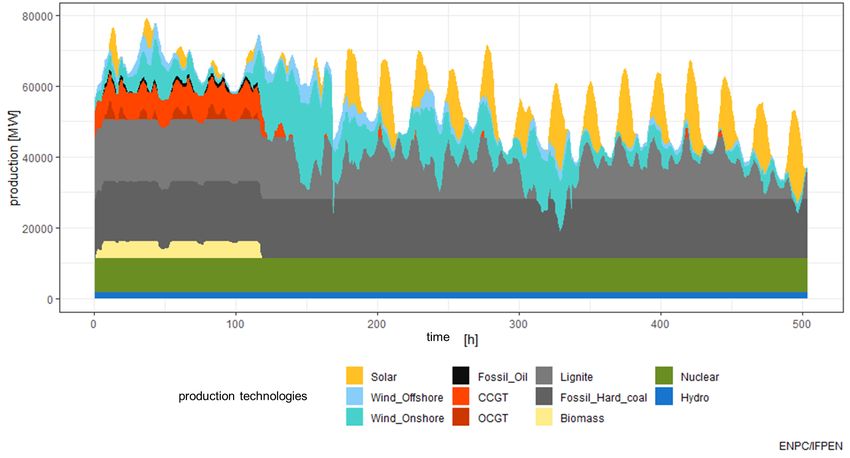
3

2   Literature review
Among the several challenges raised by the energy transition, the impact of renewables on electricity prices is
particularly brought to the forefront. Many authors have shown that the penetration of renewables leads to
an overall reduction of electricity prices on the wholesale market. Sensfuß et al. explain that this fall is due
to a merit order effect, as renewables reduce the residual demand for thermal based energy generation, and
is closely linked to fuel prices, especially gas. [2] Yet, a limitation observed by the author lies on the omission
of market coupling effects which are thus addressed in our study. However, these assertions are nuanced in
the long term. Antweiler et al. showed for example that the merit order effect caused by renewables is zero
when taken into account long-term dynamics. The majority of the effect is transitory, as long as renewables
do not produce 100% of electricity for a given timeslice [3]. Moreover, the disruption brought by a high
penetration of renewables is coupled with the growth of demand coming from electric vehicles (EVs) leading
to additionnal stress on the grid. Vehicle-to-Grid (V2G) is considered as a solution that enables this arrival
of electric cars on the network. [4]
    Another major field of study is related to grid stability issues arising from the loss of inertia of incoming
electric systems. The inertia of the whole electric system is closely linked to the amount of rotating element
and thus to the number of thermal plants in it. The development of renewables implies a lower overall inertia
and can lead to frequency drops, which can ultimately cause a black-out. In order to reduce this effect,
storage capacities can be used and flexibility tools like EVs are a key asset to tackle this issue. Magdy, Ali
and Xu showed EVs can perform the same role as the kinetic energy stored in Synchronous Generators for
supporting inertia. They proposed a method to enhance the frequency stability on low-inertia modern power
grids using EVs [5]. This kind of smart solutions is often promoted by the ENTSO-E, which claims that the
road of decarbonisation is long and all potentials are to be taken in consideration. The agency has highlighted
for many years the importance of developing flexibility capabilities in the grid, to face the intermittency of
renewables. To manage this newcoming complexity, the coordination efforts are to be market-driven and must
involve a maximum of cross sector integration. Storage devices and demand response units are a key element
to achieve this goal, and have to spread widely with a multitude of possible shapes [6]. Recently, the IEA
explained that German grid flexibility is still "mainly provided by conventional generation. In particular,
coal units are increasingly operated in a load-following mode. However, a significant amount of gas-fired
capacity rests idle as it is largely unable to compete with coal. The potential of demand response has yet to
be exploited." [7]. Moreover, as showed in a recent report of Agora Energiewende [8], “improving the technical
flexibility usually does not impair the efficiency of a plant, but it puts more strain on components, reducing
their lifetime”. The future of electricity network management will rely on new technologies of flexibility,
among which EVs and interconnection play a vital role.
    In order to do so, the arrival of EVs on the electricity market is to be fostered by TSOs, which have to
support their spread by setting up ambitious policy strategy [9]. Perez and Petit found out how to proceed by
identifying the main drivers of this growth and by drawing an optimal pathway of incentives, considering the
growing complexity of liberalised electricity markets and the new stakeholders concerned, like aggregators of
EVs for example. One of the main conclusions is that current strategies operated in Europe by the TSOs do
not follow all the rules needed for an optimal spread of EVs. Indeed, this observation is temporary and one
can expect a swift change in the market policies and rules [10]. From a modelling point of view, most recent
works have shown the EV stock needs to be desagregated to be more representative. This is not the case
for our work, in which EVs have been modelled in a very simplistic way, whereas Gnann et al. showed the
importance of behaviours and habits in the efficiency of flexibility by EVs. Using six users groups, from private
EVs to company EVs, they found that potential are diverse in term of availability and capacity. Different
charging options lead to significant differences in the electricity consumption when the demand response
option is considered. Eventually, authors showed that some demand response devices can confront each other
according to the critical level of capacity they make available to the system. Hence, the optimisation of an
EV fleet must be done in concert with heat pumps uses for example [11]. The study we are proposing here
therefore takes place in a context of strong changes occurring in the European network and market. The
4
restriction of our study to the France-Germany coupling and to an aggregated vision of the electric vehicle
fleets allows us to obtain interesting first results on the complementarity of the flexibility and market means
to be put in place to make the electric system evolve and opens the way to more specialized sociological,
economic and technical questionings.
3 Economic theories applied
3.1 Merit-Order model
To model the behavior of national power generation fleets, the Merit-Order logic is applied. The Merit-
Order consists in calling on the electricity production means according to an economic ranking based on the
increasing marginal cost of production in order to adjust the production to the demand at a given time [12].
This is modeled by applying a marginal cost to each generation resource which is taken into account in the
minimization of the power generation cost as follows:
X
min c = (cv ,i Pi ) + cinv Cl
i
P
Pi ≥ dr
u.c. i
Pi ≤ Cg,i , ∀i
where
i = production technologies (brown coal, lignite, CCGT, nuclear...)
cP = global cost in €
cv ,i = operating cost (variable) of the technology in €/MWh
cf,i = fixed cost for new capacity in €/kW
cinv = investment cost for new interconnection line in €/MW
dr = national residual demand in MWh
Pi = actual production of the technology in MWh
Cg,i = generating installed capacities in MW
Cl = interconnection lines to be installed in MW
In the simulations, restrictions are introduced for investments in new capacities
3.2 Market coupling theory
Market coupling allows exports and imports between different markets in order to obtain the most advanta-
geous prices in the respective markets. In the case of electricity markets, export capacities are represented
by interconnection lines [13]. The theory of market coupling states that with infinite interconnection lines
of capacity, price convergence is observed. The modeling of the coupling between France and Germany has
been translated into the primal optimization model as follows:
dr ,f r + dr ,ge = df r + dge
dr ,f r − df r ≤ Cl
u.c.
df r − dr ,f r ≤ Cl5
where
df r = the national French demand in MWh
dge = the national German demand in MWh
dr ,f r = the effective French demand after import/export in MWh
dr ,ge = the effective German demand after import/export in MWh
Cl = Interconnection line of capacity between the two countries
The equation considers df r and dge as the exogenous mandated values that production must meet. Demand
can thus be transferred from one country to another (under limit of interconnections lines) in respect of
minimizing the global cost.
4 Data choice and modeling steps
4.1 Electric demand
Once the theoretical principles have been defined, the electrical demand data and the marginal costs of the
means of production are necessary for the first iteration of the national models.
Refine electric demand The applications considered in the study are from the ENTSO-E platform. The
year chosen for this study is 2019. The demand is a relative value to be put in perspective with respect to
the country’s imports and exports as well as unavoidable productions. Thus, the demand considered in the
study follows the following equation:
dr = P roduction − Import + Export − P roductionrenewable
During the model calibration phase, the net production deducted from the production of renewable resources
was used. This made it possible to compare the response of the models with the actual response.
Initially, intermittent or non-dispatchable generation was removed. The technologies concerned are: run-of-
river hydro, wind and solar technologies. These technologies were then imported as a defined parameter once
the models were completed. The imported production values are the actual productions over the concerned
periods.
Choice of standard weeks In order to reduce the computation time while studying the whole year, it
was chosen to study three typical weeks, considered representative of the different weather conditions and
demand volumes observed during the year:
– The third week of January 2019. This week is marked by a very high electrical demand as well as a very
low renewable production. It can therefore be considered as the extreme case of the study.
– The first week of May 2019. Mid-season demand is lower and wind generation is very high.
– The fourth week of July 2019. Demand is similar to May and solar generation is significant.
The weeks start on Monday at 00:00 and end on Sunday at 23:00. They are put end to end in order to
obtain a request on 504 time steps. The FIGURE 4 represents the load curve of the studied Germany.6
4.2 Operating costs
The running cost of generating electricity is defined according to the three quantities presented in the following
equation:
cv = cf uel + cO&M + cCO2
cf uel = cf uel,th ηi
with
cCO2 = eCO2 ηi
where
cv = total running cost (variable) in €/M W hel
cf uel = fuel cost in €/M W hel
cO&M = operation and maintenance cost (O&M) in €/M W hel
cCO2 = carbon emission costs from ETS-EU Market in €/M W hel
cf uel,th = fuel cost in €/M W hth
ηi = efficiency of the technology i in % or M W hel /M W hth
eCO2 = carbon emission in t/M W hel
Table 1: Characteristics of conventional production technologies in France and Germany [14] [15] [16] [17]
[18]
cv ,ge ∗ cv ,f r ∗ η eel
Technologies
(€/M W hel ) (€/M W hel ) (%) (tCO2 /M W hel )
CCGT 54,42 36,67 60% 0,332
OCGT 81,55 57,89 38% 0,524
Coal 34,03 21,91 47% 0,717
Lignite 21,09 - 47% 0,849
Fuel Oil 95,69 97.14 35% 0,754
Nuclear 15,11 20.94 32% 0
*cCO2 = 0€/MWh
Solar, Wind and Hydro run-of-river are considered at a cost of cv = 0 €/MWh. Moreover, the model
takes the production of those non-dispatchable energy as endogenous variables.
The model assumes that all power plants have similar characteristics based on their technology.
4.3 Adding constraints to represent the power system
In order to study the evolution of the wholesale electricity price in France and Germany, our study aimed at
building an optimization model using the GAMS software to model this merit order logic in the electricity
markets. We model the least cost electricity supply/demand balancing in each country.
To do so, we chose to minimize the total cost of each national system by summing up the cost of the called
technologies over all the time steps studied. This total cost is then minimized using the mip solver under7
the constraints of satisfying the demand and respecting the physical constraints of production and storage.
The output is a load curve illustrating the different generation technologies called at each hour to meet the
demand and the value of the wholesale price is then deduced.
The first version of the model provided a simplistic result (see Figure 1) allowing us to validate the correct
application of the merit order logic. However, there was a deviation from the real load curve and from the
generation technologies called on during the demand time slots. We therefore proceeded by iterations to refine
our model by taking into account technical parameters of production to get closer to reality.
Fig. 1: Stylized load curve obtained with the first version of our model - Germany
We took into account the ramp-up/ramp-down phenomena and the start-up cost in order to model the
physical inertia of certain production technologies (particularly peak) to reach a set power. We also took into
account the time period of our study and imposed on our model the initial production conditions observed
in reality at these dates.
In addition, the observation of steps on the load curve obtained in Figure 1 as opposed to the actual load
curve in Figure 3 is also due to the "block" consideration of generation technologies. We therefore sought
to discretize the generation units by forcing a partial baseload production for some technologies. Finally,
in order to include the V2G system in the electricity supply, we also modeled the storage by selecting four
technologies estimated to be the most widespread or promising: pumped-storage energy transfer stations,
compressed-air energy storage, industrial electrochemical storage with Li-ion batteries and electric vehicles.
To take into account these storage means in our optimization logic, we consider this time the investment
costs, fixed costs and variable costs in order to arbitrate on the quantity of capacity of each type to be
installed, starting from the initial capacity. An exception is made for electric vehicles which are considered
fixed, hence the infinite CAPEX. We have therefore defined the costs of installing an additional MW per
technology as well as the initial installed capacities, considering the life span of a new installation, the various
construction and operating costs, which we have annualized. The principle of programmed storage remains
simple. By hourly time step, the model chooses to store or to supply electricity to the system. The choice is
made by the solver, to reach the economic optimality of electricity production. Finally, we obtain the load
curve Figure 2 which is closer to the real curve.8
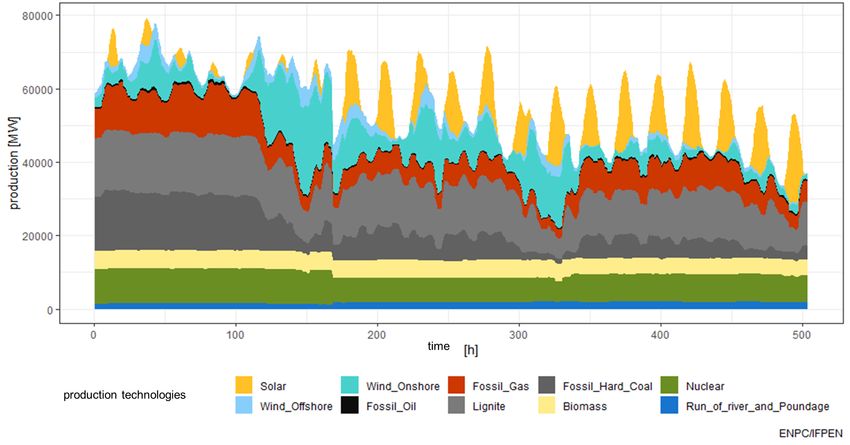
Fig. 2: Final load curve including storage - Germany
Fig. 3: Real load curve - Germany9
5 Evolution of parameters to fit 2035 electric markets
Evolution of the power generation mix by 2035 We now seek to change the assumptions in order to
evaluate the behavior of the electrical systems by 2035. The electricity mixes considered in the following are
taken from national strategies and prospective studies of the TSOs for this horizon. In France, numerous
studies have been carried out to estimate the evolution of the electricity mix by 2035. Future publications by
RTE plan to study the electricity mix for 2050 [19] and Ademe is even evaluating scenarios up to 2060 [20].
For this work we wanted to be as close as possible to the officially programmed trajectory and chose to follow
the estimates of the French electricity mix in 2035 of the Ademe "reference" scenario. In this scenario, the
nuclear fleet is expected to decrease at the rate established by the “PPE”, i.e. 70% of the plants will be shut
down after their fourth and fifth ten-yearly inspections, which would bring the nuclear share to 50% shortly
before 2035. The increase of the installed capacity of renewable energy is growing until reaching 34 GW of
photovoltaic, 46 GW of onshore wind and 6 GW of offshore wind.
The German scenario is from the Munich Institute for Energy Economics Research (FFE München). We
anticipate a significant increase in wind and solar power, an increase in gas capacity to make up for the
intermittency of the new renewable capacities, a disappearance of nuclear power and a very clear reduction
in coal.
Fig. 4: Evolution of renewable power generation capacity
Energy demand scenario National electricity demand in France and Germany are considered to be slug-
gish: the anticipated reduction in energy efficiency policies in the residential and tertiary sectors is offset
by the increase in demand induced by the increase in the number of electric vehicles and the shift in heat
production from gas to heat pumps. [21]
Estimation of renewable energy power generation The Electricity generation profile of intermittent
renewable electricity generation (wind and photovoltaic), is considered to be similar between 2019 and 2035.
However, the production volume is considered proportional to the installed capacity. It is also assumed that
there is no change in hydro capacity in the two countries.
Stationary storage and fleet Stationary storage capacities are not changed between 2019 and 2035. The
storage modeling principle remains the same. The model is left free to invest in storage capacity to reach the10
Fig. 5: Evolution of conventional generation capacity
economic optimum. The number of electric vehicles remains an exogenous value and its value for 2035 comes
from a literature review. In its 2017 forecast, RTE proposed several developments in the electric vehicle fleet.
The low trajectory proposed only 4 million electric vehicles by 2035, while the high trajectory estimated
almost 16 million. Ademe’s more recent studies used a low demand of 10 million units and a high demand of
16 million EVs. For the base case we studied, we decided to project 10 million EVs in 2035 in both countries.
During the sensitivity studies, two cases were considered. One with no electric vehicles, and a second with
15 million electric vehicles, considering that all intermediate cases fall between these limits.
Load shedding A final variable has been added to the predictive models, that of load shedding. Indeed,
even if it is already used today, thanks to heat storage and by adjusting the demand of some plants, it is
expected that the available capacity and its use will increase in the years to come. In our model, shaving is
a variable that allows to reduce within a limit of 7 GW, the national demand. This limit corresponds to the
estimate proposed by Ademe [20]. The cost of using this capacity is at a price of €300/MW.
6 Empirical results
The model attempts to simulate the functioning of the electricity markets in France and Germany, as well
as their interconnection. Results are only relevant at this scale and do not allow us to imagine further
consequences.
Actors are considered to be rational. The economic logic of "Merit Order" is assumed to apply at all times
and the collusive practices of certain producers to manipulate prices are not modeled. The possible saturation
of intra-national networks is not modeled: it is assumed that the networks are "copper plates" within the
borders. Similarly, the issue of the availability of charging stations for electric vehicles is not addressed, and
the cost of installing these infrastructures, which are necessary for the development of electric mobility, is
not considered.
The number of electric vehicles, the electric production capacities, as well as all the different assumed
costs (investment or operation) are exogenous. The endogenous variables are multiple, here are four of them
particularly interesting to observe:
– Investment in new storage capacity
– Investment in interconnection capacities11 – The physical import-export flows of electricity between the two countries – The possibility of shaving part of the consumption Some of these variables can be fixed to see the effect of an exogenous modification of their values on the model. First, let us look at the results of a raw optimization, where all endogenous variables are free. 6.1 Raw results Assumptions Here are key assumptions used in the analysis : 1. A carbon cost of 60€/ton 2. A maximum investment limit in PHES of 2 GW in France and 6 GW in Germany, due to technical constraints and construction time 3. 10 millions electric vehicles in each country, with a 20% share of battery left available to the TSO Results 2 GW of investment in PHES in France and 6 GW of investment in PHES in Germany are made. Since investment limits are reached, dual values of -900€/MW for Germany and -400€/MW for France are observed. This shows to what extent PHES are profitable and how their spreading lies on other factors than their pure economic value in the elctricity market. An investment of 16 GW of interconnection is made. The situation proposed by the model is therefore that of a copper plate between the two countries, where the French nuclear capacities as well as its hydraulic capacity are put in ribbon. The high flexibility provided by the massive investment in interconnection and storage capacities allows to compensate for the intermittency of the renewable generation, mainly observed in the German grid. The trade balance is clearly positive for France, which exports mainly during the two weeks of mid-season and summer, when German renewable generation is highly uncertain.
12

                                (a) Germany

                                 (b) France

     Fig. 6: Power generation profile of both German and French systems
13
As showed in these graphs, storage technologies are used to smooth the consumption curve when possible,
as well as to reduce the amplitude of peak loads. This effect can be seen at the end of the first week in
Germany (hour 100), when all the power plants are producing and when the use of storage capacities as
producing devices makes it possible to meet a high demand under tough meteorological conditions.
(a) Germany
(b) France
Fig. 7: Optimal storage management strategy in both countries14
The interconnection lines are massively used during the last 2 weeks to compensate the intermittency of
the German renewable capacities.
Fig. 8: Energy exports from France toward Germany, in a 16GW interconnection case
Prices resulting from the coupling of the two markets are close in both countries, as predicted by theory.
Their variability is reduced by the presence of storage capacity.
6.2 Change in the interconnection capacity
Assumptions Here we propose to vary the interconnection capacity between the two countries, with no
taking into account the necessary investment cost. The following graphs allow us to understand the effect of
the interconnection lines between the two countries, by observing the evolution of different variables. When
possible, 3 curves are drawn:
1. The first curve, the darkest, represents a fictitious situation with no storage available. The adjustment
variable for the supply and demand balance is the shaving alone, remunerated at 300€/MWh
2. The second curve represents a more realistic situation where the model is left free to invest in so-called
"conventional" storage means. These storage technologies include PHES, CAES and batteries, but exclude
electric vehicles, which are non-existent here
3. The third curve, the clearest, illustrates a very optimistic case of electric vehicles spreading up to 15
millions units for each country. The results represent a lower bound in terms of network impact. The
EVs management variable is actually calculated to have the least possible impact on the total cost of the
system, and is not based upon a criterion of realistic use by the users
Results The total cost of the system decreases with the available interconnection capacity. The presence
of electric vehicles leads to an increase in cost when the interconnection capacity is limited, but the logic is
reversed as soon as the capacity exceeds approximately 5 GW.15
Fig. 9: Evolution of the total operating cost of the Franco-German power system as a function of inter-
connection capacity
The carbon intensity of the Franco-German electricity mix similarly decreases with the available inter-
connection capacity. Here too, we observe a change in the profitability of vehicle-to-grid. Under 8 GW of
interconnection it seems to increase the overall cost, while it becomes a factor of efficiency with greater level
of connection.
Fig. 10: Carbon intensity of both France and Germany electricity production, regarding to the interconnection
capacity between the two countries for the 3 studied scenarios
While the impact of an increase in interconnection lines on cross-border exchanges seems self-evident, it
is interesting to note the effect of a greater access to storage and the development of electric vehicles. Thus,16
as the following graph shows, France’s export balance is largely strengthened by the development of storage
possibilities.
Fig. 11: Evolution of France’s net exports according to the interconnection capacity with Germany
It may be interesting to quantify the benefit of the Vehicle-to-Grid strategy compared to a scenario of
electric vehicle development that would not be accompanied by any storage possibilities for the TSO. The
graph below shows that whatever the interconnection capacity, the effect is positive, and the benefit increases
with the degree of connection of the two countries, ranging from 2% to 4%.
Fig. 12: Relative cost difference for two scenarios of 15M EVs each, with and with no V2G capacity availbale,
depending on interconnection
Finally, the evolution of the wholesale electricity price observed on the two national markets is studied.
The first result, without the presence of any storage capacity, shows the theoretical result of price convergence
between the two border areas. In this case, France sees its nuclear capacities used increasingly and exports a
large amount of the electricity thus produced to Germany, mainly during the mid-season or summer weeks.
The average wholesale price observed in France increases, as the use of high cost technologies becomes more
frequent. In Germany, the opposite phenomenon occurs, as the country can rely on French nuclear power,
which is cheaper than coal.17
Fig. 13: Evolution of wholesale prices derived from the model in France and Germany, according to the
interconnection capacity between the two countries
The first striking fact is the difference in the amplitude of variation of the two national prices. Thus, in a
case of perfect interconnection, while the presence of storage capacity can lead to a price reduction of nearly
30% in Germany, the French price doesn’t changes much. This difference in price variability can be explained
by the greater need for storage in Germany, due to the presence of more intermittent renewable capacities.
Electric vehicles, while initially causing a price surge in the German system when interconnection capac-
ities are limited, later become a useful flexibility capacity and lead to a price reduction. This dynamic is not
observed in France, where no clear trend is apparent.
The complementarity between the two systems is clearly visible in these results: France acts as a buffer
zone against the significant fluctuations in German production. A scenario in which V2G develop massively
and interconnections are strengthened, as foreseen by the European Commission’s project, we can therefore
expect a form of specialization of the electricity systems. France will see its wholesale prices increase, but
will also experience a strong increase in its commercial profit. Germany, on the other hand, will be able to
rely on available French nuclear power to fill its storage capacities or directly meet its national demand.
7 Discussion
The lack of access to precise and exhaustive data has led us to simplify the type of production units conscript
and the marginal costs considered. Moreover, the sources used to obtain the data are diverse, for the same
country and between France and Germany. These modeling simplifications ultimately make the evolution of
the wholesale price less continuous and more remote from reality.
The lack of access to precise and exhaustive data has led us to simplify the type of production units called
upon and the marginal costs considered. Moreover, the sources used to obtain such information are diverse,
for the same country and between France and Germany. These modeling simplifications ultimately make the
evolution of the wholesale price less continuous and more remote from reality.
Moreover, the choice of a bipartite model is a strong limitation of our modeling. Indeed, trade with
Germany only represents 27% of France’s total trade, and production/demand balancing is carried out on
a larger scale. The results obtained with the chosen simplification must therefore be put into perspective.
Modelling on a European scale could give different results, particularly as regards the choice of installed
interconnection capacity.18
The model makes no distinction between storage medium by use. It performs a simplified economic
arbitration and calls indifferently the 4 selected technologies by simply distinguishing their power, their
response speed to a set point and their efficiency.
As electric vehicles present strong uncertainties of implementation, we have chosen to consider that all
vehicles make their battery use available by default. However, this strong assumption may not be realized by
2035, and the rules of use may be more restrictive, particularly in order to protect owners from the use of
their property.
The fact that our model is totally deterministic is also a strong limitation of our study. Indeed, the
mathematical model created assumes an expected and realized demand over the period studied and thus
performs an economic optimization by knowing in advance the values taken by certain constraints. In reality,
demand is stochastic, which explains the discrepancies between expected and realized demand.
The focus of our study on the short-term Merit Order mechanism alone presents certain pitfalls. Indeed,
this approach does not reflect the involvement of long-term markets and capacity mechanisms in the deter-
mination of prices and the allocation of production capacities. The use of certain technologies that appear to
be contrary to a cost minimization logic is an example of this simplification.
On the other hand, there are auction mechanisms at work on the use of the France-Germany inter-
connection that may contradict the logic of Merit Order or market coupling alone. The selection of certain
market mechanisms to the detriment of others leads to an incomplete determination of the wholesale price,
which therefore differs from reality.
8 Conclusion
The development of renewable energies in European electricity networks is part of an ambitious decarbonisa-
tion strategy, which should also see a number of uses become electrified. This energy transition poses major
challenges, particularly in terms of grid stability and market price volatility. If we consider the development
of renewable supply in Germany and France without increasing transmission capacities between the two
countries, a large spread between the two market prices should be observed. Our study shows how the inte-
gration of electric vehicles through a V2G strategy can be an opportunity for flexibility in grid management.
In the case of a coupling of the German and French markets, a vehicle-to-grid strategy, accompanied by
the development of interconnections, reduces the total operating cost of the electricity system by 2 to 4%,
compared to a similar case of development of electric vehicles but without the possibility of flexibility. Our
results go further by showing that electric vehicles can have a positive effect on the cost of Franco-German
electricity from a certain interconnection capacity threshold of 5 GW, all other things being equal. As with
any storage capacity, electric vehicle batteries, if partly accessible by grid operators, can reduce the volatility
of electricity prices and thus contribute to grid stability.19
References
1. European Commission. Directorate-General for Energy, 2012. Energy: roadmap 2050. Publications Office.
2. Sensfuß, F., Ragwitz, M., Genoese, M., 2008. The merit-order effect: A detailed analysis of the price ef-
fect of renewable electricity generation on spot market prices in Germany. Energy Policy 36, 3086–3094.
https://doi.org/10.1016/j.enpol.2008.03.035
3. Antweiler, W., Muesgens, F., 2021. On the long-term merit order effect of renewable energies. Energy Economics
99, 105275. https://doi.org/10.1016/j.eneco.2021.105275
4. Bibak, B., Tekiner-Moğulkoç, H., 2021. A comprehensive analysis of Vehicle to Grid (V2G) systems and scholarly
literature on the application of such systems. Renew. Energy Focus 36, 1–20.
5. Magdy, G., Ali, H., Xu, D., 2021. A new synthetic inertia system based on electric vehicles to sup-
port the frequency stability of low-inertia modern power grids. Journal of Cleaner Production 297, 126595.
https://doi.org/10.1016/j.jclepro.2021.126595
6. ENTSO-E , 2020, Research, Development and Innovation Roadmap 2020-2030
7. IEA, 2018b. Status of Power System Transformation 2018.
8. Agora Energiewende, 2017. Flexibility in thermal power plants – With a focus on existing coal-fired power plants.
Prognos, Fitchner, Agora Energiewende.
9. ENTSO-E, 2021, Electric Vehicle Integration into Power Grids
10. Perez Y., Petit M. , 2016, “Transmission System Operator Regulation for Electric Vehicle Fleets: A Survey of the
Issues. The Automobile Revolution, Springer“, pp.135 – 146
11. Gnann T., Klingler A.L., Kühnbach M., 2018, The load shift potential of plug-in electric vehicles with different
amounts of charging infrastructure, Fraunhofer Institute for Systems and Innovation Research ISI.
12. Farnoosh, A. (2020). Investment decision making for Energy Transition. Paris, France.
13. Petitet, M. (2020). Le fonctionnement détaillé du secteur électrique et les marchés associés. Paris, France.
14. IEA. (2010). Projected Costs of Generating Electricity.
15. Böing, F., Regett, A. (2019). Hourly CO2 Emission Factors and Marginal Costs of Energy Carriers in Future
Multi-Energy Systems.
16. Schulte, S., Arnold, F., Schlund, D. (2020). Dokumentation EWI Merit-Order Tool 2020.
17. Rte. (2020). Bilan électrique 2019.
18. Laurent Fournié, M. C.-H. (2018). Rapport sur les données utilisées dans le cadre de l’étude « Trajectoires
d’évolution du mix électrique.
19. RTE, 2021, Bilan prévisionnel long terme "futurs énergétiques 2050".
20. ADEME, Artelys. 2019. Trajectoires d’évolution du mix électrique 2020-2060 - analyses complémentaires.
ADEME, Artelys.
21. RTE, 2017, Bilan prévisionnel de l’équilibre offre-demande d’électricité en FranceYou can also read