SASOL - A ROADMAP FOR VALUE DESTRUCTION - Quarterly Strategy Note | January 2020 - ELECTUS
←
→
Page content transcription
If your browser does not render page correctly, please read the page content below
Quarterly Strategy Note | January 2020

SASOL – A ROADMAP FOR VALUE
DESTRUCTION
By Mish-al Emeran

Background

Over the last seven decades Sasol has grown into a globally    construction of the Oryx plant in 2003. Sasol provided
integrated chemicals and energy business with more than        the intellectual property (IP) and technological
30,000 employees working across 32 countries. But it has       expertise, and Qatar the access to cheap gas with its
strong local roots in South Africa (SA) where it was           vast gas reserves. It was a significant capital investment
established in September 1950 as a state-owned company.        ($2.5bn, or around 28% of Sasol’s market capitalisation
It still generates a significant proportion of group revenue   at the time), but Sasol was incentivised with a very
in SA (50%), with the balance across Europe (22%), North       attractive gas off-take agreement that came at a
America (14%), and the rest of the world (14%).                significant discount to the Henry Hub gas price (the
                                                               global benchmark gas price). It resulted in average
Given South Africa’s past, there was a strategic imperative    earnings before interest, tax, depreciation and
by the government of the time to become energy                 amortisation (EDITDA) margins greater than 50% and a
dependent. Sasol was essentially given the license to          return on invested capital (ROIC) greater than 25%. A
develop technologies to convert the country’s vast coal        similar model was employed by Sasol for its other
reserves into liquid fuels, in a local market that was         offshore expansion projects since the turn of the
structured favourably with limited domestic competition.       millennium.
Over the next few decades Sasol developed the world’s first
coal-to-liquids (CTL) technology and constructed a             To understand the Sasol story, one must start with an
significant downstream chemical infrastructure in              assessment of the Board and its structure. Culture and
Sasolburg.     The access to coal reserves, the CTL            strategy are driven from the top, and governance
infrastructure and the downstream chemicals business           principles are set by the Board. A well-functioning
gave Sasol a unique position in the South African market       Board delivers good governance and oversight, which
where it built an integrated business model with high          should lead to good strategy and capital allocation and
barriers to entry, a strong competitive advantage, and         drives corporate decision-making. We believe that a
enjoyed high returns on capital. Sasol essentially had a       Board must have a well-balanced and diverse mix of
legal monopoly on oil production in South Africa. The          skills. As Sasol transitioned from a ‘quasi-parastatal’ in
consistent excess return generation enabled continued          the 1950’s–1980’s to becoming a globally competitive
technological development, and in the 1970’s Sasol             listed company in the 1980’s the structure, required
developed a gas-to-liquids (GTL) technology that led to        skill-set and strategic focus of the Board would have
plant construction and expansion in Secunda. In 1979 Sasol     also changed. On Sasol’s Board there are more
was privatised and listed on the Johannesburg Stock            chartered accountants (five) than members with in-
Exchange. During the 1980’s and 1990’s local expansion         depth liquid fuels and chemicals experience (three). In
continued, and product development focused on synthetic        our view this was misaligned to the strategic priorities
fuels and the wider chemicals complex.                         of the business at a time when Sasol was executing a
                                                               material international growth strategy into chemicals.
The GTL technology opened the door to expansion on a
global scale. Sasol focussed on fast-growing emerging
market economies in the Middle East and Asia, notably a
joint venture with the Qatar government with the
                                                           1
A look at Sasol’s share price history in Chart 1 below paints      These competitive advantages meant Sasol enjoyed
an interesting picture and highlights a distinct period of         dominant positions in the markets where it operated,
change in its value proposition. Up until 2014 its share price     generating historic returns-on-capital and returns-on
                                                                   equity better than most of its peers (see Chart 2).
was on an upward trajectory and a good proxy for the rand
oil price, reaching a high of R632 per share in June 2014. The     Chart 2 - Sasol long-term average ROE vs Peers
fall from its peak coincided with the fall in the oil price from
around $115 per barrel and the start of its North American
Lake Charles Chemicals Project expansion strategy (LCCP),
which was characterised by capital overruns and poor
execution.

These corporate decisions all impact the underlying
fundamentals of Sasol’s value – cash flow, growth, ROIC and
risk. In the rest of this note we look at some of the strategic
decisions taken by Sasol to drive value (destruction) through
growth and diversification          initiatives, the reasoning
                                                                   Source: Quest, Electus Data
therefore, and the resultant impact on Sasol’s valuation.
                                                                   As the business matured, economies opened up, and
The hubris that led to the expansion in chemicals via the LCCP     global energy and chemical markets were evolving, the
was the trigger for Sasol’s fall from grace, which has been        search for growth and diversification inevitably led Sasol
remarkable due to the magnitude and speed of the decline.          into new geographies with more competitive markets,
                                                                   higher operational risks, where its sustainable advantages
After peaking at a market capitalisation close to R425 billion
                                                                   were not as clear-cut.
in 2014, the company has managed to lose around R265
billion in value since, currently trading at a market              But Energy and Chemical markets are evolving with
capitalisation of around R160 billion.                             uncontrollable risks

Chart 1 - Sasol share price history (log scale)                    Oil market getting close to peak demand

                                                                   Over the last decade energy demand growth has been
                                                                   around two to three percent per annum, closely tracking
                                                                   global economic growth. Going forward this relationship
                                                                   is expected to decouple, with energy demand growth
                                                                   decelerating as the world moves toward peak oil demand,
                                                                   which is expected over the next two decades. There are
                                                                   several reasons for this, the most significant being:

                                                                   • The shape of GDP growth is changing – the last decade
                                                                     saw rapid industrialisation, initially in the West (pre-
Source: Factset, Electus Data
                                                                     2000) and more recently in the East (read China post
                                                                     2000). In future we are likely to see more services-
Historically built strong moat – from sustainable                    orientated global economic growth. The energy
competitive advantages through high barriers to entry and            needed for services is inherently less than that needed
access to cheap feedstock.                                           for rapid industrialisation.

Historically Sasol’s operations were focused in developing         •   Improvements in energy efficiency continue to drive
markets, and it was able to obtain favourable terms for                down overall demand for energy.
providing its technology, IP and expertise to unlock the
economic potential of the countries in which it operated           • Electrification – demand for electricity is increasing as
(across Africa, Middle East and Asia). For six decades it            everything we use is being electrified (e.g. electric
operated with these advantages, in relatively closed                 vehicles). But at the same time the proportion of
economies, protected from external competition, with high            electricity production from renewable sources is
barriers to entry (high capex costs and regulation) and              increasing steadily, implying decreasing demand for
sustainable competitive advantages (low feedstock costs).            fossil fuels. Currently renewables account for around
                                                              2
25% of total power generation globally. This is                and low-cost ethane in the United States) as big oil
   forecast to increase to around 75 percent by 2050.             players try to take advantage of the higher growth rates
                                                                  in the petrochemicals market, relative to energy.
• Decarbonisation – the harmful effects of greenhouse             According to the International Energy Agency, one third
  gases (GHG) on the environment is sharply in focus today        of oil demand between 2017-2030 is expected to be
  and the fossil fuel industry is under significant pressure      driven by petrochemicals.
  due to the role it plays as a chief polluter. In the Paris
  Agreement of 2015, member states agreed to limit global         The petrochemical production process is derived from
  warming to 2° Celsius above pre-industrial levels. This         either a gas-based feedstock (ethane or methane) or oil-
  would imply reducing GHG emissions by 80 to 95 percent          based feedstock (naphtha), which has important
  of the 1990 level by 2050. As industry accounted for            implications for supply fundamentals and drives long-
  about 28% of global GHG emissions in 2014, it follows that      term sustainable pricing.
  these targets cannot be reached without decarbonising
  industrial activities – which implies further pressure on oil   The shale fracking revolution in the US has led to an
  demand growth.                                                  abundance of ethane gas over the last two decades,
                                                                  which is produced as a by-product in shale fracking
Given the decarbonisation risks and the electrification           production. This excess ethane supply has driven the
revolution, oil companies are turning more to                     price down, making it relatively cheap. An ethane
petrochemicals to secure current revenue streams and              cracker processes ethane gas (or ‘cracks’ it) into
growth. As competition increases, margins are likely to come      ethylene and other derivative products. Therefore, US
under pressure.                                                   petrochemical producers have benefitted from using
                                                                  low-cost gas feedstocks (ethane) instead of oil-based
Petrochemicals market still expected to grow relatively           feedstocks (naphtha) in the production process, placing
strongly                                                          them in a highly cost-advantaged position and on the
                                                                  low-end of the global ethylene cost curve (see Chart 4
Petrochemicals are chemical products derived from                 below). This advantage was most pronounced during
petroleum via a refining process. 80% of petrochemical            the period of high crude oil prices that ended in mid-
building blocks are used to produce plastics.                     2014.

Polymer resin, commonly known as plastic, has been the            Historically, the oil price drove chemical prices through
world’s fastest growing major material since the 1970’s,          naphtha, which accounts for more than 60% of global
essentially driven by China. As depicted in Chart 3 below,        petrochemical production. Shale oil has a higher yield of
global polymer production (which includes ethylene and            the lighter refinery products per barrel of oil, namely
polyethylene) has outperformed all major materials, growing       naphtha and gasoline than medium-to-heavy crude
10x since 1971, or 2.3x more than global DGP.                     grades (typically by OPEC countries). Increasing US Shale
                                                                  oil production has created an oversupply of naphtha,
Chart 3 - Demand growth of major materials                        which coupled with declining naphtha demand (as
                                                                  natural gas liquids displace naphtha as a feedstock in
                                                                  petrochemicals production), has weighed on naphtha
                                                                  pricing, and therefore chemicals pricing.

                                                                  The Shale rush resulted in a 25% increase in US
                                                                  petrochemicals capacity, and in our view two key
                                                                  structural shifts in the market:

                                                                  1. A decline in long-term sustainable chemical prices as
                                                                     higher cost naphtha production gets displaced, and
                                                                     naphtha price declines due to excess naphtha from
                                                                     Shale oil production.
Source: SBGS

                                                                  2. A lower correlation between chemical prices and oil
More recently, annual growth of polymer demand has
                                                                     prices (as the proportion of gas-feedstock
fallen from a historic range of 6-8% (pre-2010’s) to 4-5%
                                                                     production increases).
(post 2010’s) as GDP growth in China slowed. Though
demand growth has been slowing, supply growth has
continued unabated (driven by China, the Middle East,

                                                             3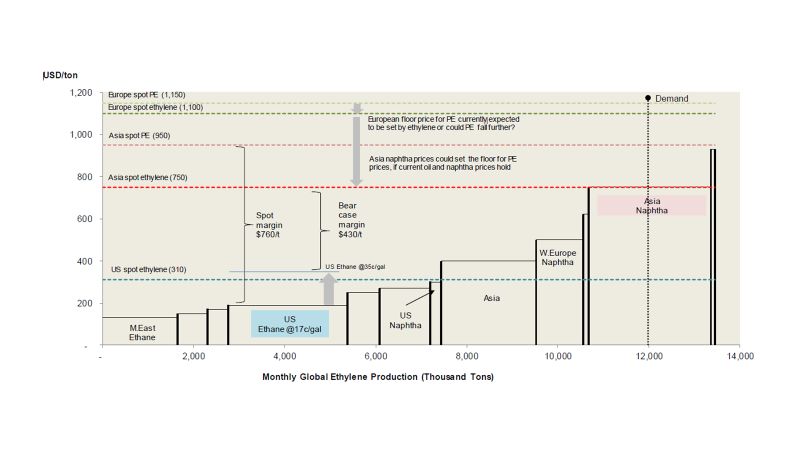
Chart 4 - Global ethylene cost curve

 Source: SBGS

  A cost differentiation strategy has been the key source of       Chart 5 - Margin Erosion in Petrochemicals
  value creation in the chemicals industry, but since 2014
  that opportunity has been declining and margins have
  been eroding (see Chart 5 below), due to:

 •    Growing supply - oversupply weighing on prices and
      leading to margin erosion. Pricing pressure from new
      low-cost supply as 60% of new ethylene supply is
      expected to derive from low-cost ethane in the Middle
      East and US. The growth in supply at the low-end of the
      cost curve is likely to displace higher cost Chinese (CTL)
      and Asian (naphtha) producers, which implies a lower
      marginal cost of production, lower prices and therefore
                                                                   Source: ICIS; HIS; McKinsey Chemical Insights; McKinsey analysis
      lower margins.
                                                                   Strategic Response - Sasol’s Big Bet: Lake Charles
  • Slowing demand – as petrochemical markets mature
                                                                   Chemicals Project (LCCP)
    and the global push towards lower usage of plastics
    gains momentum.
                                                                   Rationale
                                                                   In theory the expansion of the Lake Charles Chemicals
                                                                   Project in Louisiana, USA, made sense: low-cost
                                                                   differentiation, better relative demand growth for
                                                                   chemicals versus oil, diversification, reducing overall
                                                                   exposure to highly pollutive CTL technology and
                                                                   Environmental, Social and Governance (ESG) risks. But
                                                                   the project execution and cost delivery proved very weak,
                                                                   and most importantly the limited sustainable competitive
                                                                   advantages have had material implications for the Sasol
                                                                   investment case.

                                                               4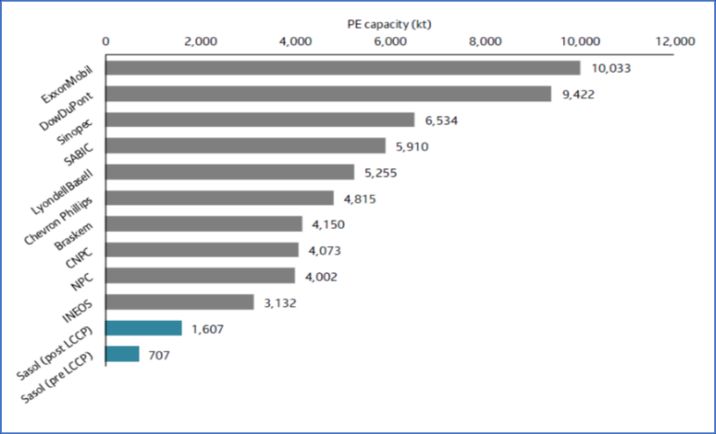
The US cost advantage is due to cheap natural gas                 and running the competitive advantage will be very
liquids used as a feedstock in the manufacturing of               limited.
petrochemicals. The primary feedstock is ethane, which
is used in the production of ethylene.                            In response to the spike in project costs and the
                                                                  negative impact on group profitability from the sharp
60% of global ethylene is used to manufacture                     decline in the oil price post mid-2014, Sasol initiated a
polyethylene, which is used for plastic packaging. Sasol          ‘Business Response Plan (BRP)’ to cut operational and
has added 1.1 million tons per annum (mtpa) of                    capital costs on existing operations. An unintended
polyethylene capacity through the LCCP, in a 400mtpa              consequence of this has been:
market.
                                                                  i. a negative change in culture and an increased risk of
Material cost overruns and poor execution                            key employee losses as salaries were frozen and
Sasol’s LCCP cracker project in the US Gulf is expected              bonuses reduced, and
to more than double group polyethylene capacity to
1.6mtpa and generate around $1 billion in EBITDA by               ii. increased risks to the long-term integrity of
financial year to June 2022. There have been several                  operating assets if maintenance capital spending is
new cracker projects in the US as global oil majors try to            cut too deep, which decreases the operational
secure their position on the low-end of the cost curve.               potential of the assets and increases costs.

Sasol is materially smaller than the largest producers of         Misguided assumptions
polyethylene such as ExxonMobil, DowDuPont and                    Project sign-off could not have been at a worse time,
SABIC (see Chart 6 below), and its cracker came at a              when the oil price was trading above $100 per barrel
significantly higher capital cost. Initial cost projections       and the Henry Hub gas price was around $4 per metric
started at $8.9 billion when the project was first                million British thermal unit. Project economics
approved in October 2014, but escalated to $11.0 billion          assumed inflated (in hindsight) long-term pricing
in June 2016, $11.1 billion in November 2016, $11.8               assumptions which generated a return on capital
billion in February 2019, and $12.9 billion in May 2019.          exceeding Sasol’s hurdle rate of 10.4% (in US dollar
The initial total expected cost was c.27% of Sasol’s              terms). Spot oil is now much lower at around $60 per
market capitalisation at the time and was $3 billion              barrel, chemical margins are structurally lower due to
more expensive than comparable ethane crackers in the             overcapacity, and capex is higher. The forecasted
region.                                                           internal rate of return on the project is now 6%-6.5%,
                                                                  well below the company’s weighted average cost of
Chart 6 - Polyethylene capacity of major players                  capital (WACC) – clearly a destruction of shareholder
                                                                  value.

                                                                  The deterioration in petrochemical spreads have led to
                                                                  significant risks to the LCCP project’s profitability and
                                                                  amplifies the execution risks.

                                                                  Implications of poor capital allocation and lack of
                                                                  Board oversight – A declining moat and lower
                                                                  sustainable return on capital
Source: SBGS
                                                                  The net effect of the LCCP expansion does not make for
Beneficial operation of the cracker was first expected in         good reading:
2018 but due to several construction and weather-
related delays, completion was pushed out to 2020.                • Declining profitability and capital inefficiency from
                                                                    cost overruns and execution misses (see Chart 7
The irony is that the cost-differentiation opportunity              below).
over the last decade was at its peak in 2014 when the             • Reduced balance sheet flexibility due to ballooning
project was approved but has been declining ever since,             debt levels. A debt/equity ratio greater than 50%
and by the time Sasol eventually gets the cracker up                (versus a net cash position pre-LCCP expansion).
                                                              5
• Investment credit rating and dividend at risk for the inflicted due to poor capital allocation and poor execution.
next 2 years.
• Expansion into highly competitive markets and less Sasol is now arguably in the weakest position in its
sustainable competitive advantages versus the history and cannot afford any more mistakes, with the
past implies a lower average sustainable return on following factors in place:
capital and therefore a lower quality investment
proposition. • Balance sheet stretched
• ESG concerns are rising
Chart 7 – ROIC vs Capex • Dividends are at risk over next 2 years
• Sustainable return on capital is structurally lower
• Management credibility is questionable
• Risks to long-term integrity of assets
• Historically low EBITDA margin and capital
inefficiency.
When a company’s share price falls as much and as
quickly as Sasol’s has (see Chart 8), it is easy to avoid until
the risks dissipate. But sometimes that presents the
perfect buying opportunity. Sasol’s expansion into the
LCCP proved to be disappointing for several reasons -
Source: Factset, Electus Data poor timing, poor execution and poor allocation of
capital, but in our view that value destruction is more
In our view a lack of sufficient technical skills and
than reflected in the current share price, which is trading
accountability from the Board has been a key contributor
below R300 per share.
to the position Sasol finds itself in.
Chart 8 – Sasol share price vs JSE ALSI – last 10 years
ESG factors are becoming increasingly important. Sasol’s
CTL process emits far more carbon dioxide per barrel
(c.1,000kg) than conventional oil extraction and refining
(c.20-60kg per barrel) and Secunda is reputably the
largest single-site carbon dioxide emitter globally at
around 57 million tons per annum (equivalent to the total
emissions of most medium-sized European countries like
Portugal, Hungary or Norway). The South African carbon
tax rate is well below global levels, and it is likely that
carbon taxes will be raised, placing additional real costs
on the business. Source: Factset, Electus Data
The environmental cost burden is rising - South Africa’s More significantly, in our view, is the change that the
carbon tax rate is legislated at R120 per ton. Pre-2022 LCCP capital allocation decision has had on the quality of
there are numerous allowances which result in a net rate Sasol’s investment case. Historically Sasol had a strong
of between R6-48 per ton. Assuming R120 per ton, Sasol’s moat, driven by a sustainable competitive cost advantage
2019 carbon dioxide equivalent emissions would’ve from access to low-cost feedstock. This resulted in high
equated to a cost of roughly R6.6 billion, with risk to the returns on capital, profitability and capital efficiency, and
upside. Sasol is also yet to publish a comprehensive even though Sasol operated in a volatile commodity
emission reduction plan, which is the Board’s market it performed better than most peers. The
responsibility. chemicals expansion led to a significantly weaker overall
moat for the business, as Sasol expanded into highly
Conclusion competitive markets with lower sustainable margins and
Over the last decade Sasol has created the perfect storm dwindling competitive advantages, which essentially
for value destruction. Admittedly weaker oil markets implies a lower sustainable average return on capital
had an impact, but Sasol’s problems were mostly self-
6relative to its past and therefore a lower quality economy and the oil price is very muted and uncertain,
investment case. and consequently there is a high degree of forecast risk
for Sasol. While there is good potential upside off current
A supportive macro backdrop is necessary to restore spot levels of R260 per share to our Electus valuation of
Sasol back to its prime. In our view there are positive just over R400 per share, in order to manage the forecast
near-term drivers for value creation from the LCCP risks we only hold a 2% weighting in Client funds.
ramp-up into 2020 and thereafter from an improving
balance sheet. However, the outlook for the global END.
ELECTUS FUND MANAGEMENT
OVERVIEW
by Neil Brown and Richard Hasson
Electus Fund Management Overview
As discussed previously, Electus incorporates our macro In Q4 2019, we saw a maturation process of the USA and
frameworks of targeted “top-down” global and South China Trade War, with the completion of the so-called
African research, with our broad and in-depth “bottom- Phase 1 deal and the unlikelihood of further “phased”
up” industry and company specific research. This deals before the USA Presidential Election in November
enables us to have our own “normalised” forecasts and 2020. This has brought some stability and certainty to
valuations, allowing us to build “risk managed” Funds on global financial markets, even though the global
a “bottom-up” basis, normally consisting of ±30 JSE economic slowdown remains evident and a global
listed shares. recession is a strong possibility during mid/late 2020.
The flat bond yield curves in Developed Markets remain,
The Electus managed Funds are managed as style as do zero or negative yields on 10-year Government
agnostic and diversified Funds, with the goal of strongly Bonds in key countries such as Japan, Switzerland,
growing clients invested capital over the longer-term. In Germany and France, while Italy remains in structural
order to deliver this strong capital growth, we have a trouble as the 3rd largest economy in Europe.
positive bias towards investing in best-in-class
companies that are managed by proven management Since January 2019 the USA Federal Reserve has
teams and are trading at attractive valuations. The become very “market friendly”, with interest rate cuts
Funds are market capitalisation (size) indifferent in their and liquidity stimulation, providing strong support to
share selection, normally having meaningful exposure financial markets and offsetting the disappointingly flat
to high quality, mid-sized, but market leading, South aggregate earnings growth. Equity markets were strong
African financial and industrial businesses. in 2019 and also rose strongly in Q4 2019, but most
Developed Market and Chinese equity markets have
Financial Market Overview become increasingly dependent on rate cuts and
stimulation to support their now moderately over-
Global Financial Markets: priced levels.
As mentioned previously, the quantitative easing in
developed markets post the GFC in 2008 created a great South African Markets:
deal of “investor complacency”, with borrowers of “free In terms of South Africa’s economy, it is very positive
capital” becoming too aggressive in their investment that corruption is being tackled in SA and that the 5-
strategies, highlighted by an ever-increasing yearly General Election is behind us. However, while
misallocation of investors’ capital. Household balance President Cyril Ramaphosa has received a stronger
sheets are in good health, but corporate and mandate, we still believe that SA requires positive
government balance sheets are over-indebted, and the structural changes around State Owned Enterprises
quality of the much-increased USA and European (SOE’s), especially Eskom, as well as education, skills,
corporate debt is very poor. productivity and labour flexibility. Only if these positive
structural changes occur, together with a more muted
public sector wage growth rate, will it enable SA to have
an economic platform where the country can have a
sustainable annualised GDP growth rate of >2%.
7rate cuts and ongoing stimulation. However, while
In Q4 2019, the broad JSE indices followed global the SA economy is weak and suffers from Eskom
markets and rose by about +5%. While the SA economy related power and debt issues, we believe that there
is weak and suffers from Eskom related power and debt are many attractively priced, and well-managed, SA
issues, we believe that there are many attractively mid-sized industrial companies. Based on our
priced, and well-managed, SA mid-sized industrial bottom-up aggregation of company valuations, the
companies. Based on our bottom-up aggregation of main JSE indices are now trading 16% below their
company valuations, the main JSE indices are now appropriate price levels, although on an equally
trading 16% below their appropriate price levels, weighted market-cap basis, the average company on
although on an equally weighted market-cap basis, the the JSE is 27% undervalued. The well-diversified
average company on the JSE is 27% undervalued. Electus Funds currently have upside of 52%, which
suggests well-above average absolute and relative
Fund Performance prospective returns.
It should be noted that Electus staff have always As we wish to maintain a high level of Active Share
analysed companies and managed Client funds on a and Tracking Error risk in the Electus Funds, we
very consistent and disciplined basis. For the Long currently only hold 25 companies, with all shares
Funds, this is how we have managed to obtain absolute having a targeted weight of >2.0%. This clear focus
returns of 14% pa, as well as excess returns vs the JSE’s and positioning, with suitable diversification and
broad indices and our Peers, of ±1.2% pa for our strong risk management, enables us to target excess
unbroken 18-year track record, including our 4 past returns for clients from specific share selection and
years as an “independent” Electus. Importantly, this not from sector selection. The Electus Funds are
excess return in the Client funds has come with our currently 97% invested in South African listed
proven “risk management”, which is highlighted by equities and we always target being >98% invested.
having best-in-class low levels of volatility and
downside-risk metrics. The key changes in the Electus Funds in Q4 2019
were the sales of Standard Bank, Liberty Holdings
Our Electus Long Short Equity Hedge Fund had a and the NewGold ETF. With the proceeds we bought
disappointing 2019 returning -1.9% net of fees. The new positions in the underperforming and
JSE’s Small Cap index, where we have a large part of our undervalued Old Mutual, Hammerson and City
net exposure due to compelling valuations, continues to Lodge. Purely for global risk management purposes
be ignored by the market, returned -4.1% over 2019 we also bought a small new position in AngloGold
underperforming the JSE Capped SWIX index which Ashanti.
returned 6.8% in 2019. Our Electus Long Short Equity Retail Investor Hedge
Fund has been restructured to follow a market neutral
With our Electus team being solely focused on based hedge fund strategy, focussing more on “rump
researching and managing SA equities, we have an trades” and “pair trades”. The fund remains well
excellent understanding of 120 SA listed companies, diversified with 23 long positions and 13 short
many of which are quality mid-sized, but market positions. We do however remain open to managing
leading, South African financial and industrial new Long Short Hedge Fund segregated mandates for
businesses. Through our small asset size and research clients that require such product.
focus, we believe that our ability to selectively invest
across quality mid-sized South African financial and Responsible Investing and Corporate Governance
industrial businesses will be a key differentiator for
Electus and its Client funds in the coming years. The Following the Steinhoff collapse in December 2017,
historic strong absolute and relative performance of the the ongoing Resilient related issues and the
Client funds have been helped by these quality mid- suspension of Tongaat due to its historic financial
sized companies, such as the above-mentioned accounting and auditing issues, the Electus Funds will
Combined Motor Holdings (CMH), Hudaco and Italtile, not even consider investing into these shares.
which have all been held in Client funds for over 15
years. Pleasingly, in Q4 2019, our ongoing collaborative
approach to the JSE regarding fuller disclosure of share
Fund Positioning trading by company directors, in terms of personal
shares being used as “security”, was successful. During
Following its strong price performance during Q4 and Q4 2019 we interacted collaboratively with the JSE in
also for 2019, there is very little value to be found in attempting to get Naspers and Prosus “capped” as one
the USA equity market, especially as Developed combined entity in the JSE’s Capped benchmarks.
Markets and China still seem very reliant on interest Sadly, we were unsuccessful in this endeavour.
8Chart 8:
Long-Term Performance History vs Peers
Nedgroup Investments Growth Fund (Unit Trust) to 31.12.19
Excess Return pa vs General Equity Unit Trust Peer Group of 1.1% (Net vs Net)
Since managed by Neil Brown and Richard Hasson Source: Morningstar and Electus
Chart 9:
Long-Term Performance History vs JSE
Nedgroup Investments Growth Fund (Unit Trust) to 31.12.19
Excess Return pa vs FTSE/JSE Capped SWIX of 1.3% (Gross vs Gross)
Since managed by Neil Brown and Richard Hasson Source: Morningstar and Electus
9Electus Fund Managers Proprietary Limited (Reg No 2014/268056/07), an authorised financial services provider (FSP 46077) approved by the Financial Sector Conduct Authority
(www.fsca.co.za) to provide intermediary and advisory services in terms of the Financial Advisory and Intermediary Services Act, 37 of 2002. Electus Fund Managers Proprietary Limited
(“Electus”) has comprehensive crime and professional indemnity insurance. For more detail, as well as for information on how to contact us and on how to access information please visit
www.electus.co.za.
The content and information provided are owned by Electus and are protected by copyright and other intellectual property laws . All rights not expressly granted are reserved. The content
and information may not be reproduced or distributed without the prior written consent of Electus. The content of this presentation is provided by Electus as general information about the
company and its products and services. Electus does not guarantee the suitability or potential value of any information or particular investment source. Market fluctuations and changes in
rates of exchange or taxation may have an effect on the value, price or income of investments. Since the performance of finan cial markets fluctuates, an investor may not get back the full
amount invested. Past performance is not necessarily a guide to future investment performance. The information provided is not intended nor does it constitute financial, tax, legal,
investment, or other advice. Nothing contained in the presentation constitutes a solicitation, recommendation, endorsement or offer by Electus, but shall merely be deemed to be an
invitation to do business.
Electus has taken and will continue to take care that all information provided, in so far as this is under its control, is true and correct. However, Electus shall not be responsible for and
therefore disclaims any liability for any loss, liability, damage (whether direct or consequential) or expense of any nature whatsoever which may be suffered as a result of or which may be
attributable, directly or indirectly, to the use of or reliance upon any information provided.
CONTACT DETAILS:
GREAT WESTERFORD BUILDING, 240 MAIN ROAD, NEWLANDS, CAPE TOWN 7700
TELEPHONE NUMBER: +27 21 680 7500
WEBSITE ADDRESS
www.electus.co.za
10You can also read