2017 Half Year Results Announcement - Caltex Australia Limited ACN 004 201 307
←
→
Page content transcription
If your browser does not render page correctly, please read the page content below

2017 Half Year Results Announcement

Caltex Australia Limited
ACN 004 201 307
AGENDA
         Operational Excellence Moment
         Half Year 2017: Key Highlights
         Strategy Update
         Financial Highlights
         Supply & Marketing Highlights
         Lytton Refinery Highlights
         Financial Discipline
         Result Take-Aways & Short Term
         Priorities
         Q&A
         Appendices

                                          2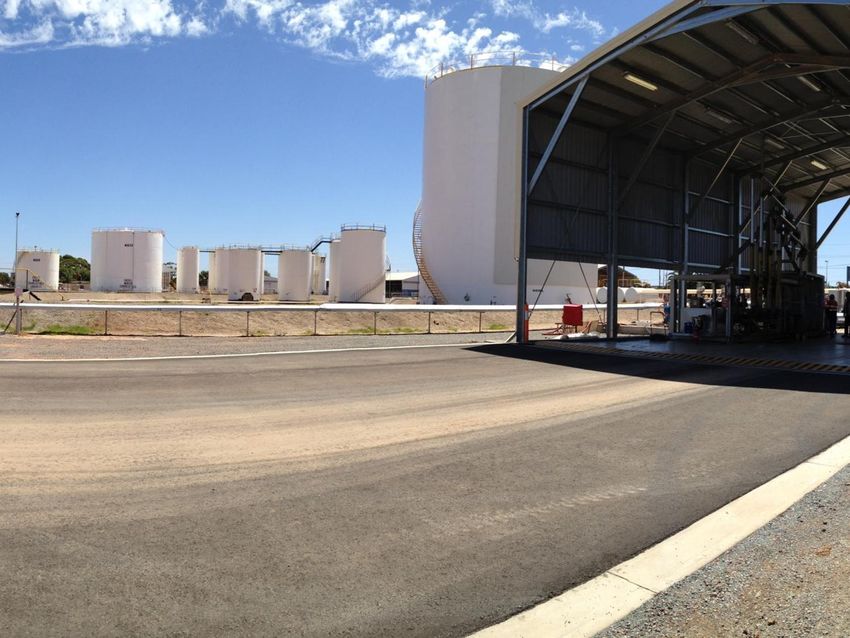
Operational Excellence (OE) Moment
Personal and Process safety Performance

                                    •   Continues to deliver leading performance in personal
                                        and process safety in Australia, whilst maintaining an
                                        unrelenting focus to continuously improve

                                    •   Strong Lytton Turnaround safety performance

                                    •   Process Safety performance continues to be strong

                                    •   Business performance in hydrocarbon spills has
                                        improved significantly in the last three years, due to:

                                          o    Increased senior leadership focus and
                                               commitment
                                          o    Effective engagement and ownership by line
                                               management
                                          o    Development and execution of effective ‘spill
                                               prevention plans’ to achieve clearly defined
                                               objectives

                                                                                                  3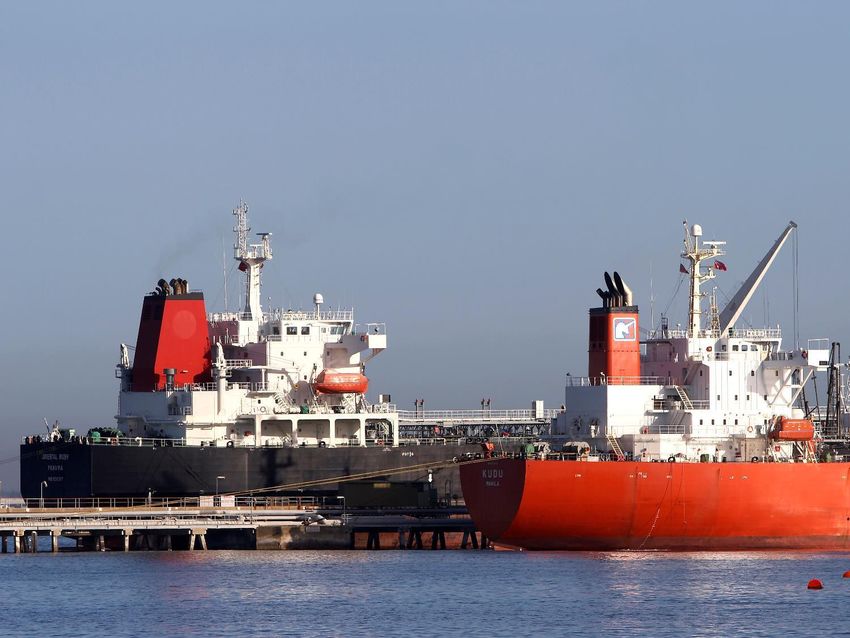
AGENDA
         Operational Excellence Moment
         Half Year 2017: Key Highlights
         Strategy Update
         Financial Highlights
         Supply & Marketing Highlights
         Lytton Refinery Highlights
         Financial Discipline
         Result Take-Aways & Short Term
         Priorities
         Q&A
         Appendices

                                          4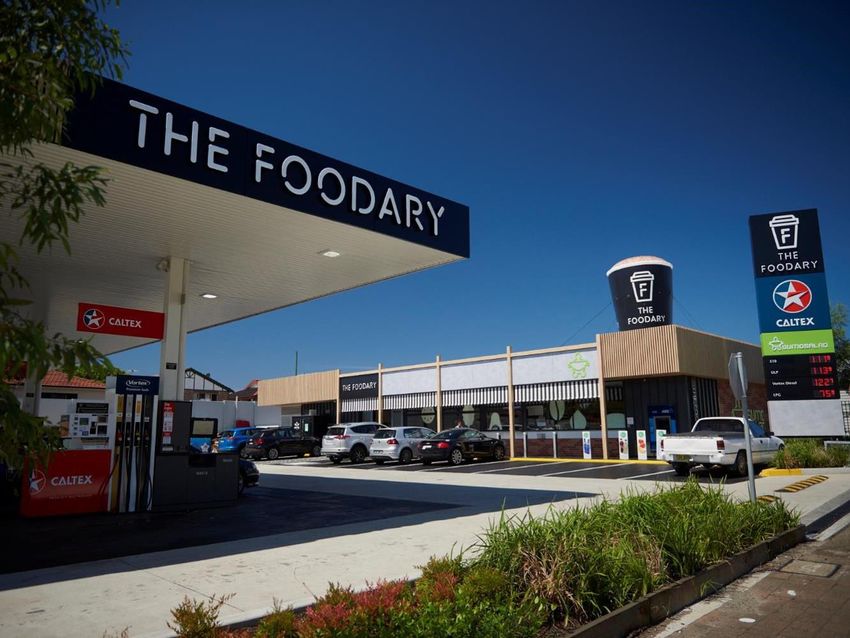
Key Highlights
Half Year 2017 Results Summary
Consolidated Group Result RCOP NPAT $307 million. Supply and Marketing growth continues, Lytton continues strong
RCOP NPAT $307 million up 21% operating performance.
Interim dividend 60.0 cps declared (HY 2016: 50.0 cps) fully franked (51% payout;
Earnings per share up 23% guidance 40% - 60%)
Dividend per share up 20% $95 million Milemaker acquisition completed
$325 million Gull NZ acquisition received regulatory approval, completed post 1H17.
Initial cost savings of ~$60 million identified (to impact 2018 and beyond). Further cost and
efficiency benefits expected to be identified in 2H17.
Balance sheet remains strong (20% gearing; lease adjusted 34% pre-Gull NZ purchase)
Integrated transport fuel supply chain and convenience retail business continue to drive
Supply & Marketing
value. Review of operating model to reflect strategic direction
RCOP EBIT $377 million
Overall sales volumes maintained in a challenging market
Sales volume growth continues across total premium products, whilst base unleaded petrols
Includes net unfavourable externalities continue to decline
of $4 million Jet volumes up 5%
× Non-Fuel income down in the short term due to impact of transition of around 80
Strong underlying EBIT growth franchised sites to company operations (lower royalties and other franchise fees as well as
incurring costs to convert sites)
Lytton refinery RCOP EBIT $149 Lytton refinery EBIT of $149 million, up $57 million
million Refiner margin up US$2.49/bbl to US$12.59/bbl
Strong operational performance continues. Sales from production 3.0BL (HY 2016: 2.9BL)
Strong operational performance leverages Good cost control continues. Planned maintenance and modification of the BHU completed
higher refiner margins.
ahead of schedule and on budget
5
AGENDA
         Operational Excellence Moment
         Half Year 2017: Key Highlights
         Strategy Update
         Financial Highlights
         Supply & Marketing Highlights
         Lytton Refinery Highlights
         Financial Discipline
         Result Take-Aways & Short Term
         Priorities
         Q&A
         Appendices

                                          6
Strategy Update
Two businesses and cultures emerging, both with significant growth options

                                                                        7
Strategy Update
Protect and Grow
                             •   Newport terminal Phase 1 upgrade on time, on budget. Forecast completion end
                                 2017 (approx. $70m)
   Optimise                  •   Kurnell decommissioning & demolition program progressing - on time, on
                                 budget. Total Kurnell transformation project remains on plan (expected
   infrastructure position       completion 1H18)
                             •   Gull NZ acquisition includes largest product import terminal in New Zealand (Mt
                                 Manganui) - completed July 2017

                             •   Ampol Singapore continues to further optimise the integrated value chain:
                                   •     Leveraging Caltex infrastructure positions (e.g. Kurnell terminal) and
                                         optimisation around our Lytton refinery; and
   Grow trading & shipping         •     Expanding regional trading and shipping opportunities following Gull NZ
                                         acquisition (e.g. assessing larger term ship chartering options)
   capability
                             •   Continuing to assess regional growth opportunities. Leveraging system
                                 optimisation to facilitate product sales made to NZ, first cargo sold to Philippines
                             •   Improved commodity risk management activities to improve earnings and reduce
                                 cash flow volatility

                             •   Integration of B2B with Supply to drive integrated value
                             •   Implementation of new pricing tools to create a more informed and dynamic
   Serve customers to            approach to pricing
   protect                   •   Consolidation of distributor operations amongst a smaller and stronger set of
   and grow the supply           distributors
   base                      •   Enhancements to card offer (e.g. Qantas Business Awards, digital solutions)
                             •   Milemaker acquisition (completed May 2017) secures retail fuel supplies

                                                                                                                  8
Strategy Update
Extend
• Fuel pricing transformation through new pricing capabilities, strategies and tools
• Use of behavioural economics to drive consumer fuel buying behaviour (“Good”,
Enhance the fuel “Better”, “Best” fuels)
retail customer
• Launched refreshed StarCard offer with Qantas Business Rewards
offering
• Milemaker acquisition (completed May 2017) addresses previous underweight
Melbourne position. Identified 15-20 sites suitable for potential Foodary upgrade
• Identified the opportunity to create a “new” convenience offering and experience.
Opportunity confirmed via completion of detailed internal review
• Petrol & Convenience (P&C) market approx. $8.3 billion, (+$350m or +4.5%)
(2016) with consumers shopping more frequently with a “time save” focus
Create new customer Historic growth (last 5 years): 3.4% to 4.5%;
solutions in the Market remains under developed versus international markets (e.g. UK, Japan)
Only $1 in $5 of today’s convenience spend is in Petrol & Convenience (P&C)
convenience segment
marketplace Fastest growth category: Fresh food to go
• Caltex is well placed with an advantaged physical network made up of around 850
Market Opportunity sites with a large retail customer base (~3m weekly customer transactions) and
current (non-fuel) retail sales of around $1.1bn. p.a.
• Good progress in building retail capable team (EGM – Convenience Retail, GM Retail
Operations, GM Convenience Development, GM Merchandise, appointment of new
GM Pricing)
9
Strategy Update
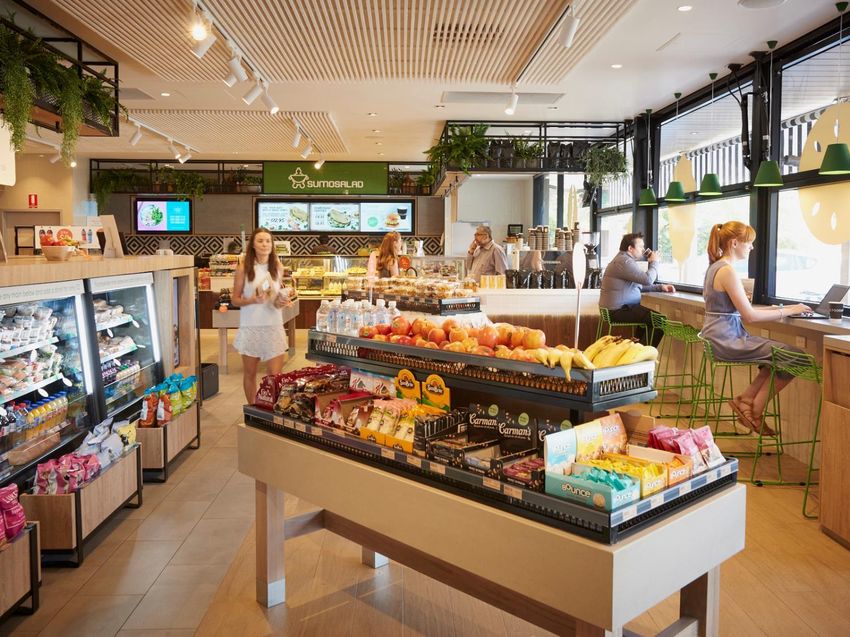
Create new customer solutions in the convenience market place - moved from strategic thinking to “test & learn” pilot phase
• Foodary sites (10 sites to August 2017) rolled out across different geographies: Concord, Padstow,
Bomaderry (NSW), South Yarra, Horsham and Beaufort (Victoria), Dry Creek and Holden Hill (SA),
Cockburn and Ascot (WA)
• Store sales uplift from new Foodary stores between 20% and 50% (including regional sites)
• Strong acceptance of fresh food (20-25% of in-store sales) and barista coffee offer
• Initial average fuel volume growth +2% to +3%
• Quick Service Restaurant (QSR) partnerships:
Boost Juice;
Progress to Date Guzman Y Gomez;
Sumo Salad
• Some initial supply chain inefficiencies (scale, experimentation);
Fresh product shrink rates; labour model
• Mixed performance across services offer
• Acquisition of Nashi (high street retailer)
• Investment in food preparation capability
• Sensible, measured approach to implementation and capital commitment
• Roll out pilot sites over 12 months from March 2017 within a “Test and learn” environment to prove
Next steps up concept before wider roll-out. Another 10 pilot sites targeted during 2H 2017
• Some new high street Nashi stores opening in Sydney 2H 2017
• Long-term growth opportunity, leveraging Caltex’s assets & capabilities with modest capital
commitment during “test & learn” phase (Strategy Update
Proposed sale of Woolworths fuel business to BP
• Woolworths has announced the sale of its fuel business to BP, subject to regulatory approval
• Caltex’s 3.5 billion litre fuel supply arrangement with Woolworths is linked to Woolworths’ continued
ownership of the business
• ACCC Regulatory Review underway:
Review commenced 15th March 2017;
Statement of Acquisition Issues released 10th August 2017;
ACCC Findings announcement proposed 26th October 2017
• Areas of direct earnings exposure, identifiable across three areas:
i. Loss of wholesale marketing margins on the net volume loss;
ii. Impact on Ampol sourcing benefits; and
iii. Fixed cost recovery
• Estimated annualised EBIT impact: Up to $150 million on an unmitigated basis
• Caltex will continue to supply Woolworths and its customers until any transaction has been completed
12Strategy Update
Response to expected lost Woolworths volumes / earnings well advanced
Caltex remains focused on delivering top quartile total shareholder returns by executing its strategy in
a capital efficient manner
Annualised Invested Comments
EBIT Capital
$M $M
Acquisitions
Milemaker 95 Completed May 2017 - 15 to 20 sites being considered for Foodary upgrade
Gull New Zealand (NZ) 325 Completed July 2017 - First offshore acquisition - adds ~300 ML fuel volumes;
North Island NTI roll-out and trading & shipping optimisation opportunities
50 420
Acquisition Synergies 5-10 0
Sub-Total 55-60 420
Quantum Leap
Initial Cost Savings 60 15-20 Full annual run rate by end 1Q 2018
Further cost and efficiencies expected to be identified in 2H 2017
Refinancing
Replace subordinated note 15-20 0 Subordinated Note (Hybrid) to be replaced by existing debt facilities
Announced 11 August 2017
Cumulative to date 130-140 435-440 Est. ROIC (EBIT / Funds Employed) > 25%
13Strategy Update
Continued evolution of the Operating Model (Quantum Leap)
• Continued evolution of the company operating model to allow Caltex to better execute
its strategy, commenced second quarter of 2017
2017 Short term • Financial focus on delivering top quartile total shareholder returns (TSR) via earnings
priority: growth and improving returns on invested capital over the long term, including
optimisation of asset ownership
• Outcomes to date:
1. Change operating model by establishing two inter-dependent businesses
“Review of company Fuels & Infrastructure (Supply, B2B, Refining & Infrastructure)
operating model Retail: Petrol & Convenience (P&C)
under way to reflect
strategic direction
2. Immediate cost efficiency - $60 million per annum already identified
(further efficiencies
targeted)” Timing: Full annual run rate expected by end 1Q 2018
Includes headcount reduction of approximately 120 people, across both
operational and support functions
• Quantum Leap continues: Second phase focused on further enhancing capabilities and
competitiveness, including delivering further efficiencies through more fit for purpose
operating models
• Regular market updates to be provided as this review and other phases of our
transformation progresses.
14Key Highlights
Priorities
Short Term • Continue to protect, defend and grow core transport fuels business including growth in
(Next 12 months) premium fuels
• Continue the optimisation of the entire fuels value chain via:
Optimising our leading infrastructure position, including our retail and terminal
network
Continue to expand Ampol’s product sourcing, trading & shipping capabilities into
other markets
On-going focus on capturing further Lytton operational and margin improvements
• Successfully integrate Milemaker and Gull NZ acquisitions
• Implement pilot project sites around new customer solutions in the retail petrol &
convenience (P&C) space
• Focus on replacing / mitigating potential lost Woolworths earnings
• Successfully execute phase one of Quantum Leap operating model review: Initial
annualised cost savings of $60m identified (to impact 2018 and beyond) and progress
second phase of Quantum Leap
Further cost and efficiency benefits expected to be identified in 2H17
Medium to Longer • Develop and maintain a leading position within the regional transport fuels industry
Term • On-going optimisation of the Fuels value chain
(Beyond 12 months) • Continue to emphasise growth and innovation, with focus on core capabilities of retail
convenience (leveraging our existing consumer and mobility assets), infrastructure and the
processing, storage and distribution of hydrocarbons
• Maintain cost and capital discipline, with a focus on TSR and appropriate risk management
15AGENDA
Operational Excellence Moment
Half Year 2017: Key Highlights
Strategy Update
Financial Highlights
Supply & Marketing Highlights
Lytton Refinery Highlights
Financial Discipline
Result Take-Aways & Short Term
Priorities
Q&A
Appendices
16Financial Highlights
Half Year Ending 30 June
1H 2017 1H 2016 % Change
HISTORIC COST
EBIT ($m) 408 488 (16)
NPAT ($m) 265 318 (17)
EPS (cps) 101 120 (15)
REPLACEMENT COST
EBIT ($m) 472 397 19
NPAT ($m) 307 254 21
EPS (cps) 118 96 23
Dividend (cps) 60 50 20
Net Debt ($m) 730 693 5
Gearing (%) 20 21 (4)
Gearing (Lease adjusted %) 34 34 2
Working Capital ($M) 680 590 15
Capital Expenditure ($M) 261 125 109
Depreciation & Amortisation ($M) 107 99 7
17Financial Highlights
Reconciliation to underlying (RCOP) profit metric
Half Year Ending June 1H 2017 1H 2016
(After Tax) (After Tax)
HCOP NPAT 265 318
Add: Inventory loss/(gain) 44 (64)
Add: Significant items (gain) (2) 0
RCOP NPAT 307 254
18Financial Highlights
Significant Items
Half Year Ending June 1H 2017 1H 2016
$M $M
Sale of fuel oil business 19 0
Franchisee Employee Assistance Fund (20) 0
Total Significant Items (Before Tax) (1) 0
Tax 3 0
Total Significant Items (After Tax) 2 0
19Financial Highlights
Strong Lytton operational performance supported by higher refiner margins; Supply & Marketing growth continues
1H 2016 v 1H 2017 HCOP EBIT
600
488 91 57 9 472 1 64
500
28 408
397
400
300
200
100
0
20Financial Highlights
Strong Supply & Marketing growth and stronger refiner margins (supported by strong Lytton operating performance)
• Supply & Marketing EBIT up $28 million (+8%)
$m Caltex RCOP NPAT to $377 million (including $4 million
650 unfavourable externalities)
• Underlying EBIT growth +6% to $381
550
million driven by favourable product mix,
sourcing and supply chain optimisation
450 377 benefits, despite flat volumes
270 • Lytton profitability up $57 million to $149
350
261 320 million. Strong operational performance
leverages higher refiner margins (up
250 161 US$2.49/bbl to US$12.59/bbl)
151 • Higher Corporate costs (+$9m to $53m) due to
150 307
251 254 growth initiatives (including M&A) and major
197 171 173 project costs
50 113
• Net finance costs ($35m) reflect lower average
borrowings and interest rates, offset by lower
(50) 2011 2012 2013 2014 2015 2016 2017
capitalised interest
RCOP NPAT 1H RCOP NPAT 2H • Effective tax rate (ETR) unchanged (~29.5%)
*RCOP Net profit after tax, excluding significant items
21Financial Highlights
RCOP EBIT by Segment
$m RCOP EBIT
500 472
397
400 377 383
349
288 290
300
263
200
154 149
92
100
40
0
(38) (35) (44) (53)
(100)
Supply and Marketing Lytton Corporate Total
1H 2014 1H 2015 1H 2016 1H 2017
* RCOP EBIT excluding significant items
22Financial Highlights
Cash Flow generation performance
1,200
Includes $95m acquisition of
Higher inventory levels to support
Milemaker completed May
900 BHU maintenance and timing 730
2017
136
98
600 454 472 59
104
186 21 6
300
154
107 64 28
-
(300)
Inventory loss driven Return to normalised payments Stay-in-business Primarily retail network Returns to
by crude price fall over following lower 2016 cash tax capex in line with (incl. pilot stores) & shareholders
(600)
the period instalment rate D&A infrastructure
(900)
Summary sources of cash Summary of operating cash requirements Discretionary capital allocations
23AGENDA
Operational Excellence Moment
Half Year 2017: Key Highlights
Strategy Update
Financial Highlights
Supply & Marketing Highlights
Lytton Refinery Highlights
Financial Discipline
Result Take-Aways & Short Term Priorities
Q&A
AppendicesSupply & Marketing Highlights - Key Drivers
Earnings growth driven by premium product focus and supply chain optimisation benefits
1H 2016 v 1H 2017 RCOP EBIT
440 Value chain benefits driven by: Operating costs generally well
1) strong margins with modest volume growth controlled. Higher depreciation
2) Ongoing benefit of Ampol Singapore operations; following capex spend
420 3) continued product mix improvement; and
4) continued supply chain optimisation.
400
26 12 13 7
4
381 17
380 13 377
5
8 2 359
360
349
Non-Fuel income down in the short term due
340 to impact of transition of around 80
franchised sites to company operations (lower
royalties and other franchise fees as well as
320
incurring costs to convert sites)
300
25Supply & Marketing Highlights
Overall Diesel volumes up 7% to 3.8 BL with improved product mix, Jet volumes up 5%
• Total diesel volumes up 6.9% (240 ML) to 3.76BL
BL Caltex Diesel and Jet Sales • Retail diesel +5.8% to 1.62 BL with premium Vortex (retail)
diesel up 97 ML (+9.3%) to 1.13 BL and base diesel
volumes -1.5% to 494 ML
5.0 • Commercial (B2B) diesel volumes increased 154 ML (8%)
to 2.14 BL. Increased volumes driven by:
1.31 1.36
1.18 1.21 1.29 Mining volumes increased 98 ML (14%) on ramp up
4.0
of activities amongst existing customers
1.17 Commercial volumes increased (34 ML, 10%) on
3.0 0.75 1.05 1.34
1.22 contract wins; and
2.70 Increased reseller sales up 26 ML (following 2016
2.54 2.47
2.0 2.29 2.42 rationalisation)
B2B diesel volumes includes 210 ML differentiated diesel
volumes (~10% of B2B sales)
1.0
• Total Premium / differentiated diesel volumes up 9.9% (120
ML) to 1.34 BL. Premium / differentiated diesel now 36% of
0.0 total diesel sales (31% pcp). Continue to target premium
substitution across both B2B and retail segments
1H 2013 1H 2014 1H 2015 1H 2016 1H 2017
• Jet volumes increased 62 ML (+4.8%) with new contract
Diesel Vortex and Differentiated Diesels Jet Fuel volumes won in key markets, supported by retention of
existing customers and modest industry growth
26Supply & Marketing Highlights
Petrol Sales - Premium petrols flat; Total Market and volumes down
• Total petrol volumes fell 2.4% to 2.9 billion
litres, driven by continuing trend of falling
BL Caltex Petrol Sales ULP / E10 base grade volumes, down 2.9%
(including E10 sales down 0.9%) reflecting:
3.00 Continued diesel and premium petrol
0.46 0.39 0.32 0.26
0.26 substitution
0.87 0.92 0.95 General long term industry-wide
0.86
0.94 decline; and
2.00
On-going aggressive price competition
1.82 (base grade petrols in particular)
1.80
1.75 • Total premium petrol sales flat, but mix
1.72 1.66
improved over time
1.00
Favourable mix shift with Vortex 98
now representing 43% of premium
petrol sales versus 35% five years ago
0.00 Premium still represents around one-
1H 2013 1H 2014 1H 2015 1H 2016 1H 2017 third of total Consumer petrol sales
91 RON Premium E10 Half Year 2012 2013 2014 2015 2016 2017
Petrol Vols.
V95 65% 63% 61% 58% 57% 57%
V98 35% 39% 39% 42% 43% 43%
27Supply & Marketing Highlights: Non Fuel Income (NFI)
Non-Fuel income down due to significant site transition costs (around 80 franchise sites)
• Non Fuel income reflects the current
$m Caltex Non Fuel Income predominant franchise model
170 • Non fuel income contribution (net) down 14%
at $72 million (versus a strong HY16, up 14%).
Result impacted by transition of around 80
139 134 franchised sites to company operations due to
120 127 130 132
franchisee wage underpayment issue. Includes
impact of audit reviews, franchise terminations
and condition of some sites terminated
70
• Gross income fell 3.4% ($5.0m) to $134 million
20 • No Initial franchise fees (IFF) for the period
while network is being reviewed (down
$2.6 million);
(38) (46)
(30) (51) (55) (62) • Reduced Royalties income (down $2.5
million, -10%) on reduced franchise store
numbers and increased fee relief
(80)
1H 2013 1H 2014 1H 2015 1H 2016 1H 2017 • Impact of transition of franchised sites to
company operations, given condition of
Income Expense some franchise sites terminated (-$3.2
million)
• Higher Non-Fuel expenses (+13%) primarily
reflect costs of taking on additional sites (e.g.
Milemaker) offset partially by lower distribution
costs and improved sourcing
28Supply & Marketing Highlights: Non Fuel Income (NFI)
Franchisee underpayment of employees update
• In 2016, Caltex identified instances where franchisees were underpaying their employees. Wage fraud,
visa fraud or any other mistreatment of employees is unacceptable
• Caltex’s approach to removing underpayment from its network has been guided by the following
principles:
1. Stop unscrupulous behaviour;
2. Ensure our franchise model remains sustainable for franchisees;
3. Provide a safe environment for franchise employees to report wage underpayment; and
4. Offer support to impacted franchisee employees
• Actions to date:
• Caltex continues to work proactively with the Fair Work Ombudsman (FWO)
• A comprehensive audit in progress across ALL Caltex franchise sites (using independent auditors)
- Tranche 1 audits complete; Tranche 2 audits (104 sites in total) now under way
• We reviewed our franchise model (informed by independent consultants and legal advice) and
the review found that our model is sustainable as it allows franchisees to draw a wage, make a
profit and pay employees lawful wage rates
• We established a $20 million assistance fund for franchisee employees who have not been paid
their lawful wage. Claims are being processed via independent advisors (< 100 valid claims have
been received to date)
• A total of 107 sites have been transitioned from existing franchisees (72 sites are now being
company operated; with 35 sites re-franchised) (end July)
29AGENDA
Operational Excellence Moment
Half Year 2017: Key Highlights
Strategy Update
Financial Highlights
Supply & Marketing Highlights
Lytton Refinery Highlights
Financial Discipline
Result Take-Aways & Short Term
Priorities
Q&A
Appendices
30Lytton Refinery Highlights
Strong operational performance leverages higher refiner margins
1H 2016 vs 1H 2017 RCOP EBIT
External Drivers Controllable Drivers
200
Higher demurrage and coastal freight due
10 12
to BHU conversion project
CRM up US$2.49/bbl to
63 6
US$12.59/bbl 0 0 149
150
Unfavourable sales mix due to
9 7 BHU conversion project,
100 temporarily interrupting Maintaining good cost
92
premium petrol production, control in current
resulting in a higher proportion environment - flat opex
of regular petrol production last two years
50 Higher total
volume 1H17
-
31Lytton Refinery Highlights
Regional supply and demand push regional margins higher
30 12.82
14 Caltex Refiner Margin
28
26 12
Build-up (US$/bbl)
24 10.50 1H 2017 1H 2016
22 8.68
20 10
Singapore WAM 12.73 11.21
18 7.27
16 6.32 8 Product freight 3.32 3.40
14
12 0.23 Quality premium 1.06 1.27
6
10
8 -0.45 16.00 Crude freight (1.99) (2.48)
6 11.76
10.10
12.59 4
9.20
4 Crude premium (2.32) (2.70)
2 0.04 1.39 -0.15 2
0 Yield loss (0.45) (0.45)
-2 1H 2013 1H 2014 1H 2015 1H2016 1H2017
-4 0 Lag 0.23 (0.15)
Realised CRM (USD/bbl) Lag (USD/bbl) CRM (Acpl) Realised CRM* 12.59 10.10
*The Caltex Refiner Margin (CRM) represents the difference between the cost of importing a standard Caltex basket of products to Eastern Australia and the cost of
importing the crude oil required to make that product basket. The CRM calculation represents: average Singapore refiner margin + product quality premium + crude
discount/(premium) + product freight - crude freight - yield loss. Numbers used are volume weighted.
32Lytton Refinery Highlights
Regional supply and demand push regional margins higher – SWAM up US$1.52/bbl
2006-2017 Caltex Refiner Margin*1 (US$/bbl)
• Comparable Singapore Weighted
5 year average US$12.06/bbl Average Margin (SWAM)
20
(US$12.73/bbl versus US$11.21/bbl)
year on year, despite volatility
15
Average
2017 2016
realised CRM
10 1H US$12.59 US$10.10
2H US$10.46
5 CRM
High Low Average
unlagged
10 year average US$10.34/bbl
1 year US$15.74 US$7.44 US$11.21
0
2 year US$16.90 US$7.44 US$11.75
Dec-06
Dec-08
Dec-10
Dec-12
Dec-13
Dec-15
Dec-07
Dec-09
Dec-11
Dec-14
Dec-16
Apr-08
Apr-10
Apr-12
Apr-13
Apr-15
Apr-17
Apr-07
Apr-09
Apr-11
Apr-14
Apr-16
Aug-07
Aug-09
Aug-11
Aug-14
Aug-16
Aug-08
Aug-10
Aug-12
Aug-13
Aug-15
-5
Tapis Brent
*Lagged Caltex Refiner Margin.
1. Price basis shifted from (APPI) Tapis to Platts Dated Brent in January 2011 (consistent with Caltex references) 33Lytton Refinery Highlights
Strong controllable operational performance continues
Refinery Production, Utilisation (%) and Availability (%) • Strong controllable operating
performance, underpinned by:
BL %
3.5 98 100
96
97 97 97 97 97 97 Mechanical Availability
(96.5%);
3.0 93
3.1 3.1
3.0 3.0 3.0 Operational Availability
2.8 90 (94.1%);
2.5 2.7
90 90
2.5 88 Yield +60bp to 99.2%; and
88 88
2.0 2.2 86
80
Utilisation (85.8%);
1.5 80
• Transport fuels production 3.0 BL
76 versus 3.1 BL pcp (Sales from
1.0 production 3.0 BL v 2.9BL pcp)
70
0.5 • Safely completed planned
maintenance and modifications to the
65
Benzene Hydrogenation Unit (BHU)
- 60
ahead of schedule and on budget.
1H 2013 2H 2013 1H 2014 2H 2014 1H 2015 2H 2015 1H 2016 2H 2016 1H 2017
New benzene control configuration
Production volumes (LHS) Utilisation (RHS) Mechanical Availability (RHS) reduces operating costs and improves
yield.
34Lytton Refinery Highlights
Balanced product slate petrols (46%) and middle distillates (diesel, jet 52%) provides flexibility
LYTTON
2013 2014 2015 2016 1H 2017
Diesel 39% 38% 39% 39% 40%
Premium Petrols 12% 13% 12% 14% 9%
Jet 10% 12% 12% 11% 12%
61% 63% 63% 64% 60%
Unleaded Petrol 35% 33% 32% 33% 37%
Other 4% 4% 5% 3% 3%
Total 100% 100% 100% 100% 100%
The increase in unleaded petrol mix during 1H 2017 driven by Benzene Hydrogenation Unit (BHU) maintenance
“Other” product slate represents mainly high value product (nonene); with negligible fuel oil
35AGENDA
Operational Excellence Moment
Half Year 2017: Key Highlights
Strategy Update
Financial Highlights
Supply & Marketing Highlights
Lytton Refinery Highlights
Financial Discipline
Result Take-Aways & Short Term
Priorities
Q&A
Appendices
36Financial Discipline - Capital Management
Returns Focused Capital Management
Capital management objective
• Caltex regularly reviews the options for capital management based on established priorities to ensure
capital is deployed as efficiently as possible
• Caltex’s overarching objective is to deliver top quartile TSR over time
Committed to maintaining prudent debt levels
• Maintain a capital structure consistent with a strong BBB+ investment grade credit rating (recently
reaffirmed)
• Headroom remains to invest in growth and respond to changes in the operating environment
Disciplined use of free cash flow to generate sustainable long term earnings growth
• Caltex’s priority is to invest in the business and in growth initiatives to generate sustainable, long term
earnings growth, in a capital efficient manner
• Deliver an attractive ordinary dividend stream to shareholders (40-60% dividend payout ratio of RCOP
NPAT)
• Capital management opportunities in the absence of sustainable growth investments may be considered.
The preferred form of any additional capital return is an off-market buy-back
• Announced redemption of $550 million subordinated notes (Hybrid) to be replaced by lower cost debt
facilities (full year 2018 savings: approximately $15m - $20m)
37Financial Discipline - Balance Sheet
Higher period end debt position follows temporary increase in working capital (manage Lytton BHU maintenance)
and funding Milemaker acquisition (closed May 2017)
%
$m Period end debt and gearing* $m Caltex net debt levels**
800 40 2500
700 740 742 730 35
693 2000
600 639 30
617
500 544 25 1500
400 454 20
432
1000
300 15
200 10
500
100 5
0 0 0
Net Debt Gearing Gearing, Lease adj Ave Debt Peak Debt Debt Facilities^
* Gearing = net debt / (net debt + equity); Gearing - Lease adjusted, adjusts net debt to include lease liabilities
** Average debt is the avg. level of daily debt through the period; Peak debt is the max. daily debt through the period
^ Debt facilities includes committed facilities as at 30 June 2017
38Financial Discipline - Capital Expenditure
Capital directed to reinvest and grow, whilst ensuring a safe, efficient business
HY 2017 total capex of $261m
$M Caltex Capital Expenditure Stay-in-business of $104 million;
900
800-880
Growth (excl. M&A) of $62 million, primarily
FY 2017 guidance $800m - $880m, retail network and infrastructure investment;
800 implies indicative 2H capex (excl. and
acquisitions) $214m - $294m
700 Milemaker acquisition $95m
Full year 2017 planned investment spend
600
1) Retail ($180m - $200m);
568
500 2) Fuels Supply Chain ($80m - $100m);
503
454 325 Newport terminal upgrade, and
400
Terminal tank T&Is
353
300 3) Lytton refinery ($50m - $60m);
200 95 4) Technology ($30m - $50m);
Cyber security, Cloud migration and re-
166
100 platforming, and Core systems investment
5) Acquisitions ($420m) including Milemaker
0
($95m) and Gull NZ ($325m); and
2013 2014 2015 2016 2017
Capex (incl. T&I) Milemaker acquisition Gull acquisition Indicative range (full year) 6) Other ($40m - $50m)
• FY 2017 guidance $800m - $880m
39Financial Discipline - Capital Expenditure
Indicative Capital Expenditure*, subject to change (includes T&I**)
$ millions 2014 2015 2016 2017 Forecast*
Lytton
- Stay in business (includes T&I)** 58 94 35 30-50
- Growth 56 39 8 10-20
114 133 43 40-70
Marketing and Supply
- Stay in business 104 143 156 100-120
- Growth 186 129 141 230-250
289 271 297 330-370
Kurnell Refinery 29 0 0 0
Kurnell Terminal Transition 67 46 3 0
Corporate – Other 4 4 11 10-20
Total 503 454 353 380-460
Announced M&A: Milemaker (settled June), Gull NZ (settled July) 420
800-880
• Indicative ranges only. Subject to change pending market conditions, opportunities, etc. Excludes M&A.
** Turnaround & Inspection (T&I) – major program typically undertaken every five years, completed 1H 2015
40Financial Discipline
Depreciation & Amortisation
$ millions 2014** 2015 2016 HY 2017 2017 Forecast*
Lytton 34 48 56 27 50-60
Supply and Marketing 99 139 148 77 150-170
Corporate 33 6 6 3 5-10
166 193 209 107 205-240
Kurnell Refinery 37 0 0 0 0
Total 203 193 209 107 205-240
* Indicative forecasts only. Subject to any major capex / M&A changes
** 2014 Corporate D&A included $23m in significant items. Underlying 2014 Corporate D&A approximates $10m.
41Financial Discipline - Dividend
Interim dividend of 60 cents per share (2016: 50cps); pay-out ratio 51%
Caltex dividend history*
Cents per share Payout Ratio**
140 60%
117
120 50%
102
100
40%
80 70 70
52
60 60 30%
40
60
45 34
25 30 50 20%
40
28 60
23 17 47 50 10%
20
25 30
17 17 17 20
0 0%
2009 2010 2011 2012 2013 2014 2015 2016 2017
Interim Dividend Final Dividend Payout %
^ Dividends declared relating to the operating financial year period; all dividends fully franked
^ ^ Dividend pay-out ratio (40% to 60%)
42Operational Excellence Moment
Half Year 2017: Key Highlights
Strategy Update
Financial Highlights
Supply & Marketing Highlights
Lytton Refinery Highlights
Financial Discipline
Result Take-Aways & Short Term
Priorities
Q&A
Appendices
43RESULT TAKE-AWAYS & SHORT TERM PRIORITIES
RESULT TAKE-AWAYS • RCOP NPAT $307 million, 21% above prior year
• Interim dividend 60.0 cps declared (HY 2016: 50.0 cps) fully franked (51% payout; guidance 40% - 60%)
• Supply & Marketing underlying EBIT up 6% (excl. $4m unfavourable externalities); Reported EBIT +8%
• Lytton EBIT up $57 million to $149 million on higher refiner margins
• Higher corporate costs (up $9 million to $53 million) reflects growth initiatives and major projects
• Balance sheet remains strong (gearing 20%; lease adjusted 34%); BBB+ Credit rating reaffirmed
• Proposed sale of Woolworths’ fuel business to BP, still subject to regulatory approval. Response to
anticipated lost Woolworths volumes / earnings well advanced
• Capability and competitiveness project (Quantum Leap) announced. Initial cost savings of $60 million per
annum identified (to benefit 2018 and beyond) with associated restructuring costs est. $15 million
• New petrol & convenience (“Foodary”) customer offer now underway with 10 sites opened
SHORT-TERM • Implement the plan to offset anticipated lost Woolworths earnings in a capital efficient manner
PRIORITIES • Successfully integrate Milemaker and Gull NZ acquisitions
• Successfully implement initial identified Quantum Leap cost savings and progress second phase of
Quantum Leap, including delivering further efficiencies through more fit for purpose operating models
• “Test and Learn” new convenience retail offering via further roll out of new Foodary sites
• Complete audits of franchise network and review of convenience retail operating model. Transition sites to
company operations where appropriate
• Maintain business as usual (BAU) focus, including optimising the entire fuels value chain from product
sourcing to customer
• Pursue other growth opportunities across both fuels and convenience retail businesses
44Q&A
45AGENDA
Operational Excellence Moment
Half Year 2017: Key Highlights
Strategy Update
Financial Highlights
Supply & Marketing Highlights
Lytton Refinery Highlights
Financial Discipline
Result Take-Aways & Short Term
Priorities
Appendices
46Appendix: Caltex’s Strategic Journey continues
A focused multi-year transformation strategy, to deliver top quartile total shareholder returns
14 Quantum Leap
13 Retail Convenience
12 Refresh Vision & Strategy
11 Capital Management
10 Growth
9 Value Chain Optimisation
8 Tabula Rasa
7 Ampol Singapore
6 Invest in Distribution Infrastructure
5 Kurnell conversion
Supply Chain review
4
Business Model
Integrated Supply
2 Caltex Values 3 Chain
Establish Vision
Transport Fuels Leader
Measure of Success
1 TSR
2010 2011 2012 2013 2014 2015 2016 2017
47Appendix: Australian Fuels Demand Growth
Market volumes for premium petrol, diesel and jet fuel are forecast to continue to grow, although at
lower rates compared to the previous five years
• The declining trend in total petrol volumes is
projected to accelerate out to 2020, due to
ongoing improvements in vehicle fuel
efficiency and continued substitution to
diesel vehicles.
• Continued growth in premium grades
(particularly 98 octane product) is
forecast in line with new vehicle
requirements.
• Diesel market growth is forecast to remain
similar to the recent trend as continued
uptake of diesel vehicles offsets weaker
growth in the resources sector.
• Strong growth in passenger numbers at most
capital city and regional airports has
supported consistent historical growth in fuel
demand and this is set to continue.
Source: Department of Industry, Innovation and Science - Australian Petroleum Statistics, Caltex
estimates
48Appendix: Regional Supply and Demand
Regional product demand growth is projected to exceed refining capacity additions, next five years
• Asian product demand growth is forecast to
K bbl/d continue at 2-3% p.a. over 2017-21.
• Petrol and jet fuel demand are projected to
grow strongly (4-5% p.a.) due to increasing
car ownership and rising consumer affluence
in emerging markets.
• Jet passenger traffic is forecast to grow in line
with growth of low-cost carriers, improving
aviation access, and expansion of airport
infrastructure in smaller regional cities.
• A relatively small number of greenfield
refinery projects are scheduled for completion
in the Asian region over the next 5 years.
This together with further closures of refining
capacity (China, Japan), will restrict net
growth in capacity.
• The outlook is for a continuation of the trends
observed in 2015/16, which saw regional
product demand growth exceed net refining
capacity additions.
Source: FACTS Global Energy April 2016 Forecast, Caltex estimates
Capacity additions are net of forecast closures
49Appendix: Asia Pacific and Middle East product balances
The region moved into a deficit for gasoline in 2016, but is still in surplus for diesel and jet
• The Middle East has added complex refining
capacity over the past 5 years, which has
contributed to growing product surpluses for
diesel and jet in the Asia and Middle East
regions.
• The growth in the diesel surplus also reflects
weaker consumption in China, due to slower
industrial and economic growth.
• In contrast, gasoline (or petrol) has moved into
deficit, largely due to the strength of regional
demand growth. The gasoline deficit is
forecast to widen out to 2023.
Source: FACTS Global Energy November 2015 Forecast
A positive balance indicates net exports
50Appendix: Australian and global electric vehicle sales
Electric vehicle sales currently represent only 0.1% of total Australian new vehicle sales
Australian EV sales volumes and market share • Press coverage around electric vehicles (EVs) continues to
increase. However Australian vehicle sales data indicates that EV
sales remain relatively low, comprising only about 0.1% of the
total Australian new vehicle market in 2016.
• Of the cumulative total EV sales since 2012, over half are Plug In
Hybrid Electric Vehicles (PHEVs), which have a petrol engine as
well as a plug-in electric battery.
• There are ~17 million light vehicles in the Australian fleet of
which only about 4,000 are EVs. Given the average age of the
vehicle fleet is 10 years, a more significant increase in EV sales
would take several years to have a material impact on the
overall composition of the vehicle fleet.
Global comparison – 2016 EV share of new MV sales
• Petrol-powered vehicles still dominate the market and
comprised ~66% of new vehicles sales in 2016
• Uptake of EVs in Australia lags other major markets, partly
because the regulatory and consumer incentive frameworks in
those markets that support EV sales.
Sources: VFACTS data; ABS motor vehicle census; US, EU and China vehicle sales reports; Caltex estimates
Notes:
- PHEV = plug-in hybrid electric vehicle (vehicles with an internal combustion engine as well as plug-in electric battery)
- BEV = full plug-in electric vehicle (no internal combustion engine)
- Australian EV sales include estimates for Tesla sales, which are not reported through industry sales data
- 2017 forecast is based on H1 actuals annualised
51Appendix: Retail Infrastructure
Caltex Retail Service Station Network
Ownership Structures
• Caltex supplies 1,962 card accepting sites in Australia, including:
Caltex owned (478) or leased (379) 857 (2016: 805)
Dealer owned 581 (2016: 637)
Woolworths supplied 524 (2016: 525)
• In New Zealand, Caltex’s Gull NZ has 78 sites (74 service stations and 4 marinas). This includes 57
controlled retail sites (including 29 unmanned stations) and 21 supply sites
Operating Model
• Caltex’s consumer network comprises 970 sites. These sites are either company operated (233
sites, including 52 diesel stops, 2016: 152 sites) or by a franchisee (572 sites; 2016: 641).
Additionally, there are dealer owned sites with supply agreements (162 sites) or an agency Star
Card (3 sites) in place
• Caltex’s B2B network comprises sites with supply agreements (457 sites) or have an agency star
card (6 sites) in place. Caltex company operates 5 B2B sites
Valuation
• The book value of Caltex retail network approximates $1.23 billion, comprising (a) Land; (b)
Properties and Equipment; and (c) Capitalised leasehold improvements
52Appendix: Infrastructure (excluding Retail)
Caltex (Non-Retail) Infrastructure Network
53Appendix: Terminal Infrastructure
Caltex Terminal Network
Terminal Nominal State National Terminal Nominal State National
Capacity Capacity Capacity Capacity Capacity Capacity
ML ML % ML ML %
New South Wales South Australia
Kurnell 515 Pelican Point, Adelaide 97
Banksmeadow 36 Port Lincoln 7 104 8%
Newcastle 30 581 45%
Queensland Western Australia
Lytton 280 Port Hedland 40
Mackay 62 Kalgoorlie 3
Gladstone 60 Albany 20 63 5%
Cairns 34 436 34%
Victoria Tasmania
Newport 64 64 5% Hobart 30 30 2%
Total Capacity 1,278 1,278 100%
The book value of Caltex terminal network approximates $870 million, comprising (a) Land; (b) Properties and Equipment;
and (c) Capitalised leasehold improvements
Newport Capacity to increase +40ML following current
construction (to ~100-105ML)
54Appendix: Balance Sheet
Includes post period end financing (follows acquisition & refinancing announcements)
Takes into consideration:
• Gull NZ acquisition: A$325m, completed 3 July 2017
• Redemption of A$550m subordinated notes (hybrid) to be replaced with existing bank facilities, effective: 15
September 2017 (Estimated savings $15m-$20m per annum)
• Extension of bank facilities
Debt Maturity Profile as at 30 June 2017 Debt Maturity Profile as at 16 September 2017 (Illustrative)
1055
150 740 150
550
322 315 322
2017 2018 2019 2020 2021 2022 Beyond 2017 2018 2019 2020 2021 2022 Beyond
2022 2022
Hybrid AUD Notes Bank Facilities AUD Notes Bank Facilities
Funding sources as at 30 Jun 2017 (A$m) Funds available Undrawn Funding sources as at 16 Sep 2017 (A$m) Funds available Undrawn
AUD Notes 150 AUD Notes 150
Bank Facilities* 1,377 1,377 Bank Facilities* 1,377 502
Hybrid 550
Total 2,077 1,377 Total 1,527 502
*AUD equivalent. Funded from Australian and global banks. Contain an ‘evergreen provision’ to facilitate extensions.
55Appendix
AUD-USD Exchange Rate
0.85
AUD vs USD
0.80
0.75
0.70
0.65
Jan Feb Mar Apr May Jun Jul Aug Sep Oct Nov Dec
2015 2016 2017 Source = HSRA Reuters
56Appendix
Commodity Exposure - Oil Prices
57Appendix
Product Prices - Regional Traded Petrol
58Appendix
Product Prices - Regional Diesel
59Appendix
Summary Financial Information
1H 2017 2016 2015 2014 2013
Dividends
Dividends ($/share) 60.0 1.02 1.17 0.70 0.34
Dividend payout ratio - RCOP basis (excl. significant items)* 51% 51% 50% 38% 28%
Dividend franking percentage 100% 100% 100% 100% 100%
Other data
Total revenue ($m) 10,160 17,933 19,927 24,231 24,676
Earnings per share - HCOP basis (cents per share) 101 232 193 7 196
Earnings per share - RCOP basis (cents per share) (excl.
118 199 233 183 123
significant items)
Earnings before interest and tax - RCOP basis ($m) (excl.
472 813 977 794 551
significant items)
Operating cash flow per share ($/share) 0.40 3.56 3.28 2.45 2.25
Interest cover - RCOP basis (excl. significant items) 13.8 11.2 12.7 7.1 6.2
Return on capital employed - RCOP basis (excl. significant items) 16.9% 16.1% 19.5% 15.5% 9.9%
Total equity ($m) 2,912 2,810 2,788 2,533 2,597
Return on equity (members of the parent entity) after tax - (HCOP
14.5% 18.7% 16.2% 0.6% 15.9%
basis)
Total assets ($m) 5,447 5,303 5,105 5,129 6,021
Net tangible asset backing ($/share) 10.14 9.88 9.60 8.64 9.05
Net debt ($m) 730 454 432 639 742
Net debt to net debt plus equity 20% 14% 13% 20% 22%
* Based on weighted average number of shares
60IMPORTANT NOTICE
This presentation for Caltex Australia Limited is designed to provide:
• an overview of the financial and operational highlights for the Caltex Australia Group for the 6 months period ended 30 June; and
• a high level overview of aspects of the operations of the Caltex Australia Group, including comments about Caltex's expectations of
the outlook for 2017 and future years, as at 29 August 2017.
This presentation contains forward-looking statements relating to operations of the Caltex Australia Group that are based on
management’s own current expectations, estimates and projections about matters relevant to Caltex’s future financial performance.
Words such as “likely”, “aims”, “looking forward”, “potential”, “anticipates”, “expects”, “predicts”, “plans”, “targets”, “believes” and
“estimates” and similar expressions are intended to identify forward-looking statements.
References in the presentation to assumptions, estimates and outcomes and forward-looking statements about assumptions, estimates
and outcomes, which are based on internal business data and external sources, are uncertain given the nature of the industry, business
risks, and other factors. Also, they may be affected by internal and external factors that may have a material effect on future business
performance and results. No assurance or guarantee is, or should be taken to be, given in relation to the future business performance or
results of the Caltex Australia Group or the likelihood that the assumptions, estimates or outcomes will be achieved.
While management has taken every effort to ensure the accuracy of the material in the presentation, the presentation is provided for
information only. Caltex Australia Limited, its officers and management exclude and disclaim any liability in respect of anything done in
reliance on the presentation.
All forward-looking statements made in this presentation are based on information presently available to management and Caltex
Australia Limited assumes no obligation to update any forward looking- statements. Nothing in this presentation constitutes investment
advice and this presentation shall not constitute an offer to sell or the solicitation of any offer to buy any securities or otherwise engage
in any investment activity. You should make your own enquiries and take your own advice in Australia (including financial and legal
advice) before making an investment in the company's shares or in making a decision to hold or sell your shares. You should also refer
to Caltex Australia Limited’s 2016 Annual Report.
6162
You can also read


