RESEARCH Office Vacancy Report - South African Property ...
←
→
Page content transcription
If your browser does not render page correctly, please read the page content below

RESEARCH Office Vacancy Report
Q4   Office Vacancy Report
     December 2017

CONTRIBUTORS

              T: (011) 883 0679 F: (011) 883 0684
              Email: marketingmanager@sapoa.org.za   02
              Web: www.sapoa.org.za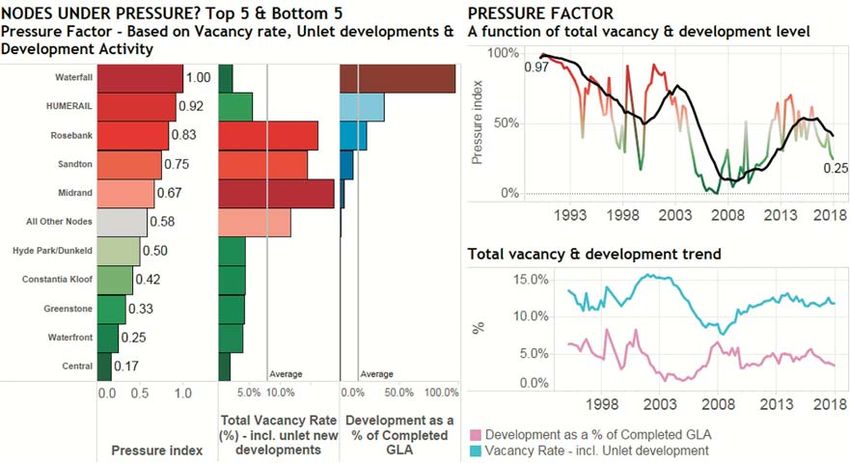
Q4         Office Vacancy Report
           December 2017

KEY FINDINGS
As at Q4 2017, the national office vacancy rate as recorded by SAPOA was 11.2% - unchanged on
the quarter before but off the high of 11.8% recorded in Q2 of 2017. Asking rental growth has slowed
further over the past quarter Ð indicative of the current low growth environment coupled with an excess
supply in the market.

As at Q4 2017, asking rental growth was recorded at 2.0% year on year Ð down from 2.7% as at the
quarter before and the lowest since 2014Q2.

An aggregate of 168k sqm of rentable area (newly completed & existing area) was occupied during
the past quarter while 195k sqm of stock was added to the sample- the result: a net absorption of -
27.3k sqm.

As an illustration of the volatile vacancy trend of the past couple of years, there has since Q2 2013
been 10 quarters of worsening vacancy mixed with 8 quarters of improving vacancy with only a change
of +0.3% as the overall vacancy rate has moved from 10.9% in mid-2013 to the current 11.2%.

The broad sideways trend in the overall office vacancy rate remain in tact with the latest quarter seeing
a negligible 3bps change in the overall level of vacancy.

While the level of active new development has been trending down since 2015, the demand for space
is also not growing as employment growth remains muted and business confidence has been below
the 50/neutral level for 26 of the last 30 quarters.

The office sector recovery remain fragile with the latest economic growth and employment data
pointing to a stagnant, flat growth environment. The fact that asking rental growth has also been
slowing suggests that occupancy gains are mostly coming at the expense of rental growth. That said,
some nodes remain resilient and are bucking the trend.

Gross fixed capital formation by the business & financial services sector -a key leading indicator for
office occupancy- remains negative at -0.9% year on year. This raises the probability that office
vacancy rates could deteriorate further before improving.

The quarter ending December 2017, saw vacancy rates improve in the A-grade & C-grade segments
while the Prime & B-grade segments experienced declines.

Among the larger municipalities, the lowest office vacancy rate at quarter end was recorded for the
City of Cape Town with 7.0% - a decline of 20bps from the previous quarter. During the quarter ending
December 2017, the national inner city office vacancy rate was down 40bps to 14.5% while the
countryÕs city decentralized nodes posted an aggregate vacancy rate of 10.2%.

Development activity continues to be concentrated with 92% of office development taking place in
10 nodes with Gauteng office nodes dominating the rankings table. Sandton continues to account for
the bulk of development activity and as at quarter end constitutes 31% of national office development.

National office development activity is likely to gradually trend down given that many large scale
projects are slated for completion in the next 12-18 months and given that the overall office development
pipeline is slowing down compared to recent history.

                            T: (011) 883 0679 F: (011) 883 0684
                            Email: marketingmanager@sapoa.org.za                                            03
                            Web: www.sapoa.org.za
Q4         Office Vacancy Report
           December 2017

HEADLINE RESULTS & DRIVERS
VACANCY RATE STABLE BUT RENTAL GROWTH DOWN
As at Q4 2017, the national office vacancy rate as recorded by SAPOA was 11.2% - unchanged on the
quarter before but off the high of 11.8% recorded in Q2 of 2017. Asking rental growth has slowed further
over the past quarter Ð indicative of the current low growth environment coupled with an excess supply
in the market. As at Q4 2017, asking rental growth was recorded at 2.0% year on year Ð down from 2.7%
as at the quarter before and the lowest since 2014Q2.

An aggregate of 168k sqm of rentable area (newly completed & existing area) was occupied during the
past quarter while 195k sqm of stock was added to the sample- the result: a net absorption of -27.3k sqm.

As an illustration of the volatile vacancy trend of the past couple of years, there has since Q2 2013 been
10 quarters of worsening vacancy mixed with 8 quarters of improving vacancy with only a change of +0.3%
as the overall vacancy rate has moved from 10.9% in mid-2013 to the current 11.2%.

Since the first quarter of 2009, only 5 of 34 quarters have seen negative asking rental growth. However,
asking rental growth has not kept up with inflation and in real (inflation-adjusted) terms has declined by
more than 25% over this period.

                           T: (011) 883 0679 F: (011) 883 0684
                           Email: marketingmanager@sapoa.org.za                                         04
                           Web: www.sapoa.org.za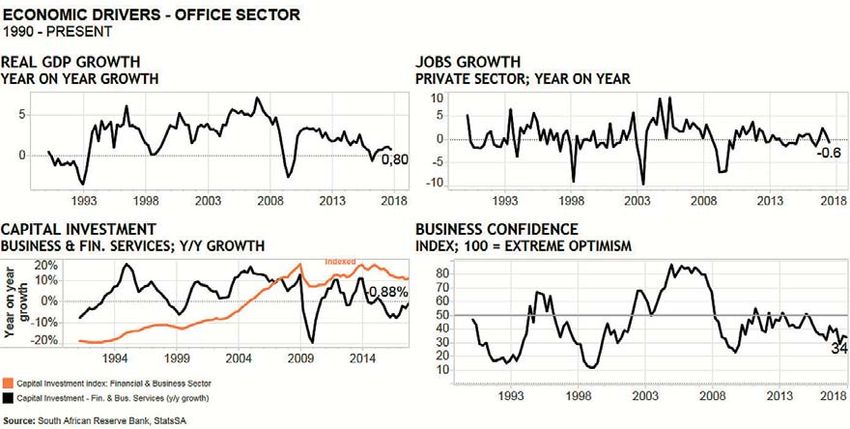
Q4          Office Vacancy Report
            December 2017

HEADLINE RESULTS & DRIVERS
SIDEWAYS TREND REMAINS DESPITE DECLINE
The broad sideways trend in the overallÊoffice vacancy rate remain inÊtact with the latest quarter seeing
a negligible 3bps change in the overall level of vacancy.

While the level of active new development has been trending down since 2015, the demand for space
is also not growing as employment growth remains muted and business confidence has been below the
50/neutral level for 26 of the last 30 quarters.

ToÊillustrate the level of excess supply present in the market consider that there is currentlyÊ2 million
squareÊmetersÊavailableÊto let in the nodes covered by theÊOVS. This is 1.3 million square meters more
than in 2009Êunderlining the lack of growth drivers of office demandÊÊwhich has seen it outstripped by
supply.ÊÊUsing the OVSÕs average building sizeÐ thisÊtranslates into 210 more totally vacantÊ6,208sqm
buildingsÊat present relative to 2009.

Looking at it another way Ð for the overall office vacancy rate to get back to the 5% level (the figure often
thought to indicate full absorption), 1.1m square meters will need to be let given the current gross lettable
area of 17.9mÊsqm. To put that in perspective, that means letting 500 square meters of space to each
of 2,230 tenants.

                             T: (011) 883 0679 F: (011) 883 0684
                             Email: marketingmanager@sapoa.org.za                                           05
                             Web: www.sapoa.org.za
Q4          Office Vacancy Report
            December 2017

HEADLINE RESULTS & DRIVERS
KEY GROWTH DRIVERS NOT ADDING IMPETUS
Notwithstanding the improvement off its recent vacancy rate high, the office sector recovery remain fragile
with the latest economic growth and employment data pointing to a stagnant, flat growth environment.
The fact that asking rental growth has also been slowing suggests that occupancy gains are mostly coming
at the expense of rental growth. That said, some nodes remain resilient and are bucking the trend.

Gross fixed capital formation by the business & financial services sector -a key leading indicator for office
occupancy- remains negative at -0.9% year on year. This raises the probability that office vacancy rates
could deteriorate further before improving. (next graphic demonstrates the historical relationship between
capital investment and office vacancy rates).

Business confidence remains negative at 34 points- implying an overall negative sentiment among business
executives For the 40 quarters starting March 2008, business confidence has only peaked up above 50
for 4 quarters (a max of 55)- so it would not be unreasonable to assume that industry decision makers
are maintaining a selective approach to capital allocation Ð especially expansionary.

A sustained improvement in the office vacancy rate relies on a strengthening of these macroeconomic
drivers so in summary, the office sector still faces a range of headwinds not least of which is economic
growth and job creation.

                             T: (011) 883 0679 F: (011) 883 0684
                             Email: marketingmanager@sapoa.org.za                                          06
                             Web: www.sapoa.org.za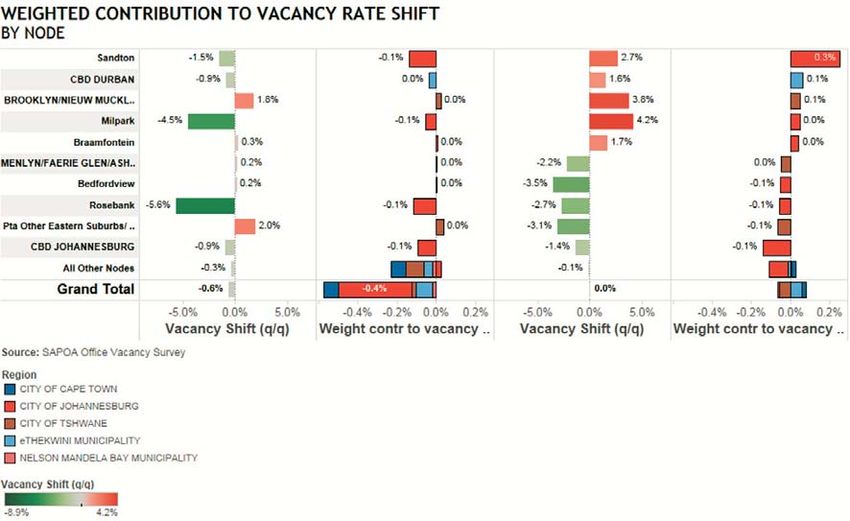
Q4          Office Vacancy Report
            December 2017

HEADLINE RESULTS & DRIVERS
CAPITAL INVESTMENT TRENDING DOWN
History suggests the downward trending financial & business capital investment poses a risk to office
occupancy rates in the short to medium term. Going back to 1990, capital investment has been strongly
correlated to the office vacancy cycle The graphics below illustrates the relationship between business
capital investment and the office vacancy rate (y/y change).

Companies choosing not to allocate capital to expansion and effectively adapting a wait-and see approach
allows supply to catch up to demand thus weighing on the vacancy rate and by consequence asking rental
growth and investment returns. Business & financial services capital investment growth has been negative
since 2015Q3 implying that significant near term improvement in the overall office vacancy rate is unlikely.

The previous economic cycle saw a strong recovery in capital investment (period Õ04-Õ07) Ð driven by robust
GDP growth while current GDP growth forecasts suggests at best a more moderate upturn in economic
growth possibly reaching 2% year-on-year growth by 2020. This makes the base case scenario for the
current cycle a more protracted, bumpier office vacancy recovery relative to the 2004-2008 cycle which
benefited from a prolonged streak of a 5% GDP growth.

                            T: (011) 883 0679 F: (011) 883 0684
                            Email: marketingmanager@sapoa.org.za                                         07
                            Web: www.sapoa.org.za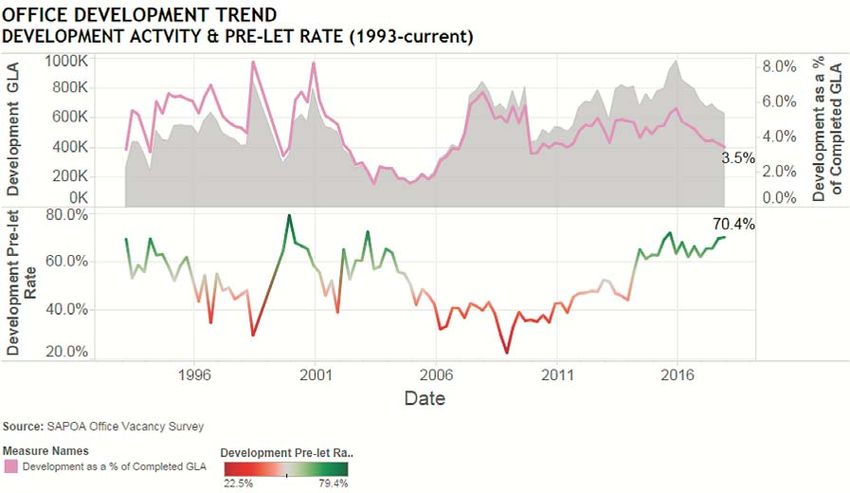
Q4          Office Vacancy Report
            December 2017

OFFICE VACANCY & RENTAL GROWTH
BY GRADE
The quarter ending December 2017, saw vacancy rates improve in the A-grade & C-grade segments while
the Prime & B-grade segments experienced declines.

The largest change was in the C-grade segment with a quarter on quarter improvement of 80bps while
the A-grade segment posted a strengthening of 20bps. The C-grade segment improvement is in part driven
by residential conversions Ð a common trend at this part of the cycle.

The national Prime office vacancy rate ticked up by 90bps during the quarter as several new developments
(speculative developments or including a speculative phase/component) came onto the market.

The latest vacancy rate for all grades with the exception of B-grade- is still below their 2013/14 peaks. It
will be interesting to see if the weakening macroeconomic environment pushes it past that level and
perhaps closer to 2003 levels. Notwithstanding the marginal change at an aggregate level, the most recent
quarter saw 25 of 53 office nodes still record weakening office vacancy rates while 29 nodes saw flat or
improving occupancy. This underlines the importance of nodal selection for property fund and asset
managers in the current market with location playing a similarly important role as office quality and other
characteristics such as floorplate size & configuration, parking & accessibility.

                            T: (011) 883 0679 F: (011) 883 0684
                            Email: marketingmanager@sapoa.org.za                                          08
                            Web: www.sapoa.org.za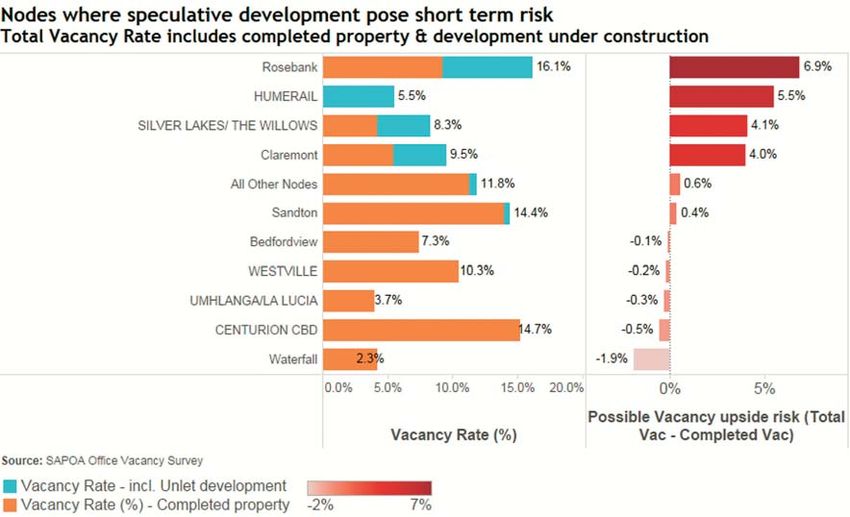
Q4          Office Vacancy Report
            December 2017

OFFICE VACANCY & RENTAL GROWTH
BY REGION
Among the larger municipalities, the lowest office vacancy rate at quarter end was recorded for the City
of Cape Town with 7.0% - a decline of 20bps from the previous quarter. The smaller Nelson Mandela Bay
metro currently has the lowest vacancy rate among the five municipalities forming part of the survey at
6.5%.

The highest vacancy rate among the larger metros was the 12.6% recorded for the City of Joburg. The
Johannesburg inner city vacancy rate continues to drive the cityÕs aggregate vacancy rate with a level of
17.2% relative to the total city decentralised vacancy rate of 11.2%.
The Ethekwini municipality posted the second highest vacancy rate among the major metros at 12.4%.
The Durban CBD remains the node with the highest vacancy rate at 18.4% following a 160bp decline in
the latest quarter. Umhlanga/La Lucia comfortably has the highest office occupancy rate Ð ending the
latest quarter with a 4.0% vacancy rate.

The City of Tshwane recorded an aggregate office vacancy rate of 10.3%- down 30bps on the quarter
prior. The Pretoria CBD recorded an average vacancy of 10.2% while the cityÕs decentralised nodes were
spread between 1.7% for Sunnyside and 15.2% in the Centurion CBD node.Ê

                           T: (011) 883 0679 F: (011) 883 0684
                           Email: marketingmanager@sapoa.org.za                                        09
                           Web: www.sapoa.org.za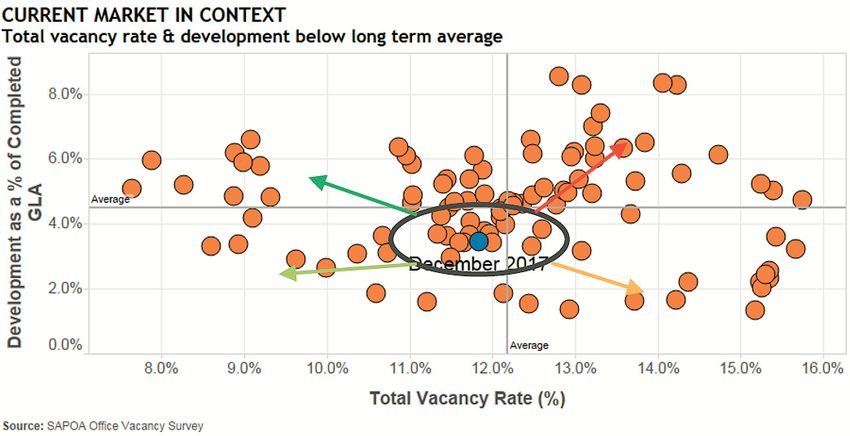
Q4         Office Vacancy Report
           December 2017

OFFICE VACANCY & RENTAL GROWTH
CBD vs. DECENTRALISED
Inner city office vacancy rates remain high and at ~1.5x the level of city decentralised nodes Ð a similar
situation asÊ the previous two cycles when vacancies were nearing peak levels. In saying that, inner city
vacancies are currently lower than it was in 2003 as a result of structural change brought about by the
conversion of CBD offices to residential space.
During the quarter ending December 2017, the national inner city office vacancy rate was down 40bps
to 14.5% while the countryÕs city decentralized nodes posted an aggregate vacancy rate of 10.2% - 20bps
up from the previous quarter (not withstanding fluctuations in the underlying nodes).
The current level of inner city office vacancies is largely driven by the Durban CBD where the aggregate
vacancy rate ended the quarter at 18.4%. The Johannesburg CBD recorded the largest decline in vacancy
rates with a quarter on quarter move of 140bps to end at 17.2%.
While the overall City Decentralised segment saw a 20bp increase in vacancy rate, 22 of 50 decentralised
nodes actually recorded improving occupancy rates over the past quarter. Pretoria East, Bedfordview
View and Rosebank contributed a combined -30bp to the overall City Decentralised office vacancy rate
decline while the balance of the nodes accounted for a combined 40bp increase. Sandton was the major
detractor with a 30bp negative weighted contribution.

                           T: (011) 883 0679 F: (011) 883 0684
                           Email: marketingmanager@sapoa.org.za                                         10
                           Web: www.sapoa.org.za
Q4 Office Vacancy Report
December 2017
WHICH NODES DROVE THE CHANGE
IN VACANCY?
On a nodal level, there is significant variance Ð both in terms of absolute vacancy rate and the direction
of their recent trends up or down. The graphic below illustrates the top 5 nodes in terms of positive &
negative impact on the overall vacancy rate.
The top 5 detractors of total vacancy rate added +50bps while the top 5 positively contributing nodes
added -40bps (the remaining 43 nodes has only a marginal weighted impact)
During the quarter ending December 2017, the CBD of Johannesburg, Pretoria East and Rosebank had
the largest positive impact.Ê Other notable contributors to the overall improvement were Bedfordview and
the Menlyn/Faerie Glen node.
Sandton, the Durban CBD and the Brooklyn/Groenkloof/Waterkloof area had the largest negative impact
on the overall office vacancy rate contributing a combined +50bps to the shift in the national figure.
T: (011) 883 0679 F: (011) 883 0684
Email: marketingmanager@sapoa.org.za 11
Web: www.sapoa.org.zaQ4 Office Vacancy Report
December 2017
DEVELOPMENT ACTIVITY DOWN
FEWER SPECULATIVE SCHEMES
Several large office developments have come onto the market since the last quarter of 2015 which saw
the aggregate development number come off significantly. At the end of the current quarter, developments
under construction totalled 628k sqm (down from the Q4 2015 peak of 982k sqm).Ê Expressed as a
percentage of existing market stock, development activity is currently at 3.5% -off the 6.6% high of Q4
2007 but still on the high side given the absence of growth drivers on a national level.
Another reason for the decline in the total office development figure is that some development schemes
are scaling down speculative building activity and opting to only phase development on a tenant driven
basis.
While the overall level of development has been slowing, the most recent quarter saw the pre-let rate of
current developments improve slightly from 69.5% to 70.4%. The development pre-let rate has been on
a gradually improving trend since 2008, driven by a higher proportion of large, purpose-built corporate
headquarters relative to smaller, speculative developments.
T: (011) 883 0679 F: (011) 883 0684
Email: marketingmanager@sapoa.org.za 12
Web: www.sapoa.org.zaQ4 Office Vacancy Report
December 2017
OFFICE DEVELOPMENT ACTIVITY
CONCENTRATED IN GAUTENG
Development activity continues to be concentrated with 92% of office development taking place in 10
nodes with Gauteng office nodes dominating the rankings table. Sandton continues to account for the
bulk of development activity and as at quarter end constitutes 31% of national office development.
National office development activity is likely to gradually trend down given that many large scale projects
are slated for completion in the next 12-18 months and given that the overall office development pipeline
is slowing down compared to recent history.
Together with Sandton, the rapidly growing greenfield development node of Waterfall, as well as the more
mature nodes of Rosebank, Umhlanga/La Lucia Cape Town CBD round out the top 5 with several large
scale developments in progress.
The 20 largest projects account for around 50% of total office development GLA in the metros & nodes
currently covered by the survey. ÊThis is down from a recent high of 81% emphasising the impact of
several large scale (mostly single tenanted) developments coming on-stream.
T: (011) 883 0679 F: (011) 883 0684
Email: marketingmanager@sapoa.org.za 13
Web: www.sapoa.org.zaQ4 Office Vacancy Report
December 2017
WHICH NODES COULD COME
UNDER PRESSURE?
Given the level of development activity that remains high relative to the historical trend itÕs important to
form a view of demand alongside the supply picture. While some nodes may have a high level of
development relative to othersÊÊ- these might be mostly pre-let which would not impact as negatively on
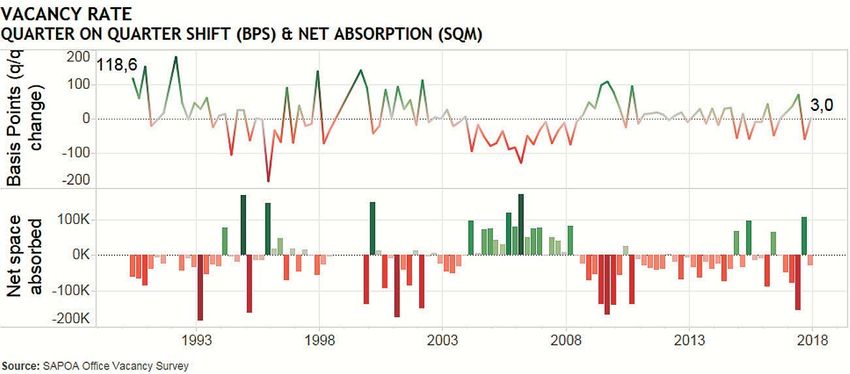
rentals.ÊThe graphic below breaks down the top & bottom 5 nodes based on their current total vacancy
rate and level of development activity to establish an indicator of short to medium term pressure on rental
growth.
As an example, the fast growing Waterfall node is currently deemed to be higher on the pressure index
than the Sandton node based on these measures. This factor will change over time (especially in the case
of large, multi-year projects) as more development space is completed and a higher proportion is pre-let
before it comes onto market.
On the other hand, nodes exposed to backfill risk will move up the Pressure Index as large corporate HQs
come online. On a national level, the pressure index is currently at .25, down from .29 in the previous
quarter and also significantly down from a recent high in 2013 of .69. On the other side of the pressure
spectrum are mature, popular nodes such as the V&A Waterfront and the Central Node (Pinelands and
the Black River parkway precinct) which all have a critical mass of large, long-term occupiers and limited
opportunities for greenfield developments which should underpin short to medium term occupancy levels
and rental growth.
T: (011) 883 0679 F: (011) 883 0684
Email: marketingmanager@sapoa.org.za 14
Web: www.sapoa.org.zaQ4 Office Vacancy Report
December 2017
UNLET NEW DEVELOPMENTS POSE
A RISK TO RENTAL GROWTH
Further analysis of the total vacancy rate on a nodal level reveals that several nodes currently have a fairly
wide spread between their ÔtotalÕ vacancy rate (incl. un-let developments) and the vacancy rate on
completed/existing property. Speculative developments pose a downside risk to rental growth if unlet and
a failure to do so might see the nodeÕs vacancy rate converge on the current Ôtotal vacancy rateÕ.
In the case of Rosebank-, unlet new developments currently poses a substantial risk to short to medium
term rental growth given that the vacancy rate on existing stock is already high. Rosebank currently hasÊ
a downside risk to vacancy of 6.9% as the vacancy rate of completed property is 9.2%, but including unlet
developments this figure increases to 16.1%.Ê
On the other hand, the vacancy rate of nodes like Waterfall and the Centurion CBD will actually benefit
once current developments come on line as these will reduce the overall vacancy rate by 190bps and
50bps respectively.
T: (011) 883 0679 F: (011) 883 0684
Email: marketingmanager@sapoa.org.za 15
Web: www.sapoa.org.zaQ4 Office Vacancy Report
December 2017
WHERE ARE WE IN THE OFFICE
PROPERTY CYCLE?
As mentioned earlier in the report, the aggregate vacancy rate has moved broadly sideways between 2011
and 2017 while the level of development activity has been trending steadily lower since reaching a peak
in 2015Q4.
This places the current quarter roughly midway relative to its long term history in terms of its total vacancy
rate and development as a % of existing stock (graphic below). Ideally, the next move should be towards
the Ônorth westÕ on the graphic belowÐ a situation where demand exceeds a healthy level of supply. In
saying that, the most recent quarter saw a move towards the south east
Asking rental growth has meanwhile slowed further over the past yearÐ indicative of the current low growth
environment coupled with an excess supply in the market. Any future improvement in vacancy rate and
asking rental growth depends on a strengthening of underlying demand drivers most notably financial &
business services employment growth & capital investment.
Capital investment into financial & business services declined by 0.9% y/y during Q3 2017, which raises
the probability of another upward leg in the vacancy rate trend. ÊGiven the current trend of economic growth
and structural growth constraints it is becoming increasingly hard to imagine the national office vacancy
rate returning to mid-single digits within the next 3 years.ÊÊ That said, leasing opportunities do exist Ð
evident in the fact that 24 of 53 nodes reported improving occupancy rates over the past quarter and 22
nodes currently have vacancy rates of 8% and below (up from 19 in Q2 2017).
T: (011) 883 0679 F: (011) 883 0684
Email: marketingmanager@sapoa.org.za 16
Web: www.sapoa.org.zaQ4 Office Vacancy Report
December 2017
OFFICE NODE DEFINITIONS
JOHANNESBURG
BEDFORDVIEW / BRUMA: Includes the offices around and adjacent Bruma Lake, Eastgate Shopping
Centre and Bedford Shopping Centre. Also offices adjacent to GilloolyÕs Farm, Skeen Boulevard as
well as along the R22 and R24 in the direction of OR Tambo International Airport.
BRAAMFONTEIN: Bounded by the M1 highway to the west, the railway line to the south, Joubert St
to the east and the Braamfontein Ridge to the north including the Braampark development but excluding
the University campus.
BRYANSTON / EPSOM DOWNS: This area adjacent to the intersection between the Western Bypass
and William Nicol Dr, including Peter Place.
CBD JOHANNESBURG: Bounded by the M2 and M1 highways to the south and west respectively,
the railway to the north and End St to the east.
CONSTANTIA KLOOF BASIN: Includes area either side of Hendrik Potgieter Rd, including Monash
University to the west with the Western bypass to the east.
CRESTA / BLACKHEATH: Includes offices in Cresta, Darrenwood, Blackheath and Northcliff &
extensions and Randpark either side of Beyers Naude bounded by Milner Rd to the east and Christiaan
de Wet/Northumberland to the west, and from Milner in the south up to the N1 in the north.
FOURWAYS: Bounded by Uranium Rd to the north, Main Rd to the east, William Nicol intersection to
the south and Waterford Estate to the west.
GREENSTONE / LONGMEADOW / MODDERFONTEIN / EDENVALE: Bounded by the N3 to the west,
Peace St/Modderfontein Rd to the north, Palliser Rd to the east and Aitken Rd to the south.
HOUGHTON / KILLARNEY: Included are the offices in Killarney and Houghton on either side of the
M1 highway as well as the Houghton Isle development.
HYDE PARK / DUNKELD: The node of the intersection of Jan Smuts Ave and William Nicol Dr including
Dunkeld West, Hyde Park and the upper part of Craighall Park.
ILLOVO: The office node in Rudd Rd, Oxford Rd and Illovo Boulevard areas.
MELROSE / WAVERLEY: The area enclosed by Corlett Dr, Oxford Rd, Glenhove Rd and Atholl-
Oaklands/Scott St as well as the Waverley area across the M1 Highway.
MIDRAND: Includes buildings which are predominantly offices in the Midrand and Halfway House area.
MILPARK: Includes the Richmond/Sunnyside office development node, the Milpark developments west
of Empire Rd, the SABC complex and surrounding offices.
MORNINGSIDE: Includes Morningside, Morningside Manor & Gallo Manor areas bounded by Kelvin
Dr, Bowling Rd, South Rd and the Western Service Rd/M1.
NEWTOWN: Includes the areaÊ enclosed by Commissioner, West, Car and Queen Streets.
PARKTOWN: Includes the Parktown nodes adjacent to Jan Smuts Ave up to the ridge, Central Parktown
and the office area around Anerley Rd and Sunnyside Park Hotel.
T: (011) 883 0679 F: (011) 883 0684
Email: marketingmanager@sapoa.org.za 17
Web: www.sapoa.org.zaQ4 Office Vacancy Report
December 2017
OFFICE NODE DEFINITIONS
JOHANNESBURG...continued
RANDBURG: The Randburg CBD and extending into Ferndale, north to Bond St, west to
Malibongwe Dr and east along Bram Fischer Dr into Jan Smuts Ave adjoining Bordeaux, up to
Republic Rd. Also continuing south along both sides of Bram Fischer until Conrad Dr in Blairgowrie.
RANDPARK/RANDPARK RIDGE: Bounded by N1 to the south, Randpark Ridge to the west,
Boskruin/Bromhof to the east and Christiaan de Wet/Northumberland to the north.
RIVONIA: The office node along Rivonia Rd up to 12th Ave, bounded by Summit Rd to the west,
Bowling Rd to the east and Cullinan Place to the south.
ROSEBANK: Bounded by Bolton Rd, Jan Smuts Ave, Oxford Rd and Jellicoe Ave, including sundry
buildings in Parkwood and Parktown North along the major arterial Rds.
SANDTON AND ENVIRONS: The Sandton CBD & adjacent office nodes incl. Wierda Valley, Benmore
& Sandown. Also included are the offices along Katherine Rd travelling towards the M1 highway.
SUNNINGHILL: Centrally contained in the well-defined commercial hub. The North boundary is the
main residential portion of the suburb. The East boundary terminates at Woodmead Dr. The Southern
boundary is all properties that are accessed directly from Witkoppen Rd until it intersects with Millcliff
Rd which then provides its Western boundary. The exclusion in terms of commercial buildings are the
small, owner occupied properties that were constructed at the northern end of Peltier Rd.
WOODMEAD: The node is contained by the M1 highway to the East, Maxwell Dr to the North and
Kelvin Dr to the South. The bulk of the commercial buildings are located in the office parks located
directly to the West of Woodmead Dr, up to and including those on the Country Club Johannesburg
boundary.
PORT ELIZABETH
CENTRAL/PARK DRIVE: The area bounded by Rink St to the East, Park Dr/Cape Rd to the South,
Mount Rd to the west and Westbourne Rd to the North.
GREENACRES: The area bounded by Koningham Rd to the East, Westview Dr to the South, 2nd Ave
to the West and Norvic Dr/Worricker St to the North.
NEWTON PARK: The area bounded by 2nd Ave to the East, Hurd St to the South, 7th Ave and to the
West and King Edward St to the North.
WALMER/FAIRVIEW: The area bounded by 1st Ave to the East, Heugh Rd to the South, William
Moffett Expressway and 17th Ave to the West and Main Rd to the North.
T: (011) 883 0679 F: (011) 883 0684
Email: marketingmanager@sapoa.org.za 18
Web: www.sapoa.org.zaQ4 Office Vacancy Report
December 2017
OFFICE NODE DEFINITIONS
CAPE TOWN
BELLVILLE: Jip de Jager/Mike Pienaar to the West, Voortrekker Rd to the South, Old Oak to the East
and Van Riebeeck Rd to the North.
CBD CAPE TOWN: Chiappini St to West, Gardens suburb to South, Tennant St to East and Harbour
Freeway to North.
CENTURY CITY: Properties within the Century City mixed use node; includes offices located either
side of Ratanga Road up to Century Boulevard
CLAREMONT: Highwick/Pine to the South, Protea/Campground Rd to the North, Palmyra to the East
and the M3 to the West.
CENTRAL: Encompasses the Pinelands Office node and the Black River Park precinct. Bounded by
Settlers Way to the South, Jan Smuts to the North and East and Liesbeek Parkway to the West.
RONDEBOSCH / NEWLANDS: Protea/Campground Rd to the South, Woolsack Rd to the North,
Campground Rd to the East and the M3 to the West.
WATERFRONT: Properties within the V&A Waterfront precinct.
DURBAN
BALLITO: The main area of Ballito and surrounds, including Salt Rock and the Dube Tradeport.
BEREA: Offices located in the larger Berea area west of the M4 & R104 and south of the M19.
CBD DURBAN: The area bounded by Victoria Embankment and Winder St to the south, the railway
line, Cross St, First Ave and Stamford Hill Rd to the west, Argyle Rd to the north and Brickhill and Point
Rds to the east.
HILLCREST/GILLITS: The Hillcrest office node can be defined as a triangular shape bounded by King
Cetshwayo Highway (M13) in the south, Kassier Rd to the west and a line from the intersection of
Kassier Rd & the R103 (Main Rd) to the intersection of King Cetshwayo Highway (M13) in the north
east. Also included in this node are offices
UMHLANGA/LA LUCIA: Includes the office properties adjacent to Armstrong Avenue in La Lucia
through to the M41 in Umhlanga. To the west , the node includes the office properties located along
Flanders Drive in Mount Edgecombe while to the north and east, the node includes the New Town
Centre node, Ridgeside and office located along Lighthouse Road to Lagoon Drive.
WESTVILLE: Offices located in the larger Westville area of Durban including those located along The
Boulevard in the south and the N2 to the east.
T: (011) 883 0679 F: (011) 883 0684
Email: marketingmanager@sapoa.org.za 19
Web: www.sapoa.org.zaQ4 Office Vacancy Report
December 2017
OFFICE NODE DEFINITIONS
PRETORIA
ARCADIA: Bounded by Du Toit St to the west, Hill St to the east, Schoeman and Park Sts to the south
and Belvedere St to the north.
BROOKLYN/ NIEUW MUCKLENEUK/ GROENKLOOF/WATERKLOOF: Bounded by the Fountains
Circle, Lynnwood Rd, Brooklyn Rd, Dely Rd, Rigel Rd North and Sibelius St.
CBD PRETORIA: Is bounded by Potgieter St to the west, Boom St to the north, Scheiding St to the
south and Du Toit / Van Boeshoten St to the east.
CENTURION CBD:Ê Is bounded by John Vorster extension and Rabie Street to the west, Botha Avenue
to the north and east and Alexandra Road and the N1 highway to the south.
HATFIELD / HILLCREST: Is bounded by Church St to the north, Duncan and Brooklyn Sts to the east,
Festival St to the west and Lynnwood St to the south.
HIGHVELD TECHNOPARK / HIGHVELD EXTENSIONS: The area bounded bu the N1 highway to the
north, Jean Avenue extension to the east, Nellmapius Drive to the south and the Ben Schoeman
highway to the west.
LYNNWOOD/MENLO PARK/HAZELWOOD/PERSEQUOR PARK: Bounded by Brooklyn Rd to the
west, the N4 Freeway to the north, General Louis Botha to the east and Garsfontein Rd to the south.
MENLYN / FAERIE GLEN / ASHLEA GARDENS: Bounded by Dely Rd to the west, Ingersol and Kelvin
Sts to the north, General Louis Botha to the east and Garsfontein Rd to the south.
PRETORIA Ð OTHER SUBURBAN AREAS: Comprises of small office nodes throughout the eastern
suburbs of Pretoria which fall outside the boundries of all the other suburban nodes.
THE WILLOWS / SILVER LAKES / TIJGER VALLEY: The area east of Lynnwood Ridge all along
Lynnwood Road and extension passing through The Willows past Silver Lakes and extending to the
Lombardy Office Park.
SUNNYSIDE: Is bounded by Park St to the north, Johnston St to the east, Walker St to the south and
Du Toit / Van Boeshoten to the west.
T: (011) 883 0679 F: (011) 883 0684
Email: marketingmanager@sapoa.org.za 20
Web: www.sapoa.org.zaQ2 Office Vacancy Report
July 2017
OFFICE GRADE DEFINITIONS
P-grade (Prime grade): Top quality, modern space. Prime buildings are often considered iconic and
a flagship in its market and a pace-setter in establishing top-range rentals. ÊEssential features include
high security- both manned and electronic; as well as a back-up generator and water tank. Includes
the latest or recent generation of building services, ample parking, a prestigious lobby finish and good
views or a good environment. To be considered Prime-grade, an Office should at least be a 4-star
Green Certified building.
A-grade: These buildings are not older than 15 years and have generally undergone major refurbishments.
They feature high quality modern finishes, air conditioning, adequate on-site parking, with market rentals
near the top of the range in the metropolitan areas where they are located. Back-up generator can be
considered essential for a building to be classified as A-grade.
B-grade: Generally older buildings, but accommodation and finishes are close to modern standards
as a result of refurbishments and renovation from time to time. Air conditioning and on-site parking can
be considered essential.
C-grade: Buildings typically in fair condition but with older style finishes, services and building systems.
Infrastructure generally limited. May or may not be air-conditioned or have on-site parking.
Given the vast array of unique office buildings, the above definitions should be used as a guideline
while also being cognisant of additional factors such as:
> quality of finishes > sufficient elevators to floors ratio, tenant
> accessibility, attractiveness amenities (food services, dry-cleaning etc.).
of street environment, > Size & configuration of floorplates:
> safety and security, designed to accommodate one or
severalÊtenants on the same floor.
> back-up electricity & water capability,
> Serviced by a professional property
> floor-to-ceiling ratio
management firm.
> on-site parking
T: (011) 883 0679 F: (011) 883 0684
Email: marketingmanager@sapoa.org.za 21
Web: www.sapoa.org.zaCompleted Buildings New Developments
Node
& Grade
CITY OF JOHANNESBURG
Bedfordview
A 193,319 14,025 7.3% 9.4% 8.9% 8.0% 100 200 130
B 57,919 5,485 9.5% 10.3% 10.6% 8.9% 75 125 100
C 16,378 415 2.5% 30.0% 31.5% 31.6% 93 95 94
Total 267,616 19,924 7.4% 10.9% 10.8% 9.9% 3,550 -
Braamfontein
A 215,721 17,503 8.1% 4.5% 5.8% 5.9% 85 110 102
B 141,838 26,733 18.8% 18.8% 15.8% 10.9% 70 130 83
C 98,516 12,571 12.8% 12.8% 12.8% 2.2% 80 80 80
Total 456,075 56,807 12.5% 10.7% 10.4% 6.7% - -
Bruma
A 70,469 7,391 10.5% 6.8% 5.7% 7.0% 84 100 95
B 31,036 11,565 37.3% 42.0% 18.4% 24.0% 75 105 85
C 1,998 1,998 100.0% 10.5% 81.6% 8.5% 76 76 76
Total 103,503 20,963 20.3% 18.0% 11.5% 12.4% - -
Bryanston/Epsom Downs
A 297,902 24,882 8.4% 7.5% 11.6% 13.8% 110 194 139
B 261,339 24,642 9.4% 9.4% 9.8% 10.0% 82 171 115
C 2,980 1,411 47.3% 47.3% 24.8% 24.8% 90 95 93
Total 562,220 50,934 9.1% 8.6% 11.0% 11.9% 22,630 3,629 200
CBD JOHANNESBURG
A 558,173 16,838 3.0% 3.4% 0.2% 3.3% 75 110 93
B 958,247 215,919 22.5% 23.8% 26.0% 25.8% 54 96 76
C 381,111 93,421 24.5% 27.6% 30.8% 30.4% 25 85 60
Total 1,897,531 326,178 17.2% 18.5% 19.4% 20.2% - -
Constantia Kloof
A 312,788 13,985 4.5% 6.5% 5.3% 5.4% 90 130 120
B 21,743 596 2.7% 1.2% 1.2% 1.2% 75 100 88
Total 334,531 14,581 4.4% 6.2% 5.0% 5.1% - -
Cresta/Blackheath/Randpark
P 75,000 - 0.0% 0.0% 0.0% 0.0% - -
A 54,110 6,027 11.1% 12.8% 12.8% 12.8% 95 130 108
B 42,035 3,074 7.3% 7.0% 5.6% 7.0% 75 110 80
Total 171,145 9,101 5.3% 5.8% 5.4% 5.8% - -
Fourways
P 25,000 - 0.0% 0.0% 0.0% 0.0% - -
A 120,527 17,747 14.7% 13.6% 10.2% 11.6% 95 195 118
B 73,365 8,122 11.1% 12.8% 12.4% 0.0% 100 185 113
Total 218,892 25,869 11.8% 11.7% 9.7% 9.7% - -
Greenstone
P 16,400 - 0.0% 0.0% 0.0% 0.0% - -
A 54,214 2,966 5.5% 5.2% 6.4% 6.7% 110 152 149
Total 70,614 2,966 4.2% 4.0% 4.9% 5.1% - -
Houghton/Killarney
A 124,822 16,874 13.5% 12.4% 9.9% 10.1% 105 185 140
B 2,200 - 0.0% 0.0% 0.0% 0.0% - -
Total 127,022 16,874 13.3% 12.2% 9.7% 9.9% - -
Hyde Park/Dunkeld
A 40,867 664 1.6% 2.7% 2.7% 1.9% 140 195 168
B 75,233 4,420 5.9% 5.5% 11.2% 7.0% 111 200 144
Total 116,100 5,084 4.4% 4.5% 8.2% 5.2% - -
Illovo
P 22,600 600 2.7% 1.1% 0.0% 0.0% 190 190 190
A 172,452 17,586 10.2% 11.7% 11.4% 13.5% 125 175 165
B 27,164 3,317 12.2% 10.7% 10.5% 8.3% 120 180 155
Total 222,216 21,503 9.7% 10.5% 10.1% 11.5% - -
Melrose/Waverley
P 116,000 4,084 3.5% 4.0% 3.9% 5.1% 165 165 165
A 50,799 10,890 21.4% 15.2% 12.8% 12.8% 149 185 150
B 16,697 - 0.0% 0.0% 0.6% 0.0% - -
C 3,500 - 0.0% 10.3% 10.3% 10.3% - -
Total 186,996 14,974 8.0% 6.5% 5.9% 6.6% - -
Midrand
P 8,000 - 0.0% 0.0% 0.0% 0.0% - -
A 416,086 66,852 16.1% 15.9% 11.7% 12.3% 75 189 100
B 208,047 28,419 13.7% 15.6% 16.5% 12.3% 44 142 85
C 19,231 9,225 48.0% 50.8% 62.6% 54.4% 70 85 78
Total 651,364 104,496 16.0% 16.6% 14.6% 13.4% 24,000 21,500 156
Milpark
A 27,900 1,500 5.4% 0.0% 0.0% 0.0% - -
B 169,326 15,478 9.1% 4.6% 10.3% 9.6% 80 105 87
C 18,346 980 5.3% 6.1% 6.1% 8.3% 80 80 80
Total 215,572 17,958 8.3% 4.1% 8.6% 8.3% - -
Morningside
A 64,647 12,785 19.8% 20.3% 22.2% 22.0% 70 125 115
B 33,722 3,414 10.1% 29.9% 19.0% 20.2% 125 125 125
Total 98,369 16,198 16.5% 22.4% 21.6% 21.6% - -
Newtown
P 30,000 - 0.0% 0.0% 0.0% 0.0% - -
A 79,683 2,352 3.0% 5.6% 5.6% 3.4% 100 100 100
B 77,700 18,000 23.2% 27.4% 27.4% 29.9% 95 95 95
C 6,300 - 0.0% 0.0% 0.0% 0.0% - -
Total 193,683 20,352 10.5% 13.3% 13.3% 14.4% - -
Parktown
A 179,256 23,954 13.4% 15.8% 10.8% 8.5% 95 155 123
B 226,713 41,684 18.4% 19.1% 14.5% 9.6% 85 161 99
C 19,220 7,334 38.2% 38.2% 38.2% 44.8% 95 95 95
Total 425,189 72,972 17.2% 18.9% 14.4% 11.1% - -
22Completed Buildings New Developments
Node
& Grade
, ,
Randburg
P 47,000 - 0.0% 0.0% 0.0% 0.0% - -
A 93,529 7,448 8.0% 7.0% 6.7% 5.9% 80 120 85
B 276,795 52,203 18.9% 17.5% 18.4% 17.0% 45 105 75
C 22,400 2,616 11.7% 11.7% 11.7% 11.7% 50 65 60
Total 439,724 62,267 14.2% 14.0% 14.6% 13.7% - -
Rivonia
A 10,873 884 8.1% 8.4% 4.9% 8.4% 145 145 145
B 262,483 41,940 16.0% 15.9% 15.5% 15.5% 57 185 97
C 5,834 - 0.0% 0.0% 1.2% 1.2% - -
Total 279,190 42,824 15.3% 15.2% 14.8% 15.0% - -
Rosebank
P 94,680 3,000 3.2% 3.3% 3.3% 0.0% 215 215 215
A 129,163 14,048 10.9% 18.8% 22.1% 15.6% 120 200 160
B 135,254 17,357 12.8% 12.2% 23.6% 16.9% 95 250 125
C 13,582 65 0.5% 0.5% 0.5% 0.5% 115 115 115
Total 372,679 34,470 9.2% 11.9% 17.6% 13.0% 85,344 39,444 190
Sandton
P 734,013 47,451 6.5% 4.8% 6.5% 3.6% 165 240 195
A 735,613 129,315 17.6% 16.5% 17.3% 13.3% 95 200 145
B 241,521 62,670 25.9% 11.7% 11.7% 7.8% 90 175 125
Total 1,711,147 239,435 14.0% 11.3% 12.8% 9.1% 196,148 Ê34,761 249
Sunninghill
A 168,831 20,486 12.1% 8.4% 10.4% 10.5% 75 150 90
B 194,849 8,940 4.6% 5.3% 4.1% 4.4% 75 110 90
Total 363,680 29,426 8.1% 6.7% 7.0% 7.4% - -
Waterfall
P 43,850 3,500 8.0% 0.0% 0.0% 0.0% 210 210 210
A 52,435 557 1.1% 8.9% 8.9% 8.9% 171 171 171
Total 96,285 4,057 4.2% 5.6% 5.6% 5.6% 93,300 333
Woodmead
A 320,184 23,055 7.2% 7.3% 7.3% 7.9% 90 145 128
B 127,330 6,853 5.4% 7.1% 27.9% 32.7% 75 100 90
Total 447,514 29,907 6.7% 7.2% 13.7% 13.7% - -
CITY OF CAPE TOWN
Bellville
A 369,797 6,760 1.8% 1.4% 0.6% 1.7% 110 150 120
B 161,441 16,201 10.0% 9.7% 8.8% 8.3% 95 120 103
C 18,548 5,216 28.1% 24.3% 25.3% 23.1% 50 120 70
Total 549,786 28,177 5.1% 4.9% 4.1% 4.4% 5,600 2,500
Claremont
P 6,000 - 0.0% 0.0% 6.4% 8.5% - -
A 62,636 814 1.3% 0.3% 2.5% 2.5% 185 185 185
B 45,286 4,337 9.6% 3.9% 3.8% 8.0% 125 180 135
C 9,679 1,625 16.8% 16.4% 15.4% 16.7% 45 120 93
Total 123,601 6,776 5.5% 2.9% 4.2% 5.9% 5,500 5,500
CBD CAPE TOWN
P 52,000 5,512 10.6% 10.6% 13.7% 13.8% 185 185 185
A 361,883 21,567 6.0% 6.7% 8.3% 8.5% 125 150 145
B 515,262 53,733 10.4% 10.9% 11.4% 11.6% 80 150 110
C 118,878 23,231 19.5% 17.8% 19.2% 19.3% 50 110 85
Total 1,048,023 104,043 9.9% 10.3% 11.3% 11.5% 36,000 36,000
Rondebosch/Newlands
A 71,654 3,498 4.9% 3.1% 3.2% 3.3% 175 190 183
B 30,877 2,874 9.3% 8.6% 11.2% 8.2% 100 165 135
Total 102,531 6,372 6.2% 4.8% 5.6% 4.7% - -
Century City
P 45,880 1,421 3.1% 4.2% 4.2% 3.8% 140 185 163
A 252,669 21,594 8.5% 8.7% 9.3% 8.8% 130 175 140
B 39,563 2,079 5.3% 4.7% 4.1% 4.4% 115 130 125
Total 338,112 25,094 7.4% 7.6% 8.0% 7.6% 17,000 9,000
Central
A 272,975 4,071 1.5% 1.1% 1.2% 1.8% 145 155 145
B 36,741 2,075 5.6% 5.2% 9.8% 10.2% 105 110 108
Total 309,716 6,146 2.0% 1.5% 2.2% 2.8% - -
Waterfront
P 51,000 3,151 6.2% 6.3% 8.0% 1.9% 235 235 235
A 69,555 1,915 2.8% 1.7% 0.3% 0.1% 190 204 197
B 6,298 - 0.0% 0.0% 0.0% 0.0% - -
Total 126,853 5,066 4.0% 3.5% 3.4% 0.8% - -
eTHEKWINI MUNICIPALITY
BALLITO
P 3,512 100 2.8% 0.0% 0.0% 1.4% 172 172 172
A 15,913 2,070 13.0% 22.9% 23.1% 11.9% 105 169 115
B 13,207 664 5.0% 4.0% 6.1% 6.1% 70 90 75
C 12,991 494 3.8% 6.6% 2.5% 3.8% 70 100 70
Total 45,623 3,328 7.3% 14.7% 14.3% 6.9% - -
BEREA
A 55,621 1,549 2.8% 1.6% 3.5% 3.2% 95 150 130
B 34,983 5,264 15.0% 14.9% 16.7% 22.7% 75 160 120
C 17,653 3,436 19.5% 17.1% 2.7% 3.4% 85 135 115
Total 108,257 10,249 9.5% 8.4% 7.6% 9.5% - -
CBD DURBAN
A 203,280 40,047 19.7% 19.5% 21.4% 20.8% 70 115 100
B 236,131 40,375 17.1% 12.3% 15.7% 15.9% 70 110 93
C 313,565 58,114 18.5% 18.5% 16.6% 16.6% 50 90 60
Total 752,976 138,536 18.4% 16.8% 17.7% 17.6% - -
23Completed Buildings New Developments
Node
& Grade
HILLCREST/GILLITS
P 4,497 535 11.9% 8.2% 10.7% 10.7% 135 145 139
A 28,735 2,805 9.8% 9.8% 9.4% 9.4% 110 140 116
B 6,402 332 5.2% 5.2% 5.2% 5.2% 110 130 115
C 1,446 65 4.5% 4.5% 4.5% 4.5% 115 115 115
Total 41,080 3,737 9.1% 8.8% 8.7% 8.7% - -
UMHLANGA/LA LUCIA
P 22,395 418 1.9% 1.9% 1.9% 1.9% 145 145 145
A 361,953 13,327 3.7% 3.2% 5.4% 5.2% 115 241 130
B 33,267 2,939 8.8% 7.9% 3.0% 6.4% 100 135 130
Total 417,615 16,684 4.0% 3.4% 5.1% 5.1% 70,567 1,400 200
WESTVILLE
A 65,221 7,192 11.0% 12.4% 16.2% 15.5% 100 140 125
B 136,537 13,983 10.2% 10.3% 9.3% 8.7% 85 135 120
Total 201,758 21,175 10.5% 11.0% 11.5% 10.9% 4,000 -
CITY OF TSHWANE
ARCADIA
A 125,570 9,537 7.6% 7.6% 7.6% 7.6% 115 150 133
B 120,740 12,370 10.2% 10.4% 10.1% 10.1% 40 99 92
C 110,610 1,063 1.0% 1.0% 1.0% 1.0% 70 90 80
Total 356,920 22,970 6.4% 6.5% 6.4% 6.4% - -
BROOKLYN/NIEUW MUCKLENEUK/GROENKLOOF/WATERKLOOF
A 119,350 5,163 4.3% 4.0% 4.2% 5.2% 138 180 154
B 132,964 26,675 20.1% 13.2% 9.6% 9.8% 110 150 125
Total 252,314 31,838 12.6% 8.8% 7.0% 7.6% - -
CBD PRETORIA
A 134,580 1,789 1.3% 1.3% 1.3% 1.3% 65 65 65
B 378,272 48,412 12.8% 12.8% 12.9% 11.2% 60 100 80
C 210,300 23,621 11.2% 11.2% 11.2% 11.2% 60 95 78
Total 723,152 73,822 10.2% 10.2% 10.3% 9.3% - -
CENTURION CBD
A 251,799 20,178 8.0% 10.0% 10.0% 11.1% 70 209 125
B 233,847 53,735 23.0% 22.5% 22.4% 22.3% 70 143 95
Total 485,646 73,913 15.2% 16.5% 16.5% 16.9% 18,000 -
HATFIELD/HILLCREST
A 86,630 12,716 14.7% 12.0% 13.2% 13.2% 135 165 150
B 194,890 16,402 8.4% 7.8% 7.9% 8.3% 80 165 105
Total 281,520 29,118 10.3% 9.1% 9.5% 9.9% 13,000 8,900 215
HIGHVELD TECHNOPARK & EXTENSIONS
A 386,160 35,644 9.2% 9.4% 11.2% 8.7% 120 209 132
B 203,892 20,022 9.8% 9.9% 10.0% 10.0% 77 120 104
Total 590,052 55,666 9.4% 9.5% 10.9% 9.1% 15,000 15,000 155
LYNNWOOD/MENLO PARK/PERSEQUOR PARK/HAZELWOOD
P 44,680 476 1.1% 1.9% 1.7% 3.1% 177 196 187
A 85,169 12,256 14.4% 8.9% 4.1% 2.9% 128 220 167
B 112,440 15,063 13.4% 15.2% 15.2% 13.4% 80 145 110
Total 242,289 27,795 11.5% 10.6% 14.1% 7.5% 11,360 3,098 181
MENLYN/FAERIE GLEN/ASHLEA GARDENS
A 245,765 28,030 11.4% 14.9% 13.6% 11.4% 110 215 190
B 135,100 13,616 10.1% 9.9% 11.7% 12.7% 97 120 110
Total 380,865 41,646 10.9% 13.1% 12.9% 11.8% - -
SILVER LAKES/ THE WILLOWS
A 67,196 2,235 3.3% 3.7% 3.7% 4.5% 130 160 157
B 30,425 1,814 6.0% 6.0% 2.5% 0.8% 110 125 118
C 3,000 202 6.7% 6.7% 5.6% 5.6% 85 85 85
Total 100,621 4,251 4.2% 4.5% 3.4% 3.4% 4,500 4,500 165
Pta Other Eastern Suburbs/ Route 21
A 88,484 6,752 7.6% 9.8% 9.7% 9.7% - -
B 252,439 25,765 10.2% 13.9% 11.6% 11.9% 75 149 105
C 33,810 3,218 9.5% 10.8% 6.5% 6.4% 70 110 85
Total 374,733 35,735 9.5% 12.7% 10.7% 10.9% - -
SUNNYSIDE
C 72,700 1,266 1.7% 1.7% 1.7% 1.7% 68 85 75
Total 72,700 1,266 1.7% 1.7% 1.7% 1.7% - -
NELSON MANDELA BAY MUNICIPALITY
CENTRAL/PARK DRIVE
B 8,366 - 0.0% 0.0% 0.0% 0.0% - -
Total 8,366 - 0.0% 0.0% 0.0% 0.0% - -
GREENACRES
P 4,287 - 0.0% 0.0% 0.0% 0.0% - -
A 16,964 895 5.3% 4.8% 7.7% 11.3% 95 100 98
B 48,452 3,601 7.4% 9.6% 13.3% 13.3% 75 130 85
C 747 - 0.0% 0.0% 0.0% 0.0% - -
Total 70,450 4,496 6.4% 7.7% 10.9% 11.9% - -
HUMERAIL
A 7,376 - 0.0% - -
Total 7,376 - 0.0% 2,785 560 150
NEWTON PARK
P 16,621 800 4.8% 4.8% 4.8% 4.8% 135 135 135
A 967 - 0.0% 0.0% 0.0% 0.0% - -
B 3,514 1,202 34.2% 34.2% 28.7% 28.7% 70 75 73
Total 21,102 2,002 9.5% 9.5% 8.6% 8.6% - -
WALMER/FAIRVIEW
A 21,727 1,800 8.3% 1.2% 8.6% 8.6% 110 110 110
B 3,008 344 11.4% 11.4% 11.4% 8.1% 85 85 85
Total 24,735 2,144 8.7% 2.4% 8.9% 8.5% - -
24Q4 Office Vacancy Report
December 2017
ABOUT MSCI
For more than 40 years, MSCIÕs research-based indexes and analytics have helped
the worldÕs leading investors build and manage better portfolios.Ê
Clients rely on our offerings for deeper insights into the drivers of performance and risk
in their portfolios, broad asset class coverage and innovative research.
Our line of products and services includes indexes, analytical models, data, real estate
benchmarks and ESG research.Ê
MSCI serves 98 of the top 100 largest money managers, according to the most
recent P&I ranking.
For more information, visit us at www.msci.com
Report compiled by:
T: (011) 883 0679 F: (011) 883 0684
Email: marketingmanager@sapoa.org.za 25
Web: www.sapoa.org.zaQ4 Office Vacancy Report
December 2017
NOTICE AND DISCLAIMER
This document and all of the information contained in it, including without limitation all text, data, graphs, charts (collectively, the
ÒInformationÓ) is the property of MSCI Inc. or its subsidiaries (collectively, ÒMSCIÓ), or MSCIÕs licensors, direct or indirect suppliers or any
third party involved in making or compiling any Information (collectively, with MSCI, the ÒInformation ProvidersÓ) and is provided for
informational purposes only.Ê The Information may not be modified, reverse-engineered, reproduced or redisseminated in whole or in
part without prior written permission from MSCI.
The Information may not be used to create derivative works or to verify or correct other data or information.ÊÊ For example (but without
limitation), the Information may not be used to create indexes, databases, risk models, analytics, software, or in connection with the
issuing, offering, sponsoring, managing or marketing of any securities, portfolios, financial products or other investment vehicles utilizing
or based on, linked to, tracking or otherwise derived from the Information or any other MSCI data, information, products or services.Ê
The user of the Information assumes the entire risk of any use it may make or permit to be made of the Information.Ê NONE OF THE
INFORMATION PROVIDERS MAKES ANY EXPRESS OR IMPLIED WARRANTIES OR REPRESENTATIONS WITH RESPECT TO
THE INFORMATION (OR THE RESULTS TO BE OBTAINED BY THE USE THEREOF), AND TO THE MAXIMUM EXTENT PERMITTED
BY APPLICABLE LAW, EACH INFORMATION PROVIDER EXPRESSLY DISCLAIMS ALL IMPLIED WARRANTIES (INCLUDING,
WITHOUT LIMITATION, ANY IMPLIED WARRANTIES OF ORIGINALITY, ACCURACY, TIMELINESS, NON-INFRINGEMENT,
COMPLETENESS, MERCHANTABILITY AND FITNESS FOR A PARTICULAR PURPOSE) WITH RESPECT TO ANY OF THE
INFORMATION.
Without limiting any of the foregoing and to the maximum extent permitted by applicable law, in no event shall any Information Provider
have any liability regarding any of the Information for any direct, indirect, special, punitive, consequential (including lost profits) or any
other damages even if notified of the possibility of such damages. The foregoing shall not exclude or limit any liability that may not by
applicable law be excluded or limited, including without limitation (as applicable), any liability for death or personal injury to the extent
that such injury results from the negligence or willful default of itself, its servants, agents or sub-contractors.Ê
Information containing any historical information, data or analysis should not be taken as an indication or guarantee of any future
performance, analysis, forecast or prediction.Ê Past performance does not guarantee future results.Ê
The Information should not be relied on and is not a substitute for the skill, judgment and experience of the user, its management,
employees, advisors and/or clients when making investment and other business decisions.Ê All Information is impersonal and not tailored
to the needs of any person, entity or group of persons.
None of the Information constitutes an offer to sell (or a solicitation of an offer to buy), any security, financial product or other investment
vehicle or any trading strategy.
It is not possible to invest directly in an index.Ê Exposure to an asset class or trading strategy or other category represented by an index
is only available through third party investable instruments (if any) based on that index.ÊÊ MSCI does not issue, sponsor, endorse, market,
offer, review or otherwise express any opinion regarding any fund, ETF, derivative or other security, investment, financial product or
trading strategy that is based on, linked to or seeks to provide an investment return related to the performance of any MSCI index
(collectively, ÒIndex Linked InvestmentsÓ). MSCI makes no assurance that any Index Linked Investments will accurately track index
performance or provide positive investment returns.Ê MSCI Inc. is not an investment adviser or fiduciary and MSCI makes no representation
regarding the advisability of investing in any Index Linked Investments.
Index returns do not represent the results of actual trading of investible assets/securities. MSCI maintains and calculates indexes, but
does not manage actual assets. Index returns do not reflect payment of any sales charges or fees an investor may pay to purchase the
securities underlying the index or Index Linked Investments. The imposition of these fees and charges would cause the performance of
an Index Linked Investment to be different than the MSCI index performance.
The Information may contain back tested data.Ê Back-tested performance is not actual performance, but is hypothetical.Ê There are
frequently material differences between back tested performance results and actual results subsequently achieved by any investment
strategy.Ê
Constituents of MSCI equity indexes are listed companies, which are included in or excluded from the indexes according to the application
of the relevant index methodologies. Accordingly, constituents in MSCI equity indexes may include MSCI Inc., clients of MSCI or suppliers
to MSCI.Ê Inclusion of a security within an MSCI index is not a recommendation by MSCI to buy, sell, or hold such security, nor is it
considered to be investment advice.
Data and information produced by various affiliates of MSCI Inc., including MSCI ESG Research Inc. and Barra LLC, may be used in
calculating certain MSCI indexes.Ê More information can be found in the relevant index methodologies on www.msci.com.
MSCI receives compensation in connection with licensing its indexes to third parties.Ê MSCI Inc.Õs revenue includes fees based on assets
in Index Linked Investments. Information can be found in MSCI Inc.Õs company filings on the Investor Relations section of www.msci.com.
MSCI ESG Research Inc. is a Registered Investment Adviser under the Investment Advisers Act of 1940 and a subsidiary of MSCI Inc.Ê
Except with respect to any applicable products or services from MSCI ESG Research, neither MSCI nor any of its products or services
recommends, endorses, approves or otherwise expresses any opinion regarding any issuer, securities, financial products or instruments
or trading strategies and MSCIÕs products or services are not intended to constitute investment advice or a recommendation to make
(or refrain from making) any kind of investment decision and may not be relied on as such. Issuers mentioned or included in any MSCI
ESG Research materials may include MSCI Inc., clients of MSCI or suppliers to MSCI, and may also purchase research or other products
or services from MSCI ESG Research.Ê MSCI ESG Research materials, including materials utilized in any MSCI ESG Indexes or other
products, have not been submitted to, nor received approval from, the United States Securities and Exchange Commission or any other
regulatory body.
Any use of or access to products, services or information of MSCI requires a license from MSCI.Ê MSCI, Barra, RiskMetrics, IPD, FEA,
InvestorForce, and other MSCI brands and product names are the trademarks, service marks, or registered trademarks of MSCI or its
subsidiaries in the United States and other jurisdictions.Ê The Global Industry Classification Standard (GICS) was developed by and is
the exclusive property of MSCI and Standard & PoorÕs.Ê ÒGlobal Industry Classification Standard (GICS)Ó is a service mark of MSCI and
Standard & PoorÕs.
T: (011) 883 0679 F: (011) 883 0684
Email: marketingmanager@sapoa.org.za 26
Web: www.sapoa.org.zaSAPOA - South African Property Owners Association T: (011) 883 0679 - F: (011) 883 0684 Email: marketingmanager@sapoa.org.za Web: www.sapoa.org.za Physical: Paddock View, Hunt's End Office Park, 36 Wierda Road West, Wierda Valley, Sandton Postal: P O Box 78544, Sandton 2146 Report compiled by:
You can also read