2019 Bond Market Outlook: A Global Sea Change Underway
←
→
Page content transcription
If your browser does not render page correctly, please read the page content below
2019 Bond Market Outlook:
A Global Sea Change Underway
Eric Reynolds, Director of Taxable Fixed Income Strategy
Hancock Whitney Asset Management
December 19, 2018

This is an inaugural commentary by Hancock Whitney Asset Management’s new Investment Director, Eric Reynolds, who
joined the Hancock Whitney Asset Management team as a result of Hancock Whitney Bank’s recent acquisition of Capital
One Bank’s Trust & Asset Management division. Mr. Reynolds will offer views and analysis on a periodic basis to provide
insight to the world we invest in, insight into how our views inform investment decisions and how these decisions are
intended to benefit clients.

Market Landscape: A tightening Federal Reserve, rising long term interest rates, widening credit spreads, near
zero year-to-date returns, solid but moderating domestic growth and slowing growth abroad are the forces bond investors
have contended with in 2018. As we approach 2019 investors have questions and concerns. Will the Federal Reserve
tighten too much and injure U.S. growth? Will the positive effects of fiscal stimulus wear off in 2019? Will trade frictions
with China hurt U.S. and global growth? Will Brexit, the U.K.’s scheduled March 2019 departure from the European Union,
undermine the global economy and in turn slow U.S. growth? What will happen to interest rates and credit risk
premiums? And finally, how should bond investors position themselves in 2019. It’s a lot to think about and position for.
The following is our perspective and positioning as we head into 2019.

Federal Reserve: Today, the Federal Reserve raised the federal funds rate by 0.25%, taking the rate to 2.5%. The
Fed will slow the cadence of their tightening cycle from 2018’s four rate hikes to 2 or fewer 0.25% rate hikes in 2019.
Future rate hikes will only occur if there is sufficient growth. Neither Hancock Whitney Asset Management nor the market
in general is likely to be very surprised by the Federal Reserve’s short term rate policy in 2019 as the Fed will move slowly
and guide market expectations. The Federal Reserve’s dual mandate of price stability and full employment will keep the
Fed focused upon inflation and unemployment. The Fed’s perspective on inflation and unemployment will be influenced
not only by the prospects for both domestic and global growth, but also by a desire for global market stability. Today,
global considerations have a greater role in Fed decision making than in the past because the Federal Reserve led central
banks around the world in responding to the global 2008 Great Recession. Through its actions, the Federal Reserve is
now leading global central banks out of the period of exceptional global monetary accommodation, whether it
acknowledges this leadership role or not.

                                                               1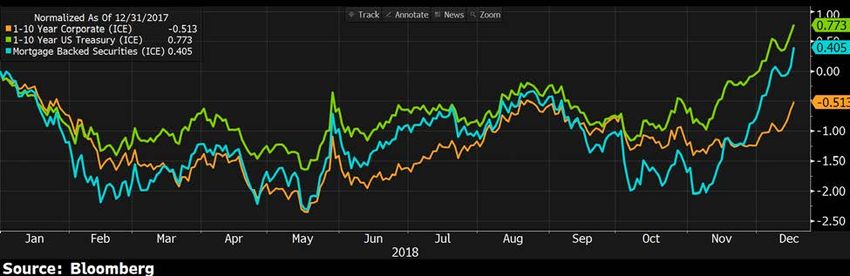
Employment: The U.S. jobs market has been solid in 2018, creating on average just over 200,000 net new jobs per
month as measured by nonfarm payrolls. This level of monthly net new job creation is about 80,000 more jobs than is
needed to keep up with the rate of population growth. U.S. job creation has been extremely stable, averaging about
                                              1
200,000 net new jobs per month since 2010 . This has pulled about 7 million people off of the sidelines and back into
positions of employment since 2010. While this is impressive, during the 2008 financial crisis, the U.S. not only failed to
create the jobs needed to simply keep pace with population growth, but also lost 8.6 million jobs outright, thereby creating
                         2
an 11 million jobs deficit . So while the jobs market is beginning to show signs of tightness, the economy probably still
needs to pull another million or so workers from the sidelines and into jobs before we begin to see broad based wage
pressure. Wage driven inflation is probably not a 2019 problem for the U.S. Going forward a 12 month average nonfarm
payroll growth of 170,000 jobs per month or better will confirm continued U.S. economic vitality; a 12 month average
below 130,000 jobs per month would be cause for concern. Our outlook is that nonfarm payroll gains will slow to about
160,000 jobs per month in 2019.

Inflation: The Federal Reserve’s preferred measure of inflation, the core personal consumption expenditure deflator,
i.e. excluding food and energy prices, is presently running at a 1.8% rate over the previous 12 months. The Fed’s target
inflation rate is 2%. The lack of tight labor conditions, 2018’s dollar strength, and the recent drop in oil prices probably
provides enough headwinds to keep U.S. inflation in check in 2019. When we look to the rest of the world we see that in
2018, Japan’s core inflation is running at just 0.4% over the previous 12 months. Further, we note that since 1990, when
Japan’s bubble burst, their core inflation rate has averaged an annual rate of just 0.3%. In the Eurozone, core inflation is
running at just 1.0% in 2018. Since the onset of the deflationary Great Recession in 2008, the Eurozone’s core inflation
                        3
has averaged just 1.1% . Given the opportunity, the Federal Reserve and central banks around the world would welcome
moderately above target inflation that might accompany stronger growth. Inflation is not the world’s problem.

Deflation: The threat of chronic deflation, falling asset prices, is a continuing risk for the world’s industrial economies.
Deflation is the disease that central banks have been treating with a financial medicine called quantitative easing (QE)
since the onset of the Financial Crisis in 2008. QE is the central bank practice of printing money to purchase securities, an
act which pumps money (liquidity) into the global financial system. Prior to the 2008 Financial Crisis, the Federal Reserve
had never used this QE medicine. The use of QE was an exceptional action done to combat the threat of depression era
like deflation by propping up asset prices. Quantitative tightening (QT) is the opposite of QE. QT is the process of
removing the liquidity that has been pumped into the global financial system by QE. The Federal Reserve stopped its QE
                   th
program in in the 4 quarter of 2014 and began a program of QT in the fourth quarter of 2017. In 2018, the Fed
accelerated the pace of its QT program. On a global basis, in 2018 there has been a dramatic $2 trillion plus reduction in
the cumulative amount of liquidity provided by the 3 largest central banks (chart 1 below). Charts 2, 3 and 4 illustrate the

                                                               2
equally dramatic impact that reduced liquidity has had on credit spreads (widened), interest rates (increased), and on non-
U.S. equity prices (down). As liquidity is drained from the global swimming pool, financial assets become less buoyant. In
2019, the Federal Reserve will continue with QT, the European Central Bank (ECB) is scheduled to stop its program of
QE, and the Bank of Japan (BOJ) is expected to continue running its QE at its current and slowest pace in years. In 2018,
U.S. equities have held up the best and U.S interest rates have risen because the U.S. economy is strong, growing and
dynamic. These qualities have made the U.S. less vulnerable to deflation and better positioned to transition to financial
normalcy than other developed nations. U.S. resilience has been a primary reason for our long term tilt towards the U.S.
The removal of global liquidity is the sea change. In 2019, we will continue to position portfolios in a fashion that accounts
for the removal of global liquidity.

           Source: Hancock Whitney Asset Management proprietary research and Federal Reserve (FARBAST), European Central Bank (EBBSTOTA)
           and Bank of Japan (BJACTOTL).

                                   Chart 2: Credit Spreads, December 2012 to December 2018
                                           Highly Influenced by Central Bank Liquidity

                             Chart 3: Ten Year Treasury Yield: December 2016 to December 2018
                                         React to Changes in Central Bank Liquidity

                                                                          3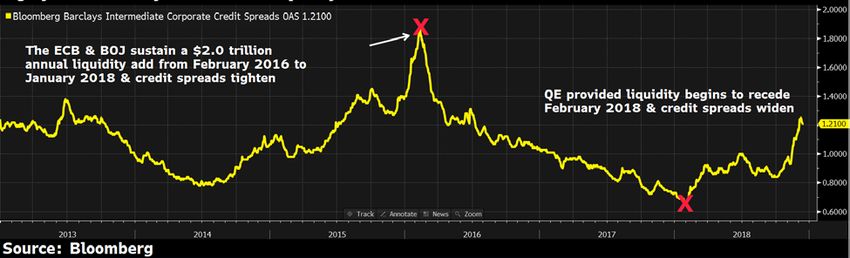
Chart 4: Equity Returns & Global Liquidity
                            Since global liquidity crested asset prices have been less buoyant!
                                                                     Since           Period of
                                                                 Liquidity Crest Massive Liquidity
                                                                  1/31/2018        1/31/2016

                            Select Returns:                      11/30/2018        1/31/2018         ticker
                            Equity                               Crest to Date     Cumulative
                            U.S., S&P 500                            -0.6%           51.7%             SPX
                            U.S., S&P 500 Growth                      2.0%           53.8%            SGX
                            U.S., S&P 500 Value                      -3.4%           48.3%             SVX
                            U.S. Small Cap                            1.5%           56.3%            SML
                            International Equity, All CP Ex U.S.    -14.8%           49.4%           VTIAX
                            Emerging Markets                        -19.0%           73.6%            EEM
                            Europe STXE 600                         -14.9%           41.5%            SXXP
                            Japan, Nikkei 225                        -5.2%           51.5%            NKY
                            China CSI 300 (A Shares Fund, $)        -31.5%           54.4%           PEK US
                            Source: Bloomberg

Growth:      Economic growth is critical because growth drives wealth creation. Growth drives job creation, company

earnings, and is the natural antidote to deflation. When final 2018 numbers are in, if the U.S. economy prints a 3.1% GDP
as we expect, the U.S. will have had one of its best year over year growth rates in the last decade. Our growth outlook for
2019 takes a number of factors into account. First we consider a higher and a lower central tendency for U.S. growth and
then consider influencers that will either upwardly or downwardly impact these central growth tendencies. For 2018 and
2019, some of the influencers were the changing impact of fiscal stimulus, Federal Reserve Policy, regulation, and
prominent global considerations. The prominent global influencers include Brexit, trade frictions with China, and the
European Central Bank’s ability to stop its program of quantitative easing and initiate moving its deposit rate from its
current negative 0.40% towards something positive. The table below shows that we are expecting a 3.1% year over year

                                                                 4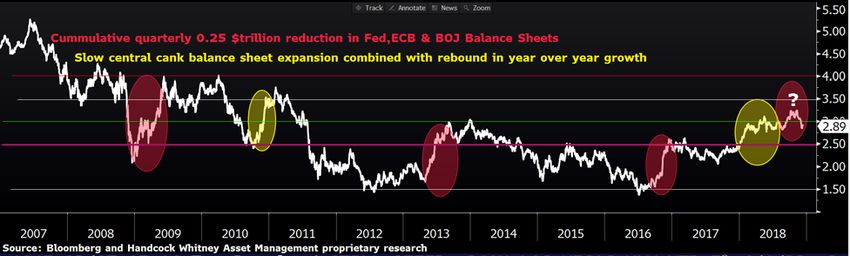
U.S. growth rate for 2018. This forecast represents a high U.S. growth tendency and a boost from outside influences. We
are forecasting a 2.3% year over year U.S. growth rate for 2019, reflecting a strong U.S. growth tendency combined with
drag from outside influences. For things to go real wrong, which we define as a U.S. growth rate below 1.4%, the U.S
would need to shift to a slower growth tendency and the downside scenario for outside influences would need to be worse
than we are projecting.

                    2018 and 2019 U.S. Growth Forecast:
                                                       Baseline      Downside        Upside        Downside          Upside
                                                     U.S. Growth     Influencer    Influences      Influence        Influence
                                                      Tendency          2018          2018           2019             2019
                    High U.S. Growth Tendency*            2.6            2.5           3.1             2.3              2.6
                    Low U.S. Growth Tendency*             1.8            1.7           2.2             1.4              1.8
                    Influencers:
                    Fiscal stimulus                                        0.30        0.50             0.20           0.20
                    Fed Policy                                            -0.20       -0.10            -0.20          -0.10
                    Regulation                                             0.00        0.10             0.10           0.10
                    Brexit                                                 0.00        0.00            -0.05           0.00
                    China Frictions                                       -0.10       -0.05            -0.20          -0.10
                    Europe                                                -0.10       0.00             -0.20          -0.10
                    *During the 2010 to 2017 time frame the U.S. economy had 4 years where growth rates clustered
                    around the high 2.6% annual growth rate and 4 years where the growth clustered around the
                    low 1.8% annual growth rate. There were no mid range outcomes during the 2010 to 2017 period.

                                       Source: Bloomberg and Hancock Whitney Proprietary Research

Brexit: Since December 2007, a U.S. citizen investing in the Stoxx 600, Europe’s equivalent to the S&P 500, has
                                                 4
earned just 0.64% annually on their money . This result is eerily similar to the 1.40% that the same U.S. investor would
                                                                                                                          5
have earned since December of 1990 had they invested in the Nikkei 225 after Japan’s bubble burst . The common
thread is deflation. Japan caught the deflation disease around 1990 and Europe caught it during the financial crisis of
2008. QE is the central bank medicine for deflation and economic growth is the cure for deflation. Eurozone year over
                                                                                                   6
year GDP growth is presently running at 1.6% and it has averaged 1.3% since 2009 . In contrast, the U.S. has grown
                                                                          7
2.2% over this timeframe, about 75% faster than the Eurozone . Brexit, the United Kingdom’s planned March 2019 exit
from the European Union (EU), is not projected to be growth positive for either the U.K. or Europe. A difficult Brexit will
make it harder for the EU to escape deflation and normalize. If Brexit goes badly it will primarily be a European problem
and likely have just a small negative effect on U.S growth.

Europe: An important lesson from Brexit is that the European Commission has shown no flexibility in its negotiations
with the United Kingdom for 2 reasons. First, the European Commission is actively dissuading other European Union (EU)
member nations from leaving the union. The second reason is that the EU is a currency union of disparate countries that
have a central bank, but lacks the authority and hence the ability to effectively govern its member nations. At the heart of
the European Union’s problems is that member nations do not wish to bear the debt or burdens of other member nations.
However, as member nations become more and more indebted, as Greece did, they lose their ability to refinance their

                                                                      5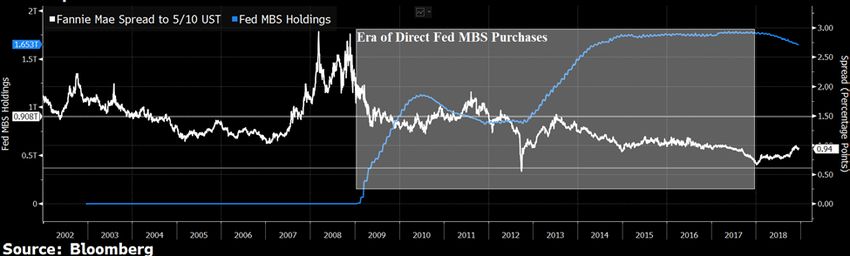
debts or bail out their banks. The EU is in its infancy, being formed in 1993 and the single currency introduced in 1999. To
understand what good governance might look like consider the following. When the U.S. was in its infancy, many states,
particularly the northern states, struggled with large debts accumulated during the Revolutionary war. Concerns about the
credit worthiness of the states caused their debt to trade at substantial discounts to face value. Similar to EU member
nations, individual states, particularly southern states that had little war debt, did not want to bear the debt burdens of
other states. However, unlike the EU in 2018, the U.S. of 1790 was a country with federal powers and a willingness to
govern. The U.S. Federal government was able to reach a compromise with the states and the Federal government
assumed the war debt of individual states. The restored credit of the U.S. allowed the U.S. to use debt to finance the
                                                                                            8,9
Louisiana Purchase in 1803, a purchase which roughly doubled the size of the then U.S . There is no central
government or entity to assume the debt of EU member nations. Who will want to buy the debt of Spain, France,
Germany, Portugal or other member nations at microscopic yields that do not compensate investors for risk when the
European Central Bank stops buying their debt as it terminates its program of quantitative easing? In the absence of
better and effective governance the threat that the EU will simply melt at some point never goes away. While the
dissolution of the currency union may not happen any time soon, Europe’s inability to govern will hinder its ability to grow
its economies, escape deflation, provide competitive returns to investors and normalize central bank policy.

China: China is complex. Our concerns on China include trade frictions, China’s proclivity for nefarious intrusion in the
global supply chain and on its troubling underlying economic fundamentals. The world can tolerate the existing 10% tariffs
that the U.S. has imposed on a limited selection of Chinese goods. However, if the U.S. broadens what is tariffed and
increases the size of tariffs enough then at some point the global supply chain will likely begin to migrate elsewhere,
destabilizing the Chinese economy. This supply chain migration will be less disruptive to the U.S. and to the global
economy. Our view is that there will likely be an agreement that avoids permanently and materially expanding tariffs
because it is strongly in China’s interest to do so. We believe reaching a deal will be a protracted process because a deal
that levels the tariff playing field is only a part of the China story. The Chinese government has a history of
misappropriation of intellectual property and technology for industrial and military purposes. One example is Peoples
Liberation Army members posing as ordinary citizens and attending our top universities to study subjects such as gene
                                                                    10
splicing, nuclear physics, rocket science and artificial intelligence . Another example is the reported infiltration of Chinese
technology companies to weaponize the global technology supply chain by placing virtually undetectable gateway
microchips onto server motherboards that find their way into networks of private multinational distribution companies and
                           11
national security agencies . The current tussle over the arrest in Canada of a senior executive of Huawei Technology
reflects high level concern over the potential for Huawei to use 5G networks of the future to provide the Chinese
government with the capacity to do things like interrupt access to water and electricity or disrupt elements of the financial
system. Huawei is reported to have made more cell phones than Apple last year. If Apple were discovered to be

                                                               6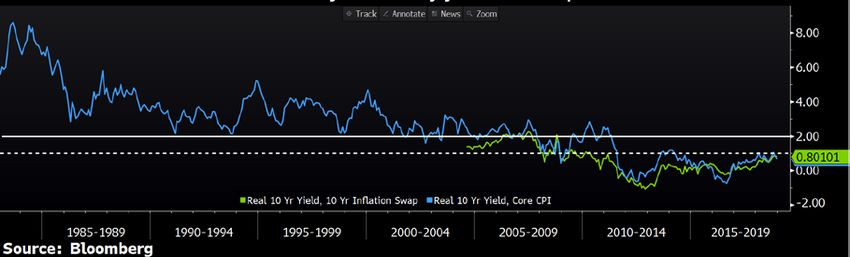
weaponizing the world’s 5G networks it would probably do more than just hurt sales, it would likely put Apple out of
business and quickly.

People, companies and countries do not knowingly do business with entities that cheat, steal and turn their technologies
against them. There is widespread consensus that China’s persistent and covert misappropriation of technology is
unacceptable and must be confronted. Businesses are leaving China and governments are beginning to bar Chinese
                                                                              12,13,14
companies viewed as state actors from doing business in their countries                  . When combined with China’s poor
economic fundamentals this puts China in a tough spot. There are 2 basic inputs to growth. One is human capital and the
other is physical capital. The more capital you have the more growth you get. The productivity of this capital also matters
                                                                                                                       15
greatly. China’s one child policy means that China will start to have a human capital shortage within a decade . China’s
                                                                                                 16
investment in physical capital, for example steel plants, has been epically unproductive . The investment that has been
productive is direct investment by foreign companies, which have been forced to transfer technology to Chinese partners
in exchange for having access to Chinese markets. Going forward, there is likely to be significantly less direct foreign
investment in China, unless China’s predatory practices toward technology transfer are reformed. Not surprisingly the
Chinese stock market, as measured by the CSI 300 (Shenzhen/Shanghai), is reflecting the negative outlook and is down
                                              17
more than 31% in dollar terms year to date . Holders of wealth in China understand what is happening and they are
justifiably concerned. If the outlook continues to deteriorate in China, accelerated capital flight is a real possibility and
much of that fleeing capital will find its way to the United States.

Interest Rates: In spite of global tensions and the expectation for moderating economic growth, in 2019 interest
rates are likely to rise modestly from present levels. The reason for this is that as the Federal Reserve has moved away
from exceptional accommodation and as other central banks follow, money will begin to have a cost assigned to it in the
form of positive real interest rates. A real yield is the yield that is left over after subtracting an estimate of inflation
expectations appropriate for the term considered. Prior to the 2008 financial crisis the real federal funds rate did not spend
time under 0% except for relatively short periods of time after recessions (Chart 5 below). After the 2008 financial crisis,
the Federal Reserve’s exceptional intervention kept the real federal funds rate negative for a period of nearly 10 years.
The natural consequence of the Federal Reserve moving away from exceptional accommodation is that the laws of
rational economics reassert themselves. One of these laws is that money should have a cost. Our view is that the real
federal funds rate will rise from its current 0.47% towards 1.00% in 2019. We believe that this will translate to 2 year
Treasury rates moving slightly above 3.0% in 2019, from about 2.75% presently.

                                                                  7
Chart 5: Real Federal Funds Rate
The Real Federal Funds Rate Should Be Positive in a Post-QE World
The real 10-year Treasury rate is also of great interest to us because when the Fed stopped buying Treasury securities as
it discontinued its program of QE, real 10-year Treasury yields became a market-made rate as opposed to a central
banker made interest rate. Today, the 10-year real Treasury yield is just 0.80%. Prior to the 2008 financial crisis, real 10-
year Treasury yields spent very little time below 2%. The real 10-year Treasury yield has begun to move upward and we
expect it to get to 1.5% to 2.0% before this cycle is over. A 1.50% real 10-year Treasury yield is not ambitious in the face
of quantitative tightening and an expected trillion dollar increase in net new Treasury debt in 2019. This means that 10-
year Treasury rates should move to 3.50% or slightly higher in 2019. Our view is that short of reversing the Federal
Reserve’s current quantitative tightening program, longer term Treasury rates do not have much capacity to fall. Consider
18
that even during the 1930’s when the economy contracted by 25%, 10-year Treasury yields were between 2.5% to 4% .
For these reasons, we are about 5% short of benchmark duration for our longer term strategies. If the U.S. economy
grows at rate close to 2% and 10-year Treasury yields do not rise as central banks stop pumping liquidity, this will be a
negative signal for markets and for credit markets in particular
Chart 6: Real 10-Year Treasury Yields
Prior to the Financial Crisis, Real U.S. 10-Year Treasury Yields Did Not Spend Much Time Below 2%
8Credit Risk Premiums: From February of 2016 through January of 2018, the European Central Bank and the
Bank of Japan used QE to pump a little over $2 trillion annually into the global financial system. For context, $2 trillion is
the amount of liquidity that the U.S. Federal Reserve pumped into the financial system at the height of the financial
19
crisis . This massive liquidity wave drove credit spreads to all-time lows (Chart 2, page 3). When the Fed started its
program of QT in the fourth quarter of 2017, it took just a few months for the cumulative Fed, BOJ and ECB balance sheet
to reach a high water mark. By February of 2018, on a consolidated basis, liquidity had essentially stopped flowing into
the global financial system and investment grade credit spreads began to widen. Year to date intermediate investment
grade spreads are out 52 basis points. We have maintained a strong quality bias within portfolios in 2018 and we
continue carry only about half the market’s exposure to BBB’s, the lowest quality rung in the investment grade space. We
continue to view to credit spreads as vulnerable in a moderate growth world where rates are rising as there is greater
competition for capital. In this type of environment intermediate U.S. investment grade credit spreads should trade in a
range of about 100 to 140 Option-Adjusted Spreads (OAS), presently 124 OAS. However, if U.S. or global growth slows
more than expected, investment grade credit spreads can go materially wider and quickly. U.S. high yield spreads would
be particularly vulnerable in this scenario. Due to the widening that has occurred, we are more constructive on credit than
we have been, but are still vigorously maintaining our quality bias.
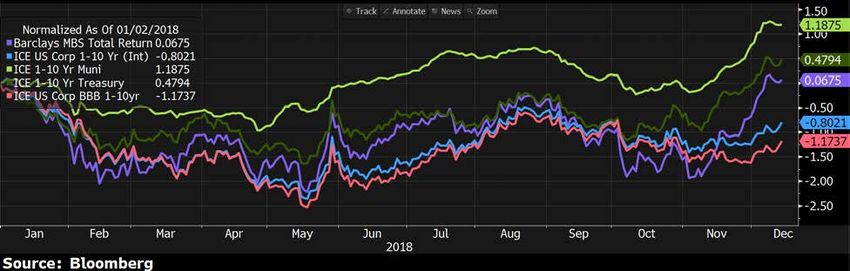
Mortgage Backed Securities: Through the month of October, federal agency sponsored mortgage-backed
securities (MBS) had been the worst performing sector of the intermediate investment grade market this year
underperforming both intermediate Treasuries and corporate credit. Since early November, MBS have done very well,
benefiting from a flight to quality (Chart 7 below). We entered 2018 about 30% underweight mortgages. We began
reducing our MBS underweight in late summer and are now about 10% underweight. We expect to move to a market
weight and possibly even an overweight at some point in 2019. The reason we have been underweight MBS is because
MBS were overvalued. The financial crisis was precipitated by problems within the mortgage market. The Federal
Reserve’s initial remedy to the financial crisis was largely the direct purchase MBS in an attempt to support that market.
As can be seen in Chart 8 below, when the Fed stepped in to buy MBS, the spreads on MBS collapsed to all-time lows.
What has recently changed is the fact that the Federal Reserve is no longer buying MBS and is now allowing MBS to roll
off its balance sheet through prepayments and maturities, a cornerstone of the QT agenda. The market is now re-pricing
MBS in order to find new buyers. Agency mortgages are the type of high quality, liquid asset that we find attractive. At the
right price MBS are not just a good substitute for corporate credit, but also tend to do very well relative to Treasuries in
stable to modestly rising interest rate environments, so expect to see more MBS in portfolios in 2019.
9Chart 7: YTD 2018 1-10 Year Total Returns (as of 12/17/2018)
Chart 8: FNMA Spread Over Treasuries Collapsed as the Fed Purchased MBS
FNMA Spreads Will Continue to Widen as the Fed Exits
Municipals: Municipal bonds were by far the best performing part of the investment grade fixed income market in
2018 (Chart 9). The primary reasons for the municipal market’s strong performance in 2018 were constrained supply and
strong investor demand. While final numbers are not yet in, we estimate that municipal supply contracted by 15 to 20%
relative to 2017’s supply of municipals. The circumstance in which demand outstrips supply is likely to continue to be
supportive of the municipal market until the imbalance changes. Heading into 2019, municipal credit is expensive and
municipal investors are not being adequately compensated for taking credit risk. Historically, municipal credit cycles tend
to lag corporate credit cycles by about 1 year. If the municipal market follows this pattern, then municipal credit may come
under stress in 2019. A potential municipal market specific risk is that if a slowing economy coincides with poor equity
market returns, then the problem of underfunded municipal pensions will likely be felt far and wide within the municipal
market. Municipalities would be forced to commit larger portions of their budgets to funding pensions at a time when tax
receipts are stagnant or shrinking. Basic municipal services would be crowded out and many municipalities would struggle
to pay their debts. As we head into 2019, we continue to maintain exceptionally high levels of credit quality within
10municipal portfolios. We have gone to great lengths to mitigate unfunded pension risk and have still been able to produce
market like returns. If conditions were to deteriorate in the municipal space we expect our municipal portfolios to do well.
Chart 9: Municipals Have Done the Best in 2018!
Conclusion: Thank you for taking the time to read our thoughts about the world in which we invest. Our hope is that
you have gained more than simply a better understanding of central bank policy, economic forecasts and the latest events
affecting markets. We hope that you have gained insight into our world view, insight into how our view informs our
investment decisions and how these decisions are benefiting you as an investor. Finally we wish to share our belief that
investment grade fixed income is the truest offset to the volatility of equity and other risk assets. Thank you for trusting us
with your investments.
On behalf of my colleagues at Hancock Whitney Asset Management, happy holidays and best wishes for a healthy and
prosperous new year!
Eric C. Reynolds is an Investment Director and senior portfolio manager at Hancock Whitney Bank, where he is co-director of fixed
income and serves institutional, family and individual investors. He is also a member of the bank’s Asset Allocation Committee. Mr.
Reynolds has over 30 years of investment management experience, joining Hancock Whitney with the acquisition of the Capital One
Wealth and Asset Management group. Previously, he has served as the head of fixed income for both Fiduciary Trust International of
California (a Franklin Templeton Company) and Kayne Anderson Rudnick. Mr. Reynolds earned a BA from the University of
California, San Diego and an MBA from the University of California, Los Angeles.
The information, views, opinions, and positions expressed by the author(s), presenter(s) and/or presented in the article are those of the author or individual who made the
statement and do not necessarily reflect the policies, views, opinions, and positions of Hancock Whitney Bank. Hancock Whitney Bank makes no representations as to the
accuracy, completeness, timeliness, suitability, or validity of any information presented. This information is general in nature and is provided for educational purposes only.
Information provided and statements made should not be relied on or interpreted as accounting, financial planning, investment, legal, or tax ad-vice. Hancock Whitney Bank
encourages you to consult a professional for advice applicable to your specific situation.
11Footnotes:
1. Bloomberg, Bureau of Labor Statistics, from December 2010 to November 2018 the U.S. employees nonfarm payrolls total
month over month net change averaged 199 thousand jobs.
2. Bloomberg, Bureau of Labor Statistics from Februrary 2008 through December 2009 the U.S. lost an averagere of 376 jobs
per month for a total of 8.648 million jobs. When this is combined with our estimate of the monthly number of jobs needed to
stay up with population growth over this time perid (23 months X 120,000 =2.76 million ), this provides an 11.4 milion jobs
deficit.
3. Bloomberg, Ministry of Internal Affairs and Communications, Japan Nationwide CPI ex Fresh Food and Energy YoY% and
Bloomberg, Eurostat Eurozone Core MUICP YoY NSA.
4. Bloomberg, the STOXX 600 Index represents large, mid and small capitalization companies across 17 countries of the
European region. Return is from 12/31/07 through 12/17/18, usd.
5. Bloomberg, the Nikkei-225 is a price-weighted average of 225 top-rated Japanese companies listed in the first section of the
Tokyo Stock Exchange. Return is from 12/28/90 through 12/17/18, usd.
6. Bloomberg, Eurostat, Euro Area GDP Chained 2010 Prices YoY, 12/31/09 to 9/30/18
7. Bloomberg, Bureau of Labor Statistics, GDP US Chained 2012 Dollars YoY, 12/31/09 to 9/30/18
8. Pbs, Dinner Table Bargain, June 1790, https://www.pbs.org/wgbh/americanexperience/features/hamilton-dinner-table-
bargain-june-1790/
9. Hamilton, Ron Chernow
10. Chinese military secretely placing scientists in U.S. universities, Guy Taylor, Washington Times, October 30,2018
11. Bloomberg Businessweek, The Big Hack: How China Used a Tiny Chip to Infiltrate U.S. Companies, October 4, 2018.
12. UK’s BT Group cuts Huawei out of wireless networks, Decision ahead of 5G upgrade follows moves by US, Australia and New
Zealand, ASIA TIMES STAFF DECEMBER 6, 2018
13. Australian Financial Review, Secrete meeting led to the international effort to stop China’s cyber espionage, December 13,
2018
14. Observer, Trump Tarriffs Impact: Most US Companies Plan to Leave China But Won’t Return to America, Sissi Cao 10/29/18
15. Bloomberg, View China Has World's Biggest Productivity Problem And solving it will require opening up, Michael Schuman,
May 11, 2017
16. BCA, China's Manufacturing Sector: Don't Bet On A Productivity Boom, 2 August 2018
17. Bloomberg, Shanghai Shenzhen CSI 300 Index consists of 300 A-share stocks listed on the Shanghai or Shenzhen Stock
Exchanges, return is for 1/31/18 to 12/17/18
18. The Big Picture, History of US Interest Rates: 1790 – Present, Barry Ritholtz
19. Bloomberg, Federal Reserve (FARBAST), European Central Bank (EBBSTOTA) Bank of Japan (BJACTOTL) and Hancock
Whitney Asset Management proprietary research
12You can also read