State of the Nanaimo Economy 2021 - The City of Nanaimo

Page created by Enrique Bowers
 
CONTINUE READING
State of the Nanaimo Economy 2021 - The City of Nanaimo
2021
      State of the
Nanaimo Economy
State of the Nanaimo Economy 2021 - The City of Nanaimo
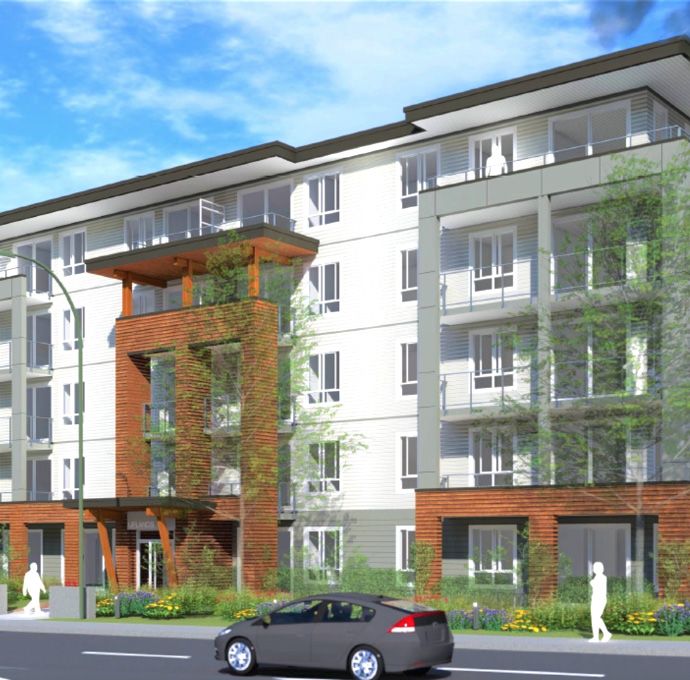
Table of Contents                                                                     Executive Summary
Executive Summary                    1   Rental Market                           30
                                                                                      The 2021 State of the Nanaimo Economy (SOE) Report provides               Jobs Database). The downturn was sharper in Nanaimo at
Demographics                             Senior's Housing                        32   members of the public and investors with relevant data on the             the start of the pandemic compared with BC. However, the
                                                                                      local economy. The report is produced annually by the City’s              recovery in Nanaimo was faster than BC leading to overall
Gross Domestic Product               4   Labour Force                                 internal economic development section. The first edition of the           near similar results.
                                                                                      State of the Economy report reviewed 24 indicators pertaining to
Population                           6   Labour Force                            34   demographic, business, development activity, housing, real estate,    •   In 2020, the labour force growth rate shrunk by 4.3% year-
                                                                                      labour market, income, and tourism. The 2021 annual State of              over-year in Nanaimo, 1.9% in BC, and increased 0.7% on
Migration                            8   Labour Force Participation Rate         36   the Nanaimo Economy report has been expanded to include gross             Vancouver Island. Labour force participation rates dipped in
                                                                                      domestic product, business incorporations, business and consumer          2020 for all three geographies, likely due to discouraged
Age Breakdown                       10   Unemployment Rate                       38   bankruptcies, job postings, housing stock, and household spending.        workers. Nanaimo’s labour force participation rate tends to be
                                                                                      The preliminary economic impacts of the COVID-19 pandemic are             lower than BC and Canada but higher than the Vancouver
Diversity                           12   Employment by Industry Sector           40   also highlighted.                                                         Island Coast Region. This is a reflection of the older age
                                                                                                                                                                structure of Nanaimo and the Island’s population in relation to
Business                                 Job Postings                            42
                                                                                      2020 Data Highlights                                                      BC and Canada.
Business Licenses                   14   Labour Force by Occupation              44   •   Nanaimo reached the 100,000-population milestone. There
                                                                                                                                                            •   Nanaimo’s unemployment rate was 9.1%, slightly higher than
                                                                                          are indications from the real estate market that migration in
Business Incorporations             16   Labour Force by Education               46                                                                             Vancouver Island (8.6%), and BC (8.8%) but lower than Canada
                                                                                          Nanaimo has continued due to its relative affordability as well
                                                                                                                                                                (9.5%).
                                                                                          as the trend of remote working increasing the attractiveness
Size of Business                    18   VIU Enrollment                          48
                                                                                          of communities outside major population centres. International
                                                                                                                                                            •   Nanaimo’s annual rate of growth in median, average, and per
The BC Provincial Nominee Program   20   Income                                           migrants make up a majority of the population growth in BC;
                                                                                                                                                                capita income is slightly higher than BC; however, Nanaimo is
                                                                                          this is expected to be somewhat sluggish over the next few
                                                                                                                                                                still below BC’s average in all three categories of income. Retail
Development                              Median, Average and Per Capita Income   50       years due to pandemic travel restrictions.
                                                                                                                                                                expenditures in the City of Nanaimo for 2020 are estimated at
                                                                                                                                                                $3.8 billion.
Building Permits                    22   Income Distribution                     52   •   The City of Nanaimo had 6,281 businesses representing
                                                                                          7% growth in the last decade. Consumer and business
                                                                                                                                                            •   Despite a downward trend in housing starts in 2020, building
Major Projects                      24   Household Spending                      54       bankruptcies were down, likely due to government financial
                                                                                                                                                                permits were strong. At $243.1 million, 2020 is the second
                                                                                          support programs.
Housing and Real Estate                  Tourism                                                                                                                largest year for building permit values in Nanaimo history.
                                                                                                                                                                Within the last five years commercial building permit values
                                                                                      •   Overall in 2020, new job postings in Nanaimo were 32.6%
New Housing and Housing Stock       26   Tourism                                 56       below 2019; comparatively BC was down 31.3% (Vicinity
                                                                                                                                                                were lowest in 2020.

Housing Prices                      28   COVID-19                                58
                                                                                                                                                                                                                                     1
State of the Nanaimo Economy 2021 - The City of Nanaimo
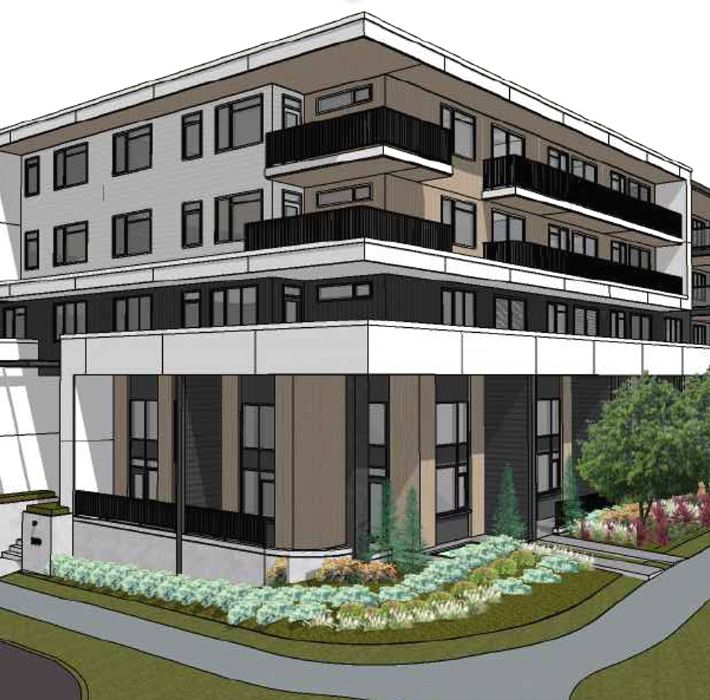
•   New housing starts dropped to 690 compared with 1,259 starts           housing in BC is on Vancouver Island and the Coast region.                  C hydroelectric dam continued with minimal disruption. In
    in 2019 (CMHC), which is a 45% decrease. This is due largely                                                                                       addition, the adverse economic impacts of the second wave of
    to two factors; 2019 was an all-time record-breaking year for      •   The impact of the pandemic has been uneven across different                 infections have so far been less pronounced in BC compared to
    building activity, secondly due to the COVID pandemic some             sectors of the economy. Tourism, hospitality, and entertainment             other provinces. Retail stores, restaurants, and most personal
    consumers may have postponed building decisions in light of            continued to struggle in 2020. In Nanaimo, average occupancy                service businesses were permitted to remain open while the
    financially uncertain times.                                           was down 40% year-over-year leading to 46% decline in revenue               government took steps to impose capacity limits and prohibit
                                                                           per available room. Similarly, BC Ferries passenger and vehicle             social gatherings.
•   The average price of a new single-family detached home                 volumes were down 42% and 30% respectively on lower
    increased by 11.6% in Nanaimo, 4.2% in Greater Victoria and            mainland routes. Airport passenger volumes were down 65%                •   The struggling forestry sector turned the corner in 2020 with
    declined by 9.1% in Greater Vancouver and 5.9% in BC.                  and Vancouver Island Conference Centre delegate days were                   wood product sales posting double-digit gains during the
                                                                           down 81%. This sector will likely be the last to recover, and not           summer months and lumber prices rising 66% year-to-date. A
•   The price of an average single-family home in Nanaimo                  until global travel restrictions are lifted and majority of the             recent decision by the U.S. to reduce softwood lumber duties for
    increased by 9.7% to $616,588 in 2020. Sales volumes were              population is vaccinated.                                                   most companies from 20.23% to 8.9% has also helped exports.
    up in every category of housing; single-family, condominiums,
    row housing and lots. At the time of publication, data for other   •   In 2020, the City of Nanaimo issued four filming permits. All           •   Growth in existing home sales was strong but housing starts
    geographies was not available for all of 2020.                         were small, one-day productions.                                            were down in comparison to 2019. Flattening in resale activity
                                                                                                                                                       and price gains are expected in 2021 due to COVID related
•   Overall average rent in Nanaimo increased by 7% and vacancy                                                                                        population decline. The largest component of BC’s population
    dropped from 2% to 1%. The number of units in supply increased     Economic Outlook                                                                growth is international immigration.
    by 4% year-over-year. Vacancy rate in Victoria increased from 1%
                                                                       •   BC’s economy contracted by -5.3% in real Gross Domestic
    to 2.2% and in Vancouver from 1.1% to 2.6%. The supply of units                                                                                •   BC’s tourism sector is expected to start recovering in 2021
                                                                           Product (GDP) in 2020, still lower than the nation at -5.7% and
    in Victoria increased by 5.3% and in Vancouver by 2.2%.                                                                                            once traveling restrictions are eased and immunization reaches
                                                                           in the middle-of-the-pack in comparison to other provinces. The
                                                                                                                                                       critical mass.
                                                                           outlook for 2021 is much more encouraging barring unexpected
•   Overall average rent for a two-bedroom apartment in Nanaimo
                                                                           turns in the pandemic situation. Strong capital investments and
    increased by 8.6%, in Greater Victoria by 4.1% and Greater                                                                                     •   The Province has plans to increase infrastructure and
                                                                           a rebound in major industrial sectors are expected to lead to
    Vancouver by 2.5%.                                                                                                                                 operational spending over the next few years. Provincial capital
                                                                           real GDP growth of 5.1% in 2021 and 4% in 2022.
                                                                                                                                                       investment is up 8.8% from 2019/20 and further increase is
•   Vacancy rate for senior independent living spaces increased                                                                                        planned for 2021/22. A record budget deficit of $12.8 billion
                                                                       •   This positive outlook is supported by the fact that even in
    by 1.1% in 2020, leading to some relief in rental rates. There                                                                                     is projected for 2020/21. Still, the BC government carries one
                                                                           the middle of the pandemic, work on major capital projects
    is a huge demand for affordable independent living spaces on                                                                                       of the lowest debt burdens in the country allowing for more
                                                                           such as the Coastal GasLink pipeline, LNG Kitimat, and Site
    Vancouver Island and in BC. The highest demand for senior                                                                                          flexibility in economic recovery.

                                                                                                                                               2                                                                          3
State of the Nanaimo Economy 2021 - The City of Nanaimo
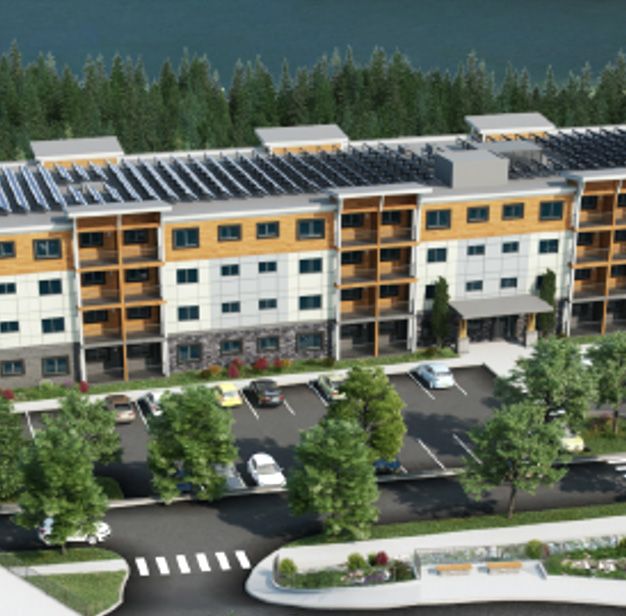
GDP Growth Rates Index of GDP Growth (2016=100) Year-over-Year
Demographics

                                                                                                   Nanaimo
                                                                                                   BC
                                                                                                             Gross Domestic Product

                                                                                                             The Gross Domestic Product (GDP)¹ measures the value of final
                                                                                                             goods and services produced in the economy. Changes in GDP are
                                                                                                                                                                                                                    The City of Nanaimo accounts for
                                                                                                             the standard measure of economic growth. Nanaimo’s estimates                                            approximately 1.6% of BC’s GDP.
                                                                                                             are derived from provincial measures of GDP using the share of
                                                                                                             employment by industry. GDP is useful in providing overall economic
                                                                                                             trends in conjunction with other indicators.

                                                                                                             Since 2010, Nanaimo’s GDP has grown by 10% to $4.1 billion. The
                                                                                                             City of Nanaimo accounts for approximately 1.6% of BC’s GDP. Growth
                                                                                                             in the GDP was primarily driven by the service producing sectors
                                                                                                             including health care, real estate rental and leasing, transportation
                                                                                                             and warehousing, and education services. In the goods producing
                                                                                                             sector, construction, manufacturing and activities related to oil and
                                                                                                             gas extraction have been the primary contributors to GDP growth.
                                                                                                             In recent years, relative to BC, Nanaimo’s GDP tended to grow at a
                                                                                                             similar rate.

                                                       2016          2017       2018     2019     Average

                           Growth Rate - BC GDP         2.9%         3.9%      2.7%    2.7%    3.1%

                    Growth Rate - Nanaimo GDP           3.0%         4.0%      2.7%    2.9%    3.2%     ¹GDP is a measure of the value-added associated with market-based production. It does not capture
                                                                                                             non-market production or any activity that takes place in the underground economy. GDP estimates
                                                                                                             have a number of weaknesses as a measure of economic welfare and are best used in conjunction with
                                                                                                             other indicators such as income and employment. Chained dollars is a method of adjusting real dollar
               Nanaimo GDP (millions chained 2012$)    $3,769        $3,919     $4,025   $4,142   $3,964     amounts for inflation over time, to allow the comparison of figures from different years.

                                                                                                             source : bc stats , nanaimo economic development calculations
                    Nanaimo GDP as Share of BC         1.6%          1.6%       1.6%     1.6%     1.6%

  4                                                                                                                                                                                                                                                    5
Demographics

               City of Nanaimo Population

                                            Population

                                            The City of Nanaimo’s population for 2020 is estimated at 102,702.          The City of Nanaimo's population for
                                            In the past five years, the average annual population growth rate was
                                            above 2%. Moving forward, the average annual growth rate will drop to           2020 is estimated at 102,702.
                                            1.4% over the next five years. By 2025 the City’s population is expected
                                            to increase by 7,415 persons.

                                            The Regional District of Nanaimo’s (RDN) population for 2020 is
                                            estimated at 175,071. The RDN’s population is expected to increase by
                                            9,728 persons by 2025, equating to an annual average growth rate of
                                            1.1%. The Vancouver Island Coast region (VIC) is projected to grow at 1%
                                            annually and BC at 1.3% annually over the next five years. Population
                                            growth will be slower over the next five years compared to the past five                    Population Growth
                                            years. However, the City of Nanaimo is expected to outpace growth rate                  Regional District of Nanaimo
                                            for Vancouver Island Coast (VIC) and the Province of BC.
                                                                                                                                                                          212,844

                                            Even during the pandemic, there are indications from the real estate
                                                                                                                                                         175,071
                                            market that migration in Nanaimo has continued due to its relative
                                            affordability as well as the trend of remote working increasing the                         155,700
                                                                                                                       146,574
                                            attractiveness of communities outside the major population centres.

                                            source : bc stats ( people model 2020) , census canada                               2011             2016             2020             2041

  6                                                                                                                                                                                        7
Origin of New Residents (RDN)
                                                       3,707
Demographics

                   International                                3,503
                                                                         3,385
                   Other Provinces             3,251
                   Within BC
                                                                                    Migration
                          2,688

                                                                                    Population growth rate is driven by two factors: natural increase
                                                                                    and migration. Nanaimo’s population growth has resulted from
                                                                                    migration. People move to new areas for a variety of reasons, including
                                                                                    employment opportunities and quality of life factors. There are three
                                                                                    types of migrants: intra-provincial (within BC), inter-provincial (other
                                                                                    provinces) and international immigrants (outside of Canada).

                                                                                    In the past five years on average over 3,300 net new residents have
                                                                                    relocated to the RDN. Net migration to the Nanaimo region has been
                                                                                    trending downwards after peaking in 2017 which is consistent with
                                                                                    slower projected population growth over the next five years.

                                                                                    Migration from within BC to the RDN has been on the rise since 2015,
                                                                                    with a slight dip in 2019. Migration from other provinces was highest
                                                                70,692
               BC Migration                                                         in 2016 but has since been declining. International migration has been
                                                                           65,104   increasing in recent years, averaging over 700 new migrants in the past
                    Net International                  58,323                       three years. The decline in net migrants to the Nanaimo region has
                                           56,492
                    Net Inter-Provincial                                            mainly resulted from fewer people moving here from other provinces.

                                                                                    Net migration to BC had been on a steady increase with a slight dip in
                       39,585                                                       2019. The majority of the growth in BC has occurred due to international
                                                                                    migration while inter-provincial migration has been on a steady decline
                                                                                    since 2016. Nanaimo captured 5.2% of total migrants to BC in 2019, and
                                                                                    the five-year average is 5.8%.

                                                                                    source : bc stats

  8                                                                                                                                                            9
Demographics

               Population by Age Breakdown (City of Nanaimo)

                     2020
                     2030
                                                                                   Age Breakdown

                                                                                   Children (0-14) represent 14% of Nanaimo’s total population in 2020.
                                                                                   This segment of population will increase by 491 children by 2030, but
                                                                                   decline by 2% as a proportion of total population.

                                                                                   In 2020, 63% (64,240) of Nanaimo’s population was working age (15-
                                                                                   64). Working age population is expected to increase by 7,947 persons
                                                                                   by 2030 to represent 61% of total population.

                                                                                   The 65+ category represented 24% of total population in 2020 and
                                                                                   is expected to grow by another 6,755 persons and represent 26% of
                                                                                   total population by 2030.

                                                                                   The largest growth over the next decade will occur in the 65+ age
                                                                                   category at 27.7%, but a close second is the 25-44 (early working
               Age Breakdown by Percentage of Total Population (City of Nanaimo)   years) age category projected to grow by 25.1%. This trend is an
                                                                                   indication of younger families moving to the Nanaimo region.
                     2020
                     2030

                                                                                   source : bc stats

 10                                                                                                                                                        11
City of Nanaimo Ethnic Origins                      City of Nanaimo Visible Minorities
Demographics

                             (2016)
                                                                                      2020       2025        % Change
                                                                                                                        Diversity
                                                                      Chinese         2,938     3,362           14%

                                                              Latin American           586         653          11%    The largest segment of resident in Nanaimo are of European origins,
                                                                                                                        representing 79% of the total population. At 27%, the second highest
                                    Other North American                                                                group is Other North American Origins (excluding Aboriginal), and the
                                           Origins                     Filipino        982      1,063            8%    third largest is Asian origins at 10%. Aboriginal origins represent 8.4%
               European Origins
                                                                                                                        of the population. The largest population gains in the 2016 census
                                                                          Black        805         847           5%    were in the Asian (2,790) and European origins (2,670).

                                                                                                                        Visible Minorities represent 10% of Nanaimo’s total population. As
                                                                     Japanese          489         512           5%    the overall population grows, Nanaimo is seeing greater diversity
                                                                                                                        in its population. In 2020, Nanaimo’s visible minority population is
                                                             Southeast Asian           866         892           3%    estimated at 10,215. The three largest minorities in Nanaimo are
                Asian Origins         Aboriginal Origins                                                                Chinese, South Asian, and Filipino representing 2.9%, 2.3% and 1.0% of
                                                                                                                        total population respectively. The total visible minority population is
                                                                  West Asian           201         202             0%
                                                                                                                        expected to increase by 7% by 2025. The largest growth is expected to
                                                                                                                        come from Chinese migrants (424), followed by Filipino (81) and Latin
                                                                           Arab        293         302           3%    American (67).

                                                                                                                 2%    BC’s visible minority population is at 31.1%. The three largest
                                                                 South Asian          2,310     2,355
                                                                                                                        minorities in BC are Chinese (11.7%), South Asian (7.8%), and Filipino
                                                                                                                        (3.6%). Vancouver has the most diverse population in BC with visible
                African Origins     Latin, Central & South                                                      -1%
                                                                        Korean         408         404                  minorities representing 48.9% of the total population - with Chinese at
                                      American Origins
                                                                                                                        19.6%, South Asian 12% and Filipino at 5.1%.
                                                             Visible Minority                                   -9%
                                                              (not inc. elsewhere)
                                                                                        81          74

                                                                      Multiple         256         237          -7%

                                                                                                                        source : 2016 census , esri
                                                                          Total      10,215    10,903            7%
               Oceania Origins
                                                                                              P ROJEC TE D

 12                                                                                                                                                                                                13
Business

                                    Business Licenses by Industry Sector (City of Nanaimo 2020)

                                                                                                                                 Business Licenses
           Professional, Scientific, Technical            807               Finance and Insurance                         124

           Retail Trade                                   749               Wholesale Trade                               124    In 2020, the City of Nanaimo had 6,281 licensed businesses. The
                                                                                                                                 largest number of business license were issued to the Construction
                                                                                                                                 sector, followed by the Professional, Scientific and Technical Services
           Other Services (except Public Admin.)          657               Education and Training                         85    and Retail Sectors. The number of total businesses licenses increased
                                                                                                                                 by 7% over the last decade.

           Health Care and Social Assistance              639               Information and Cultural                       40    Business licenses increased by 48, representing 0.8% growth over
                                                                                                                                 2019. In 2020, the largest growth was in the Professional, Scientific
                                                                                                                                 and Technical Services sector (+27) and the largest decline was in
           Admin. + Support, Waste Mgmt. + Remed.         515               Mgmt. of Companies/Enterprises                  3    the Accommodation and Food Services businesses (-32), followed by
                                                                                                                                 Retail businesses (-11) . The declines likely reflect the beginning of the
                                                                                                                                 COVID-19 pandemic impacts on local businesses.
           Real Estate, Rental and Leasing                445              Construction                                  1,232
                                                                                                                                 Home based businesses account for 37% of total business licenses
                                                                                                                                 issued in the City of Nanaimo. 67% of Nanaimo’s businesses are
           Accommodation and Food Services                314               Manufacturing                                 157    locally owned and operated. 3% of Nanaimo businesses are franchise
                                                                                                                                 operations and 9.49% are branch offices of larger companies
                                                                                                                                 headquartered elsewhere.
           Arts, Entertainment and Recreation             207               Agriculture, Forestry, Fishing and Hunting     12
                                                                                                                                 Note: business licenses represent all types of private businesses, sole
                                                                                                                                 proprietorships, partnerships and incorporated businesses.
           Transportation and Warehousing                 169               Utilities                                       2

                                             Goods Producing Sector          Service Producing Sector
                                                                                                                                 source : city of nanaimo

14                                                                                                                                                                                                            15
Business Incorporations
Business

                                                                                                                 Average
                                                       2015    2016    2017              2018          2019
                                                                                                                           Business Incorporations
                                                                                                               2017-2019

                                     City of Nanaimo    528     567     576                566          606         583

               Reg. District of Nanaimo (RDN)           747     788     800                785          817         801    Incorporations are the number of new limited companies registered
                                                                                                                           under the Business Corporations Act. Sole proprietorships or
                                                                                                                           partnerships are not included.
                  Vancouver Island Coast (VIC)         3,526   4,210   4,410             4,313         4,330      4,351
                                                                                                                           In 2019, the City of Nanaimo had 606 new business incorporations, an
                                                                                                                           increase of 7.1% from 2018. During the same time period Vancouver
                        Nanaimo as Share of VIC         15%     13%     13%                13%          14%         13%    Island growth was 0.4%. Nanaimo accounted for 74% of new
                                                                                                                           incorporations in the RDN, and 13% of Vancouver Island Coast region.
                                                                                                                           The City of Nanaimo and the Regional District incorporations in 2019
                      Nanaimo as Share of RDN           71%     72%     72%                72%          74%         73%
                                                                                                                           were above the three-year average, while the Vancouver Island Coast
                                                                                                                           region was below its three-year average.

                                                                                                                           In 2019, consumer bankruptcies remained below their three-year
                                                                                                                           average. In the first three quarters of 2020, consumer and business
           Consumer Bankruptcies                                       Business Bankruptcies                               bankruptcies declined year-over-year on Vancouver Island by 35%
                                                                                                                           and 46% respectively. This is consistent with trends observed across
                                                                                                                           Canada and is likely due in part to government support measures like
                                                                                                                           the Canadian Emergency Response Benefit (CERB) and the Canadian
                                                                                                                           Emergency Wage Subsidy (CEWS), as well as mortgage deferral
                                                                                                                           options. Not all the business closures are reflected in the business
             British Columbia (BC)                                                                                         bankruptcy numbers as many businesses may close, but not declare
                                                                        British Columbia (BC)
                                                                                                                           bankruptcy. At the time of this publication the 2020 Q4 statistics were
             Vancouver Island Coast (VIC)                                                                                  not yet available.
                                                                        Vancouver Island Coast (VIC)

                                                                                                                           source : bc stats , city of nanaimo , office of the superintendent of bankruptcy of canada

16                                                                                                                                                                                                                      17
Business

                        Businesses by Employee Size (City of Nanaimo)
                                                                                                  Size of Business
                      2009        2014        2019                10 Year Growth Rate (2009-19)

                                                                                                  In 2019, the City of Nanaimo had 3,449 businesses with one or more
               1-4    1,557       1,683       1,777                            14.1%             employees. Over the past five years (2014-2019), the number of businesses
                                                                                                  with employees grew by 5.6% compared to 11% five years prior.

               5-9     679         682         720                              6.0%             Tighter labour market conditions, and increasing real estate costs hampered
                                                                                                  businesses’ ability to expand HR capacity for five years prior to COVID-19.
                                                                                                  The number of businesses with no employees or sole proprietorship has
             10-19     375         473         500                             33.3%             increased by 10.3% over the past five years.

             20-49     235         291         300                             27.7%

             50-99      54          86          95                             75.9%

           100-199      24          34          37                             52.2%

           200-499      11          11          13                             18.2%

             500+        4           5           7                             75.0%

             Total:   2,939       3,265       3,449                Average:    17.4%

                                                                                                  source : bc stats

18                                                                                                                                                                              19
Business

           Applications to the Provincial Nominee Program (City of Nanaimo)
                                                                                                     The BC Provincial Nominee Program (BC PNP)

                                                                                                     The BC Provincial Nominee Program (PNP) facilitates the immigration
                                                                                                     of skilled foreign workers, international students, and entrepreneurs.
                                                                                                     Prospective applicants are nominated for permanent residency
                                                                                                     through either the Skills Immigration stream or the Entrepreneur
                                                                                                     Immigration stream.

                                                                                                     Applicants under the Skills Immigration stream are selected based
                                                                                                     on the skills, education and/or experience required for high-demand
                                                                                                     occupations in the province. There were 491 applicants for Nanaimo
                                                                                                     under this stream in the last eleven years, of which 80% received
                                                                                                     nominations for permanent residency.

                                                                                                     Nominees under the Entrepreneur Immigration stream are required
                                                                                                     to meet a determined financial investment amount ($200,000
                                                                                                     investment), and demonstrate the ability to create job opportunities
                                                                                                     There were 168 applicants for Nanaimo in the last eleven years of
                                                                                                     which 21% received nominations and work permits. Over the past
                                                                                                     decade, $13.6 million were invested and 55.2 new jobs were created
                                                                                                     in Nanaimo through the BC PNP Program.

                                                                                                     Due to COVID-19 related border closures, it is expected that skilled
                                                                                                     and entrepreneurial immigration will decline through 2020 and into
                                                                                                     2021. In 2020, applications for Nanaimo declined to 53 compared with
                                                                                                     65 in 2019. For the most part applications to the program have been
                                                                    Skills Immigration Application   stable through the pandemic and in-person entrepreneur interviews
                                                                                                     were transitioned to virtual meetings. Nominations for occupations in
                                                                                                     severely affected sectors have been temporally suspended and this
                                                                                                     will be reviewed in consideration of economic recovery.
                                                                      Entrepreneur Immigration
                                                                             Application             source :   bc ministry of jobs , trade and technology

20                                                                                                                                                                            21
Development

              City of Nanaimo Building Permit Value 2015-2020

                                                                Building Permits
                      Residential
                      Commercial
                                                                At $243.1 million, 2020 is the second largest year for building permit        At $243.1 million, 2020 is the
                      Industrial                                values in Nanaimo history. Residential permits accounted for 84% of
                      Public
                                                                the total value of building permits, commercial for 7.6%, and industrial      second largest year for building
                                                                and public combined for 7.9%.
                      Miscellaneous                                                                                                        permit values in Nanaimo's history.
                                                                Non-residential building permit values accounted for approximately
                                                                15.4% of the total value. In comparison to the past five years,
                                                                commercial building permit values were lowest in 2020.

                                                                source : city of nanaimo

 22                                                                                                                                                                              23
Development

                                                                                                                                        Major Projects
                                                2020 Major Projects over $2 Million

                                     Address        Description                                                           Value

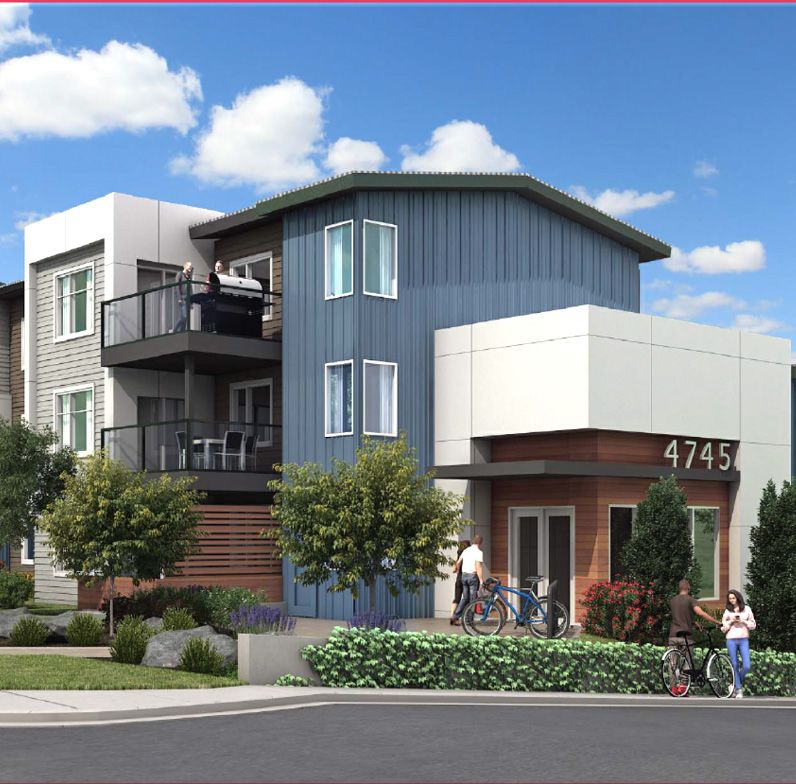
                      4735 Ledgerwood Road          Apartment Building – 120 units, 2 towers (4 & 5 storey)               $19,166,498   In 2020 and 2019, there were 31 projects with a minimum value
                                                                                                                                        of $2 million or more. In 2020, many of the larger projects were
                          6117 Uplands Drive        Apartment Building – 108 units, 5 storey                              $14,859,310   apartment buildings, some mixed-use projects, including the #1
                                                                                                                                        Fire Station. The 2019 projects included multi-family dwellings,
                                                                                                                                        medical offices, apartments, condominiums, affordable housing
                 300 Howard Avenue – Bldg B         Apartment Building – 97 units, 4 storey                               $13,475,283
                                                                                                                                        and two hotel developments.

              4800 Cedar Ridge Place – Bldg A       Apartment Building – 80 units, 4 storey                               $12,271,247   Marine Oil Spill Response Project ($10 million)                       4745 Ledgerwood Road                  6117 Uplands Drive
                                                                                                                                                                                                              2O APARTMENT BLDNGS, 4 & 5 STOREYS,   5-STOREY, 108-UNIT APARTMENT
                                                                                                                                        The Western Canada Marine Response Corporation (WCMRC)
                 300 Howard Avenue – Bldg A         Apartment Building – 84 units, 4 storey                               $12,049,220   began the construction of the Marine Oil Spill Response Centre in
                                                                                                                                                                                                              120 UNITS – $19.2 MILLION             BLDNG - $14.9 MILLION

                                                                                                                                        late September 2020 at the Nanaimo Port Authority’s Assembly
                       666 Fitzwilliam Street       No. 1 Fire Station – 1090 m², 3 storey                                $10,539,200   Wharf. This centre will eventually include 15 vessels and hire
                                                                                                                                        35 full-time staff across a head office and training centre. The
              4800 Cedar Ridge Place – Bldg B       Apartment Building – 48 units, 3 storey                                $7,866,944   $10 million project will bolster response capabilities to potential
                                                                                                                                        future west coast fuel spills.
              4800 Cedar Ridge Place – Bldg C       Apartment Building – 42 units, 3 storey                                $6,894,676

                                                    Two buildings: 1. Mixed-Use Building -14 residential + 3 commercial
                            507 Milton Street                                                                              $4,600,000
                                                    units, 3 storey; and 2. Multi-Family Building, - 4 units, 2 storey

                                                    Two buildings: 1. Mini-Storage, pre-eng. storage building; and
                         1865 Boxwood Road                                                                                 $2,600,000
                                                    2. Office and caretaker’s residence

                        1400 Wingrove Street        Mixed-Use Building- 12 residential units, 3 commercial units,
                                                                                                                           $2,500,000
                                                    3 storey
                                                                                                                                                                                                              301 Lambert Avenue                    4800 Cedar Ridge Place, Bldg A
                                                    Two buildings: 1. Townhouse - 4 units, 3 storey; and 2. Townhouse
                        1726 Kerrisdale Road                                                                               $2,300,000                                                                         4-STOREY, 97-UNIT APARTMENT BLDNG     4-STOREY, 80-UNIT APARTMENT BLDNG
                                                    - 5 units, 3 storey
                                                                                                                                                                                                              - $13.5 MILLION (BLDNG A)             (1 OF 3) - $12.2 MILLION
                                                                                                                                        source : city of nanaimo

 24                                                                                                                                                                                                                                                                                     25
Housing and Real Estate

                          City of Nanaimo Housing Starts by Type (2016-2020)

                                  Single
                                  Semi-Detached
                                                                                          New Housing and Housing Stock
                                  Row
                                  Apt. & Other                                            Housing starts, like building permits, are a leading indicator of
                                                                                                                                                                 Housing Stock 2020
                                                                                          economic activity. In 2020, new housing starts dropped by 45%, to
                                                                                          690 compared with 1,259 starts in 2019. This is due largely to the
                                                                                          COVID-19 pandemic as consumers postpone building decisions in          Houses                         25,994
                                                                                          light of financially uncertain times. The trend towards denser forms
                                                                                          of housing continues due to overall rising real estate values.           Single-Detached House        21,894

                                                                                          Single-detached homes still make up a majority of the housing,           Semi-Detached House           2,041
                                                                                          representing 62% of all built housing. As the city grows the mix of
                                                                                          housing has been changing, with apartments and low/high rise             Row House                     2,059
                                                                                          buildings making up 35% of all housing and other dwelling types
                                                                                          making up 2%.                                                          Apt. Building Low/High Rise    14,777

                                                                                                                                                                   Apt. Building, 5+ Storeys     1,326

                                                                                                                                                                   Apt. Building, < 5 Storeys    7,667

                                                                                                                                                                   Detached Duplex               5,784

                                                                                                                                                                 Other Dwelling Types             916
                                                                               48
                                                                                                                                                                   Other Single-Att, House         86
                                                                                     32
                                                                               184
                                                                                                                                                                   Moveable Dwelling              830

                                                                                                                                                                 Total Households               41,687
                                                                                          source : cmhc , city of nanaimo , esri canada

  26                                                                                                                                                                                                     27
Single Detached Home                                                     Nanaimo                      Victoria                 Vancouver
Housing and Real Estate

                                                                                                                                                                        Housing Prices
                                                                                                                                                          $1,464,200

                                       $1,017,228                $1,031,546                 $1,048,435                                            $1,014,746
                                                                                                                             $986,797
                                                                                                                                                                        The price of an average single-family home in Nanaimo increased by
                                                                                                                                                                        9.7% to $616,588 in 2020. Sales volumes were up in every category of
                                                                                        $700,630                 $688,689                                               housing; single family, condominiums, row housing and lots. At the time
                                                           $652,928
                                 $585,745                                                                  $566,023                           $581,063                  of publication, data for other geographies was not available for all of
                                                                               $556,820
                                                     $518,452                                                                                                           2020. Prices for the month of June are reflected in the chart.
                           $447,336

                                                                                                                                                                        The average annual price of a single-family new house dropped by 9.1%
                                                                                                                                                                        in Greater Vancouver and by 5.9% in BC in 2020. The price for a similar
                                                                                                                                                                        new home increased by 11.6% in Nanaimo and 4.2% in Victoria.

                                      2016                      2017                       2018                        2019                          June 2020          Despite the drop in prices in Vancouver, the same brand new single
                                                                                                                                                                        family detached home in Nanaimo costs roughly one-third the price of
                                                                                                                                                                        Vancouver and less than three-quarters the price of Victoria.
                             Single Detached Home (New                        Nanaimo                Victoria                 BC                   Greater Vancouver
                                                                                                                                                                        Note: At the time of publication, data for all geographies was not
                                                                                                                                                                        available for all of 2020. June 2020 are average prices for the month
                                                                                            $2,504,224                                                                  of June only.
                                                                                                                         $2,377,971
                                                                 $2,264,596
                                                                                                                                                          $2,161,416
                                       $1,950,911
                                                                                        $1,781,409                  $1,731,557
                                                            $1,567,215                                                                              $1,628,837
                                 $1,361,840
                                                                                 $1,126,494                     $1,116,340                     $1,163,198
                                                         $975,838
                              $774,888                                                                                                   $809,935
                                                                              $674,741                   $725,591
                          $508,824                  $577,579

                                                                                                                                                                        source : bc stats , vancouver island real estate board , real estate board of greater vancouver , cmhc

                                      2016                      2017                       2018                        2019                              2020
  28                                                                                                                                                                                                                                                                             29
Housing and Real Estate

                          Nanaimo Average Rents, Vacancy & Units (October 2020)

                                                                      Rent             Vacancy Rate      Total Units      Rental Market
                              Private Apartments                2019         2020      2019     2020    2019      2020
                                                                                                                          In 2020, 67% of Nanaimo residents lived in owned housing,
                                Bachelor/Studio                 $889         $914       0.7%     0.0%    354       345    while 33% occupied rental accommodations. Overall average
                                                                                                                          rent in Nanaimo increased by 7% and vacancy dropped from
                                                                                                                          2% to 1%. The number of units in supply increased by 154,
                                  1 Bedroom                     $946     $1,010         1.6%     1.4%   1,928     2,006   representing a 4% increase year-over-year. Vacancy rates in
                                                                                                                          Victoria increased from 1% to 2.2% and in Vancouver from 1.1%
                                                                                                                          to 2.6%. The supply of units in Victoria increased by 5.3% and in
                                  2 Bedroom                   $1,170     $1,271         2.4%     0.8%   1,569     1,651
                                                                                                                          Vancouver by 2.2%.

                                  3+ Bedroom                  $1,306     $1,361           **     0.0%    127       130    Average rent for a two-bedroom apartment in Nanaimo
                                                                                                                          increased by 8.6%, in Greater Victoria by 4.1% and Greater
                                                                                                                          Vancouver by 2.5%.
                                 Average/Total                $1,039     $1,112         2.0%     1.0%   3,978     4,132

                          Comparison of Average Monthly Rent (2 Bedroom Apartment)

                                                          Vancouver                  Victoria           Nanaimo

                                Oct. 2019                    $1,748                   $1,448             $1,170

                                Oct. 2020                    $1,792                   $1,507             $1,271

                                % Change                      2.5%                   4.1%               8.6%
                                                                                                                          source : cmhc

  30                                                                                                                                                                                          31
Seniors' Housing Average Rents & Vacancy Rates
Housing and Real Estate

                                                                             Average Rent          Vacancy Rate
                                                                                                                         Seniors Housing
                                         Type                               2019            2020   2019           2020

                                   Bachelor/Studio                         $2,502       $1,621     2.4%           0.0%
                                                                                                                         In 2020, the vacancy rate for senior living spaces increased by 1.1%               The majority of affordable
                                                                                                                         year-over-year, leading to some relief in rental rates. Average rent
                                                                                                                         decreased by 2.5% between 2019 and 2020. Due to high demand,             independent living spaces in BC were
                                      1 Bedroom                            $3,019       $3,092     2.2%           3.3%   there was zero vacancy in the lowest average rent category of
                                                                                                                         bachelor/studio type senior spaces. Vacancy rates were higher in the        added in Nanaimo and Parksville.
                                                                                                                         more expensive living spaces. In the Central Vancouver Island area,
                                      2 Bedroom                            $4,075       $4,132     2.1%           8.1%   which includes Nanaimo and Parksville, there were 2,831 units in
                                                                                                                         supply in 2020.
                                    Average/Total                          $3,038       $2,963     2.2%           3.3%
                                                                                                                         British Columbia’s vacancy rate for independent living spaces
                                                                                                                         increased by 0.9% from 4.2% to 5.1% year-over-year in 2020.
                                                                                                                         Compared to other regions reporting vacancy rates such as 7.6%
                          Vacancy Rate                                                                                   (Okanagan/Thompson/Shuswap region), Vancouver Island Coast had a
                                                                                                                         much lower vacancy rate of 3.4%. The average rent for an independent
                                                                                                                         living space in British Columbia increased by 2.7%, from $3,275 in
                                                                                                                         2019 to $3,364 in 2020. The Lower Mainland posted the highest
                                                                                                                         average rents in BC at $3,722.

                                                                                                                         Affordable independent living spaces continue to see high demand in
                                                                                                                         British Columbia. There were an additional 664 spaces added across
                                                                                                                         BC in 2020. The majority of new spaces were added in the Nanaimo
                                                                                                                         and Parksville area. The demand is also strong in this region, 379 new
                                                                                                                         residents were added to senior spaces between 2019 and 2020, the
                                                                                                                         largest increase across British Columbia.

                                                                                                                         source : cmhc

  32                                                                                                                                                                                                                                     33
Labour Force

                                                       Labour Force Growth Rate

                                                                                  Nanaimo            VIC            British Columbia
                                                                                                                                        Labour Force

                                                                                                                                        The labour force is composed of those 15 years of age and older
                                                                                                                                        who are either employed or actively seeking work. Changes in the
                                                                                                                                        labour force are the result of changes in population and economic
                                                                                                                                        opportunities. A growing economy attracts workers from other areas
                                                                                                                                        and induces people to enter the labour force. When the economy
                                                                                                                                        slows, people leave in search of opportunities elsewhere or withdraw
                                                                                                                                        from the labour force.

                                                                                                                                        On average Nanaimo’s labour force grew by 9.3% annually between
                                                                                                                                        2016 and 2020, while the province and Vancouver Island Coast region
                                                                                                                                        grew at 1.4%. Labour force growth rates in Nanaimo generally follow
                                                                                                                                        a similar pattern to that in the province as a whole, however tend
                                                                                                                                        to have greater variance. This variability likely stems in part from
                                                                                                                                        measurement error in the labour force survey due to small sample
                                                                                                                                        sizes. Generally, the five-year average growth rate is more accurate
                                                                                                                                        measure of labour force activity in Nanaimo due to the variability in
                                                                                                                                        the labour force survey.

                                               2016          2017            2018            2019           2020             Average    In 2020, 64,500 people were in the labour force. The labour force
                                                                                                                                        growth rate shrunk by 4.3% in Nanaimo, 1.9% in BC, 0.7% on Vancouver
                                                                                                                                        Island in 2020.
                                  Nanaimo      24.2%        22.3%            -0.3%            4.7%          -4.3%                9.3%

               Vancouver Island Coast (VIC)     2.0%          4.6%            2.2%           -2.6%           0.7%                1.4%

                      British Columbia (BC)     3.0%          2.7%            0.6%            2.6%          -1.9%                1.4%

                                                                                                                                        source : stats canada
                    Nanaimo Labour Force      52,800       64,600           64,400          52,800         64,500             62,740

 34                                                                                                                                                                                                             35
Labour Force

               Labour Force Participation Rate

               In 2020 labour force participation rates for all geographies dipped
               slightly compared to 2019.

               Nanaimo’s labour force participation rate tends to be lower than BC
               and Canada but higher than Vancouver Island Coast Region. This is
               a reflection of the older age structure of Nanaimo and the Island’s
               population in relation to BC and Canada.

               The labour force participation rate measures the labour force
               (employed & unemployed) relative to the size of the working
               age population. In other words, it is the share of the working age
               population that is working or looking for work. Regions with younger
               populations tend to have higher labour force participation rates, while
               those with older population have lower rates. Participation rates also
               tend to fall during recessions due to discouraged workers, and rise
               during expansions. The greater variability in Nanaimo’s participation
               rate is likely due to the smaller sample size of the labour force survey.

               source : stats canada

 36                                                                                        37
Labour Force

                                                                 Unemployment Rate
               Unemployment Rate Comparisons (Annual Averages)

                                                                 Due to COVID-19, unemployment rates were significantly higher in
                                                                 2020. Nanaimo’s unemployment rate was 9.1%, slightly higher than
                                                                 the Vancouver Island Coast region and BC, but lower than Canada.

                                                                 Over the last five years, Nanaimo’s unemployment rate has been
                                                                 trending higher than VIC and BC although historically it has always
                                                                 been lower. An ideal unemployment rate for a healthy economy is
                                                                 between 4.5% to 5%.

                                                                 source : stats canada

 38                                                                                                                                    39
Labour Force

                                  Percentage of Labour Force by Industry Sector (City of Nanaimo 2020)

               Health Care and Social Assistance         7,018 (14.8%)         Information and Cultural              1,350 (2.8%)
                                                                                                                                    Employment by Industry Sector
               Retail Trade                              7,015 (14.8%)         Wholesale Trade                       1,223 (2.6%)   The number of jobs in Nanaimo grew by 3.2% between the 2011 and
                                                                                                                                    2016 Census. During this period shifts in the economy led to the
                                                                                                                                    goods producing sector representing 17% (10% previously) and the
               Accommodation and Food Services            4,105 (8.7%)         Arts, Entertainment and Recreation     892 (1.9%)    service sector representing 83% (90% previously) of total jobs.

                                                                                                                                    All industries in the goods producing sector represented positive
               Educational Services                       3,726 (6.9%)         Real Estate, Rental and Leasing        817 (1.7%)    growth with Manufacturing leading the charge at 45%, followed by
                                                                                                                                    Agriculture/Forestry/Fishing/Hunting at 14%, and Mining/Oil/Gas
                                                                                                                                    representing 8% growth. Growth in the service sector was driven
               Professional, Scientific, Technical        3,032 (6.4%)         Mgmt. of Companies/Enterprises           18 (0.0%)   by growth in Healthcare, Professional/Scientific/Technical, and the
                                                                                                                                    Administration Support/Waste Management/Remediation Sectors.
                                                                                                                                    This growth was offset by significant losses in Wholesale Trade, Real
               Admin. + Support, Waste Mgmt. + Remed. 2,450 (5.2%)           Construction                            4,106 (8.7%)   Estate/Rental/Leasing and Public Administration.

                                                                                                                                    In 2020, the greatest number of jobs are provided by Healthcare/
               Public Administration                      2,400 (5.1%)         Manufacturing                         2,060 (4.3%)
                                                                                                                                    Social Assistance and the retail sector followed by Construction,
                                                                                                                                    Accommodation and Food Services and Educational Services.

               Other Services (except Public Admin.)       2,207(4.7%)         Agr., Forestry, Fishing and Hunting    997 (2.1%)

               Transportation and Warehousing             2,206 (4.7%)         Mining, Oil, and Gas                   416 (0.9%)

               Finance and Insurance                      1,564 (3.3%)         Utilities                              232 (0.5%)

                                                 Goods Producing Sector         Service Producing Sector                            source : esri canada

 40                                                                                                                                                                                                         41
Labour Force

                                       Job Postings
               Nanaimo Job Postings

                                       New job postings in Nanaimo were 32.6% lower in 2020 compared
                                       to 2019. Comparatively, new job postings across BC decreased
                                       by 31.3% in 2020. The downturn was sharper in Nanaimo at the
                                       start of the pandemic compared with BC. In a year-over-year
                                       comparison, job postings in March were down 45.6%, in April
                                       -66.5%, and in May -57.2%.

                                       However, the recovery in Nanaimo was faster than BC starting in
                                       September leading to overall near similar results for 2020.

                2019            2020

                                       source : esri canada

 42                                                                                                      43
Labour Force

                       Workplace
                                                 Labour Force: Occupation, Workplace, Transportation
               Fixed Workplace           76.9%

                                                 Sales and service occupations made up 28% of all jobs in Nanaimo in
               No Fixed Workplace        15.2%   2020. The three broad categories of Business/ Finance/ Administration,
                                                 and Education/ Law/ Social, Community/Govevernment services and
               Work at Home              7.5%    Management Occupations make up professional services, accounting
                                                 for the largest number of occupations (34%) in Nanaimo. Labour force
                                                 breakdown by occupation is useful in looking at the skills and talent
               Work Outside of Canada    0.4%    of the labour pool and can be a beneficial indicator of employability in
                                                 other sectors of the economy.

                                                 77% of the workforce have a fixed place of work, followed by 15.2%
                                                 who travel to different worksites. Approximately 8% of the workforce
                Mode of Transportation
                                                 work at home and nearly half a percent work outside of Canada. The
                                                 vast majority (78.6%) of the workforce drive to work. Nearly 7% of the
               Drive to Work             78.6%   workforce walks to work, 4.7% use public transit and 1.7% cycle to work.

               Car Passenger             6.0%

               Public Transit            4.7%

               Walk                      6.9%

               Cycle                     1.7%

               Other Method              2.2%

                                                 source : esri canada

 44                                                                                                                         45
Labour Force

               Educational Attainment (City of Nanaimo, Ages 25-64)
                                                                                                      Labour Force by Education

                                                                                                      When considering perhaps the most productive portion of the
                                                            No Certificate, Diploma or Degree         labour force (those between the ages of 25-64) Nanaimo has a
                                                                                                      higher proportion of high school graduates (28.5%) compared to BC
                                                                                                      (26.5%), but lower proportion of population holding post-secondary
                                                                                                      credentials. Nanaimo’s portion of population with a bachelor's level of
                                                           High School Diploma or Equivalent          education or above is 23.3% compared with BC's average of 29.9%.

                                                        Apprenticeship/Trade Certificate/Diploma

                                                        College or Non-University Cert. or Diploma

                                                         University Cert./Diploma below Bachelor

                                                                    Bachelor's Degree

                                                      University Cert./Diploma above Bachelor Level

                                                                                                      source : 2016 census

 46                                                                                                                                                                             47
Labour Force

               Vancouver Island University Enrollment

               Student enrollment at Vancouver Island University (VIU) declined in 2019.
               International student enrollment dropped by 8% while overall student
               enrollment decreased by 1.5% in 2019 compared to 2018.

               Although 2020 data was unavailable at the time of this publication,
               international enrollments are expected to significantly decline in 2020
               due to COVID-19 related travel restrictions, decreased confidence in
               moving abroad to study and the move to virtual delivery of classes.
               Fewer international students will result in reduced demand for rental
               accommodation and reductions in demand for ESL tutoring services.
               International students pay considerably higher fees than domestic
               students which will lead to negative impacts on post-secondary budgets.

               The number of businesses in the Education & Training services sector
               grew by 12% between 2018 and 2019. Employment in the educational
               services sector in the City of Nanaimo is estimated at 3,276 in 2020.

               source : ministry of advanced education and training

 48                                                                                        49
Income

                     City of Nanaimo Median, Average, and Per Capita Income
                                                                                                      Median, Average and Per Capita Income
                                                                                    2025
                                     $43,584
                                                                                    2020              In 2020, the median household income in the City of Nanaimo was
               Per                                                                                    $71,711. This is a 15.7% increase in the last five years. By 2025,
            Capita             $36,761                                              2015              Nanaimo’s median household income is projected at $83,215, growth
           Income
                                                                                                      of 16%. BC’s median household income was $83,693 in 2020 and is
                         $30,990                                                                      projected to grow by 13.8% over the next five years.

                                                                                                      In 2020, the average household income in the City of Nanaimo was
                                                                                                      $88,338, an increase of 21.7% in the past five years. The average
                                                                                           $104,248   household income is projected to reach $104,248 by 2025, growth of
                                                                                                      18%. BC’s average income for 2020 was $106,682 and is projected to
           Average                                                                                    grow another 15.8% to $123,545 by 2025.
         Household                                                            $88,338
            Income                                                                                    Nanaimo’s per capita income in 2020 was $30,990, this is an increase
                                                                $72,584                               of 18.6% in the past five years. Projected per capita income for 2025 is
                                                                                                      $43,584, an increase of 18.6%. BC’s per capita income was $35,127 in
                                                                                                      2020 and will grow by another 15.1% to reach $48,293 by 2025.

                                                                                                      Nanaimo’s projected annual rate of growth in median (3.2%), average
                                                                          $83,215
                                                                                                      (3.6%) and per capita income (3.7%) is slightly higher than BC, however
           Median                                                                                     Nanaimo is still below BC’s average in all three categories.
         Household                                              $71,711
            Income
                                                      $62,006

                                                                                                      source : esri canada

50                                                                                                                                                                               51
Income

                                          City of Nanaimo Household Income Distribution (2020)
                                                                                                                                        Income Distribution
                < $19,999                             2,289 (5%)
                                                                                                                                        The largest number of households in Nanaimo (8,574 or 21%) report
                                                                                                                                        household income between $20,000 and $39,999 per annum.
           $20,000 - $39,999                                                                                              8,574 (21%)
                                                                                                                                        The second largest number of households (6,651 or 16%) report
                                                                                                                                        household income of $40,000 to $60,000 per annum.
           $40,000 - $59,999                                                                                6,651 (16%)
                                                                                                                                        14,125 households (34%) report annual income over $100,000
                                                                                              5,476 (13%)                               per annum. 2,990 households (7%) earned over $200,000 and 852
           $60,000 - $79,999
                                                                                                                                        households (2%) earned over $300,000 per annum.

           $80,000 - $99,999                                                     4,572 (11%)

          $100,000 - $129,999                                                   4,442 (11%)

          $125,000 - $149,999                                      3,344 (8%)

                                                                   3,349 (8%)
          $150,000 - $199,999

                                                    2,138 (5%)
          $200,000 - $299,999

                                       852 (2%)
               $300,000+

                                                                                                                                        source : esri canada

         note : income axis values intervals change after $100K

52                                                                                                                                                                                                          53
Income

                                                2020 Nanaimo Consumer Expenditures
                                                                                                                                          Household Spending
                                   Average                   Spending                             Average                     Spending
                                 Household           Total   Potential                          Household             Total   Potential
                                    Spend           Spend       Index                              Spend             Spend       Index
                                                                                                                                          The retail expenditures in the City of Nanaimo are estimated at $3.8
                                                                         Reading and other                                                billion in 2020. Average household and total spending by category are
         Food                    $12,907     $538,088,716        106                                $182        $7,618,244          54
                                                                         Printed Materials                                                detailed in the table opposite. The spending potential index represents
                                                                                                                                          the amount spent in the area relative to the national average of 100.
                                                                                                                                          An index of 117 means that the area spends 17% more than the
         Shelter                 $19,145     $798,118,047          97    Education                $1,545      $64,439,318         108
                                                                                                                                          national average on that good or service.

         Household Operation       $4,596    $191,613,725          96    Tobacco/Alcohol          $3,921     $163,480,155         109

         Household Furnishings     $3,828    $159,604,576        108     Games of Chance          $1,185      $49,434,759         110
         and Equipment

         Clothing                  $2,903    $121,037,624          77    Misc. Expenses           $1,179      $74,175,791           89

         Transportation          $10,673     $444,925,437          74    Personal Taxes          $11,720     $488,599,142           68

                                                                         Personal Insurance
         Healthcare                $4,904    $204,473,238        117                              $4,274     $178,187,484           84
                                                                         Payments and Pension

                                                                         Gifts of Money
         Personal Care             $1,795     $74,851,968          86    and Contributions        $2,648     $110,420,573         117

         Recreation                $4,542    $189,375,313        106     Total                   $92,557    $3,858,444,109

                                                                                                                                          source : esri canada

54                                                                                                                                                                                                                  55
Tourism

                                                                    Tourism Statistics
                                                                                                       Tourism

                                                                      2019          2020    Variance   The impact of the pandemic has been uneven across different sectors
                                                                                                       of the economy. While sectors such as manufacturing, and health
                                                                                                       began the sharp rebound after re-opening in mid-May, others like
                                         Average Occupancy           73.6%          44.2%    -40%     tourism, hospitality and entertainment continue to struggle.

                                                                                                       The Tourism data presented here reflects the severe impact of
                                  Average Daily Room Rate          $146.25        $131.17    -10%     the pandemic. This sector will likely be the last to recover, and
                                                                                                       not until global travel restrictions are lifted and majority of the
                                                                                                       population is vaccinated.
                  Revenue Per Available Room (RevPAR)              $107.70         $57.96    -46%
                                                                                                       The average hotel occupancy rate in Nanaimo was 44.2% in
                                                                                                       2020, down 40% from 2019. This was the main reason for
                      BC Ferries Passengers (Nov. YTD)*           3,855,876     2,249,422    -42%     revenue per available room dropping by 46%. Room rates
                                                                                                       remained relatively strong.

                           BC Ferries Vehicles (Nov. YTD)*        1,498,348     1,051,547    -30%     Vehicle volumes on BC Ferries’ two routes to the lower mainland
                                                                                                       (Duke Point to Tsawwassen and Departure Bay to Horseshoe Bay)
                                                                                                       dropped by 30% and passenger volumes dropped by 42%.
                              Nanaimo Airport Passengers           491,499        174,287    -65%
                                                                                                       Nanaimo Airport volumes in 2020 were down by 65% over 2019. The
                                                                                                       Vancouver Island Conference Centre (VICC) delegate days dropped by
                     Vancouver Island Conference Centre             24,364          4,729              81% in 2020 compared to 2019.
                                                                                             -81%
                                         (Delegate Days)

          * Duke Point–Tswassen and Departure Bay–Horseshoe Bay

                                                                                                       source : nanaimo airport , bc ferries , vicc , nanaimo hotel association

56                                                                                                                                                                                57
COVID-19
     •   After a very strong 2019 in Nanaimo, the outlook for 2020 was       •   Locally, programs such as the Digital Economy Restart, Recover           purpose built permanent supportive housing developments             COVID-19 Trends of Note
         slower growth compared to the previous three to four years,             and Reimagine Program (DER3) delivered by Innovation Island              with approximately 190 homes for people experiencing or who
         but of course, no one foresaw the global pandemic around the            Technology Association and the Tourism Resiliency Program                are at risk of homelessness.                                        •   Accelrated certain trends such as technology adaptation. Many
         corner. The year started strong in January and February, but            by Tourism Vancouver Island meant that businesses had                                                                                            businesses quickly adopted technology.
         the shutdown of most economic activity, due to the pandemic,            one-on-one assistance at a very critical time. Senior levels of      •   Shortly after the pandemic started, the Mayor’s Task Force          •   “Necessity is the mother of invention” – many businesses
         in March affected all sectors of the economy with significant           governments funded all these professional services programs.             on Recovery and Resiliency was formed. Work on the                      quickly pivoted their business models, even if for short term.
         immediate declines in employment until re-opening began in                                                                                       recommendations has commenced. The City’s commitment                    e.g. Distilleries making hand sanitizer, Harmac making pulp for
         mid-May leading to slow recovery.                                   •   Supporting our local economy during this difficult time was a            to the business community continued with the completion of              medical masks and gowns.
                                                                                 priority for Nanaimo City Council as well. This resulted in the          a new Economic Development Strategy to guide the future
     •   The health and economic effects of the COVID-19 pandemic                City quickly responded by sharing information on individual              resiliency of the local economy. A larger financial investment      •   We will see more near shoring of supply-chains so economies
         are being felt locally, regionally and around the world. However,       and business relief programs, transitioning City services for            into economic development is slated for 2021 to begin strategy          can be more resilient in future crisis-situations.
         from the number of COVID cases and the economy perspective,             residents and businesses to an online digital platform, providing        implementation through a hybrid model.                              •   Trend towards supporting local businesses magnified.
         Vancouver Island is fairing better than expected. Locally and           additional grace periods for payment of property taxes,
         provincially, the impact of the pandemic has been uneven                expanding the patio program for restaurants, and the one-time        •   The economic development strategy focuses on six key areas:         •   Many businesses now have a disaster recovery plan as part of
         across different sectors of the economy. Sectors such as                reduction in business license fees for liquor-primary operations         infrastructure, business development, skills development and            normal operations plan.
         manufacturing and health began the sharp rebound after re-              to name a few.                                                           talent attraction and retention, innovation and technology,         •   Greater move towards AI and automation, impacting lower
         opening in mid-May while others, like tourism, hospitality and                                                                                   social and environmental responsibility, and marketing.                 paying jobs. A component of the workforce will need to look
         entertainment continue to struggle.                                 •   The City continues to invest in infrastructure to provide a boost                                                                                at re-education to meet the changing jobs of the future. Move
                                                                                 to jobs and the local economy. Pedestrian and transportation         •   In 2020, City Council adopted the doughnut economic model               towards more digital literacy.
     •   Fiscal stimulus from the federal government to individuals and          improvements continue throughout the City to create a more               as a vision and framework for all city initiatives and planning
         businesses such as Canadian Emergency Response Benefit                  connected community. The City has nearly $72 million in water            processes. The doughnut model challenges economies to meet
         (CERB), rent relief programs for businesses, infrastructure             infrastructure projects planned for the next five years, including       and exceed “minimum global living standards” and equity, while
         grants for local and indigenous governments have provided a             a $20 million mid-town water supply upgrade scheduled to                 “avoiding pushing beyond our ecological limits.” The idea is that
         much needed boost to the economy.                                       start in 2021.                                                           the doughnut represents the sweet spot – “the safe and just
                                                                                                                                                          space for humanity” between a social foundation on the inner
     •   The BC provincial government was in a much better fiscal            •   The City has partnered with BC Housing to provide a                      edge of the doughnut and an ecological ceiling on the outer
         position heading into the pandemic compared with many other             record number of affordable and supportive housing. New                  edge. A “City portrait” will be created with measurable social
         provinces. The provincial governments large doses of fiscal             developments are proposed on six sites around the city. It               and environmental indicators and targets so the City can track
         stimulus helped combat the overall negative effects of the              includes three affordable rental buildings with approximately            its progress over time.
         pandemic at the local and provincial level.                             125 homes for families and individuals. It also includes four

58                                                                                                                                                                                                                                                                                                  59
Prepared for City of Nanaimo Economic Development
   Amrit Manhas, Economic Development Officer
    411 Dunsmuir Street, Nanaimo, BC V9R 5J6
    250-755-4465 | www.investnanaimo.com

       Design and Layout: Common Foundry
You can also read