Strategic Needs Analysis Team Briefing Paper - Understanding Gloucestershire 2013
←
→
Page content transcription
If your browser does not render page correctly, please read the page content below
Strategic Needs Analysis Team
                  Briefing Paper

Understanding Gloucestershire 2013:
A high level analysis of need in Gloucestershire

                                                   Internal document
Author: Strategic Needs Analysis Team
Date: 5th December 2013

                                  1
Contents
 Introduction ....................................................................................................................................... 4

 Executive summary .......................................................................................................................... 5

 Section 1 - Key Demographic Issues for GCC Outcomes ............................................................ 8

    1.      A Growing Population ............................................................................................................. 8
    2.      An Ageing Demographic.......................................................................................................... 9
    3.      Growth of Ethnic Population ................................................................................................ 13
 Key Points.......................................................................................................................................... 14
 Section 2 - Gloucestershire and its communities are attractive places to live, work and
 invest now and in the future .......................................................................................................... 15

    1.      Who lives in Gloucestershire?............................................................................................... 15
    2.      Working in Gloucestershire .................................................................................................. 16
    3.      Housing ................................................................................................................................. 18
    4.      Future waste issues............................................................................................................... 19
 Key Points.......................................................................................................................................... 21
 Section 3 - People and communities are active and resilient .................................................... 22

    1.      Fire and Rescue ..................................................................................................................... 22
    2.      Loneliness.............................................................................................................................. 23
    3.      Community involvement....................................................................................................... 25
 Key Points.......................................................................................................................................... 26
 Section 4 - People with a disability or long-term illness live as independently as possible .. 27

    1.      People with a disability or long term illness ......................................................................... 27
    2.      Carers .................................................................................................................................... 29
    3.      Adult social care service user and carer surveys .................................................................. 30
 Key Points.......................................................................................................................................... 31
 Section 5 - People live healthy lives as free as possible from disability or limiting long term
 illness ............................................................................................................................................... 32

    1.      Life expectancy ..................................................................................................................... 32
    2.      Healthy lifestyles ................................................................................................................... 33
 Key Points.......................................................................................................................................... 34
 Section 6 - Vulnerable children, young people and adults are safe from harm ....................... 35

                                                                           2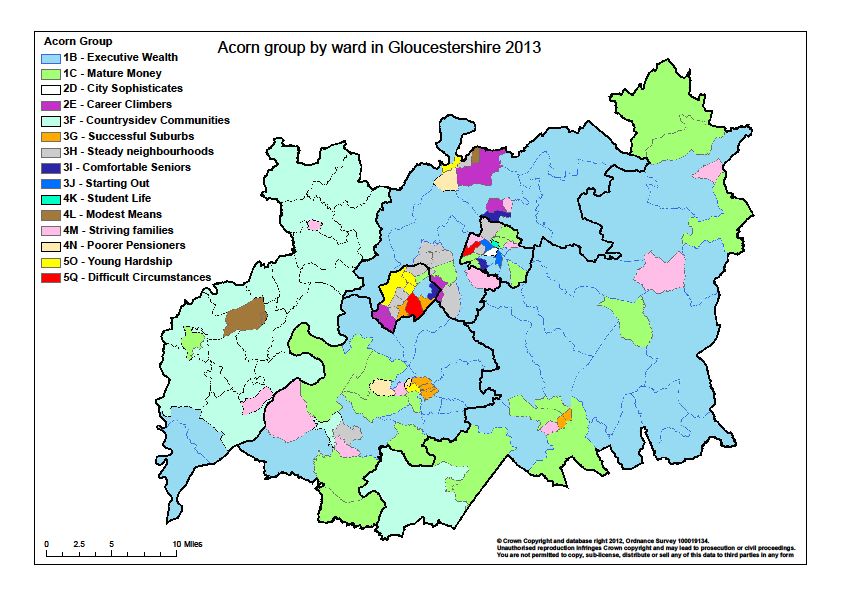
1.      Children’s safeguarding ........................................................................................................ 35
   2.      Adoptions .............................................................................................................................. 38
   3.      Missing children .................................................................................................................... 38
   4.      Early help............................................................................................................................... 40
   5.      Adult safeguarding ................................................................................................................ 41
Key Points.......................................................................................................................................... 41
Section 7 - All young people reach adulthood with the skills and self-confidence they need
to live successful lives and make a positive contribution to the economy of the county. ..... 42

   1.      Education outcomes ............................................................................................................. 42
   2.      Outcome gaps for vulnerable groups ................................................................................... 43
   3.      NEETs (16 to 18 year olds not in education, employment or training) ................................ 44
   4.      Youth unemployment ........................................................................................................... 45
Key Points.......................................................................................................................................... 45
Section 8 - People can access education, training, work ........................................................... 46

   1.      Welfare reform ..................................................................................................................... 46
   2.      Qualification level trend by district....................................................................................... 48
   Key Points...................................................................................................................................... 49

                                                                        3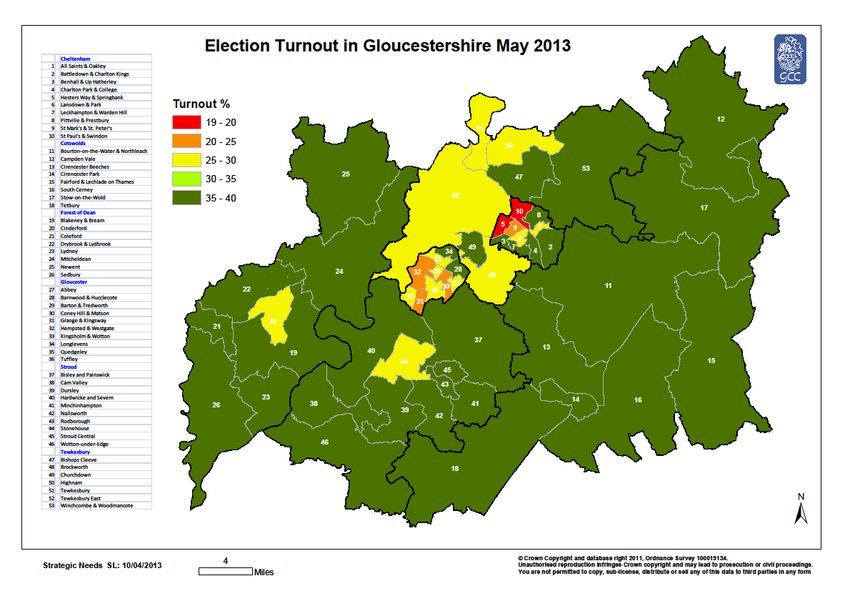
Introduction

                        Introduction

This document summarises current and projected future need and
demand in Gloucestershire as it relates to County Council services. It does
not seek to address performance or resource issues.

It is not a complete overview but is intended to complement the more
comprehensive Understanding Gloucestershire 2012 with new intelligence,
particularly from the 2011 Census, and updates on the most significant
areas of risk for the council.

After an initial section dealing with cross-cutting demographic issues the
report is structured around the County Council’s strategic outcomes
framework.

Further information on need in the county is available from the following
websites:

   o MAIDeN - http://www.maiden.gov.uk/index

   o JSNA - http://jsna.gloucestershire.gov.uk/

   o Inform - http://www.gloucestershire.gov.uk/inform/

or directly from the Strategic Needs Analysis Team.

Understanding Gloucestershire 2012 can be accessed here:
http://www.gloucestershire.gov.uk/inform/understanding

                                4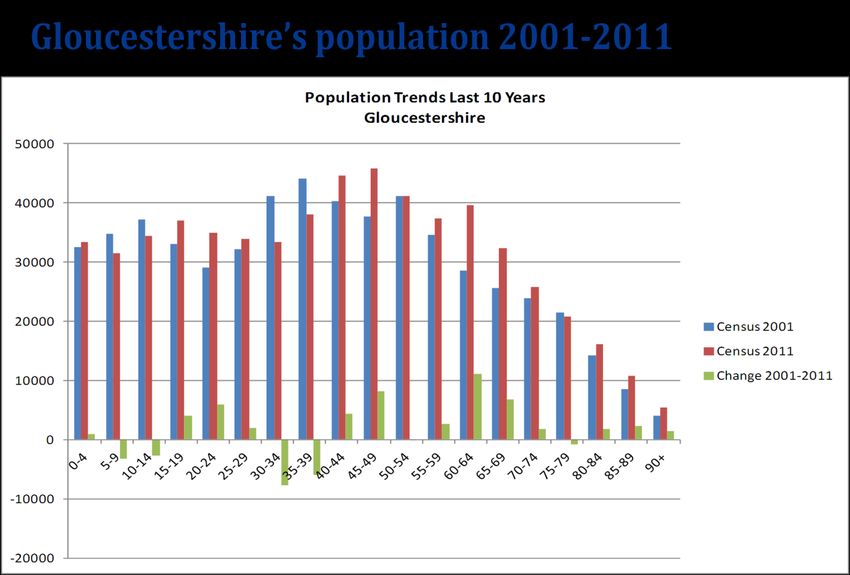
Executive Summary

                       Executive summary

The population of Gloucestershire grew by 5.7% between 2001 and 2011,
was estimated to rise to 602,000 in 2012 and is projected to increase to
644,000 by 2021

Numbers of older people, including those living alone, are rising at a
significantly faster rate than for other age ranges in Gloucestershire

People from a BME background now represent 4.6% of the county population
and a further 3.1% belong to the ‘White-other’ ethnic group

Gloucestershire has a diverse population which is relatively prosperous
compared to the country as a whole but with significant pockets of deprivation

We have a diverse economy with strengths in manufacturing and advanced
engineering

Unemployment in Gloucestershire is below national and regional levels and
falling, though less so in Gloucester than in the rest of the county

Gloucestershire is recycling an increasing proportion of waste but needs to
do more

In general, the numbers of fires in Gloucestershire is reducing and is below
national levels

The number of people living alone and increasing estimated levels of
loneliness are likely to lead to adverse health outcomes and increased costs
unless addressed

The number of people in Gloucestershire aged over 85 with their day to day
activities limited a lot by long term illness and disability is predicted to rise by
over a quarter by 2021 driving up demand for adult social care services

The number of unpaid carers is likely to need to rise by over 10% by 2017 in
order to meet increased care needs

                                      5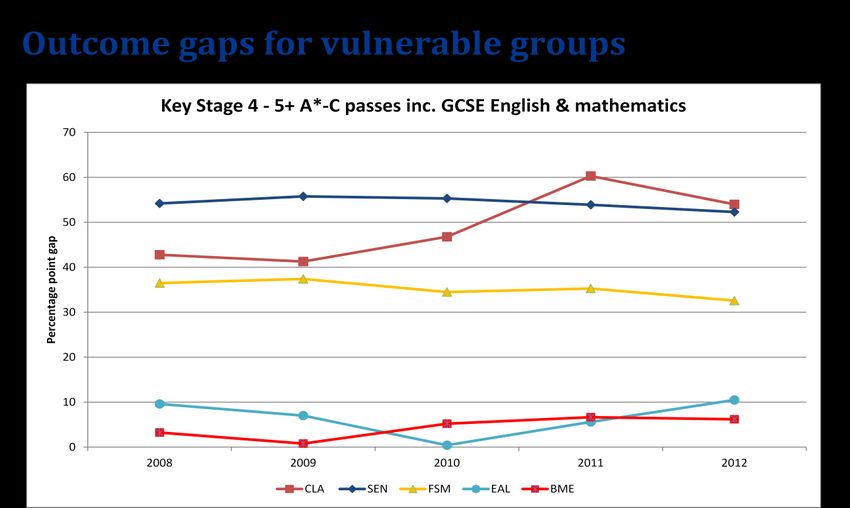
Executive Summary

On most measures adult social care service users and carers are
experiencing better outcomes, on average, than those in our comparator
group according to the 2012/13 surveys

Whilst life expectancy is increasing for all social groups in Gloucestershire,
living in an area of high deprivation and being male are both still linked to
decreased longevity.

There is substantial variation in levels of healthy living in terms of smoking,
alcohol and obesity with strong correlations with areas of high deprivation

Children’s referral numbers peaked in 2009/10 but have reduced to 4,981 in
2012/13 though Looked After Children numbers have risen

There are much higher rates of children’s safeguarding referrals in
Gloucester than elsewhere in the county

Increases in the number of children coming into care are leading to increased
numbers for adoption

296 children went missing between April and October 2013 of whom 37%
were from Gloucester District

Adult safeguarding alerts have increased but this may reflect increased
awareness rather than any change in numbers at risk and we are in line with
our comparator authorities

Children resident in the Forest of Dean underperform relative to the rest of
the county at KS2 and KS4, Gloucester children underperform at KS4

Looked after children and those with Special Educational Needs perform, on
average, 50 percentage points below the county average for GCSE A*-C
including English and Maths

The number of NEETs in Gloucestershire continues to reduce and our rate
remains below the national and regional averages

Whilst the number of 18 to 24 year olds who are unemployed is falling the
number who are out of work for over six months does not show any
significant reduction

2013/14 is the year in which the impact of the government’s welfare reforms
begins to show. For 2015/16 the total loss in benefits to Gloucestershire
residents arising from the reforms is estimated at almost £100m a year.

                                    6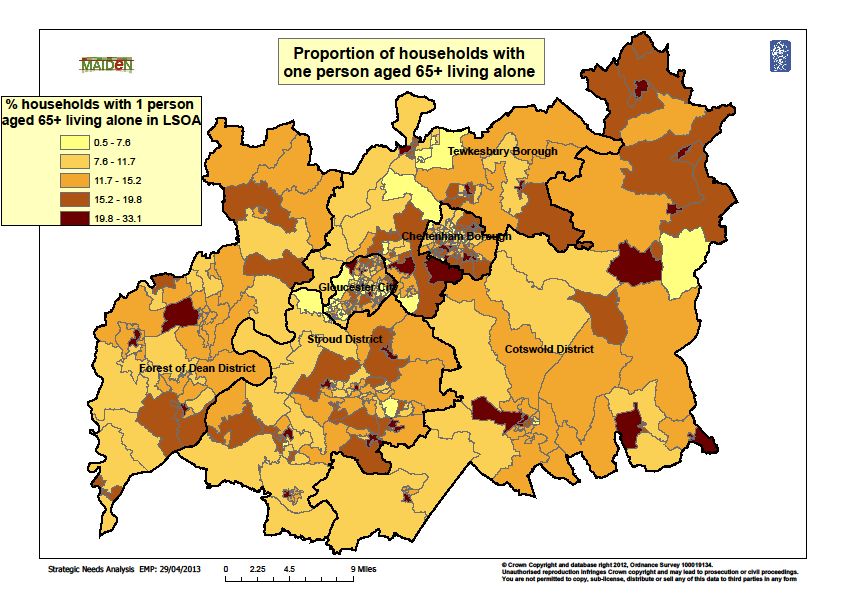
Executive Summary

Almost two thirds of the 67,000 households affected are likely to be working
households.

The impact of the welfare reforms will be most felt by Gloucester residents
due to the relatively high concentration of poorer households in the city

The proportion of adults with no qualifications has fallen between 2001 and
2011 across the county and the proportion with level 4 and above
qualifications has risen. However, The Forest of Dean and Gloucester have a
population who are under-qualified at level 4 and above compared to the
other districts.

                                  7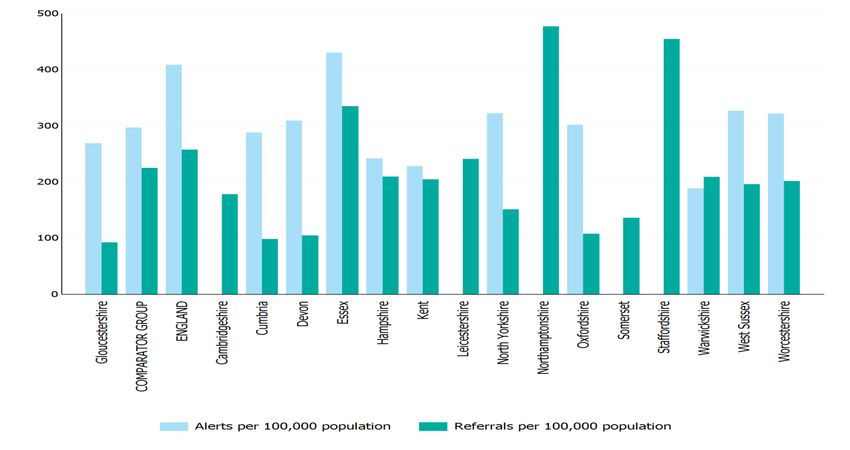
Section 1 – Key Demographic Issues

     Section 1 - Key Demographic Issues for GCC Outcomes

      About this section

      This section sets out the key demographic issues facing Gloucestershire now and
      in the future. The issues are cross-cutting, affecting outcomes across all areas of
      need. In particular, it outlines key statistics from the 2011 Census.

1. A Growing Population

      1.1. The population of Gloucestershire grew by 5.7% in the 10 years to 2011, an
           average of 3,200 people a year1. This compares with a national growth rate
           of 7.8% for the same period. The growth is driven mainly by internal migrants
           (people moving to the county from elsewhere in the United Kingdom),
           typically aged 30-44, with their young families1. Natural growth, caused by
           higher numbers of births than deaths in the county, has accounted for an
           increasing proportion of the overall increase since 2007 when the number of
           births surged. The Office for National Statistics (ONS) latest estimates put the
           population of Gloucestershire at around 602,000 as of 20122

1
    ONS, 2001, 2011 Census
2
    ONS, 2012 Mid-Year Estimates

                                              8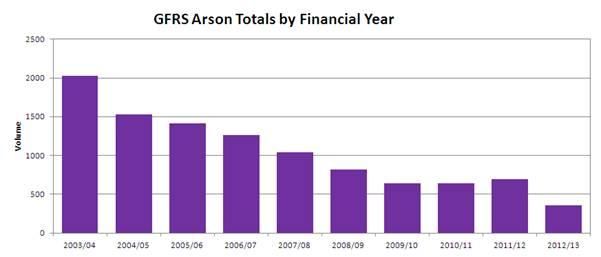
Section 1 – Key Demographic Issues

      1.2. Between 2001 and 2011, the growth of the older population (aged 65 and
           above) continued to outpace that of the younger population. The rate of
           growth in the County's older population is also higher than that in England
           and Wales3.

      1.3. New ONS interim population projections suggest that the population of
           Gloucestershire will increase faster than previously anticipated due to an
           upward revision for the projected children, young people and working-age
           populations4. The revised projected growth rate between 2011 and 2021 was
           0.76% or 4,600 people per annum on average, which remained below the
           rate predicted for England (0.86%).

      1.4. The overall population in the county is expected to reach 644,000 by 2021 if
           current trends continue3.

      1.5. Forty per cent of the growth between now and 2021 will be accounted for by
           natural growth and 60% by internal migration3.

                     2. Age range             3. Population growth 2001-2011

                                          4. Gloucestershire     5. England & Wales

                            0-17                    6. -2.3%                 7. 1.5%

                            18-64                      8. 6.4%               9. 9.2%

                        65 and above               10. 13.6%                11. 10.9%

2. An Ageing Demographic

      2.1. The number of older people aged 65 and above in the county has been
           growing by an average of 1,500 people per year over the last 10 years.
           Projections suggest that this will double to an increase of about 3,100 people
           annually on average between now and 20213. Long-range projections
           covering the next twenty years are not yet available but the increase is
           expected to accelerate in this period as a result of rising life expectancy and
           the demographic impacts of two generations of baby boomers.

3
    ONS, 2001, 2011 Census
4
    ONS, 2011-based interim projections

                                                   9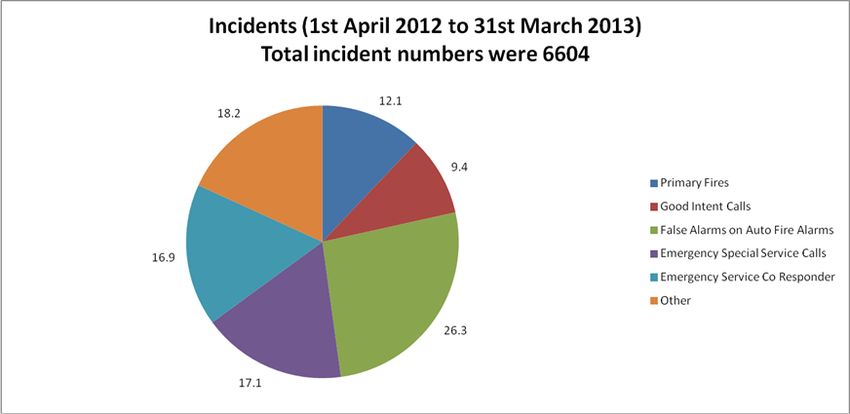
Section 1 – Key Demographic Issues

      2.2. Significantly, the projected percentage increase of the older population is
           greater in Gloucestershire than in England over the period 2010-2021 (up
           27% compared to 24%). The impact of the County’s ageing demographic is
           further heightened by the small growth of its child and working-age population
           compared to England over the same period5.

      2.3. In particular, the number of people aged 75 and over (the ages at which GCC
           adult care and other support services are most likely to be required) is
           projected to increase by an annual average of 1,700 between 2011 and
           20215. The table below shows that the number of people aged 85 and above
           will see the fastest rate of growth during this period.

                  Age           Gloucestershire population growth
                 range
                                   2001-2011          2011-2021

                   65 and                  14%                    29%
                    above

                   75 and                  10%                    33%
                    above

                   85 and                  29%                    38%
                    above

5
    ONS, 2011-based interim projections

                                                 10
Section 1 – Key Demographic Issues
2.4. The number of neighbourhoods with high proportions of older people is also
expected to increase. Data from the 2011 Census showed that a total of 40
council wards (i.e. 28% of all wards) had at least 1,000 residents aged 65
and above, accounting for between 10.4% and 30.7% of the ward
population6.
2.5. There were also 39 council wards (i.e. 27%) containing at least 500 elderly
people aged 75 and above. By 2015, the number of such wards could grow
to 60 (i.e. 40% of wards), spreading across urban and rural areas of the
county. An estimated 40% to 66% of the older population in these wards will
be aged 757. The following two maps illustrate the position in 2011 and how it
would look if the elderly population grows in line with ONS projections.
6
ONS, 2011 Census
7
ONS, 2011-based interim projections
11Section 1 – Key Demographic Issues
2.6. The rising trend of older people aged 65 and above living alone could also
place extra pressure on care and infrastructure provision. Data from the
Census suggests that there were 33,800 people aged 65 and above living on
their own in 20118. The number is projected to rise to 41,000 by 20219. It is
projected that almost 7 in 10 single pensioners will be aged 75 and above in
2021, and among these, three quarters will be women. Section 3.2 explores
some of the potential consequences of this increase in numbers living alone.
8
ONS, 2011 Census
9
ONS, 2011-based interim projections
12Section 1 – Key Demographic Issues
3. Growth of Ethnic Population
3.1. The 2011 Census shows that 46,100 people who are usually resident in
Gloucestershire were born outside the UK, representing 7.7% of the total
population (nationally it was 13.4%). Among these, 40% (18,400 people)
were recent migrants, having arrived since 200410.
3.2. The migration pattern since 2004 was closely linked to inflow from East
European countries. This has resulted in the ‘White Other’ population in the
county more than doubling between 2001 and 2011, from 9,000 to 18,600.
This group now accounts for 3.1% of the county population8.
3.3. Between 2001 and 2011, the percentage of non-white population in the
County rose from 2.8% to 4.6%. The figure is low compared to the national
percentage of 14.1%. Ethnic groups showing the biggest growth in the county
were White-British (+11,500 people), 'White-other' (+9,500), Other Asian
(+2,300) and Indians (+2,000)8.
3.4. It is difficult to predict future patterns of immigration into the county. However,
ONS projections for the period to 2021 forecast that on current trends, the
levels of immigration to Gloucestershire will be balanced by emigration11.
3.5. It is likely that the future growth of the ethnic population in Gloucestershire
will be increasingly accounted for by natural growth from within the domestic
population, as it has a young age structure. (91.4% of the ethnic population
are children and working-age in 2011, compared to 81.3% of the
Gloucestershire population as a whole)7.
10
ONS, 2011 Census
11
ONS, 2011-based interim projections
13Section 1 – Key Demographic Issues
Key Points
The population of Gloucestershire grew by 5.7% between 2001 and 2011,
was estimated to rise to 602,000 in 2012 and is projected to increase to
644,000 by 2021
Numbers of older people, including those living alone, are rising at a
significantly faster rate than for other age ranges in Gloucestershire
People from a BME background now represent 4.6% of the county population
and a further 3.1% belong to the ‘White-other’ ethnic group
.
14Section 2 – Attractive Places to Live, Work, and Invest
Section 2 - Gloucestershire and its communities are
attractive places to live, work and invest now and in the
future
1. Who lives in Gloucestershire?
1.1. Acorn is a powerful consumer classification that segments the UK population.
Acorn is used to understand consumers' lifestyle, behaviour and attitudes,
together with the needs of communities. It is used to analyse customers,
evaluate local markets and focus on the specific needs of each catchment
and neighbourhood.
1.2. Acorn segments postcodes and neighbourhoods into 6 Categories, 18
Groups and 62 types. By analysing significant social factors and population
behaviour, it provides precise information and in-depth understanding of the
different types of people12.
1.3. This map shows the Acorn group that accounts for the highest proportion of
the population in each ward. There is however, considerable variation in the
12
http://acorn.caci.co.uk/what-is-acorn
15Section 2 – Attractive Places to Live, Work, and Invest
way groups are distributed within wards. In Chedworth for example only five
of the eighteen groups are present with ‘Executive Wealth’ accounting for
72.2% of the population, whereas in Stonehouse the population is spread
across fifteen groups with ‘ Poorer Pensioners’ accounting for the highest
proportion at 14.2% of the people in the ward.
1.4. We can show where the estimated proportion of Gloucestershire’s population
in Acorn groups differ significantly from the United Kingdom as follows13:
United
Acorn group Gloucestershire Kingdom
Executive wealth 17.5% 12.1%
Gloucestershire has more Mature money 14.2% 8.8%
of these type of people Comfortable seniors 4.4% 2.5%
Countryside communities 8.7% 6.5%
Lavish lifestyles 0.7% 1.3%
City sophisticates 1.1% 3.2%
Gloucestershire has less of Modest means 4.8% 8.0%
these type of people Struggling estates 1.9% 7.4%
Difficult circumstances 2.1% 4.6%
Student life 1.6% 2.5%
1.5. This table shows that while Gloucestershire may be under-represented in two
very affluent groups (‘lavish lifestyles’ and ‘city sophisticates’ which are
perhaps more common in London and the south east), the groups where we
are over-represented are all relatively affluent categories. In contrast, the
groups ‘struggling estates’ and ‘difficult circumstances’ which are likely to
generate significant demand for council services make up 12% of the UK as
a whole but only 4% of the Gloucestershire population.
2. Working in Gloucestershire
2.1. Gloucestershire has a diverse employment base with the Care, Business and
Professional and Manufacturing sectors providing most employment in the
county. The following graph illustrates the strength of manufacturing and
engineering relative to the rest of country. Advanced engineering sectors
such as aerospace and precision engineering, which have well-developed
export markets, are particular strong points in Gloucestershire14.
13
CACI Ltd., 2013
14
NOMIS, 2013
16Section 2 – Attractive Places to Live, Work, and Invest
Gloucestershire key sectors by percentage of total employment in 2011
14
13 13
13 Gloucestershire GB
12
11
10
10
% 0f total employment 2011
9 9
8 8
6
5 5
4 4
2 2
2 1
0
Care Business & Manufacturing Leisure & Tourism Construction Advanced ICT
Professional engineering
Note: Employment = employees + working proprietors. Working proprietors are sole traders, sole
proprietors, partners and directors.
2.2. 76.6% of the Gloucestershire population aged 16-64 was in employment in
201215.
2.3. Unemployment levels in Gloucestershire remain substantially below national
rates and in line with those for the South West region. However the
percentage of Job Seeker Allowance (JSA) claimants within Gloucestershire
ranges from 1.1% of the 18-64 population in Cotswold District to 3.3% for
Gloucester (almost a third of the all claimants in the county) 12
4.5
% of resident population in reeipt of JSA aged 16-64
4.0
3.5
3.0
2.5
2.0
1.5
1.0
0.5
0.0
Dec-09
Dec-10
Dec-11
Dec-12
Aug-09
Oct-09
Aug-10
Oct-10
Aug-11
Oct-11
Aug-12
Oct-12
Aug-13
Oct-13
Apr-09
Apr-10
Apr-11
Apr-12
Apr-13
Feb-10
Feb-11
Feb-12
Feb-13
Jun-09
Jun-10
Jun-11
Jun-12
Jun-13
Gloucestershire Great Britain South West
15
NOMIS, 2013
17Section 2 – Attractive Places to Live, Work, and Invest
% claimants
District
October 2013
2.4%
Cheltenham
1.1%
Cotswold
2.1%
Forest of Dean
3.3%
Gloucester
1.6%
Stroud
1.8%
Tewkesbury
2.4. The rate of improvement in unemployment levels also varies across the
county. The following table shows the percentage fall in the number claiming
JSA between April 2009 and October 2013 by county and district. It shows
that Gloucester has experienced a smaller fall in the percentage claiming
JSA than the rest of the county16.
Area % fall between
April 2009 and
October 2013
Gloucestershire -35%
Cheltenham -35%
Cotswold -47%
Forest of Dean -42%
Gloucester -22%
Stroud -42%
Tewkesbury -39%
3. Housing
3.1. Between 2001 and 2011, the proportion of owner-occupied households in the
county reduced from 73.7% of all households to 69.4% and the proportion in
privately rented accommodation rose from 9.6% to 15.4%17. Nationally in
16
NOMIS, 2013
17
ONS, 2011 Census
18Section 2 – Attractive Places to Live, Work, and Invest
2011, the proportions were 63.5% for owner-occupied and 18.1% for privately
rented households. This was accompanied by an increase in the proportion
of flats and apartments in the county from 13.4% to 15.1%.
3.2. It is noteworthy that the number of people in residential/nursing care in 2011
(4,170) was little changed from 2001 despite the large increase in the number
of older people. The number funded by GCC fell from 2,357 in 2002 to 2,118
in 2011 (about half of the total number in residential care)18.
45%
40%
35%
30%
25%
20%
15%
10%
5%
0%
Owned: Owned Owned: Owned Shared ownership Social rented: Social rented: Private rented: Private rented:
outright with a mortgage or (part owned and Rented f rom Other Private landlord or Other (includes
loan part rented) council (Local letting agency living rent f ree)
Authority)
Glos 2001 Glos 2011 England & Wales 2011
Impact of deprivation in Gloucestershire
About 44,000 Gloucestershire residents live in Lower Super Output areas that
fall in to the 20% most deprived in England (Index of Multiple Deprivation (IMD)
2010).
Residents in these neighbourhoods compared to the rest of Gloucestershire
residents are 3 times more likely to be claiming unemployment benefit.
4. Future waste issues
1.1. With the population and number of households within Gloucestershire
predicted to increase until at least 2035, this will have direct implications for
the amount of waste produced and landfill tax to be paid by the County
Council. The following graph shows the progress made between June 2011
18
ONS, 2011 Census
19Section 2 – Attractive Places to Live, Work, and Invest
and March 2013 in reducing the volume of residual waste to about 135,000
tonnes in 2012/1319.
1.2. 48.29% was recycled from household sources in 12/13 with the remainder
sent to landfill. The following graph illustrates trends in the proportion of
waste recycled by District19:
30000
28000 Glos City
26000 Stroud
24000 Cheltenham
Tonnes
22000
20000
18000
16000 Cotswold
14000 Forest of Dean
Tewkesbury
12000
10000
Jun-11 Sep-11 Dec-11 Mar-12 Jun-12 Sep-12 Dec-12 Mar-13 Jun-13
Glos City Cheltenham Cotswold Forest of Dean Stroud Tewkesbury
19
Gloucestershire County Council, 2013
20Section 2 – Attractive Places to Live, Work, and Invest
Key Points
Gloucestershire has a diverse population which is relatively prosperous
compared to the country as a whole but with significant pockets of
deprivation
We have a diverse economy with strengths in manufacturing and
advanced engineering
Unemployment in Gloucestershire is below national and regional levels
and falling, though less so in Gloucester than in the rest of the county
Gloucestershire is recycling an increasing proportion of waste but
needs to do more
21Section 3 - Active and resilient people and communities
Section 3 - People and communities are active and resilient
1. Fire and Rescue
1.1. In Gloucestershire we have a relatively low number of fatalities and
casualties in accidental dwelling fires and dwelling fires with no smoke alarm
fitted compared with the rest of the region. Numbers relative to population
size of deliberate primary and secondary fires are also below average and
improving over the last few years20.
1.2. The following pie chart breaks down the 6,604 fires-related incidents in
Gloucestershire in 2012/13 into different categories. Primary Fires are any
fire involving property or casualties or involving over five fire appliances.
Emergency Special Services include water rescue, lift releases, persons
trapped - anything not fire related. Emergency services co-responder are
incidents where we provide emergency medical cover. Good intent calls are
those where someone genuinely thinks there is a fire, but on arrival it was
not. Small fires are those where there is not anything with any value such as
rubbish and grass.
1.3. The next graph shows that all arson (primary and secondary deliberate fires)
has been decreasing year on year for the last 10 years with the one
exception of 2011/12 where reported arson to Gloucestershire Fire and
20
GCC, 2013
22Section 3 - Active and resilient people and communities
Rescue increased by 9%. However, the 2012/13 figure has seen a 48%
reduction on the 2011/12 outcome. In 2003/04 there were nearly 6 deliberate
fires reported each day on average, whereas in 2012/13 the rate has fallen to
less than 1 reported each day.
1.4. There was a high number of chimney fires where Gloucestershire is slightly
above the South West average of 7.3 per 10,000 dwellings in 2012/13) with a
rate of 9.5.
1.5. We have the highest level of malicious fire alarms in the region with no
improvement over the last four years apart from the second quarter of
2013/14 when we had the lowest level. The level of false alarms from
Automatic Fire Alarms in non-domestic premises is also high – we are
second highest in the South West, though slightly improved since September
2012. However, we are amongst the lowest in the region for not attending
such calls as they are managed by calling ahead first.
2. Loneliness
2.1. Section 1 highlighted the likelihood of there being over 20% more single
pensioners in 2021 than 2011. Living alone does not necessarily equate to
loneliness. However, research shows that 63% of adults aged 52 or over who
have been widowed, and 51% of the same group who are separated or
divorced report, feeling lonely some of the time or often21. Furthermore, there
is an increasing body of evidence that the experience of loneliness can have
a significant impact on people’s health22.
2.2. Loneliness has been identified as a similar health risk to lifelong smoking
(15+ cigarettes a day), with links between a lack of social interaction and the
21
Beaumont, Measuring National Well-being – Older people and loneliness, 2013
22
http://www.campaigntoendloneliness.org/loneliness-research/
23Section 3 - Active and resilient people and communities
onset of degenerative diseases such as Alzheimer’s. Loneliness has also
been linked in medical research to heart disease and depression23.
2.3. The English Longitudinal Study of Ageing24 in 2009-10 found for people aged
52+:
25% said they felt lonely sometimes and only 9% said they felt
lonely often (34% combined). For Gloucestershire this equates to
over 19,000 aged 52+ often lonely rising to over 23,000 in 2021 with
72,000 sometimes or often lonely.
46% of people aged 80+ were lonely sometimes or often. For
Gloucestershire this equates to about 15,000 people
People with a longstanding illness that limits their daily activities are
almost three times more likely to be lonely often or always than
those without a longstanding illness
2.4. The following map shows the highest concentrations of older people living
alone in the county25.
23
http://www.campaigntoendloneliness.org/loneliness-research/
24
Measuring National Well-being – Older people and loneliness, ONS, 2013
25
ONS, 2011 Census
24Section 3 - Active and resilient people and communities
3. Community involvement
3.1. Electoral turnout is one of the ways we can assess community involvement in
political processes. This map shows the range of levels of electoral turnout in
the May 2013 elections26. Rural and more affluent urban areas tend to show
the highest turnout rates.
3.2. Another measure of community involvement is volunteering. According to the
latest figures (Oct 2011-Oct 2012) from Sport England27, Gloucestershire has
the 12th highest volunteering rate to support sport, at least one hour, a week
out of 49 County Sport Partnerships of England. Gloucestershire has
experienced a statistically significant increase on sport volunteering levels
when compared with the October 2007 – October 2008 time period.
26
GCC, 2013
27
Active People Survey, Sport England, 2013
25Section 3 - Active and resilient people and communities
Key Points
In general, the numbers of fires in Gloucestershire is reducing and is
below national levels
The number of people living alone and increasing estimated levels of
loneliness are likely to lead to adverse health outcomes and increased
costs unless addressed
26Section 4 – People with a disability / LLTI live independently
Section 4 - People with a disability or long-term illness live
as independently as possible
1. People with a disability or long term illness
1.1. The following graph demonstrates how the older people are, the more likely
they are to be limited in what they can do by disability and long-term illness,
particularly when they reach their eighties28. These limitations also increase
the likelihood that they will need social care services. As the baby-boom
generation ages and average longevity increases there will be a substantial
increase in the number of older people with social care needs.
% of Gloucestershire residents with day to day activities limited a lot
60%
50%
40%
30%
20%
10%
0%
Age 0 to 15 Age 16 to 24 Age 25 to 34 Age 35 to 49 Age 50 to 64 Age 65 to 74 Age 75 to 84 Age 85+
1.2. We are predicting a 27% increase by 2021 in the number of people aged 85+
whose day to day activities are limited a lot by disability or long-term illness.
This projection is based on ONS 2011-based population projections and the
prevalence of disability for this age range being unchanged.
1.3. Forty nine per cent of people aged 85 and over in Gloucestershire have their
day to day activities limited a lot in this way (compared with 53% for England
and Wales as a whole)26. It should be noted, though, that many older people
in Gloucestershire remain physically and mentally active. In 2011 65% of
28
ONS, 2011 Census
27Section 4 – People with a disability / LLTI live independently
residents aged over 65 and 18% aged over 85 were not limited in their day to
day activities in this way at all.
People aged 85 or over with day to day activities limited a lot
4,000
3,500
3,000
2,500
2,000
1,500
1,000
500
-
2013 2014 2015 2016 2017 2018 2019 2020 2021
1.4. Future demand for adult social care services for the County Council is also
expected to increase because of the implications of the Care Bill currently
going through Parliament29. Relevant provisions include:
Substantial numbers of extra reviews and assessments will be required
for self funders to assess their progress towards the proposed £75,000
cap on total care costs.
Additional adult social care services will need to be funded for those
who reach that threshold.
Carers will have strengthened rights to assessments of need and to
services in their own right.
1.5. In the context of a difficult financial climate for councils it is increasingly
understood that in order to manage future costs older people’s social care
needs must as far as possible be met through a preventative approach that is
community-based. For this to be effective we need a better understanding of
need in the community and we are starting to develop the tools that will
support this.
29
http://www.publications.parliament.uk/pa/bills/lbill/2013-2014/0001/lbill_2013-20140001_en_1.htm
28Section 4 – People with a disability / LLTI live independently
2. Carers
2.1. The number of unpaid carers in Gloucestershire has risen by 12% since 2001
and is expected to rise by another 12% to 70,000 by 2017, due mainly to the
increasing number of older people30.
2.2. The ageing population is also likely to lead to a substantial increase in the
number of mutual carers, generally older married couples looking after each
other.
2.3. Using 2011 census data we estimate that there are over 1,600 children and
young people, aged 17 and younger, providing unpaid care in
Gloucestershire.
2.4. Within districts the percentage of carers in the population varies from 9.1% in
Cheltenham to 11.8% in the Forest of Dean.
2.5. Gloucester and the Forest of Dean have the highest proportions of carers
providing over 50 hours of care a week with 23% and 22% of all carers in
each district, respectively, compared with 19.5% for Gloucestershire as a
whole. The Forest of Dean and Gloucester are also the districts with the
highest proportions of people who have their day-to-day activities limited a lot
(8.9% and 7.6% respectively)28.
Estimate of carers by age group 2011
18,000
16,000
14,000
12,000
10,000
8,000
6,000
4,000
2,000
-
under 16 16 to 24 25 to 34 35 to 44 45 to 54 55 to 64 65 to 74 75 to 84 85 and
over
30
ONS, 2011 Census
29Section 4 – People with a disability / LLTI live independently
3. Adult social care service user and carer surveys
3.1. 406 adult social care service users and 331 carers responded to the 2012/13
standardised surveys mandated by the Department of Health31.
3.2. In general we are better or in line for those measures that are used by the
Department of Health to compare Gloucestershire’s service user and carer
outcomes with our comparators. The only measures we know to be
statistically significantly different from the comparator group and England
medians (all better) are ‘service users feel safe’, ‘services make service users
feel safe and secure’ and ‘ease of finding information’.
3.3. From 2013/14 another measure will be added that asks how socially isolated
people feel. As discussed above, loneliness is associated with worse health
outcomes. We know from the 2012/13 surveys that only 44.2% of service
users and 36.7% of carers had as much social contact as they wanted. This
compares with figures of 43.1% for service users and 41.3% of carers for
England as a whole.
31
National Adult Social Care Intelligence Service (NASCIS), 2013
30Section 4 – People with a disability / LLTI live independently
Key Points
The number of people in Gloucestershire aged over 85 with their day to
day activities limited a lot by long term illness and disability is predicted
to rise by over a quarter by 2021 driving up demand for adult social
care services
The number of unpaid carers is likely to need to rise by over 10% by
2017 in order to meet increased care needs
On most measures adult social care service users and carers are
experiencing better outcomes, on average, than those in our
comparator group according to the 2012/13 surveys
31Section 5 - People live healthy lives
Section 5 - People live healthy lives as free as possible
from disability or limiting long term illness
1. Life expectancy
1.1. Life expectancy for both men and women in Gloucestershire is better than
the national average32 as are the falling rates of early death from the major
diseases like cancer, heart disease and strokes33. However, there is still
considerable variation in rates across the county and between different social
groups34.
1.2. The following graph shows average life expectancy at birth for people who
live in the 10% most deprived and 10% least deprived wards of the country.
The life expectancy of males in the most deprived wards has been improving
the quickest but they are still experiencing almost eight years less life
expectancy than males (and more than ten years less than females) in the
least deprived wards32.
1.3. Overall average life expectancy in Gloucestershire for the period 2010-12
was 80.0 for males and 84.1 for females compared with England figures of
79.1 years (male) and 82.9 years (female) for the same period32.
Life Expectancy by Deprivation - Gloucestershire
. 86
84
82
Life Expectancy at Birth
80
78
76
74
72
70
68
66
2001-2005 2002-2006 2003-2007 2004-2008 2005-2009 2006-2010
Most Deprived Males 72.3 73.0 73.0 73.8 74.1 74.3
Least Deprived Males 80.2 80.5 80.5 81.1 81.6 81.9
Most Deprived Females 78.4 78.2 78.3 78.9 79.1 79.7
Least Deprived Females 83.8 83.6 83.8 83.8 84.2 84.5
32
Life expectancy at birth and at age 65 by local areas in England and Wales, 2010-12, ONS, 2013
33
Health & Social Care Information Centre, 2013
34
http://www.apho.org.uk/default.aspx?RID=110504
32Section 5 - People live healthy lives
Impact of deprivation
About 44,000 Gloucestershire residents live in Lower Super Output areas that
fall in to the 20% most deprived in England (IMD 2010). Residents in these
neighbourhoods compared to the rest of Gloucestershire residents are:
31% more likely to have a low birth-weight baby
More than twice as likely to be a smoker when pregnant
65% more likely to bottle feed
70% more likely to have a child under 5 admitted to A&E
Are 3 times more likely to be a looked after child
2. Healthy lifestyles
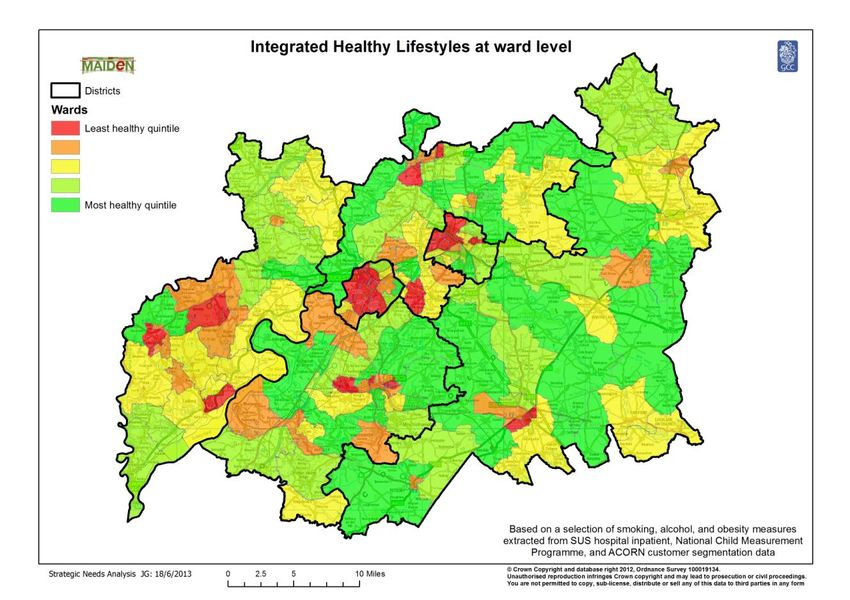
2.1. The following map illustrates variations in healthy lifestyles across
Gloucestershire. A single summary measure ranking healthy lifestyles by
ward was created by combining ward rankings for three separate health risks:
alcohol, smoking and obesity. Each risk was weighted equally. The three risk
rankings were derived as follows with smoking and obesity combining two
and three sub-measures respectively.
Alcohol
Alcohol specific hospital patients (Secondary Uses Service
(SUS))
Smoking
Current Smokers (Acorn)
COPD (respiratory disease) hospital patients (SUS)
Obesity
Child obesity (National Child Measurement Programme)
BMI >30 (Acorn)
Diabetes prevalence (Acorn)
33Section 5 - People live healthy lives
Key Points
Whilst life expectancy is increasing for all social groups in
Gloucestershire, living in an area of high deprivation and being male are
both still linked to decreased longevity.
There is substantial variation in levels of healthy living in terms of
smoking, alcohol and obesity with strong correlations with areas of high
deprivation
34Section 6 – Protecting vulnerable people from harm
Section 6 - Vulnerable children, young people and adults
are safe from harm
1. Children’s safeguarding
1.1. This graph highlights the trend in the volume of activity across children’s
social care between 2008/09 and 2012/13. In broad terms, cases start as
referrals on the left hand side of the graph progressing to Looked After
status on the right unless the case is concluded at an earlier stage 35.
6000
5000
4000
3000
2000
1000
0
Ref errals IAs CAs Section 47 ICPConf erences CP Plans LAC
Enquiries
2008 / 09 2009 / 10 2010 / 11 2011 / 12 2012 /13
1.2. The number of referrals to social care teams of children about whom
someone has a concern peaked in 2009/10 when awareness and
sensitivity was increased by the Baby P case and reduced from 5,577 in
2011/12 to 4,981 in 2012/13.
1.3. A different trend is evident in relation to Looked After Children (LAC)
where numbers reduced to 460 in 2011/12 from 490 in 2009/10 but have
subsequently risen to 522 in 2012/13.
35
GCC, 2013
35Section 6 – Protecting vulnerable people from harm
1.4. The following graph highlights the differences in the rates of social care
activity between the children’s service localities in 201236.
Rates of activity by locality 2012
(Calendar Year )
800
700
600
Rate per 10,000 CYP aged 0-17
500 Cheltenham
Cotswold
Forest
400
Gloucester North
Gloucester South
Stroud
300
Tewkesbury
200
100
0
Referrals Initial Assessments Core Assessments S47 Enquiries Initial CP Conferences
1.5. Gloucester North and South have much higher rates of activity at referral
and Initial Assessment stages than the other localities. At the Initial Child
Protection Conference stage the rate for Gloucester South is much more
in line with other localities whilst Gloucester North again has a much
higher level of activity. The Forest of Dean has a relatively low rate of
referrals (fifth ranked locality) but only Gloucester North has a higher rate
of Initial CP Conferences.
1.6. Work has been undertaken to look at the reasons why Gloucester differs
so much from the other localities and benchmarking has taken place to
identify the authorities most similar to Gloucester in terms of demographic
profiles (excluding non-metropolitan districts in order to obtain comparator
data). This table of Gloucester’s ‘nearest neighbours’ shows that the city is
more like northern urban authorities than the shire counties against which
Gloucestershire is usually benchmarked34.
36
GCC, 2013
36Section 6 – Protecting vulnerable people from harm
Gloucester’s nearest statistical neighbours
Bury Metropolitan Borough Council
Darlington Borough Council
Derby City Council
Kirklees Metropolitan Borough Council
Medway Council Unitary Authority
Stockport Metropolitan Borough Council
Swindon Borough Council
Thurrock Council Unitary Authority
Warrington Unitary Authority
1.7. 242 children were admitted to care in 2012/13. As 185 children were
discharged from care there has been an increase of 57 children currently
in care in the year37.
Looked after children rates per 10,000 population
65
60 59 59 59
55
55
50
45 44.1
43.3
42.8
41.7
40
40 39
38 38.1 38
35
2008/09 2009/10 2010/11 2011/12 2012/13
Gloucestershire Gloucestershire's statistical neighbours England
1.8. Recent improvements in practice and better understanding of the impact of
risk have resulted in a significant increase in the numbers of young
children becoming looked after. This trend is unlikely to reduce over the
next 3 years. This will have implications for future spend in terms of
meeting the need for increased adoption allowances for each child until
they reach adulthood.
1.9. Analysis of current admissions to care show that a substantial proportion
are of pre-school age children at about 45% of all admissions resulting
from child welfare concerns35
37
GCC, 2013
37Section 6 – Protecting vulnerable people from harm
2. Adoptions
2.1. There has been a rise in the number of children needing adoption because
of the increased number coming into care. Although there remains a high
demand for adoptive placements, there have been significant increases in
both number of adopters and the number of children placed and
substantially more children are expected to be adopted in 2013/14 than in
the previous year38.
Number of children adopted in Gloucestershire (subject to adoption order)
35
30
25
20
15
10
5
0
2010/11 2011/12 2012/13 2013/14 Q1
3. Missing children
3.1. The current statutory guidance defines a missing child or a young runaway
as ‘children up to the age of 18 who have run away from their home or
care placement, have been forced to leave, or whose whereabouts are
unknown’.
3.2. The reasons for children running away are varied, complex and unique to
individual children. Missing children are at high risk of physical and sexual
abuse, criminality and homelessness39. Persistent running away is
increasingly understood both nationally and in Gloucestershire to be an
indicator that a child may be a victim of sexual exploitation.
3.3. It is difficult to set out historic trend data due to changes in data recording
practice and consistency and the current recording framework was only
implemented in September 2013.
38
GCC, 2013
39
Missing children, OFSTED, 2013
38Section 6 – Protecting vulnerable people from harm
3.4. Bearing in mind these qualifications around data quality, between April and
October 2013 in Gloucestershire there have been 548 missing episodes,
relating to 296 children and young people being reported missing, 93 of
whom were reported missing more than once. 85% of the episodes were
for 18 hours or less and 84 were episodes of over 18 hours.
3.5. The following table shows the numbers of children who went missing in the
period according to their relationship with social services. This illustrates
that, with 124 cases having the relationship with social services
unrecorded, 31%, of runaways were Looked After Children. Almost 40% of
these were the responsibility of other local authorities40.
Apr-Oct
2013
Looked After Children (Glos) 55
Looked After Children (Glos)-Placed Out of county 1
Looked After Children (Other Local Authority) 35
Children in Need register 21
Child with care protection plan 1
No Social Care 59
Not Recorded 124
Total 296
3.6. One per cent of those who were missing were under 6 years old, 5% aged
6-10, 38% aged 11-14, 26% aged 15 and 30% aged16-17.
3.7. The following pie chart illustrates the relatively high level of children living
in Gloucester District who go missing – 37% of all children going missing
in the county.
Individuals missing by District April to October 2013
21, 7% 4, 1%
44, 15%
47, 16% Cheltenham
29, 10% Cotswold
Forest of Dean
Gloucester
Stroud
Tewkesbury
41, 14%
Out of county
110, 37%
40
GCC, 2013
39Section 6 – Protecting vulnerable people from harm
4. Early help
There is a significant body of research, as referenced in the two reports by
Graham Allen MP41, that argues that the earlier help can be provided to children
in need the better their long term outcomes will be and the lower the cost to the
public finances. The term ‘early help’ is now being used in Gloucestershire to
refer to a range of activities which aim to identify children ‘at risk’ of needing help
and intervention – particularly in council children’s services and youth support.
The numbers of children becoming the subject of Child Protection plans and
coming into care are rising as part of a national trend. In Gloucestershire, the
County Council, in partnership with other local service providers, is developing a
programme which aims to harness all the resources available locally to
encourage more effective joint working at an earlier stage and shift the spending
pattern away from ‘late’ intervention. This approach requires better identification
of need and demand at an earlier stage and work is in progress to improve the
quality of intelligence in this area.
Impact of deprivation
About 44,000 Gloucestershire residents live in Lower Super Output areas that fall
in to the 20% most deprived in England (IMD 2010). Residents in these
neighbourhoods compared to the rest of Gloucestershire residents:
Are more than twice as likely to be victims of any crime
Are over 3 times more likely to become a victim of violent crime
Are twice as likely to be a young victim of crime (alternative)
Are over 3 times more likely to be a victim of crime involving domestic
abuse
Are almost 3 times more likely to experience Anti-Social Behaviour
Adult re-offenders are over 5 times more likely to live here
41
https://www.gov.uk/government/news/graham-allen-launches-second-report-on-early-intervention
40Section 6 – Protecting vulnerable people from harm
5. Adult safeguarding
5.1. The number of safeguarding alerts for vulnerable adults received during
2012/13 rose to 2,185 from 1,282 in 2011/1242. This is a positive sign of
increased awareness, and brings us in line with other councils nationally.
Key Points
Children’s referral numbers peaked in 2009/10 but have reduced to
4,981 in 2012/13 though Looked After Children numbers have risen
There are much higher rates of children’s safeguarding referrals in
Gloucester than elsewhere in the county
Increases in the number of children coming into care are leading to
increased numbers for adoption
296 children went missing between April and October 2013 of whom
37% were from Gloucester District
Adult safeguarding alerts have increased but this may reflect increased
awareness rather than any change in numbers at risk and we are in line
with our comparator authorities
42
NASCIS, 2013
41Section 8 – Access education, training, work and essential services
Section 7 - All young people reach adulthood with the
skills and self-confidence they need to live successful
lives and make a positive contribution to the economy of
the county.
1. Education outcomes
1.1. Most children in Gloucestershire have positive outcomes – in 2013 61.6%
achieved 5 A*-C GCSEs including English and Maths, compared to 60.4%
nationally. However, there is substantial variation in outcomes across the
county43.
1.2. Analysis of Key Stage 2 and 4 results for Gloucestershire children based
on district of residence show consistently lower outcomes for Forest of
Dean pupils. Gloucester pupils significantly under-perform at Key Stage 4
relative to the rest of Gloucestershire, though the gap is reducing.
1.3. The underlying causes of these variations are not clear but they do have
implications for the success of pupils in the job market and the strength of
local economy.
43
The Educational Performance Analysis System (EPAS), 2013
42Section 8 – Access education, training, work and essential services
2. Outcome gaps for vulnerable groups
2.1. The following graph shows the difference between the county average and
the typical outcome for vulnerable groups at Key Stage 444.
2.2. The biggest gaps (over fifty percentage points) are for Looked After Children
(LAC/CLA) and children with Special Educational Needs (SEN)
2.3. While outcomes for children with English as an Additional Language (EAL)
are much lower at about ten percent the gap has increased since 2010. The
performance gap for BME children has also increased since 2008.
2.4. The gap for children who receive Free School Meals (FSM), a proxy for
deprivation, is above 30 percentage points but has steadily decreased in
recent years.
2.5. There are few students from vulnerable groups in school sixth forms. Only
some minority ethnic groups are fully represented. Children with disabilities or
from disadvantaged backgrounds who continue in education may prefer to go
to Further Education colleges.
44
The Educational Performance Analysis System (EPAS), 2013
43Section 8 – Access education, training, work and essential services
Impact of deprivation
About 44,000 Gloucestershire residents live in Lower Super Output areas that
fall in to the 20% most deprived in England (IMD 2010). Residents in these
neighbourhoods compared to the rest of Gloucestershire residents:
Are 3 times more likely to be eligible for free school meals
Are twice as likely to have Special Educational Needs
Are twice as likely to struggle at school
3. NEETs (16 to 18 year olds not in education, employment or training)
3.1. Though numbers vary seasonally the percentage of 16 to 18 year olds who
are NEET demonstrates a sustained downward trend between a peak in
September 2011 and September 2013 taking account of the seasonality that
affects outcomes45.
6 5.6
5.3
5.1
4.8 4.9 4.8
5 4.7 4.7
4.4 4.4 4.4 4.4 4.4 4.4 4.5
4.3
4.1 4 4.1
3.8 3.9 3.9 3.8 3.8
4 3.6
3.2
3
2
1
0
Sep-08
Sep-10
Sep-12
Sep-07
Sep-09
Sep-11
Sep-13
Jun-07
Jun-08
Jun-09
Jun-10
Jun-11
Jun-12
Jun-13
Mar-08
Mar-09
Mar-10
Mar-11
Mar-12
Mar-13
Dec-07
Dec-09
Dec-11
Dec-08
Dec-10
Dec-12
3.2. Gloucestershire’s March 2013 NEET percentage at 4.4% is below the
average of 4.8% for our statistical neighbours and 4.9% for England as a
whole.
45
Prospects Services, 2013
44Section 8 – Access education, training, work and essential services
4. Youth unemployment
4.1. There has been a fall of about 50% since April 2009 in the number of people
receiving Job Seekers Allowance for less than 6 months. However, there has
been an increase of about 36% in the number of 18-64 year olds claiming for
over 6 months46.
4.2. Claimants aged 16-24 are about a quarter of the total unemployed for over 6
months. This graph demonstrates the contrasting picture for younger job-
seekers of falling overall numbers out a work but a hard core who are
remaining unemployed long-term.
Numbers of 18-24 unemployment benefit claimants
3500
3000
18-24 year olds - total claimants
2500
2000
1500
1000
500
0
Aged 18-24, claiming for over 6 months Aged 18-24, claiming for under 6 months
Key Points
Children resident in the Forest of Dean underperform relative to the rest
of the county at KS2 and KS4, Gloucester children underperform at KS4
Looked after children and those with Special Educational Needs
perform, on average, 50 percentage points below the county average for
GCSE A*-C including English and Maths
The number of NEETs in Gloucestershire continues to reduce and our
rate remains below the national and regional averages
Whilst the number of 18 to 24 year olds who are unemployed is falling
the number who are out of work for over six months does not show any
significant reduction
46
NOMIS, 2013
45You can also read


