Tauranga City Council Assessing the Social Impacts of Gambling within Tauranga City - August 2018
←
→
Page content transcription
If your browser does not render page correctly, please read the page content below
Tauranga City Council

Assessing the Social Impacts
of Gambling within Tauranga
            City

          August 2018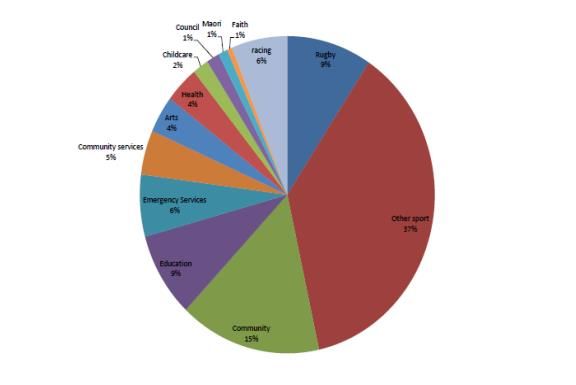
[Document title]

Contents
1.     Introduction .............................................................................................................................. 1

2.     Types of Gambling in New Zealand ........................................................................................... 1

     2.1      CLASS 4 GAMBLING .............................................................................................................................. 1

     2.2      RACING AND SPORTS EVENT GAMBLING ...................................................................................................... 1

3.     Gambling Statistics.................................................................................................................... 2

     3.1      NUMBER OF CLASS 4 VENUES AND GAMING MACHINES................................................................................. 2

     3.2      NUMBER OF STANDALONE TAB VENUES .................................................................................................... 3

     3.3      GAMBLING EXPENDITURE ....................................................................................................................... 4

4.     Social Benefits of Gambling....................................................................................................... 8

     4.1      ENTERTAINMENT .................................................................................................................................. 8

     4.2      EMPLOYMENT ..................................................................................................................................... 9

     4.3      FUNDING............................................................................................................................................ 9

5.     Social Costs of Gambling ......................................................................................................... 13

     5.1      GAMBLING HARM .............................................................................................................................. 13

     5.2      PROBLEM GAMBLING RISK FACTORS ....................................................................................................... 14

     5.3      PROBLEM GAMBLING IN TAURANGA ....................................................................................................... 19

6.     Views on Gambling ................................................................................................................. 24

     6.1      NATIONALLY ..................................................................................................................................... 24

     6.2      TAURANGA CITY ................................................................................................................................. 24

     6.3      TOI TE ORA – PUBLIC HEALTH SERVICE (BOP DISTRICT HEALTH BOARD) .......................................................... 25

7.     Summary of Findings............................................................................................................... 25

8.     Conclusion............................................................................................................................... 26

9.     References .............................................................................................................................. 26

10.        Appendices.......................................................................................................................... 28

                                                                                i
[Document title]
1. Introduction
The Gambling Act 2003 (Gambling Act) requires all territorial authorities to have a class 4
gambling policy, while the Racing Act 2003 (Racing Act) requires a policy on standalone
TAB venues. These two policies, which have been combined by Tauranga City Council into
one policy, must be reviewed every three years. The last review took place in 2016.
In reviewing this policy, the Council must have regard to the social impact of gambling within
its district.
This 2018 Social Impact Assessment (the Assessment) discusses the social impact of
gambling in New Zealand and more specifically for the residents of Tauranga City.
Its purpose is to inform the review of the policy.
2. Types of Gambling in New Zealand
The Gambling Act 2003 classifies gambling based on the amount of money spent and the
risk of problem gambling associated with an activity. Classes of gambling range from Class
1, representing low-stake, low-risk gambling, to class 4, which represents high-risk, high-
turnover gambling.
Casino operations and lotteries run by the New Zealand Lotteries Commission are treated as
separate classes within the Act.
The Racing Act 2003 facilitates betting on galloping, harness and greyhound racing, and
other sporting events, which is provided by the NZ Racing Board.
Council has the ability to regulate class 4 gambling, and racing and sports event gambling
promoted by the NZ Racing Board.
2.1 Class 4 Gambling
Gaming machines in pubs and clubs (i.e. outside a casino) represent 'class 4' gambling.
class 4 gambling may only be conducted by a corporate society and only to raise money for
an authorised (e.g. community and non-commercial) purpose.
The Council has the ability to regulate the number of machines and the number and location
of class 4 gambling venues that can be established in the City.
2.2 Racing and sports event gambling
The NZ Racing Board provides opportunities to bet on horse (gallops and harness) and dog
races, and sporting events. Betting on horse races through the TAB has occurred since
1950, betting on greyhound races since 1981, and sports betting since 1996.
The NZ Racing Board provides on-course services to licensed racing clubs at 65 racing
venues throughout the country. Off-course betting is available through TAB retail outlets.
These comprise sub-agencies (pub and club outlets), including self-service terminals, and
dedicated TAB agencies (TAB Board Venues), where the main business carried out is
providing racing-betting or sports-betting services. These are standalone or distinct venues
and do not include TAB outlets or agencies that are additional activities of a bar or hotel,
such as self-service TAB terminals.
The NZ Racing Board also operates a telephone betting service, Internet betting via the TAB
website, and interactive remote betting through Sky digital TV.
The Council has the ability to regulate the number of number of standalone TAB Board
venues and the location that they can be established in the City.
1[Document title]
3. Gambling Statistics
3.1 Number of Class 4 Venues and Gaming Machines
National
As at 31 December 2017, there are 1,156 class 4 gambling venues, 15,490 non-casino
gaming machines1.
The graph at Figure 1 below shows that the number of class 4 venues and gaming machines
has been steadily decreasing over the past 10 years.
NZ Wide Number of Class 4 Venues and Gaming
Machines
25000 2000
Number of Machines
Number of Venues
20000
1500
15000
1000
10000
500
5000
0 0
2008 2009 2010 2011 2012 2013 2014 2015 2016 2017 2018
Axis Title
number of gaming machines number of venues
Figure 1: NZ wide number of class 4 venues and gaming machines over time
Tauranga
As at July 2018, there were 515 gaming machines in Tauranga, and 36 class 4 venues. As
at July 2018, the maximum number of gaming machines approved to operate in the City is
5412. This equates to 1 machine per 248 residents, or 4 per 1,000 people. Based on gaming
machines as at 30 June 2016 and population at the last census (2013), there were an
average of 4.2 gaming machines per 1,000 people in the BOP3.
Council’s current policy, at 1 machine per 220 resident population, permits up to 611
machines to operate.
1
Department of Internal Affairs website, https://www.dia.govt.nz/Resource-material-Information-We-Provide-Gaming-Statistics
2
This includes 9 machines for a venue which has closed within the past 6 months, and may be re-licenced within 6 months of its closure
without Council approval
3
Department of Internal Affairs (2017): Class 4 Gambling Report, http://www.gamblinglaw.co.nz/download/Gambits/DIA-Class-4-Sector-
Report-2017.pdf
2[Document title]
The number of class 4 venues and gaming machines operated in Tauranga City have also
been declining steadily over the last 10 years 4. This is shown at Figure 2 below.
Class 4 Gaming Machine venues and gaming
machines operating in Tauranga City
620 44
Number of gaming machines operating
600
Number of venues
42
580
560 40
540
520 38
500
36
480
460 34
2008 2009 2010 2011 2012 2013 2014 2015 2016 2017 2018
Axis Title
number of venues number of gaming machines operating
Figure 2: Tauranga City gaming machine venues and machine numbers
As Council’s current policy allows more machines to operate than are currently approved, it
appears that it is not the numbers cap that is causing the decline, but other aspects of the
policy or other external factors.
Other aspects of the policy that restrict the number of machines include the location they can
operate, the need for a liquor licence, and the need for the primary activity not to be
gambling or family/children’s activities.
3.2 Number of Standalone TAB Venues
National
There are over 700 TAB stores across NZ, including both dedicated TAB stores and those
within pubs and clubs5.
As at July 2017, there were 78 standalone TAB Board venues, of which 43 host NZ Racing
Board gaming machines6,7. Two new venues were opened during the 2016/17 year
(Mangere Bridge and Lower Hutt), and one was closed (Te Awamutu).
These were located in the following cities/towns:
4
Department of Internal Affairs website, https://www.dia.govt.nz/diawebsite.nsf/wpg_URL/Resource-material-Information-We-Provide-
Summary-of-Venues-and-Numbers-by-Territorial-AuthorityDistrict
5
NZ Racing Board website, https://nzracingboard.co.nz/about-nzrb
6
NZ Racing Board (2017): TAB Board Venues with Class 4 Gaming, https://nzracingboard.co.nz/sites/default/files/NZRB%20Gaming%20Venues.pdf
7
NZ Racing Board (2017): Annual Report, https://nzracingboard.co.nz/sites/default/files/documents/NZRB_Annual_Report_2017.pdf
3[Document title]
Location Number of standalone TAB Approx. % of total
Board Venues with gaming
machines
Auckland 14 33
Tauranga 5 12
Lower Hutt 4 9
Wellington 4 9
New Plymouth 2 5
Palmerston North 2 5
Dunedin 2 5
Hamilton 1 2
Cambridge 1 2
Gisborne 1 2
Taupo 1 2
Napier 1 2
Hastings 1 2
Wanganui 1 2
Upper Hutt 1 2
Christchurch 1 2
Invercargill 1 2
Total 43
Tauranga
There are currently 5 standalone TAB venues in Tauranga, located in Bethlehem, Cameron
Road, Greerton, Mount Maunganui and Papamoa. All these venues host gaming machines,
as well as providing a venue for racing and sports betting.
No new standalone TAB venues have opened since March 2016.
3.3 Gambling Expenditure
National
Expenditure means the gross amount wagered by gamblers, less the amount paid out 8 or
credited as prizes or dividends. In other words, "expenditure" is the amount lost or spent by
players, as well as the gross profit of the gambling operators.
Four main Types of Gambling
Gamblers in New Zealand spent $2,334 million dollars on the four main forms of gambling in
the 2016/17 financial year, $125 million (5.7 per cent) more than the previous year 9. This
information is shown on the graphs at Figures 3 and 4 below.
8 Gaming machines must return a certain percentage back to the player over time. This is known as theoretical Return to Player (RTP) and is measured against turnover.
There is an upper limit of 92%, although some games are set to return slightly lower. Note that this is highly variable in the short term but represents an average across the
life of the gaming machine. On average, for every dollar gambled, the patron can expect to win back $0.92 if the RTP is set to 92%.
9
Department of Internal Affairs Website, https://www.dia.govt.nz/press.nsf/d77da9b523f12931cc256ac5000d19b6/
4f9778fc3a2fed9dcc25823a00002b04!OpenDocument
4[Document title]
2,500
Total actual gambling expenditure
2,000
Casinos
1,500
$ million
Gaming machines
(outside casinos)
1,000 NZ Lotteries
Commission
500 NZ Racing Board (TAB)
-
2009/10 2010/11 2011/12 2012/13 2013/14 2014/15 2015/16 2016/17
Figure 3: Total actual gambling expenditure by type of gambling
Actual gambling expenditure by type
1,000
800
$ million
600
400
200
-
2009/10 2010/11 2011/12 2012/13 2013/14 2014/15 2015/16 2016/17
NZ Racing Board (TAB) NZ Lotteries Commission
Gambing Machines (outside casinos) Casinos
Figure 4: Actual gambling expenditure by type of gambling
Adjusting for the effects of both inflation and changes to New Zealand’s population (18 years
and older), gambling expenditure increased by 1.1 per cent, from an average of $629 per
person in 2016, to $635 per person in 2016/17. This comprises $237 from gaming machines,
$151 from lottery products, $92 from NZ Racing Board products, and $156 from casinos.
This information is shown in Figures 5 and 6 below.
5[Document title]
Total per capita inflation adjusted gambling expenditure
$700
Casinos
$600
$500
Gaming
$400 machines
$ NZD
(outside casinos)
$300 NZ Lotteries
Commission
$200
NZ Racing Board
$100 (TAB)
$-
2009/10 2010/11 2011/12 2012/13 2013/14 2014/15 2015/16 2016/17
Figure 5: Per capita inflation adjusted gambling expenditure by type of gambling
$350 Inflation adjusted gambling expenditure per capita by type of gambling
NZ Racing
$300 Board (TAB)
$250
NZ Lotteries
$200 Commission
$ NZD
$150
Gaming
$100 machines
(outside
$50 casinos)
Casinos
$-
2009/10 2010/11 2011/12 2012/13 2013/14 2014/15 2015/16 2016/17
Figure 6: Per capita inflation adjusted gambling expenditure by type of gambling
Non-Casino Gaming Machines
New Zealand has 15,490 non-casino gaming machines. On average, each machine
takes $55,655 per year10.
The expenditure on non-casino gaming machines increased 3.1 per cent from $843 million in
2015/16 to $870 million in 2016/17.
Nationally, there has been a downward trend of gaming machine spend since 2004, but this
has increased since 2014 to 2016, despite the reducing venue numbers. The Department of
10
Health Promotion Agency website, https://www.hpa.org.nz/what-we-do/minimising-gambling-harm
6[Document title]
Internal Affairs confirms that the actual (i.e. not adjusted for inflation or population changes)
annual increase in class 4 gambling expenditure since 2014 is now a trend. The increase
may be due, in part, to gaming machine technology and game changes in the sector since
2014.
After adjusting for both inflation and changes in the adult population, however, expenditure
on gaming machines decreased slightly from an average of $240 per person in 2016 to $237
per person in 2016/17. This coincides with declining numbers of venues and machines.
The most recent expenditure figures available for class 4 gambling show gaming machine
expenditure in pubs and clubs for the fourth quarter of 2017 was up $5.2 million or 2.3 per
cent to $228.8 million compared with $223.6 million in December 2016. Expenditure in the
12 months ended 31 December 2017 rose $25.2 million or 2.9 per cent to $883.4 million, up
from $858.2 million for the 12 months ending December 2016.
TAB Racing and Sports Betting – NZ Racing Board
The take from TAB racing and sports betting decreased 1.3 per cent from $342 million in
2015/16 to $338 million in 2016/17. The NZ Racing Board noted in their annual reports that
betting turnover fell due to fewer VIP customers betting into Australian hosted pools and a
lack of major international sporting events, apart from the Lions’ tour. After adjusting for both
inflation and changes in the adult population, expenditure on TAB racing and sports betting
decreased from an average of $97 per person in 2016 to $92 per person in 2016/17.
NZ Lotteries
The take from NZ Lotteries’ product sales increased 26.8 per cent from $437 million in
2015/16 to $555 million in 2016/17 due to changes to Lotto games which delivered more
winners and bigger Powerball prizes. After adjusting for both inflation and changes in the
adult population, expenditure on NZ Lotteries’ products increased from an average of $124
per person in 2015/16 to $151 per person in 2016/17.
Casinos
The take from the country’s six casinos decreased 2.4 per cent from $586 million in 2015/16
to $572 million in 2016/17 returning expenditure to pre-2015/16 trends. SkyCity, with four of
New Zealand’s six casinos, said reduced international business turnover affected gambling
revenue. After adjusting for both inflation and changes in the adult population, expenditure at
casinos decreased from an average of $167 per person in 2015/16 to $156 per person in
2016/17.
Tauranga
Non-Casino Gaming Machines
Department of Internal Affairs statistics shows that the total expenditure in Tauranga City on
gaming machines was $34,324,471 in 2017, an increase of $1,694,883 from 2016, or nearly
a 5% increase. This is shown in the graph at Figure 7 below.
Compared to other cities in New Zealand, this is the 4th highest expenditure.
7[Document title]
Total Expenditure Gaming Machines - Tauranga
City
40000000
35000000
30000000
$
25000000
20000000
15000000
10000000
5000000
0
2008 20009 2010 2011 2012 2013 2014 2015 2016 2017
Year
Figure 7: Total gaming machine expenditure in Tauranga.
TAB Racing and Sports Betting, Casinos and NZ Lotteries
There is no specific data available that identifies the expenditure within Tauranga on sports
and racing betting, casinos and NZ Lotteries.
4. Social Benefits of Gambling
Gambling can benefit New Zealand as a whole and local communities by way of providing a
form of entertainment, by providing employment opportunities, and through funding for
national sports and community organisations.
4.1 Entertainment
Gambling, (including on gaming machines and at TABs) is often a harmless entertainment
activity from which people derive personal enjoyment and positive social effects. Research
has found that socialising, enjoyment, and fun are directly related to communal activities
such as housie and community raffles. Based on these findings, there is a clear view that
people genuinely enjoy participating in gambling activities, and there are benefits of being
able to socialise with others, particularly whānau members11.
Gambling is a popular form of entertainment that most New Zealanders participate in. The
2014 National Gambling Study12 found that 77% of adult New Zealanders (about 2,542,000
people) had participated in some form of gambling in the previous 12 months.
11
KPMG and Ministry of Health (2013): Gambling Resource for Local Government. Wellington: Ministry of Health,
http://www.gamblinglaw.co.nz/download/Research/gambling_resource_for_local_government_081113.pdf
12
Abbott, M., Bellringer, M., Garrett, N., & Mundy-McPherson, S. (2016): New Zealand National Gambling Study: Wave 3 (2014). Report
number 5. Auckland: Auckland University of Technology, Gambling and Addictions Research Centr e,
https://www.health.govt.nz/publication/new-zealand-national-gambling-study-wave-3-2014
8[Document title]
4.2 Employment
The existence of class 4 gaming and sports and racing betting means that employment
opportunities exist for the corporates societies administering the gaming machines, venues
operating them, and the servicing industries.
A survey undertaken in 2009 estimated that there were 300 full-time equivalents (FTEs)
directly employed by class 4 non-club corporate societies and 215 employees of external
service providers and contractors also working for the corporate societies13.
The 2017 NZ Racing Board Annual Report14 noted that NZ Racing Board directly employs
around 835 personnel.
However, it can be argued that employment in the gambling industry, and economic activity
as a result of gambling, takes employment and spending from the other sectors of the
economy rather than providing significant benefits15.
4.3 Funding
Racing Industry and NZ Racing Codes
A minimum of 80% of the net proceeds from NZ Racing Board’s gaming machines, plus NZ
Racing Board’s surplus after operating costs, expenses and gaming machine distributions, is
available for distribution to benefit the racing industry, plus the three NZ racing codes, being
New Zealand Thoroughbred Racing, Harness Racing New Zealand and Greyhound Racing
New Zealand.
In 2016/17, distribution to racing codes from sports betting was $137.6 million, up 2.3 million
on the previous year16.
Racing Tauranga received $2.4 Million in 2016/17 through this mechanism.
National Sports Organisations Grants
The NZ Racing Board also makes a contribution to the development of sports in New
Zealand through the commission they pay to national sporting organisations (NSOs) for
sports on which they take bets. In the 2016/2017 year, this was $9.3 million, paid to 34
NSOs, an increase of 16.1% on 2016.
Basketball, football, rugby union, tennis, rugby league, cricket, baseball, American football,
darts and netball received the most income from sports betting in 2015/16. Their combined
income was 95 per cent of the total income paid to NSOs from sports betting.
13
KPMG and Ministry of Health (2013): Gambling Resource for Local Government. Wellington: Ministry of Health,
http://www.gamblinglaw.co.nz/download/Research/gambling_resource_for_local_government_081113.pdf
14
NZ Racing Board (2017): Annual Report, https://nzracingboard.co.nz/sites/default/files/documents/NZRB_Annual_Report_2017.pdf
15
KPMG and Ministry of Health (2013): Gambling Resource for Local Government. Wellington: Ministry of Health,
http://www.gamblinglaw.co.nz/download/Research/gambling_resource_for_local_government_081113.pdf
16
NZ Racing Board (2017): Annual Report, https://nzracingboard.co.nz/sites/default/files/documents/NZRB_Annual_Report_2017.pdf
9[Document title]
Community Organisations Nationally
The proceeds from non-commercial gambling provide significant funding for a variety of
community purposes. If well directed, these funds can enhance empowerment, participation
and the quality of life across all types of the communities.
Gaming machines and Sports and Race Betting
The gaming industry puts money back into the community by way of grants administered
through various trusts and the NZ Racing Board, that operate gaming machines at the
gaming venues. These grants provide financial support to many clubs and organisations
that find it increasingly difficult to obtain sponsorship and other revenue streams 17.
All corporate societies and the NZ Racing Board licensed to operate class 4 gambling must
apply or distribute their net proceeds to authorised purposes. Under the Gambling Act 2003,
authorised purposes mean:
Charitable purposes;
Non-commercial purposes beneficial to the whole or a section of the community; and
Promoting, controlling, and conducting race meetings under the Racing Act 2003,
including the payment of stakes.
From 4 September 2014, corporate societies had to increase the rate of return of gross
proceeds from class 4 gaming to community grants from 37.12 per cent to 42 per cent over
five years.
Up to 20% of the net proceeds from the NZ Racing Board’s gaming operation are distributed
to communities across NZ through amateur sporting organisations. In 2016/17 this was
distributed to 434 community sporting groups, and comprised 3.2 million, up by 6% on the
previous year18.
In New Zealand, money from gaming machines returned to the community varies each year,
and in 2017 totalled approximately $333 million, up an estimated 1.5% on 2016. The
percentage of the expenditure that was returned to the community in 2017 was 43.5%, down
slightly from 44% the year before. The graph at Figure 8 shows the rate of return and overall
amount of return to the community continues to increase each year and is now the highest
since 2012.
17
True, J. and Cheer, M. (2018): Gaming Machine Gambling Statistics and Research Paper – Information for Territorial Authorities,
http://www.gamblinglaw.co.nz/download/Research/TAInfo.pdf
18
NZ Racing Board (2017): Annual Report, https://nzracingboard.co.nz/sites/default/files/documents/NZRB_Annual_Report_2017.pdf
10[Document title]
Return to Community: Total
Return to Community ($M)
$340 44.2%
$335 44.0%
$330
Rate of Return
43.8%
$325 43.6%
$320
43.4%
$315
43.2%
$310
$305 43.0%
$300 42.8%
$295 42.6%
$290 42.4%
2012 2013 2014 2015 2016 2017
Estimated Return ($M) Rate of Return
Figure 8: Amount and percentage of funds from gaming machines returned to the community
The bulk of venues are licensed by corporate societies who distribute funds through grants
to the community. Clubs, such as the Returned Services Association, and sports clubs use
the proceeds from their machines for the benefit of their membership. Sporting organisations
receive a high proportion of allocated grants. The diagram at Figure 9 shows the distribution
of grants by major recipient type between 2004 and 2012.
Figure 9: Major Recipients of Gaming Machine Proceeds Grants in NZ 2004 – 2012
11[Document title]
Funding from gaming machines is crucial for a very large number of community groups and
clubs. However, whilst community organisations and clubs are benefited, some of the money
comes from problem gamblers (the percentage is unknown) and, because gaming machines
are often concentrated in deprived areas19, it means that those who can least afford it, pay
the most to fund the nation's community organisations and sporting activities.
In 2016/17, the New Zealand Racing Board allocated $147 million, mostly to support racing
club activities and infrastructure – NB this figure includes funding from both gaming
machines and sports and race betting proceeds, so is already partly included in the $333
million noted previously.
Community Organisations and Clubs in Tauranga City
The Problem Gambling Foundation has been collecting data on gaming machine grants over
the past several years.
For the period 2017/2018, the Foundation identified approximately $8 million was returned to
the community through community organisation grants. This comprised 834 individual
grants.
Sports groups/clubs received the most grants – 52% of the total, with Community Service
and Community Groups receiving 28% and 20% respectively.
Pub Charity Limited and NZ Community Trust are the biggest contributors in Tauranga, both
paying out over $2.1 million in grants in the 2017/18 financial year. They are closely followed
by the Lion Foundation (2008), who paid out over $1.6 million in 2017/18.
The total expenditure on gaming machines in Tauranga was approximately $34 million, and
community funding was approximately $8 million, equalling approximately 23% of the total
spend. This is well below the national average rate of return of 43%, indicating that
Tauranga’s community organisations may not be benefitting as much as they could be from
the expenditure on gaming machines within Tauranga. It should be noted however that there
are a number of reasons that could lead to this discrepancy, including the number of grant
applications made from the communities, the size of those applications, and the fact that this
data is only capturing grants specifically allocated to Tauranga, which excludes grants that
may benefit the Tauranga community, but are allocated to a regional or national
organisations e.g. BOP Hockey, Surf Lifesaving NZ or Cancer Society NZ.
For Tauranga, it is estimated that a high proportion of community sports organisations rely
on gaming machine grants, with up to 75% of their day to day operating costs being funded
through grants20.
19
In 2014, 54.2 percent of gaming machines were located in census area units with average deprivation deciles of 8 and higher. Source
“Informing the 2015 Gambling Harm Needs Assessment” Ministry of Health July 2015.
20
Pers comms Megan Cleverly, TCC Team Leader: Sport and Recreation
12[Document title]
5. Social Costs of Gambling
5.1 Gambling Harm
Most people do not experience problems resulting from their gambling. Gambling can be a
harmless entertainment activity from which people derive personal enjoyment and that can
provide other positive social effects.
However, for the minority that do develop a problem, the impacts can be far reaching and
are not exclusive to the problem gamblers themselves. Every person with a gambling
problem affects between five and ten other people21. A 2017 Ministry of Health (MoH)
study22 on the burden of gambling harm concluded that the largest proportion of the total
harm resulting from gambling in New Zealand is associated with people who are not
necessarily problem gamblers themselves.
The 2017 MoH study found that the most common types of harm caused by gambling in
New Zealand include:
Personal impacts – elevated physical and mental health problems
Financial impacts - Adjusting for the effects of both inflation and changes to New
Zealand’s population (18 years and older), gambling loss on all forms of gambling
increased by 1.1 per cent, from an average of $629 per person in 2016, to $635 per
person in 2016/17. Losses on gaming machines and NZ Racing Board products
makes up 52% of this total23
Inter personal impacts – including relationship breakups and personal neglect
Parenting impacts – people who report having a parent with gambling problems are
also significantly more likely to experience gambling problems themselves
Works and study impacts – including lost time at work or study
Criminal and legal impacts – problem gambling has been linked to criminal activity
The study identified that harm from gambling affects low-risk, moderate-risk and problem
gamblers, with problem gamblers experiencing about half the quality of life compared to
ideal health and wellbeing, which is about the same as a person with severe alcohol
problems. The study concluded that annually, gambling problems generate significantly
more ongoing harm than other key health conditions such as osteoarthritis, diabetes, and
drug use disorders. It concluded that the focus should be on minimising gambling-related
harm across the entire spectrum of problematic gambling behaviour, rather than focussing
on reducing the incidence of problem gambling.
21
Problem Gambling Foundation of New Zealand, February 2014: All Factsheets, Gambling in New Zealand. Problem Gambling Foundation
of New Zealand, https://www.pgf.nz/fact-sheets.html
22
Browne, M., Bellringer, M., Greer, N., Kolandai-Matchett, K., Rawat, V., Langham, E., Rockloff, M., Palmer Du Preez, K., Abbott, M. (2017):
Measuring the Burden of Gambling Harm in New Zealand, Central Queensland University of Auckland University of Technology,
https://www.health.govt.nz/publication/measuring-burden-gambling-harm-new-zealand
23
Department of Internal Affairs Website,
https://www.dia.govt.nz/press.nsf/d77da9b523f12931cc256ac5000d19b6/4f9778fc3a2fed9dcc25823a00002b04!OpenDocument
13[Document title]
5.2 Problem Gambling Risk Factors
Problem gamblers are defined in the Gambling Act 2003 as “a person whose gambling
causes harm or may cause harm”.
The key risk factors associated with problem gambling, though not necessarily causally
linked, include location and/or density of gambling venues and gaming machines, ethnicity,
and socioeconomic deprivation24.
Other risk factors include having few educational qualifications, being unemployed, being
male, and being a young adult/teen25, 26.
24
KPMG and Ministry of Health (2013): Gambling Resource for Local Government. Wellington: Ministry of Health,
http://www.gamblinglaw.co.nz/download/Research/gambling_resource_for_local_government_081113.pdf
25
Max Abbott Gambling and Addictions Research Centre, Auckland University of Technology (2016): The epidemiology of gambling and
gambling harm in New Zealand, https://www.matuaraki.org.nz/uploads/files/resource-assets/the-epidemiology-of-gambling-and-
gambling-harm-in-new-zealand.pdf
26
Problem Gambling Foundation NZ: Fact Sheet – Gambling in NZ, https://www.pgf.nz/fact-sheet---gambling-in-new-zealand.html
14[Document title]
Location and/or density of gambling venues and gaming machines
Research by the MoH in 200827 found that gambling behaviour was strongly associated with
the distance to the nearest gambling venue, and concluded that establishing a venue in a
neighbourhood could possibly have a negative impact on the people living in that
neighbourhood. These findings suggest that policies aimed at preventing and minimising
gambling-related harm could focus on environmental modifications, such as reducing the
geographic dispersal of gambling venues and minimising the number of gambling venues in
neighbourhoods, particularly in vulnerable communities.
There is conflicting evidence and opinion regarding the links between the prevalence of
problem gambling and the number of gaming machines. Some research suggests that there
is a direct link between the number of machines and problem gambling prevalence, stating
that there is an average increase of 0.8 problem gamblers with each new gaming machine 28.
Other information available, however, states that research suggests that problem gambling
prevalence rate over time bears limited correlation to the number of gaming machines
operating in New Zealand29. Between 1991 and 1999 the problem gambling rate declined
considerably despite gaming machine numbers doubling and gaming machine expenditure
trebling. Between 2006 and 2010 the problem rate increased, despite the number of gaming
machines in New Zealand falling considerably in the same period. Between 2010 and 2012
the problem gambling rate stayed the same, despite a continual decline in gaming machine
numbers.
Ethnicity
Findings from the NZ Health and Lifestyles Survey 201230 shows that Maori are significantly
more likely to participate in certain types of gambling (including gaming machine in pubs and
clubs) than non-Maori. Maori and Pacific people are also more likely to be at risk of
becoming problem gamblers. Pacific people participate in class 4 gambling less than any
other group, but are more likely to be at risk of becoming problem gamblers.
Recently published MoH and Health Promotion Agency data shows Māori, Pacific and Asian
gamblers are disproportionately affected by gambling harm:
1 in 7 Māori and Pacific people and 1 in 9 Asian people who have gambled in the past
year are likely to be experiencing a level of harm
By comparison, 1 in 22 NZ European/Pakeha people who have gambled in the last year
are likely to be experiencing a level of harm.
This is illustrated by the graph at Figure 12.
27
Ministry of Health (2008): Raising the Odds? Gambling behaviour and neighbourhood access to gambling venues in New Zealand,
https://www.health.govt.nz/publication/raising-odds-gambling-behaviour-and-neighbourhood-access-gambling-venues-new-zealand
28
KPMG and Ministry of Health (2013): Gambling Resource for Local Government. Wellington: Ministry of Health,
http://www.gamblinglaw.co.nz/download/Research/gambling_resource_for_local_government_081113.pdf
29 True, J. and Cheer, M. (2018): Gaming Machine Gambling Statistics and Research Paper – Information for Territorial Authorities,
http://www.gamblinglaw.co.nz/download/Research/TAInfo.pdf
30 Tu, D (2013): New Zealanders’ Participation in Gambling: Results from the 2012 Health and
Lifestyles Survey. Wellington: Health Promotion Agency, https://www.hpa.org.nz/sites/default/files/NZers_participation_in_gambling.pdf
15[Document title]
* Other includes NZ European and ethnic groups not otherwise specified.
Figure 12: Graph showing the number of clients receiving assistance from problem gambling
agencies by ethnicity31
Socioeconomic Status
People living in high deprivation communities are more likely to participate in gambling and
are more at risk of being a problem gambler.
A MoH study entitled ‘Problem Gambling Geography of New Zealand 2005’, shows that
gambling venues are more likely to be located in more socioeconomically deprived areas
with 53% of all non-casino gambling machines located in deciles 8–10 in both March 2003
and June 2005.
The study notes that if non casino gambling machines were distributed evenly with
population throughout New Zealand only 30% would be in deciles 8–10. Over five times as
many non-casino gambling machines are in the two most deprived deciles (deciles 9 and 10)
than in the two least deprived deciles (deciles 1 and 2). This distribution has not changed
considerably since 2003.
TABs are also more likely to be in areas of higher deprivation with about half of all TABs in
the three most deprived deciles (deciles 8–10). The distribution of TABs, in relation to socio-
economic deprivation, is very similar to that of non-casino gaming machines, according to
the MoH study.
31
Ministry of Health website, https://www.health.govt.nz/our-work/mental-health-and-addictions/gambling/service-user-
data/intervention-client-data
16[Document title]
Measures of Gambling Harm
NZ National Gambling Study
New Zealand has a very low problem gambling rate by international standards. The New
Zealand National Gambling Study: Wave 3 (2014)32 found that in 2014, 0.3% of NZ adults
were problem gamblers experiencing significant gambling-related harm; 1.5% were
moderate-risk gamblers facing some harm and at risk of developing more serious problems;
and 5% were estimated as low-risk, mostly experiencing a few gambling-related
problems33.The problem gambling rate is for all forms of gambling, not just gaming machine
gambling.
Problem Gambling Intervention Service Data
The graph at Figure 10 shows, nationwide, individuals that have received problem gambling
treatment services support for their own, or someone else’s gambling in the period 34. The
national total in 2016/17 was 11,609. The graph shows a decrease in problem gambling
since the peak of 2009/10, with current numbers the lowest since 2014/15.
NZ - Numbers of individuals receiving problem gambling
treatment services for thier own or someone else's gambling
14000
12000
10000
8000
6000
4000
2000
0
2007/08 2008/09 2009/10 2010/11 2011/12 2012/13 2013/14 2014/15 2015/16 2016/17
class 4 gambling NZ Racing Board gambling total gambling
32
Abbott, M., Bellringer, M., Garrett, N., & Mundy-McPherson, S. (2016). New Zealand National Gambling Study: Wave 3 (2014). Report
Number 5. Auckland: Auckland University of Technology, Gambling and Addictions Research Centre,
https://www.health.govt.nz/publication/new-zealand-national-gambling-study-wave-3-2014
33
ibid
34
Ministry of Health website, https://www.health.govt.nz/our-work/mental-health-and-addictions/gambling/service-user-
data/intervention-client-data#territorial
17[Document title]
Figure 10: Number of individuals nationwide receiving problem gambling treatment services
for their own or someone else’s gambling.
In 2017 approximately 50% of problem gambling clients in New Zealand cited gaming
machines as the primary reasons for the problem, and approximately 9% cited NZ Racing
Board products as the primary reason.
In Tauranga, the number of reported problem gamblers for all modes of gambling was 241
in 2016/17. Compared to other cities in New Zealand, considering Tauranga is NZ’s 5 th
largest city, it has a relatively low number of problem gamblers, as indicated by the data at
Table 1. The number of problem gamblers declined from 2009/10 to 2012/13, but has
climbed again since then. This is shown at Figure 11 below.
Table 1: Number of problem gamblers in cities across New Zealand
City Number of Problem Gambler % of total number of
Clients Assisted 2016/17 problem gambler clients
assisted
Auckland City Council 5349 46.08%
Christchurch City Council 1207 10.40%
Hastings District Council 467 4.02%
Whangarei District Council 374 3.22%
Porirua District Council 372 3.20%
Napier City Council 298 2.57%
Hamilton City Council 296 2.55%
Tauranga City Council 241 2.08%
Rotorua District Council 231 1.99%
Invercargill City Council 217 1.87%
Tauranga City Problem Gambling Clients
all modes of gambling
300
Number of Presentations
250
200
150
100
50
0
Figure 11: Number of problem gamblers presenting in Tauranga for all forms of gambling.
18[Document title]
5.3 Problem Gambling in Tauranga
Figure 11 above shows that the number of reported problem gamblers for all modes of
gambling declined from 2009/10 to 2012/13, but has climbed again since then, though
reduced again in the 2015/16 year. It is now lower than the peak of 2009/10.
The reasons for an increase or decrease in problem gambling are complex and multi-
faceted, not simply the direct by-product of an increase or decrease in machine numbers.
Compared to other cities in NZ, the number of problem gamblers is relatively low.
Determining Tauranga’s Gambling Risk Profile
A useful tool to assist Council in understanding the level of risk of harm to the community
from gambling in Tauranga, is to determine the City’s gambling risk profile. This provides a
reference against other cities in NZ, and helps Council decide on appropriate policy to
address the potential harm.
The MoH35 have developed a methodology to quantitatively calculate a gambling risk profile,
by considering five known categories of risk, namely:
Gambling prevalence rate;
gambling density;
ethnic make-up of City;
community deprivation; and
gambling harm minimization service availability.
The outcome is an identified risk of harm from gambling for the City being low, medium or
high.
Problem Gambling Prevalence Rate
It is calculated by dividing the number of problem gambling intervention clients by the
national rate of help seeking, which is 9.3%, and then dividing that by the district population.
The total number of people in Tauranga City seeking help in the 2016/17 year was 24136.
The prevalence rate is (241/0.093)/136,400 = 0.02%.
Based on the MOH guidelines, this rate indicates that Tauranga is at a low risk of gambling
related harm.
Gambling Density
Gambling density comprises of two components:
Number of gaming machines per person; and
Expenditure per person.
35 KPMG and Ministry of Health (2013): Gambling Resource for Local Government. Wellington: Ministry of Health,
http://www.gamblinglaw.co.nz/download/Research/gambling_resource_for_local_government_081113.pdf
36 Ministry of Health website, http://www.health.govt.nz/our-work/mental-health-and-addictions/problem-gambling/service-user-
data/intervention-client-data
19[Document title]
Number of gaming machines
As at July 2018, there were 515 machines operating in the City.
Tauranga class 4 venues currently have the capacity to provide 541 machines, which
equates to 1 machine every 248 residents, or 40 machines per 10,000 people.
Having less than 75 machines per 10,000 people is considered to be low risk.
Expenditure per person
The Department of Internal Affairs monitors every gaming machine electronically. Therefore,
expenditure data on gaming machines is available in New Zealand down to suburb level.
Tauranga has the fourth highest expenditure on gaming machines in the country, despite
having the 6th highest population. Total expenditure for New Zealand in 2017 was $883
million.
Table 2: Gambling machine proceeds (GMP) by district (2017)37
Territorial Authority GMP % of total
Auckland City $274,969,220.12 31.13%
Christchurch City $75,615,892.49 8.56%
Wellington City $39,527,348.88 4.47%
Tauranga City 34,324,720.15 3.89%
Lower Hutt City $27,343,448.65 3.1%
Hamilton City $24,201,369.33 2.74%
Rotorua District $22,273,010.85 2.52%
Napier City $18,682,241.05 2.11%
Palmerston North City $18,348,467.94 2.08%
Hastings District $17,803,078.65 2.02%
Using the population estimate for Tauranga in 2018 from Tauranga City Population and
Household Review 2017 (Growth Allocation 2013-2063) of 134,600, this expenditure equals
$255 per person, per annum in Tauranga.
Based on the MOH guidelines, this is a low risk rating.
37
Ministry of Health (2018), https://www.dia.govt.nz/diawebsite.nsf/Files/Gambling-Statistics-May-2018/$file/Quarterly-GMP-Summary-
March-2018.pdf
20[Document title]
Ethnicity
It is well documented that certain parts of the population can be at more risk of gambling
harm than others (in particular Māori and Pacific Islanders). The table below shows that
Tauranga has a lower proportion of Pacific Islanders compared to New Zealand as a whole,
however, it has a higher proportion of Maori.
Based on these statistics, the risk for Maori is considered medium, and risk for Pacific
Islanders is low.
The MoH data does not include the Asian population within the risk profile. However, the
Problem Gambling Foundation of NZ identified38 that problem gambling has become a major
public health issue for Asian people in NZ. Asians made up 7.9% of problem gambling
service clients in 2014/15. On this basis, it is considered that the risk profile for the ethnic
category of risk should be higher than that recommended by MoH.
Table 3: Population profile39,40,41,42
Demographic Tauranga - 2013 Tauranga – 2018 New Zealand -
Group census projected medium 2018 projected
growth scenario
Population 119,800 129,200 4,800,000
Median Age 41 40.5 37
(years)
European 83.5% 82% 72%
Māori 17.1% 19% 16%
Pacific Islanders 2.4% 3% 8%
Asian 5.6% 8% 15%
Community Deprivation
Highly deprived communities are more likely to experience gambling harm.
TCC’s Gambling Venues Policy currently restricts gambling venues to commercial and
industrial areas. It should be noted that commercial and industrial areas, particularly central
business districts (CBDs) usually score highly on the deprivation index due to variables such
as people being more likely to rent and less likely to own a car. The policy does not restrict
gambling venues based on the deprivation index of the community.
38
Problem Gambling Foundation, Fact Sheet 10 (2013), https://www.pgf.nz/uploads/7/1/9/2/71924231/fs10-asians_and_gambling.pdf
39 Stats NZ website,
http://archive.stats.govt.nz/browse_for_stats/population/estimates_and_projections/SubnationalEthnicPopulationProjections_HOTP2013
base.aspx
40 Stats NZ website,
http://archive.stats.govt.nz/browse_for_stats/population/estimates_and_projections/SubnationalPopulationProjections_HOTP2013base-
2043.aspx
41 Stats NZ website,
http://archive.stats.govt.nz/browse_for_stats/population/estimates_and_projections/NationalEthnicPopulationProjections_HOTP2013-
2038.aspx
42 Stats NZ website,
http://archive.stats.govt.nz/browse_for_stats/population/estimates_and_projections/NationalPopulationProjections_HOTP2016.aspx
21[Document title]
In 2016, Tauranga had 13 census area units described as most deprived, 16 described as
moderately deprived, and 6 least deprived43. This equates to percentages of 37%, 46% and
17% respectively.
Tauranga has 14 gambling venues (40% of the total number in Tauranga) based in deciles 8
to 10 or ‘most deprived’ areas44. The areas with highest deprivation levels are Arataki (2
venues), Gate Pa (1 venue), Greerton (3 venues), Poike (1 venue), Judea (2 venues),
Sulphur Point (1 venue), Tauranga Hospital (2 venues) and Tauranga South (2 venues).
18 venues (51% of total number) are based in areas with moderate levels of deprivation.
Three venues (9% of total number) are in low deprivation areas.
Based on the locations of gambling venues within the City, it is considered the spread of
venues across areas in Tauranga results in a fairly high risk rating.
Please refer to Appendix A for a full breakdown of venues and where they are located in
regards to the deprived communities in in Tauranga.
Gambling Harm Minimisation Services Availability
To address the potential ‘harms’ of gambling, there is a range of problem gambling service
providers across New Zealand, some of which specifically target ethnic groups most at risk
from harm (Māori, Pacific Island and Asian).
The development and implementation of problem gambling intervention services in New
Zealand are funded from the problem gambling levy, which is collected from gambling
proceeds by the Inland Revenue Department. The MoH is charged with funding and
coordinating intervention services, which are then delivered by a range of service providers
by contractual agreement.
The MOH currently contracts two providers to deliver free face to face gambling harm
minimisation services in Tauranga:
The Salvation Army Addiction - Oasis Services: http://www.salvationarmy.org.nz/need-
assistance/addictions/problem-gambling/locations; and
The Problem Gambling Foundation: https://www.pgf.nz/
In addition, the Gambling Helpline is available 24 hours a day, 7 days a week -
https://www.gamblinghelpline.co.nz/Home_452.aspx
The NZ Racing Board has a Harm Prevention and Minimisation Policy and procedures in
place to help minimise the potential harm associated with gambling. They offer self-exclusion
and betting limit programmes to support customers who may wish to restrict their betting
activity, and provide information online and in-store for customers on where they can seek
problem gambling help. During the 2016/17 year the NZ Racing Board’s investment in
responsible gambling measures was $2.2 million, predominantly consisting of levies paid to
the Crown to recover the costs of the MoH’s problem gambling management services45.
43
http://cphronline.massey.ac.nz/dataviews/report?reportId=260&viewId=96&geoReportId=1619&geoId=15&geoSubsetId=
44 University of Otago, Wellington website, http://www.otago.ac.nz/wellington/research/hirp/otago020194.html
45
NZ Racing Board (2017): Annual Report,
https://nzracingboard.co.nz/sites/default/files/documents/NZRB_Annual_Report_2017.pdf
22[Document title]
According to the MoH guidance, where a city has 2 or less local services that deal with
gambling harm, this is a high risk of gambling related harm.
Summary of Gambling Risk Profile
The risk rating is the sum of the risk for all risk factors and is ranked as follows:
8-13 points = low risk
14-19 points = medium risk
20-24 points = high risk
The results of the assessment are summarised in the table below.
Taking into account the risk factors associated with problem gambling in the Asian
community, the assessed risk of Tauranga experiencing gambling related harm is
considered to be medium. This is the same as the assessment made in 2015.
Table 4: Summary of gambling risk for Tauranga
2018 assessment
Factor Unweighted Weighting Total Score
Score
Prevalence Rate (x 1 (low risk) 2 2
2 weighting)
Gambling machine
density
- # machines 1 (low risk) 1 2
per 10,000
- Expenditure
per person
1 (low risk)
District ethnicity
- Maori 2 (medium risk) 1 3
- Pacific 1 (low risk)
Community 3 (high risk) 1 3
deprivation
Availability of 3 (high risk) 1 3
services
Total Points 13
MoH Risk Rating Low/
2018 Medium Risk
MOH guidance recommends that where a district has a high risk profile, Council should
implement a sinking lid policy (meaning no new licenses should be issued from this point
forward). For Council’s with a medium risk means profile, the recommendation is to restrict
locations or restrict locations and number of machines (TCC’s current policy does the latter).
For those cities with a low risk profile, it is recommended not to have any restrictions.
23[Document title]
6. Views on Gambling
6.1 Nationally
Data from the Health Promotion Agency (HPA) published in 2018 presented results from the
2016 Health and Lifestyles Survey46, which received responses from 3,854 people across all
16 regions of New Zealand.
The report noted the following views on gambling:
Just over half of respondents believed some forms of gambling were socially
undesirable. The more gambling activities that respondents had participated in, the less
likely they were to believe some forms of gambling were socially undesirable.
The form of gambling most commonly reported to be socially undesirable was gaming
machines at a pub or club. The next most socially undesirable activities were gaming
machines at a casino and mobile phone games for money.
In 2016, nearly half of respondents believed that raising money through gambling did
more harm than good in the community. However, this belief is becoming less common
over time. In addition, the proportion of respondents who believe it does more good than
harm is also decreasing with time, at the same rate. This contrast can be explained by
an increasing time trend of respondents who think it does equal good and harm or who
don’t know, from 20% in 2006/07 to 30% in 2016. This suggests there is decreasing
awareness of the role of raising money through gambling in the community.
4 in 10 respondents reported that they had some degree of concern with the level of
gambling in the community. Respondents who had some form of university degree,
Māori and Pacific peoples, and those in high deprivation areas were most likely to be
concerned about gambling level in their community. Since 2014, there has been a
decrease in those respondents who were somewhat or very concerned.
6.2 Tauranga City
When Council’s Gambling Venues Policy was last reviewed in 2015/16, the key issues that
community and stakeholders submitted on were:
the number of gaming machines – 13 supported a reduction, 9 supported the status quo,
2 supported an increase, 5 supported a sinking lid.
whether to treat applications for relocations as new applications – 11 supported the
proposal to treat them as new applications, 9 did not support the proposal, 1 supported
reducing the number of machines.
One submitter supported consideration of sensitive areas when granting approvals for
new venues.
One submitter supported restricting approval for new TAB venues.
One submitter supported no advertising signage.
46
Thimasarn-Anwar, T., Squire, H., Trowland, H. & Martin, G. (2017). Gambling report: Results from the 2016 Health and Lifestyles Survey.
Wellington: Health Promotion Agency Research and Evaluation Unit, https://www.hpa.org.nz/sites/default/files/Final-Report_Results-from-
2016-Health-And-Lifestyles-Survey_Gambling-Feb2018.pdf
24[Document title]
6.3 Toi Te Ora – Public Health Service (BoP District Health Board)
At a meeting held with the Toi Te Ora in August 2018, they confirmed their position on
gambling machines, which is:
Gambling is a public health issue as stated in the Gambling Act
2003. Gambling machines (pokies) cause more harm than any other
form of gambling.
Toi Te Ora – Public Health Service supports strategies that minimise
harm from gambling and we recommend that Councils adopt a
sinking lid policy to reduce the number of class 4 gambling machines
in each community.
Toi Te Ora notes that there are two main harm reduction strategies for local government
policy, which are sinking lid and licence cap. They recommend that councils adopt a sinking
lid policy, but note that if a council decides to adopt a licence cap, it should include
provisions regarding proximity of class 4 venues to sensitive land use, such as residential
areas, schools, marae, and community centres.
7. Summary of Findings
The key findings with regard to the social impacts of gambling in Tauranga are:
Gambling statistics
o There has been a steady decrease in the number of class 4 venues and gaming
machines across the City since 2008. This trend matches the national trend.
o There is 1 machine per 248 residents, which is low compared to the national average.
o The number of TAB Board venues has not increased since March 2016.
o There has been a trending increase in expenditure on class 4 gambling in Tauranga
since 2014, which matches the national trend. This does not take into account inflation
or population growth.
o Tauranga’s per capita spend on class 4 gambling is slightly higher than the national
average.
Benefits
o Tauranga community organisations received $8 million from gaming machine proceeds
in 2017,/18 an increase over the 2015/16 numbers. This is in line with national trends
since 2014 of increasing amounts of money returned to the community.
o Funding received by community organisations is critical to their ongoing sustainability.
o The Tauranga community will receive other benefits from gambling through
employment opportunities in the gambling sector.
o Many members of Tauranga community enjoy gambling as a harmless leisure past
time.
Costs
25You can also read